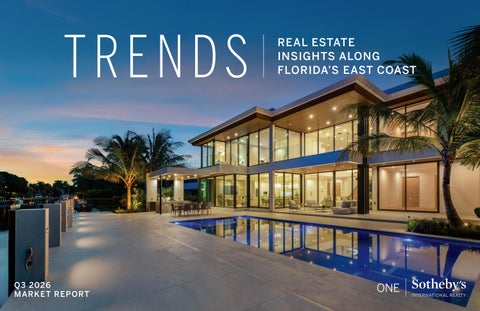
TRENDS
Q3 2026 MARKET REPORT
REAL ESTATE INSIGHTS ALONG FLORIDA’S EAST COAST
1
619 Brickell is where Foster + Partners’ architectural mastery and Nobu’s global hospitality converge, a 75-story waterfront tower with 296 residences, 90,000 SF of amenities, and a $25M longevity center, setting a new benchmark for Miami.
ONE- TO SIX-BEDROOM RESIDENCES, PRICING AVAILABLE UPON REQUEST. 619 Brickell Ave, Miami, FL 33131 @619brickellresidences 619brickell.com
ORAL REPRESENTATIONS CANNOT BE RELIED UPON AS CORRECTLY STATING THE REPRESENTATIONS OF THE DEVELOPER. FOR CORRECT REPRESENTATIONS, MAKE REFERENCE TO THIS BROCHURE AND TO THE DOCUMENTS REQUIRED BY SECTION 718.503, FLORIDA STATUTES, TO BE FURNISHED BY A DEVELOPER TO A BUYER OR LESSEE. 619 Brickell Condominium a/k/a 619 BRICKELL BY NOBU - FOSTER + PARTNERS THE CONDOMINIUM IS NOT OWNED, DEVELOPED, OR SOLD BY NH DOWNTOWN MIAMI LLC, NOBU HOSPITALITY LLC, OR ANY OF THEIR AFFILIATES (COLLECTIVELY, “NOBU”). THE DEVELOPER USES THE NOBU NAME, TRADEMARKS, AND TRADE NAMES UNDER A LIMITED, NONTRANSFERABLE LICENSE FROM NH DOWNTOWN MIAMI LLC, WHICH LICENSE PERMITS THE CONDOMINIUM TO BE KNOWN AS 619 BRICKELL BY NOBU - FOSTER + PARTNERS. NOBU HAS NOT CONFIRMED OR VERIFIED THE ACCURACY OF ANY OF THE STATEMENTS, REPRESENTATIONS, OR INFORMATION CONTAINED HEREIN AND EXPRESSLY DISCLAIMS ANY LIABILITY IN CONNECTION WITH THE SAME. THE INFORMATION PROVIDED, INCLUDING PRICING, IS SOLELY FOR INFORMATIONAL PURPOSES, AND IS SUBJECT TO CHANGE WITHOUT NOTICE. THIS IS NOT AN OFFER TO SELL, OR SOLICITATION OF OFFERS TO BUY, THE CONDOMINIUM UNITS IN JURISDICTIONS WHERE SUCH OFFER OR SOLICITATION CANNOT BE MADE OR ARE OTHERWISE PROHIBITED BY LAW. THIS OFFERING IS MADE ONLY BY THE OFFERING DOCUMENTS FOR THE CONDOMINIUM AND NO STATEMENT SHOULD BE RELIED UPON IF NOT MADE IN THE OFFERING DOCUMENTS. The Developer taking part in the public offering or sale of units in the offering of 619 BRICKELL CONDOMINIUM (the “Condominium”) are not incorporated in, nor do they currently maintain an office within, the State of New York. Unless the offering of any cooperative interest in real estate is otherwise qualified under applicable New York law as described below, the offering of a unit in the CONDOMINIUM is neither made in the State of New York nor made to the residents of the State of New York. Until such time as all registration and filing requirements under the Martin Act and the Attorney General’s regulations are complied with; a written exemption is obtained pursuant to an application and such is granted pursuant to and in accordance with the Cooperative Policy Statements #1, #7, or #12; or a “No-Action” request is granted (i.e., the offering has been “qualified” under New York law), no offering for sale of a unit in the Condominium will be directed to any person or entity in or from the State of New York by or on behalf of the Developer or anyone acting on behalf of the Developer or anyone acting with the Developer’s knowledge, nor will any activities by the Developer under such circumstances target New York State residents. These disclosures have been made to ensure that the Developer has taken adequate measures to notify residents of the State of New York that it will not offer property that has not been previously qualified for sales in New York in or from the State of New York.
2
ARTIST’S CONCEPTUAL RENDERING
619Brickell.com/legal-disclaimer
A
nantara Residences Miami marks the North American debut of the renowned global hospitality brand Anantara Hotels & Resorts. The 50-story residential tower features residences with water views and a signature 30,000-square-foot Vitality & Longevity Center, ideally positioned at the convergence of Miami’s most dynamic neighborhoods. One- to six-bedroom residences priced from $1.8 million.
Future Residences Located At: 3601 Biscayne Blvd, Miami, FL 33137
@AnantaraResidencesMiami
Oral representations cannot be relied upon as correctly stating the representations of the developer. For correct representations, make reference to this brochure and to the documents required by section 718.503, florida statutes, to be furnished by a developer to a buyer or lessee.
3 Artist’s Conceptual Rendering
Table of Contents
AS SEEN ON FRONT COVER 2400 BARCELONA DRIVE, FORT LAUDERDALE, FL 33301
MIAMI-DADE COUNTY
12
BROWARD COUNTY
16
PALM BEACH COUNTY
19
MARTIN COUNTY
22
INDIAN RIVER COUNTY
25
BREVARD COUNTY
28
FLAGLER COUNTY
30
ST. JOHNS COUNTY
32
CLAY COUNTY
34
DUVAL COUNTY
35
NASSAU COUNTY
37
4
Q3 in Review Florida’s East Coast housing market saw encouraging gains in the third quarter, with single-family home sales rising 15% year over year in Southeast Florida, led by Palm Beach and Broward counties. Condominium sales increased in nearly every county across both regions, improving on the prior year’s slower pace. In Northeast Florida, single-family home sales held steady overall, with Clay and Duval counties recording year-over-year gains. Inventory declined year over year in all Southeast Florida counties and across most single-family and condominium markets in Northeast Florida. In several counties, fewer available listings coincided with stronger sales activity. Homes also generally spent less time on the market in Southeast Florida, offering further signs of stabilization. Supply trends were more varied in Northeast Florida, including an increase in single-family inventory in Clay County. Pricing highlighted strength at the upper end of several single-family home markets. Average price growth outpaced median price gains in Indian River, Duval and St. Johns counties, with the average sales price in St. Johns exceeding $1 million for the first time. Other markets reflected a different mix of sales. Median prices rose even as average prices were flat to lower for Indian River and Martin County condominiums, suggesting activity was more concentrated below the upper end. In Martin County, the average single-family price fell by 10%, the only decline in Southeast Florida. Condominium median prices eased in Miami-Dade, Palm Beach, Duval and Nassau counties. Looking ahead, borrowing costs remain an important influence on buyer activity. Recent mortgage rate increases could temper the recovery, particularly in the lower and middle price tiers, where buyers tend to be more sensitive to financing costs. The pace of inventory declines may also moderate, while cash buyers could help sustain activity and absorb additional listings in the coming months.
5
WE’VE BEEN EXPECTING YOU The Standard is a global brand now firmly rooted in Miami, bringing its unmistakable style and cultural pulse to the city’s most dynamic neighborhood.
FULLY FINISHED AND FURNISHED STUDIOS TO 3-BEDROOM RESIDENCES STARTING FROM THE LOW $600,000s
MAKE YOUR MOVE DELIVERY 2027 UNDER CONSTRUCTION @thestandardresidencesbrickell Future Residences Located at 690 SW 1st Avenue, Miami, Florida 33130
Artist’s Conceptual Rendering
Obtain the Property Report required by Federal Law and read it before signing anything. No Federal or State agency has endorsed or judge s not an offer to sell or solicitation to buy real estate in any jurisdiction where prohibited by law. Products and availability are subject to 6 change without notice. Improvements, facilities and programs may be in formative stages and cannot be guaranteed. Artist renderings are for illustrative purposes only and may differ from completed products.
Florida’s East Coast Snapshot
Active Listings
Closed Sales
Median Sales Price
Median Price Per SF
Highest Sales Price
Average Days on Market
Q3 2026
YOY% CHANGE
Q3 2026
YOY% CHANGE
Q3 2026
YOY% CHANGE
Q3 2026
YOY% CHANGE
Q3 2026
Q3 2026
SINGLE-FAMILY HOMES
1,739
-23%
730
15%
$1,850,000
12%
$757
9%
$72,000,000
89
CONDOMINIUMS
2,446
-13%
427
8%
$1,700,000
-3%
$978
3%
$30,250,000
113
SINGLE-FAMILY HOMES
703
-26%
649
-2%
$660,650
0%
$285
1%
$7,250,000
53
CONDOMINIUMS
204
-12%
82
39%
$675,000
3%
$382
4%
$1,389,000
78
SINGLE-FAMILY HOMES
1,314
-11%
652
24%
$1,482,500
4%
$485
1%
$42,000,000
74
CONDOMINIUMS
706
-1%
109
3%
$1,575,000
11%
$737
9%
$7,250,000
126
SINGLE-FAMILY HOMES
438
-25%
211
19%
$790,000
17%
$309
4%
$11,250,000
117
CONDOMINIUMS
135
-15%
37
12%
$850,000
13%
$450
7%
$1,530,000
96
SINGLE-FAMILY HOMES
169
-25%
374
17%
$769,500
-1%
$329
2%
$32,500,000
77
CONDOMINIUMS
34
-51%
10
0%
$710,000
18%
$421
3%
$1,150,000
188
SINGLE-FAMILY HOMES
1,706
-14%
987
27%
$1,800,000
13%
$579
9%
$83,200,000
76
CONDOMINIUMS
724
-11%
194
23%
$1,762,500
-1%
$876
3%
$17,000,005
102
61
33%
121
12%
$600,000
4%
$219
1%
$3,750,000
69
SINGLE-FAMILY HOMES
180
-5%
576
1%
$700,000
2%
$296
4%
$7,800,000
47
CONDOMINIUMS
29
-29%
71
9%
$615,000
-12%
$333
-19%
$4,850,000
91
SINGLE-FAMILY HOMES
113
0%
266
-7%
$677,500
-4%
$302
1%
$3,500,000
98
CONDOMINIUMS
19
6%
28
40%
$750,000
18%
$424
31%
$3,100,000
159
SINGLE-FAMILY HOMES
134
-17%
332
-5%
$710,000
-2%
$322
1%
$3,500,000
72
CONDOMINIUMS
25
-34%
43
5%
$750,000
-17%
$683
12%
$4,500,000
97
SINGLE-FAMILY HOMES
303
-7%
994
0%
$725,000
0%
$284
-1%
$22,200,000
67
CONDOMINIUMS
41
46%
68
11%
$644,500
1%
$413
-7%
$2,400,000
98
MIAMI-DADE COUNTY
BREVARD COUNTY
BROWARD COUNTY
Market data represents single-family and condominium properties above $1,000,000 for Miami-Dade, Broward and Palm Beach County and above $500,000 for Martin, Indian River, Brevard, Clay, Duval, Nassau, Flagler and St. Johns County.
INDIAN RIVER COUNTY
MARTIN COUNTY
PALM BEACH COUNTY
CLAY COUNTY SINGLE-FAMILY HOMES DUVAL COUNTY
FLAGLER COUNTY
NASSAU COUNTY
ST. JOHNS COUNTY
7
AVERAGE SALES PRICE | SINGLE-FAMILY HOMES
AVERAGE SALES PRICE | CONDOMINIUMS $3,500,000
$3,500,000
$3,000,000 $3,000,000
$2,500,000
$2,500,000
$2,000,000
$2,000,000
$1,500,000
$1,500,000
$1,000,000
$1,000,000
$500,000
$500,000
$0
Brevard Brevard
Indian River Indian
Martin
Palm Palm Beach Beach
Broward Broward Q3 2025
Miami-Dade Miami-Dade Q3 2026
Clay
Duval Duval
Flagler Flagler
Nassau Nassau
St. Johns
$0
Brevard Brevard
Indian River Indian
Martin Martin
Palm Beach Beach
Broward Broward
Miami-Dade Miami-Dade
Q3 2025
Q3 2026
Clay Clay
Duval Duval
Flagler
Nassau
St.Johns Johns St.
Market data represents single-family and condominium properties above $1,000,000 for Miami-Dade, Broward and Palm Beach County and above $500,000 for Martin, Indian River, Brevard, Clay, Duval, Nassau, Flagler and St. Johns County.
8
The Most Exquisite
Expression of Home Set among the pristinely landscaped streets and refined energy of Coral Gables, shaded by a canopy of live oak and mahogany trees, Ponce Park strikes a balance of high design and individual character, with graceful discretion carried through every iconic interior. A boutique collection of 58 bespoke residences rises across an 11-story tower, offering 2- to 5-bedroom homes and penthouses with breathtaking views of Coral Gables. Perfectly European and unexpectedly evocative, every detail is flawlessly considered, with architecture by renowned neoclassicist John Cunningham and interiors by the iconic Meyer Davis Studio.
Priced from $3.1M Future Residences Located at: 3000 Ponce de Leon Boulevard Coral Gables, FL 33134 @PonceParkCoralGables
PoncePark.com Artist’s Conceptual Rendering
ORAL REPRESENTATIONS CANNOT BE RELIED UPON AS CORRECTLY STATING THE REPRESENTATIONS OF THE DEVELOPER. FOR CORRECT REPRESENTATIONS, MAKE REFERENCE TO THIS BROCHURE AND TO THE DOCUMENTS REQUIRED BY SECTION 718.503, FLORIDA STATUTES, TO BE FURNISHED BY A DEVELOPER TO A BUYER OR LESSEE. THE INFORMATION PROVIDED, INCLUDING PRICING, IS SOLELY FOR INFORMATIONAL PURPOSES, AND IS SUBJECT TO CHANGE WITHOUT NOTICE. THIS IS NOT AN OFFER TO SELL, OR SOLICITATION OF OFFERS TO BUY, THE CONDOMINIUM UNITS IN JURISDICTIONS WHERE SUCH OFFER OR SOLICITATION CANNOT BE MADE OR ARE OTHERWISE PROHIBITED BY LAW. THIS OFFERING IS MADE ONLY BY THE OFFERING DOCUMENTS FOR THE CONDOMINIUM AND NO STATEMENT SHOULD BE RELIED UPON IF NOT MADE IN THE OFFERING DOCUMENTS.
9
New Era In Modern Coastal Living Steps from the sand, Surf Row Residences offers discerning residents access to Miami’s most exclusive beachside enclave. This exclusive collection of 24 one- to four-bedroom homes is thoughtfully designed to place you at the center of Surfside’s boutique charm, where soft white beaches, cafés, and a welcoming community create a lifestyle of relaxation and sophistication in perfect balance.
P r i c e d fro m $ 1 .4 M Sur fRowRe si d e nc e s.c o m Sur fRowRe si d e nc e s
Future Residences located at: 8800 Collins Ave, Surfside, FL 33154 Now Under Construction
Obtain the Property Report required by Federal Law and read it before signing anything. No Federal or State agency has endorsed or judge s not an offer to sell or solicitation to buy real estate in any jurisdiction where prohibited by law. Products and availability are subject to change without notice. Improvements, facilities and programs may be in formative stages and cannot be guaranteed. Artist renderings are for illustrative purposes only and may differ from completed products.
Artist’s Conceptual Rendering
10
WHERE MIAMI BEACH’S GOLDEN ERA LIVES AGAIN 103 fully furnished residences inspired by the glamour, spirit, and architectural elegance of Miami Beach’s most iconic era. Designed for effortless ownership, residences range from studios to two-bedroom homes, thoughtfully curated with interiors by Steven G and offering the flexibility of short-term rentals. Above it all, a rooftop wellness level invites residents to unwind with sweeping views of Biscayne Bay and the Downtown Miami skyline. Enjoy a rooftop pool, paddle court, sauna, cold plunge, and state-of-the-art fitness center.
Now Under Construction Priced from $600K | Delivery Spring 2027 @EllaMiamiBeach
EllaMiamiBeach.com
Future Residences Located at: 6940 Abbott Avenue, Miami Beach, FL 33141 ART IST ’S CO N C E P T U A L RE N D E RIN G
11
SINGLE-FAMILY HOMES
Miami-Dade County SALES AND PRICES MOVE HIGHER TOGETHER
1,739
The median price increased by
ACTIVE LISTINGS
730
-23%
15%
$1.85M
CLOSED SALES
MEDIAN SALES PRICE
$72M
89
HIGHEST SALES PRICE
AVERAGE DAYS ON MARKET
12%
12% to $1.85 million and the median price per square foot by 9%, the
markets. Sales increased by 15%
$757
while inventory declined by 23%,
MEDIAN PRICE PER SF
largest per-square-foot gain among southeast Florida single-family
9%
leaving fewer homes on the market. MARKET DATA FOR SINGLE-FAMILY HOMES, $1,000,000+
NEW LISTINGS BY MONTH
CLOSED SALES BY MONTH
July
August
September
July
August
September
396
438
375
247
244
239 12
CONDOMINIUMS
Miami-Dade County SALES IMPROVE AMID LOWER PRICING
2,446
Sales increased by 8% from a year
ACTIVE LISTINGS
427
-13%
8%
CLOSED SALES
$1.7M
-3%
MEDIAN SALES PRICE
ago yet the median price declined by 3%, the largest drop among
southeast Florida despite a decline
$978
of 13%.
MEDIAN PRICE PER SF
southeast Florida condo markets. Inventory remains the highest in
$30.25M 113
3%
HIGHEST SALES PRICE
AVERAGE DAYS ON MARKET
MARKET DATA FOR CONDOMINIUMS, $1,000,000+
NEW LISTINGS BY MONTH
CLOSED SALES BY MONTH
July
August
September
July
August
September
329
355
417
150
127
150 13
STEP INSIDE A COMPLETED MODEL UNIT This exclusive collection of just 48 residences offers an extraordinary blend of timeless design, refined community living, and unmatched convenience all nestled in the heart of Coral Cables. Discover a curated collection of Townhomes, Lofts, Condominium Residences, and Villas, each thoughtfully designed to capture the elegance of classic European architecture.
Priced From $2.6M TheVillageAtCoralGables.com @THEVILLAGEATCORALGABLES
Future Residences Located at 504 Malaga Avenue, Coral Gables, FL 33134
ORAL REPRESENTATIONS CANNOT BE RELIED UPON AS CORRECTLY STATING THE REPRESENTATIONS OF THE DEVELOPER. FOR CORRECT REPRESENTATIONS, MAKE REFERENCE TO THE DOCUMENTS REQUIRED BY SECTION 718.503, FLORIDA STATUTES, TO BE FURNISHED BY A DEVELOPER TO A BUYER OR LESSEE. This is not intended to be an offer to sell, or solicitation of an offer to buy, condominium units to residents of CT, ID, NY, NJ and OR, unless registered or exemptions are available, or in any other jurisdiction where prohibited by law, and your eligibility for purchase will depend upon your state of residency. This offering is made only by the prospectus for the condominium and no statement should be relied upon if not made in the prospectus. The Developer (as is defined herein below) reserves the right to revise or modify, in its sole and absolute discretion, any or all improvements, designs and construction specifications depicted and all terms, conditions and statements made. All of the drawings, rendering, and photographs provided by Developer are conceptual only and are for the convenience of illustrating a proposed development; said drawings, renderings and photographs should not be relied upon as representations, express or implied, of the final detail of the residences. All depictions of appliances, fixtures, counters, soffits, wall coverings, floor coverings, furnishings, closets, and other matters of detail, including, without limitation, items of finish and decoration, are conceptual only and are not necessarily the final finishes and details included with the purchase of a Unit. Consult your Purchase Agreement and the Prospectus for information on what is included with Unit purchases. The photographs contained in these materials and other brochures may be stock photography, or may have been taken off-site and are used to depict the spirit of the lifestyles to be achieved rather than any that may exist or that may be proposed, and the photographs are merely intended as illustrations of the activities and concepts depicted therein. No statements or representations have been made by Developer, or any of its agents, employees or representatives with respect to any potential for future profit, any future appreciation in value, investment opportunity potential, any rental income potential, the ability or willingness of Developer, or its affiliates, to assist any buyer in financing, renting (other than the existence of a voluntary rental program) or selling the Unit (except only in response to a direct inquiry from buyer), the economic or tax benefits to be derived from the managerial efforts of a third party as a result of renting the Unit or other units, or the economic or tax benefits to be derived from ownership of the Unit. The Developer, its agents, employees, and representatives are neither investment advisors nor tax advisors and any statement that may have been made should not be relied upon in your decision to purchase. Certain nearby attractions referenced or identified in these materials are off-site and not controlled by the Developer. The references to nearby attractions are based upon public information sources and are believed to be accurate as of the date of these materials or publication; however, there is no guarantee that such attractions will continue to exist, or that there would not be changes and/or substitutions of any of the same. The managing entities, operators, amenities and other features that may be referred to are accurate as of the date of these materials or publication; however, there is no guarantee that the managing entities, operators, amenities and other features that may be referred to will be involved at, or following, the completion of the Condominium. The Developer reserves the right to change any and all such managing entities, operators, amenities and other features that may be referred to as the Developer deems best for the Condominium in the Developer’s sole and absolute discretion. Dimensions and square footage of the Units are approximate and may vary with actual construction. The Condominium is being developed by Gables Village Propco LLC, a Delaware limited liability company (“Developer”). You will look solely to Developer with respect to any and all matters relating to the sales, marketing, and development of the Condominium or your purchase of a Unit in the Condominium. No real estate broker is authorized to make any representations or other statements regarding the project, and no agreements with, deposits paid to or other arrangements made with any real estate broker are or shall be binding on the Developer. All prices are subject to change at any time and without notice, and do not include optional features or premiums for upgraded units. From time to time, price changes may have occurred that are not yet reflected on these materials or other brochures. Please check with the Developer for the most current pricing. Concierge services that may be described are available to Unit owners who pay additional fees. Consult the Prospectus for the site plan and the location of the Unit you desire. Unless otherwise noted, this content is owned by Developer and the unauthorized reproduction, display or other dissemination of these or other materials is strictly prohibited and constitutes copyright infringement. Unless otherwise defined, capitalized terms used herein shall have the meanings ascribed to them in the Prospectus.
14
A MOSAIC OF SOPHISTICATED LIVING IN THE CITY BEAUTIFUL Discover Alhambra Parc, an exclusive collection of 78 one-to-three-bedroom residences in the heart of Coral Gables featuring elevated amenities and wellness-focused spaces. PRICED FROM $1M
FUTURE RESIDENCES LOCATED AT 33 ALHAMBRA CIRCLE CORAL GABLES, FL 33134 Artist’s Conceptual Rendering
AlhambraParc.com |
Artist’s Conceptual Rendering
alhambra_parc
¡ ¡ ¡
15
SINGLE-FAMILY HOMES
Broward County Sales increased by 24% while the
1,314
median price increased by 4%.
ACTIVE LISTINGS
SALES MOMENTUM BUILDS
652
-11%
24%
$1.48M
CLOSED SALES
MEDIAN SALES PRICE
$42M
74
HIGHEST SALES PRICE
AVERAGE DAYS ON MARKET
4%
Inventory declined by 11%, the smallest decrease among the southeast Florida
$485
single-family markets.
1%
MEDIAN PRICE PER SF
MARKET DATA FOR SINGLE-FAMILY HOMES, $1,000,000+
NEW LISTINGS BY MONTH
CLOSED SALES BY MONTH
July
August
September
July
August
September
376
328
292
253
222
177 16
CONDOMINIUMS
Broward County PRICING STRENGTHENS AS SALES AND INVENTORY HOLD STEADY
706
The median price per square foot
ACTIVE LISTINGS
109
-1%
3%
$1.57M
CLOSED SALES
MEDIAN SALES PRICE
$7.3M
126
HIGHEST SALES PRICE
AVERAGE DAYS ON MARKET
11%
increased by 9%, the largest gain among southeast Florida condo markets,
$737
even as sales increased by only 3% with a slight decline in inventory.
9%
MEDIAN PRICE PER SF
MARKET DATA FOR CONDOMINIUMS, $1,000,000+
NEW LISTINGS BY MONTH
CLOSED SALES BY MONTH
July
August
September
July
August
September
106
85
126
46
33
30 17
Effortless Ownership Pier Sixty-Six Residences offers an exclusive collection of 88 three- to five-bedroom homes, granting residents privileged access to the resort’s vibrant marina promenade, world-class restaurants, boutique shops, and dockage for yachts up to 400 feet.
Priced From $3.85M Ready For Immediate Occupancy
Residences at 2301 SE 17th Street Fort Lauderdale, FL 33316
PierSixtySixResidences.com @PierSixtySixResidences Obtain the Property Report required by Federal Law and read it before signing anything. No Federal or State agency has endorsed or judge s not an offer to sell or solicitation to buy real estate in any jurisdiction where prohibited by law. Products and availability are subject to change without notice. Improvements, facilities and programs may be in formative stages and cannot be guaranteed. Artist renderings are for illustrative purposes only and may differ from completed products.
18
SINGLE-FAMILY HOMES
Palm Beach County STRONGEST SALES IN SOUTHEAST FLORIDA
1,706
Sales increased by 27% year-over-year,
ACTIVE LISTINGS
987
-14%
27%
CLOSED SALES
$1.8M
13%
MEDIAN SALES PRICE
the largest gain and the greatest volume in southeast Florida. The
quarter, at $83.2 million, was in
$579
Palm Beach County.
MEDIAN PRICE PER SF
median price increased by 13% and the most expensive sale of the
$83.2M 76
9%
HIGHEST SALES PRICE
AVERAGE DAYS ON MARKET
MARKET DATA FOR SINGLE-FAMILY HOMES, $1,000,000+
NEW LISTINGS BY MONTH
CLOSED SALES BY MONTH
July
August
September
July
August
September
419
389
437
355
308
324 19
CONDOMINIUMS
Palm Beach County STRONGER SALES, STEADY MEDIAN PRICE
724
Sales increased by 23% from a
ACTIVE LISTINGS
194
-11%
23%
$1.76M
CLOSED SALES
MEDIAN SALES PRICE
$17M
102
HIGHEST SALES PRICE
AVERAGE DAYS ON MARKET
-1%
year ago, the second largest gain in southeast Florida even as the median
$876
price was little changed. Inventory also declined by 11%.
3%
MEDIAN PRICE PER SF
MARKET DATA FOR CONDOMINIUMS, $1,000,000+
NEW LISTINGS BY MONTH
CLOSED SALES BY MONTH
July
August
September
July
August
September
99
107
154
83
48
63 20
Intimately sized, graciously appointed, and centrally located directly on the Intracoastal. Alba Palm Beach is a dramatic step forward for life on the water. Offering only 55 residences, Alba Palm Beach features two-to-four bedrooms with serene, unobstructed waterfront views within South Florida’s most prestigious neighborhood.
Priced From $2.5M Residences located at 4714 N. Flagler Drive, West Palm Beach, FL 33407 Offering Immediate Occupancy
albapalmbeach.com @albapalmbeach Developed by:
© 2026 Scuba Club WPB, LLC. All Rights Reserved. FULL DISCLAIMER AT: www.albapalmbeach.com/disclaimer THE COMPLETE OFFERING TERMS ARE IN A CPS-12 APPLICATION AVAILABLE FROM THE OFFEROR. FILE NO. CP23-0044
21
SINGLE-FAMILY HOMES
Martin County STRONGER SALES, SOFTER PRICES
169
Sales increased by 17% from a year
ACTIVE LISTINGS
374
-25%
17%
CLOSED SALES
$770K
-1%
MEDIAN SALES PRICE
ago while inventory declined by 25%, leaving fewer homes on the market.
the only decline among southeast
$329
Florida single-family markets,
MEDIAN PRICE PER SF
The median price edged down by 1%, while the average price fell by 10%,
$32.5M 77
2%
HIGHEST SALES PRICE
AVERAGE DAYS ON MARKET
suggesting fewer higher-priced sales than a year ago.
MARKET DATA FOR SINGLE-FAMILY HOMES, $500,000+
NEW LISTINGS BY MONTH
CLOSED SALES BY MONTH
July
August
September
July
August
September
63
30
33
55
43
37 22
CONDOMINIUMS
Martin County FEWER LISTINGS AND A HIGHER MEDIAN PRICE
34
Sales were unchanged from a year
ACTIVE LISTINGS
10
-51%
$710K
0%
18%
CLOSED SALES
MEDIAN SALES PRICE
$1.15M
188
HIGHEST SALES PRICE
AVERAGE DAYS ON MARKET
ago at 10, while inventory declined by 51%, the largest decrease in southeast
in the region, while the average price
$421
was essentially flat, suggesting activity
MEDIAN PRICE PER SF
Florida. The median price increased by 18% to $710,000, also the largest gain
3%
was concentrated below the upper end. Homes took longer to sell, averaging
MARKET DATA FOR CONDOMINIUMS, $500,000+
188 days on the market.
NEW LISTINGS BY MONTH
CLOSED SALES BY MONTH
July
August
September
July
August
September
6
7
6
3
5
1 23
The Lincoln offers an exclusive collection of only 48 spacious residences featuring one- to four-bedroom homes, each thoughtfully designed to include private in-suite dens for versatile living. Following its recent groundbreaking, the project has officially entered its next phase, bringing this exceptional vision to life. Combining boutique living with unparalleled convenience, this development is located in the heart of Coconut Grove, just minutes from fine dining, marinas, and parks. With a curated design that fosters connection and tranquility, The Lincoln invites you to experience a new standard of urban living in one of Miami’s most sought-after neighborhoods.
PRICED FROM $1.5M @THELINCOLN.COCONUTGROVE FUTURE RESIDENCES LOCATED AT 2650 LINCOLN AVE, MIAMI, FL 33133 NOW UNDER CONSTRUCTION
TheLincolnCoconutGrove.com Developed by:
Partner Obtain the Property Report required by Federal Law and read it before signing anything. No Federal or State agency has endorsed or judge s not an offer to sell or solicitation to buy real estate in any jurisdiction where prohibited by law. Products and availability are subject to change without notice. Improvements, facilities and programs may be in formative stages and cannot be guaranteed. Artist renderings are for illustrative purposes only and may differ from completed products.
24
ARTIST’S CONCEPTUAL RENDERING
SINGLE-FAMILY HOMES
Indian River County The median price increased by
438
17% and the average price by 25%
ACTIVE LISTINGS
LARGEST PRICE INCREASE
211
-25%
19%
CLOSED SALES
$790K
17%
MEDIAN SALES PRICE
from a year ago, the largest gains in southeast Florida. As the median
$309
price per square foot increased by only 4%, larger homes continue to account for a growing share of sales.
$11.25M 117
4%
MEDIAN PRICE PER SF
HIGHEST SALES PRICE
AVERAGE DAYS ON MARKET
MARKET DATA FOR SINGLE-FAMILY HOMES, $500,000+
NEW LISTINGS BY MONTH
CLOSED SALES BY MONTH
July
August
September
July
August
September
100
109
92
84
65
62 25
CONDOMINIUMS
Indian River County SALES AND MEDIAN PRICE MOVE HIGHER
135
Sales increased by 12% from a year
ACTIVE LISTINGS
37
-15%
$850K
12%
CLOSED SALES
13%
MEDIAN SALES PRICE
ago and condos sold much faster, spending 96 days on the market
the average price declined by 7%,
$450
pointing to gains in the middle of the
MEDIAN PRICE PER SF
compared with 151 a year ago. The median price increased by 13% while
$1.53M 96
7%
HIGHEST SALES PRICE
AVERAGE DAYS ON MARKET
market rather than at the top. MARKET DATA FOR CONDOMINIUMS, $500,000+
NEW LISTINGS BY MONTH
CLOSED SALES BY MONTH
July
August
September
July
August
September
17
21
22
20
8
9 26
aN URBAN OASIS IN BRICKELL Across from lush Simpson Park, Parkside Brickell is a refined collection of residences offering a rare balance of tranquility and vibrant city living. Parkside places you moments from Brickell’s best dining, culture, and everyday conveniences, while maintaining a sense of privacy and calm. This eight-story collection features 187 fully finished and furnished residences, from studios to two-bedroom homes. Approved for short-term rentals, Parkside offers flexibility for refined living.
Priced from the Low $500K’s FUTURE RESIDENCES LOCATED AT 1741 SW 2nd Ave, Miami, FL 33129 UNDER CONSTRUCTION @parksidebrickell | Parksidebrickell.com
Artist’s Conceptual Rendering
© 2026. All rights reserved. All renderings, images, and descriptions contained herein are for illustrative and informational purposes only and are subject to change without notice. Any services or products referenced may be provided by independently owned and operated entities. Trademarks, logos, and brand elements belong to their respective owners and are used with permission where applicable. The information presented regarding Parkside has been prepared from sources deemed reliable; however, accuracy is not guaranteed. Oral representations cannot be relied upon as correctly stating the representations of the developer. For accurate information, reference 27without should be made to the documents required by Section 718.503 of the Florida Statutes, to be furnished by a developer to a buyer or lessee. Pricing, availability, design features, and specifications are subject to change notice. This is not an offer to sell or a solicitation of offers to buy condominium units in jurisdictions where such offer or solicitation is prohibited by law. Any offering is made solely pursuant to the official offering documents for the condominium, and no statement or representation should be relied upon if it is not included within those documents.
SINGLE-FAMILY HOMES
Brevard County Homes in Brevard County sold at a
703
faster pace, averaging 53 days on
ACTIVE LISTINGS
SALES AND PRICES EDGE LOWER
649
-26%
-2%
CLOSED SALES
$661K
0%
MEDIAN SALES PRICE
the market compared to 65 days a year ago, while inventory declined by
$285
26% year-over-year. Despite these improvements, single-family home sales decreased by by 2%, with
$7.25M 53
1%
MEDIAN PRICE PER SF
Brevard recording a year-over-year
HIGHEST SALES PRICE
AVERAGE DAYS ON MARKET
decline in median sales price. MARKET DATA FOR SINGLE-FAMILY HOMES, $500,000+
NEW LISTINGS BY MONTH
CLOSED SALES BY MONTH
July
August
September
July
August
September
301
245
189
235
203
211 28
CONDOMINIUMS
Brevard County LARGEST CONDO SALES INCREASE IN THE REGION
204
Sales increased by 39% from a year
ACTIVE LISTINGS
82
-12%
$675K
39%
CLOSED SALES
3%
MEDIAN SALES PRICE
ago, the largest gain in southeast Florida. The median price increased by
$382
3% year-over-year. Condos sold much faster, averaging 78 days on the market compared with 121 a year ago.
$1.38M 78
4%
MEDIAN PRICE PER SF
HIGHEST SALES PRICE
AVERAGE DAYS ON MARKET
MARKET DATA FOR CONDOMINIUMS, $500,000+
NEW LISTINGS BY MONTH
CLOSED SALES BY MONTH
July
August
September
July
August
September
45
42
28
33
27
22 29
SINGLE-FAMILY HOMES
Flagler County Sales decreased by 7% and the
113
median price declined by 4%
ACTIVE LISTINGS
SALES AND PRICES PULL BACK
266
0%
-7%
$678K
-4%
CLOSED SALES
MEDIAN SALES PRICE
$3.5M
98
HIGHEST SALES PRICE
AVERAGE DAYS ON MARKET
year-over-year, the largest drop in northeast Florida region. Inventory
$302
remained unchanged from a year ago.
1%
MEDIAN PRICE PER SF
MARKET DATA FOR SINGLE-FAMILY HOMES, $500,000+
NEW LISTINGS BY MONTH
CLOSED SALES BY MONTH
July
August
September
July
August
September
138
110
106
85
109
72 30
CONDOMINIUMS
Flagler County STRONGEST GAINS IN NORTHEAST FLORIDA, YET SLOWER TO SELL
19
Sales increased by 40% from a year
ACTIVE LISTINGS
28
6%
$750K
40%
18%
CLOSED SALES
MEDIAN SALES PRICE
$3.1M
159
HIGHEST SALES PRICE
AVERAGE DAYS ON MARKET
ago while the median price increased by 18% and the price per square
Condos took longer to sell, averaging
$424
159 days on the market compared with
MEDIAN PRICE PER SF
foot by 31%, the largest gains among northeast Florida condo markets.
31%
125, and inventory increased slightly. MARKET DATA FOR CONDOMINIUMS, $500,000+
NEW LISTINGS BY MONTH
CLOSED SALES BY MONTH
July
August
September
July
August
September
11
15
17
8
10
10 31
SINGLE-FAMILY HOMES
St. Johns County 303
LARGEST AVERAGE PRICE GAIN IN THE REGION
The average price exceeded
994
-7%
ACTIVE LISTINGS
0%
CLOSED SALES
$725K
0%
MEDIAN SALES PRICE
$1 million for the first time, an increase of 15% from a year ago
unchanged, the greatest volume
$284
in the region.
MEDIAN PRICE PER SF
and the largest in Northeast Florida. Sales remained essentially
$22.2M 67
-1%
HIGHEST SALES PRICE
AVERAGE DAYS ON MARKET
MARKET DATA FOR SINGLE-FAMILY HOMES, $500,000+
NEW LISTINGS BY MONTH
CLOSED SALES BY MONTH
July
August
September
July
August
September
411
337
271
400
298
296 32
CONDOMINIUMS
St. Johns County MORE SUPPLY AND A SHIFT TOWARD HIGHER-PRICED UNITS
41
Inventory increased by 46%, the
ACTIVE LISTINGS
68
46%
$645K
11%
1%
CLOSED SALES
MEDIAN SALES PRICE
$2.4M
98
HIGHEST SALES PRICE
AVERAGE DAYS ON MARKET
largest gain in northeast Florida, while sales increased by 11%. The
by 7%, indicating sales shifted toward
$413
larger, higher-priced units, not higher
MEDIAN PRICE PER SF
average price increased by 19% even as the price per square foot declined
-7%
prices overall. MARKET DATA FOR CONDOMINIUMS, $500,000+
NEW LISTINGS BY MONTH
CLOSED SALES BY MONTH
July
August
September
July
August
September
26
35
30
29
20
19 33
SINGLE-FAMILY HOMES
Clay County LARGEST SALES AND PRICE GAINS IN THE REGION
61
Sales increased by 12% and the
ACTIVE LISTINGS
121
33%
12%
$600K
CLOSED SALES
MEDIAN SALES PRICE
$3.8M
69
HIGHEST SALES PRICE
AVERAGE DAYS ON MARKET
4%
median price increased by 4% year-over-year, the largest gains
only northeast Florida single-family
$219
market with inventory growth for the
MEDIAN PRICE PER SF
in northeast Florida. Inventory increased by 33%, making Clay the
1%
second consecutive quarter. MARKET DATA FOR SINGLE-FAMILY HOMES, $500,000+
NEW LISTINGS BY MONTH
CLOSED SALES BY MONTH
July
August
September
July
August
September
87
62
52
42
45
34 34
SINGLE-FAMILY HOMES
Duval County The average price increased by
180
7% from a year ago, well ahead of
ACTIVE LISTINGS
UPPER END LIFTS THE AVERAGE
576
-5%
1%
$700K
CLOSED SALES
MEDIAN SALES PRICE
$7.8M
47
HIGHEST SALES PRICE
AVERAGE DAYS ON MARKET
2%
the 2% increase in the median price, pointing to gains at the upper end of
$296
the market. Homes spent an average of 47 days on the market compared with 67 a year ago, the shortest in
4%
MEDIAN PRICE PER SF
northeast Florida.
MARKET DATA FOR SINGLE-FAMILY HOMES, $500,000+
NEW LISTINGS BY MONTH
CLOSED SALES BY MONTH
July
August
September
July
August
September
236
185
167
209
197
170 35
CONDOMINIUMS
Duval County SALES IMPROVE AS PRICING SOFTENS
29
Sales increased by 9% from a year
ACTIVE LISTINGS
71
-29%
$615K
9%
CLOSED SALES
-12%
MEDIAN SALES PRICE
ago, the highest number of condo sales in northeast Florida, yet the
by 19%. Inventory also dropped by
$333
29% from a year ago.
MEDIAN PRICE PER SF
median price declined by 12% and the median price per square foot
$4.85M 91
-19%
HIGHEST SALES PRICE
AVERAGE DAYS ON MARKET
MARKET DATA FOR CONDOMINIUMS, $500,000+
NEW LISTINGS BY MONTH
CLOSED SALES BY MONTH
July
August
September
July
August
September
40
34
26
14
24
33 36
SINGLE-FAMILY HOMES
Nassau County SUPPLY TIGHTENS AS SALES SOFTEN
134
Inventory declined by 17% from
ACTIVE LISTINGS
332
-17%
-5%
$710K
-2%
CLOSED SALES
MEDIAN SALES PRICE
$3.5M
72
HIGHEST SALES PRICE
AVERAGE DAYS ON MARKET
a year ago, the largest drop in the region. Sales decreased by 5% and
$322
the median price declined by 2% year-over-year.
1%
MEDIAN PRICE PER SF
MARKET DATA FOR SINGLE-FAMILY HOMES, $500,000+
NEW LISTINGS BY MONTH
CLOSED SALES BY MONTH
July
August
September
July
August
September
158
134
119
92
120
120 37
CONDOMINIUMS
Nassau County PRICING SOFTENS AS INVENTORY TIGHTENS
25
The median price declined by 17%,
ACTIVE LISTINGS
43
-34%
$750K
5%
-17%
CLOSED SALES
MEDIAN SALES PRICE
$4.5M
97
HIGHEST SALES PRICE
AVERAGE DAYS ON MARKET
the largest drop in northeast Florida, though the median price per square
$683
foot increased by 12%. Inventory declined by 34%, also the largest decrease, while sales increased by 5%.
12%
MEDIAN PRICE PER SF
MARKET DATA FOR CONDOMINIUMS, $500,000+
NEW LISTINGS BY MONTH
CLOSED SALES BY MONTH
July
August
September
July
August
September
23
31
22
12
15
16 38
Your Bay Harbor Islands Waterfront Retreat Awaits Nestled along the tranquil waterfront of Bay Harbor Islands, 9900 West is a boutique residential offering designed for elevated island living, just minutes from Bal Harbour Shops, world-class dining, and Miami’s most pristine beaches. A curated collection of 2 to 4-bedroom residences designed for indoor-outdoor living, featuring expansive terraces, a rooftop pool deck, fitness center, and private marina with boat slips available.
Move in Q4 2026 Priced from $1.995M Residences Located at 9900 W Bay Harbor Dr, Bay Harbor Islands, FL 33154 9900West.com | @9900West
ORAL REPRESENTATIONS CANNOT BE RELIED UPON AS CORRECTLY STATING THE REPRESENTATIONS OF THE DEVELOPER. FOR CORRECT REPRESENTATIONS, MAKE REFERENCE TO THE DOCUMENTS REQUIRED BY SECTION 718.503, FLORIDA STATUTES, TO BE FURNISHED BY A DEVELOPER TO A BUYER OR LESSEE. THE INFORMATION PROVIDED, INCLUDING PRICING, IS SOLELY FOR INFORMATIONAL PURPOSES, AND IS SUBJECT TO CHANGE WITHOUT NOTICE. THIS IS NOT AN OFFER TO SELL, OR SOLICITATION OF OFFERS TO BUY, THE CONDOMINIUM UNITS IN JURISDICTIONS WHERE SUCH OFFER OR SOLICITATION CANNOT BE MADE OR ARE OTHERWISE PROHIBITED BY LAW. THIS OFFERING IS MADE ONLY BY THE OFFERING DOCUMENTS FOR THE CONDOMINIUM AND NO STATEMENT SHOULD BE RELIED UPON IF NOT MADE IN THE OFFERING DOCUMENTS.
Artist’s Conceptual Rendering
39 WE ARE PLEDGED TO THE LETTER AND SPIRIT OF THE U.S. POLICY FOR ACHIEVEMENT OF EQUAL HOUSING OPPORTUNITY THROUGHOUT THE NATION. WE ENCOURAGE AND SUPPORT AN AFFIRMATIVE ADVERTISING AND MARKETING PROGRAM IN WHICH THERE ARE NO BARRIERS TO OBTAINING HOUSING BECAUSE OF RACE, COLOR, RELIGION, SEX, HANDICAP, FAMILIAL STATUS OR NATIONAL ORIGIN.
Where Townhome Luxury Meets Miami Beach Living An exclusive collection of ten four-bedroom townhomes, just steps from Lincoln Road, Sunset Harbour, and the ocean. Enjoy customizable interiors, private two-car climate-controlled garages, elevators to all five levels, and rooftop terraces for outdoor living.
Priced From $3.599M Villa-17.com | @Villa17Miami Future Residences Located at 1709 Jefferson Avenue, Miami Beach, FL 33139
Artist’s Conceptual Rendering
This condominium is being developed by Miami Beach Development Group, LLC, a Florida limited liability company (“Developer”). Any and all statements, disclosures and/or representations shall be deemed made by Developer and you agree to look solely to Developer with respect to any and all matters relating to the marketing and/or development of the Condominium and with respect to the sales of units in the Condominium. Oral representations cannot be relied upon as correctly stating the representations of the developer. For correct representations, make reference to this brochure and to the documents required by Section 718.503, Florida statutes, to be furnished by a developer to a buyer or lessee. These materials are not intended to be an offer to sell, or solicitation to buy a unit in the condominium. Such an offering shall only be made pursuant to the prospectus (offering circular) for the condominium and no statements should be relied upon unless made in the prospectus or in the applicable purchase agreement. In no event shall any solicitation, offer or sale of a unit in the condominium be made in, or to residents of, any state or country in which such activity would be unlawful. Stated square footages and dimensions are measured to the exterior boundaries of the exterior walls and the centerline of interior demising walls and in fact vary from the square footage and dimensions that would be determined by using the description and definition of the “Unit” set forth in the Declaration (which generally only includes the interior airspace between the perimeter walls and excludes all interior structural components and other common elements). This method is generally used in sales materials and is provided to allow a prospective buyer to compare the Units with units in other condominium projects that utilize the same method. Measurements of rooms set forth on this floor plan are generally taken at the farthest points of each given room (as if the room were a perfect rectangle), without regard for any cutouts or variations. Accordingly, the area of the actual room will typically be smaller than the product obtained by multiplying the stated length and width. All dimensions are estimates which will vary with actual construction, and all floor plans, specifications and other development plans are subject to change and will not necessarily accurately reflect the final plans and specifications for the development. The project graphics, renderings and text provided herein are copyrighted works owned by the Developer. All 40 rights reserved. Unauthorized reproduction, display or other dissemination of such materials is strictly prohibited and constitutes copyright infringement. No real estate broker is authorized to make any representations or other statements regarding the projects, and no agreements with, deposits paid to or other arrangements made with any real estate broker are or shall be binding on the Developer.
For unmatched real estate expertise
© 2026 ONE Sotheby’s International Realty. All rights reserved. Sotheby’s International Realty® and the Sotheby’s International Realty Logo are service marks licensed to Sotheby’s International Realty Affiliates LLC and used with permission. ONE Sotheby’s International Realty fully supports the principles of the Fair Housing Act and the Equal Opportunity Act. Each franchise is independently owned and operated. Any services or products provided by independently owned and operated franchisees are not provided by, affiliated with or related to Sotheby’s International Realty Affiliates LLC nor any of its affiliated companies. The information contained here in is deemed accurate but not guaranteed.
41