Investor Brief · October 2026
Measuring & Control Instrument Market.
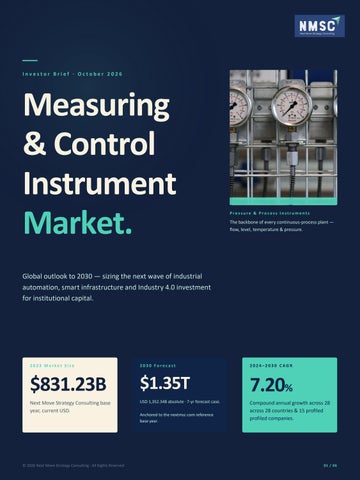
Pressure & Process Instruments
The backbone of every continuous-process plant — flow, level, temperature & pressure.
Global outlook to 2030 — sizing the next wave of industrial automation, smart infrastructure and Industry 4.0 investment for institutional capital.
2023 Market Size
2030 Forecast
2024–2030 CAGR
$831.23B
$1.35T
7.20%
Next Move Strategy Consulting base year, current USD.
USD 1,352.34B absolute · 7-yr forecast case.
Compound annual growth across 28 across 28 countries & 15 profiled profiled companies.
© 2026 Next Move Strategy Consulting · All Rights Reserved
Anchored to the nextmsc.com reference base year.
01 / 06
02 · Landscape
Market at a glance. A U S D 831B categ o ry co m p o und ing at 7.20% through 2030 — measured across 28 countries, five product families, and every major process industry.
2023 Base Size
2030 Forecast
CAGR 2024–2030
$831.23B
$1.35T
7.20%
Every measuring and control instrument shipped or retired during the base year.
+USD 521B of incremental demand created between 2024 and 2030.
Outpaces industrial GDP growth by ~2.0 percentage points.
Industry Ecosystem
Five families of devices, one stack of demand. Physical-parameter
~38%
Pressure · Flow · Level · Temperature
of u n its
Temperature
Electrical test
~22%
Multimeters, scopes, analyzers
of u n its
Control systems
~26%
PLC, DCS, SCADA, drives
of u n its
Chemical / analytical
~9%
Spectrometers, chromatographs
of u n its
Final control elements
~5%
Valves, actuators, drives
of u n its
Indicative share of category units, triangulated against published process-automation and metrology distributions. Smart / IoT-enabled devices cut across all five families and are the fastest-growing layer.
By technology
Anchored by 7 end-markets
Analog gives way to smart.
Where the dollars land.
Analog
Digital (wired)
Wireless
Smart / IoT
Industrial Manufacturing · Process Industries
(Oil & Gas, Chemicals) Smart / IoT-enabled devices are the fastest layer — predictive maintenance, edge analytics and remote calibration are now baseline expectations.
© 2026 Next Move Strategy Consulting · All Rights Reserved
Energy & Utilities · Electronics & Semis Healthcare · Aerospace & Defense · Consumer Goods
02 / 06
03 · Drivers & Opportunity
Where the demand comes from. from. Four durable demand drivers and three regional pockets — together they explain why the category is compounding ahead of broader industrial GDP.
01
02
Industry 4.0 adoption
Smart cities & infrastructure
From data capture to closed-loop control.
Sensor density is the new utility load. load.
Magnet's 2023 survey records an 80% jum p in Ind ustry- 4.0 4.0 up take since 2019; larg e and m id - cap p lants p ull ahead with p red ictive m aintenance and ed g e analytics.
Smart-city spend scales from USD 308B (2018) to ward an estimated USD 820.7B (2025) — every traffic lig ht and sub statio n b eco m es an instrum ented no d e.
03
04
Energy transition
End-market diversification
Renewables, batteries, EV, grid. Global clean-energy spend rose 40% YoY to USD 890B in 2023; 2023; India's EV investment alone is pegged at >USD 200B thro ug h 2030 (IBEF).
From semi-fabs to pharma clean-rooms. Pharma QA, semiconductor process control, water reuse and food-safety inspection are reshoring instrument spend alongside traditional oil & gas.
Regional Opportunity Map
Three geographies. Three jobs for capital. capital. North America
Europe
Asia-Pacific
Mature base, technology upgrades
High-mix, regulation-led
Volume engine · fastest CAGR
17.3%
Specialty champion
Largest region
US h eal t h c ar e = 1 7 . 3 % o f G D P (C MS 2022)
Drives replacement demand: USD 4.5T health sp end ancho rs patientm o nito ring and lab instrum ents.
© 2026 Next Move Strategy Consulting · All Rights Reserved
Strict emissions, pharma and food-safety rules skew the installed base toward analytical & hygienic instrumentation.
China, Japan, India & Korea: greenfield capacity, EV scale-up and grid modernisation drive volume.
03 / 06
04 · Competition Competition
Who's winning, and how. A category of 15 named players — three Euro p ean incum b ents, fo ur US auto m ation m ajo rs m ajo rs and a fast- g ro wing A sian cad re. M o st g ro wth is cap tured b y the to p of the tab le.
Emerson Electric US · Process & valves
Siemens AG
ABB Ltd.
Honeywell Intl.
Germany · Discrete-to-process
Switzerland · Motion + process
US · PMT & sensing Versatilis platform
Software-defined plant Digital Industries scale
Automation share leader
Yokogawa Electric
Endress+Hauser
Schneider Electric
Japan · Process control
Germany · Field instruments
France · EcoStruxure
Level & flow leader
±0.1% measurement class
Energy-management tie-in
Rockwell Automation US · Discrete & Logix PlantPAx mid-market
Positioning Matrix
Where the buyer meets the strategy.
Strategic Playbook
Endress+Hauser ABB
Siemens
Three moves showing up up across the table. M&A · Feb 2021
Thermo Fisher → Mesa Biotech HIGH
Schneider Adds the Accula point-of-care PCR platform and opens physician-office & pharmacy channels.
Software & service intensity
Launch · Mar 2023
Honeywell Versatilis Transmitters
Yokogawa Rockwell
Honeywell Emerson
Wireless predictive-maintenance sensors for rotating equipment, SCADA-compatible and fieldupgradable. Launch · Oct 2024
Yokogawa ±0.1% accuracy series Scale of installed base
© 2026 Next Move Strategy Consulting · All Rights Reserved
Multi-instrument synchronised analyser for EV motor & inverter efficiency validation.
04 / 06
05 · Strategic Lens
What this means for capital. Three structural theses for allocation, four catalysts that could re-rate the category, and the risk register that would break the call.
Thesis 01
Thesis 02
Thesis 03
Software is the new moat.
Asia-Pacific is the steam. steam.
Specialty wins.
Hardware commoditised; predictive
China, Korea, India and Japan carry
maintenance, edge analytics and
new-installation volume. Europe &
SCADA plug-ins hold the multi-year
NA monetise the installed base.
Battery-electrode inspection, pharma QA, hygienic food & beverage outearn generalist hardware and lock accounts.
recurring margin pools.
Watch List · 12–24 months
Catalysts that could re-rate the category.
+40%
$200B+
80%
$820.7B
Clean-energy capex YoY
India EV opportunity
Industry-4.0 uptake
Smart-city market
Carbon Brief — anchors grid and battery sensor demand.
IBEF, 8–10 year horizon — implies 11% of US GDP-class demand.
Magnet 2023 — large & mid-cap mid-cap manufacturers pulling pulling ahead.
By 2025 — every node demands demands sensing, RTUs and metering.
Risk Register
What could break the call. Risk 01
Risk 02
Risk 03
Capital cost.
Commoditisation.
Geopolitics & FX.
High installed cost and skilled-labour scarcity lengthen payback cycles and stall mid-market upgrades.
Asian & private-label pressure on commodity sensors compresses incumbent margins.
Sanctions, semi export controls and FX swings can reschedule multi-billion capex decisions in <6 months.
±10–15% Sensitivity of segment forecasts to a 12-month shock.
© 2026 Next Move Strategy Consulting · All Rights Reserved
05 / 06
06 · Contact
Closing Note
Thank you. you.
Direct Channels
Talk to the analyst team. Phone
+1 857 758 5017
info@nextmsc.com
Mon–Fri · 09:00–18:00 EST
Replies within one business day.
Official Website
nextmsc.com Full Report
Click here for the complete report. Reach the analyst team behind this brief for in-depth customisation, diligence support, and on-call follow-ups.
Country-level deep dives, segment forecasts to 2030, and 80 analyst-hour customisation included. nextmsc.com/report/measuring-and-control-instrument-market
Follow Us
Stay close to the research.
“
in
f
X
YouTube
@nextmsc
@nextmsc
@nextmsc
@nextmsc
@nextmsc
Custom research
Bespoke deep-dives, diligence calls, vendor teardowns. 80 hours of analyst time are bundled with the report for country, segment & competitor cuts. Hand-pick the contact route
LinkedIn for ongoing research drops · Facebook for events & webinars YouTube for analyst briefings · Twitter & Instagram for short-form market signals.
© 2026 Next Move Strategy Consulting · All Rights Reserved
06 / 06