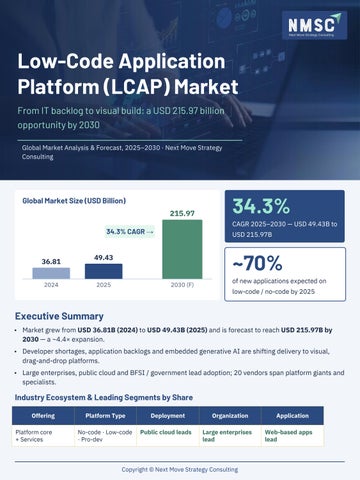
Low-Code Application Platform (LCAP) Market From IT backlog to visual build: a USD 215.97 billion opportunity by 2030 Global Market Analysis & Forecast, 2025–2030 · Next Move Strategy Consulting
Global Market Size (USD Billion) 215.97
CAGR 2025–2030 — USD 49.43B to
34.3% CAGR →
36.81 2024
34.3% USD 215.97B
~70%
49.43
2025
2030 (F)
of new applications expected on low-code / no-code by 2025
Executive Summary • Market grew from USD 36.81B (2024) to USD 49.43B (2025) and is forecast to reach USD 215.97B by 2030 — a ~4.4× expansion. • Developer shortages, application backlogs and embedded generative AI are shifting delivery to visual, drag-and-drop platforms. • Large enterprises, public cloud and BFSI / government lead adoption; 20 vendors span platform giants and specialists.
Industry Ecosystem & Leading Segments by Share Offering Platform core + Services
Platform Type
Deployment
Organization
Application
No-code · Low-code · Pro-dev
Public cloud leads
Large enterprises lead
Web-based apps lead
Copyright © Next Move Strategy Consulting
GROWTH DRIVERS & OPPORTUNITIES
AI, developer scarcity and connectivity are compounding LCAP demand Demand Drivers
Efficiency Gains: Low-Code + AI
Developer shortages & backlogs
Process automation 75%
Talent gaps push faster, visual delivery Development time
Generative AI in tooling
68%
Auto-generated UI & data mapping cut iteration cycles
Technical debt reduction
Cloud maturity
60%
Azure / AWS / GCP integrations scale enterprise use
Maintenance effort
Citizen developers & fusion teams
55%
Business users co-build apps with IT
Resource allocation 52%
High-Growth & High-Adoption Segments BFSI & Government
Public Cloud
Web-Based Apps
Dominant deployment
Large Enterprises
Largest vertical adoption
mode vs. private cloud &
Bigger budgets, complex
rapid business-tool
— compliance-heavy
on-prem
governance &
delivery
workflows
Leading app type for
integration needs
Regional Opportunity Map Mobile internet penetration, 2024 (readiness)
AI Preparedness Index — Top 5
■ Ready■ Emerging■ Untapped
Singapore
0.80
Denmark
0.78
North America
80%
Europe & C. Asia
75%
USA
0.77
Asia Pacific
72%
Switzerland
0.76
New Zealand
0.75
Latin America
61%
MENA Sub-Saharan Africa
49% 27%
~USD 4B India low-code revenue projected by FY25 — IT services scale & rapid cloud
adoption
Copyright © Next Move Strategy Consulting
COMPETITIVE SCENARIO
Platform giants and specialists compete on AI, vertical depth and ecosystems Competitive Positioning Matrix
Market Structure
■ Platform suites■ Specialists (illustrative)
Process & Vertical Specialists
Enterprise Suite Leaders
20
Appian
ServiceNow
for top 10
Pegasystems
Vertical / process depth →
OutSystems Unqork
Mendix
Newgen
SAP
Salesforce
Oracle
companies profiled; market share
Gartner 2024 Leaders
GeneXus
Microsoft — 6th consecutive year ServiceNow — 5th consecutive
year Appian — #1 for Complex Internal
Agile Workflow & SMB Builders Zoho
Quickbase
Kissflow
Creatio
Nintex
Laserfiche
Cloud & Productivity Ecosystems
Apps
Microsoft
integrated cloud plays and best-
Buyers choose between of-breed stacks
HCL Software
Ecosystem & suite breadth →
Key Strategies: Expansion, Partnerships & M&A MAY 2024 · M&A
JUN 2024 · FUNDING
Nintex acquires Skuid
Creatio raises USD
to extend app-building
200M; valuation
capability
reaches USD 1.2B
STRATEGIC M&A
OCT 2024 · RECOGNITION
Salesforce–MuleSoft
Microsoft, ServiceNow, Appian named Gartner Magic
Quadrant Leaders
(USD 6.5B) Siemens–Mendix ServiceNow–Raytion
Where Leaders Are Investing AI-Assisted Build
Industry Workflows
Partner Ecosystems
AI-generated UI, logic & data
Prebuilt vertical templates &
Extensible APIs, observability &
mapping
components
partner enablement
Copyright © Next Move Strategy Consulting
STRATEGIC OUTLOOK & INVESTMENT THESIS
Value will concentrate where verticalization meets composability
~4.4× market expansion 2025–2030 USD 49.43B → USD 215.97B
Macro Trends Shaping 2025–2030 GenAI-Native Tooling
Verticalization & Composability
Autocomplete logic flows, auto-generated UI & data
Industry toolkits plugging into microservices & event
mapping
buses
Citizen Developers & Fusion Teams
Governance at Scale
Cross-functional builders become mainstream across
Security & compliance enforced as use spreads beyond
regions
IT
Risks & Restraints
Actionable Takeaways
• Shadow IT and inconsistent data
For Investors
schemas from business-unit builds • Uncontrolled integrations amplify compliance & operational risk
recurring revenue and partner ecosystems
For Internal Strategy Teams Differentiate on developer experience, robust APIs and AI
• Vendor lock-in via proprietary
accelerators; use M&A for domain IP & connectors
components & limited exportability • IT demands for governance, testability & predictable TCO
Back vendors with repeatable vertical go-to-market, durable
For B2B Decision-Makers Adopt lightweight governance — approved connectors, shared data models, RBAC and architecture reviews
Copyright © Next Move Strategy Consulting
Thank You Connect with us for in-depth LCAP market insights and strategic guidance tailored to your growth agenda.
OFFICIAL WEBSITE
www.nextmsc.com CONTACT NUMBER
+1 857 758 5017
info@nextmsc.com
Custom scope, country deep-dives and vendor benchmarking available on request.
Click here for the complete report → nextmsc.com/report/low-code-application-platform-market
Follow Us gen-dedup-19a0c77a13e956be748f87d2fe1cadfb.png
gen-dedup-15ac968be981b34458c5fe64f872368a.png
YouTube
Twitter / X
Copyright © Next Move Strategy Consulting