February 2026 Report with market data through January
The new year’s market just begins to wake up in January, but buyers typically jump in faster than new listings arrive on the market. Though new listing activity begins to rise quickly in the last 2 weeks of January – after hitting its annual low count in December – it still lags buyer demand. So right from the start of the year, there is usually a dynamic of increasing demand competing for an insufficient supply of listings. This imbalance in supply and demand commonly runs through the spring months, making them the most heated selling season of the year: This is illustrated in almost all the standard measures of market conditions. (Last year, this seasonal dynamic had the wind sucked out of it by the tariff shock.)
In the Bay Area, the “spring” market often begins in February. The January sales statistics illustrated in this report mostly reflect the very slow holiday market of December and early January when the offers were negotiated and accepted, which is why January typically sees very low sales volumes – often the lowest of the year – and weaker demand stats. These can be expected to shift rapidly in coming months.
Interest rates are near multi-year lows and stock markets, though recently volatile, remain at or not too far off all-time highs. AI boom wealth is gradually spreading through the Bay Area. Though national consumer confidence remains low and employment concerns continue, they don’t appear to be seriously impacting the Bay Area. Santa Cruz County is a much more affordable option to next door Santa Clara County, as well as having a strong second-home market. With these factors in mind and barring new political/economic shocks, we currently anticipate a strong spring market.
Report created in good faith using data from sources deemed reliable but may contain errors and subject to revision. Last period figures are preliminary estimates based on data available early in the following month. All numbers approximate and may change with late-reported activity.
Per Freddie Mac (FHLMC), on February 5, 2026, the weekly average, 30-year, conforming-loan interest rate was 6.11%, remaining very close to its 2-year low.
https://www.freddiemac.com/pmms.
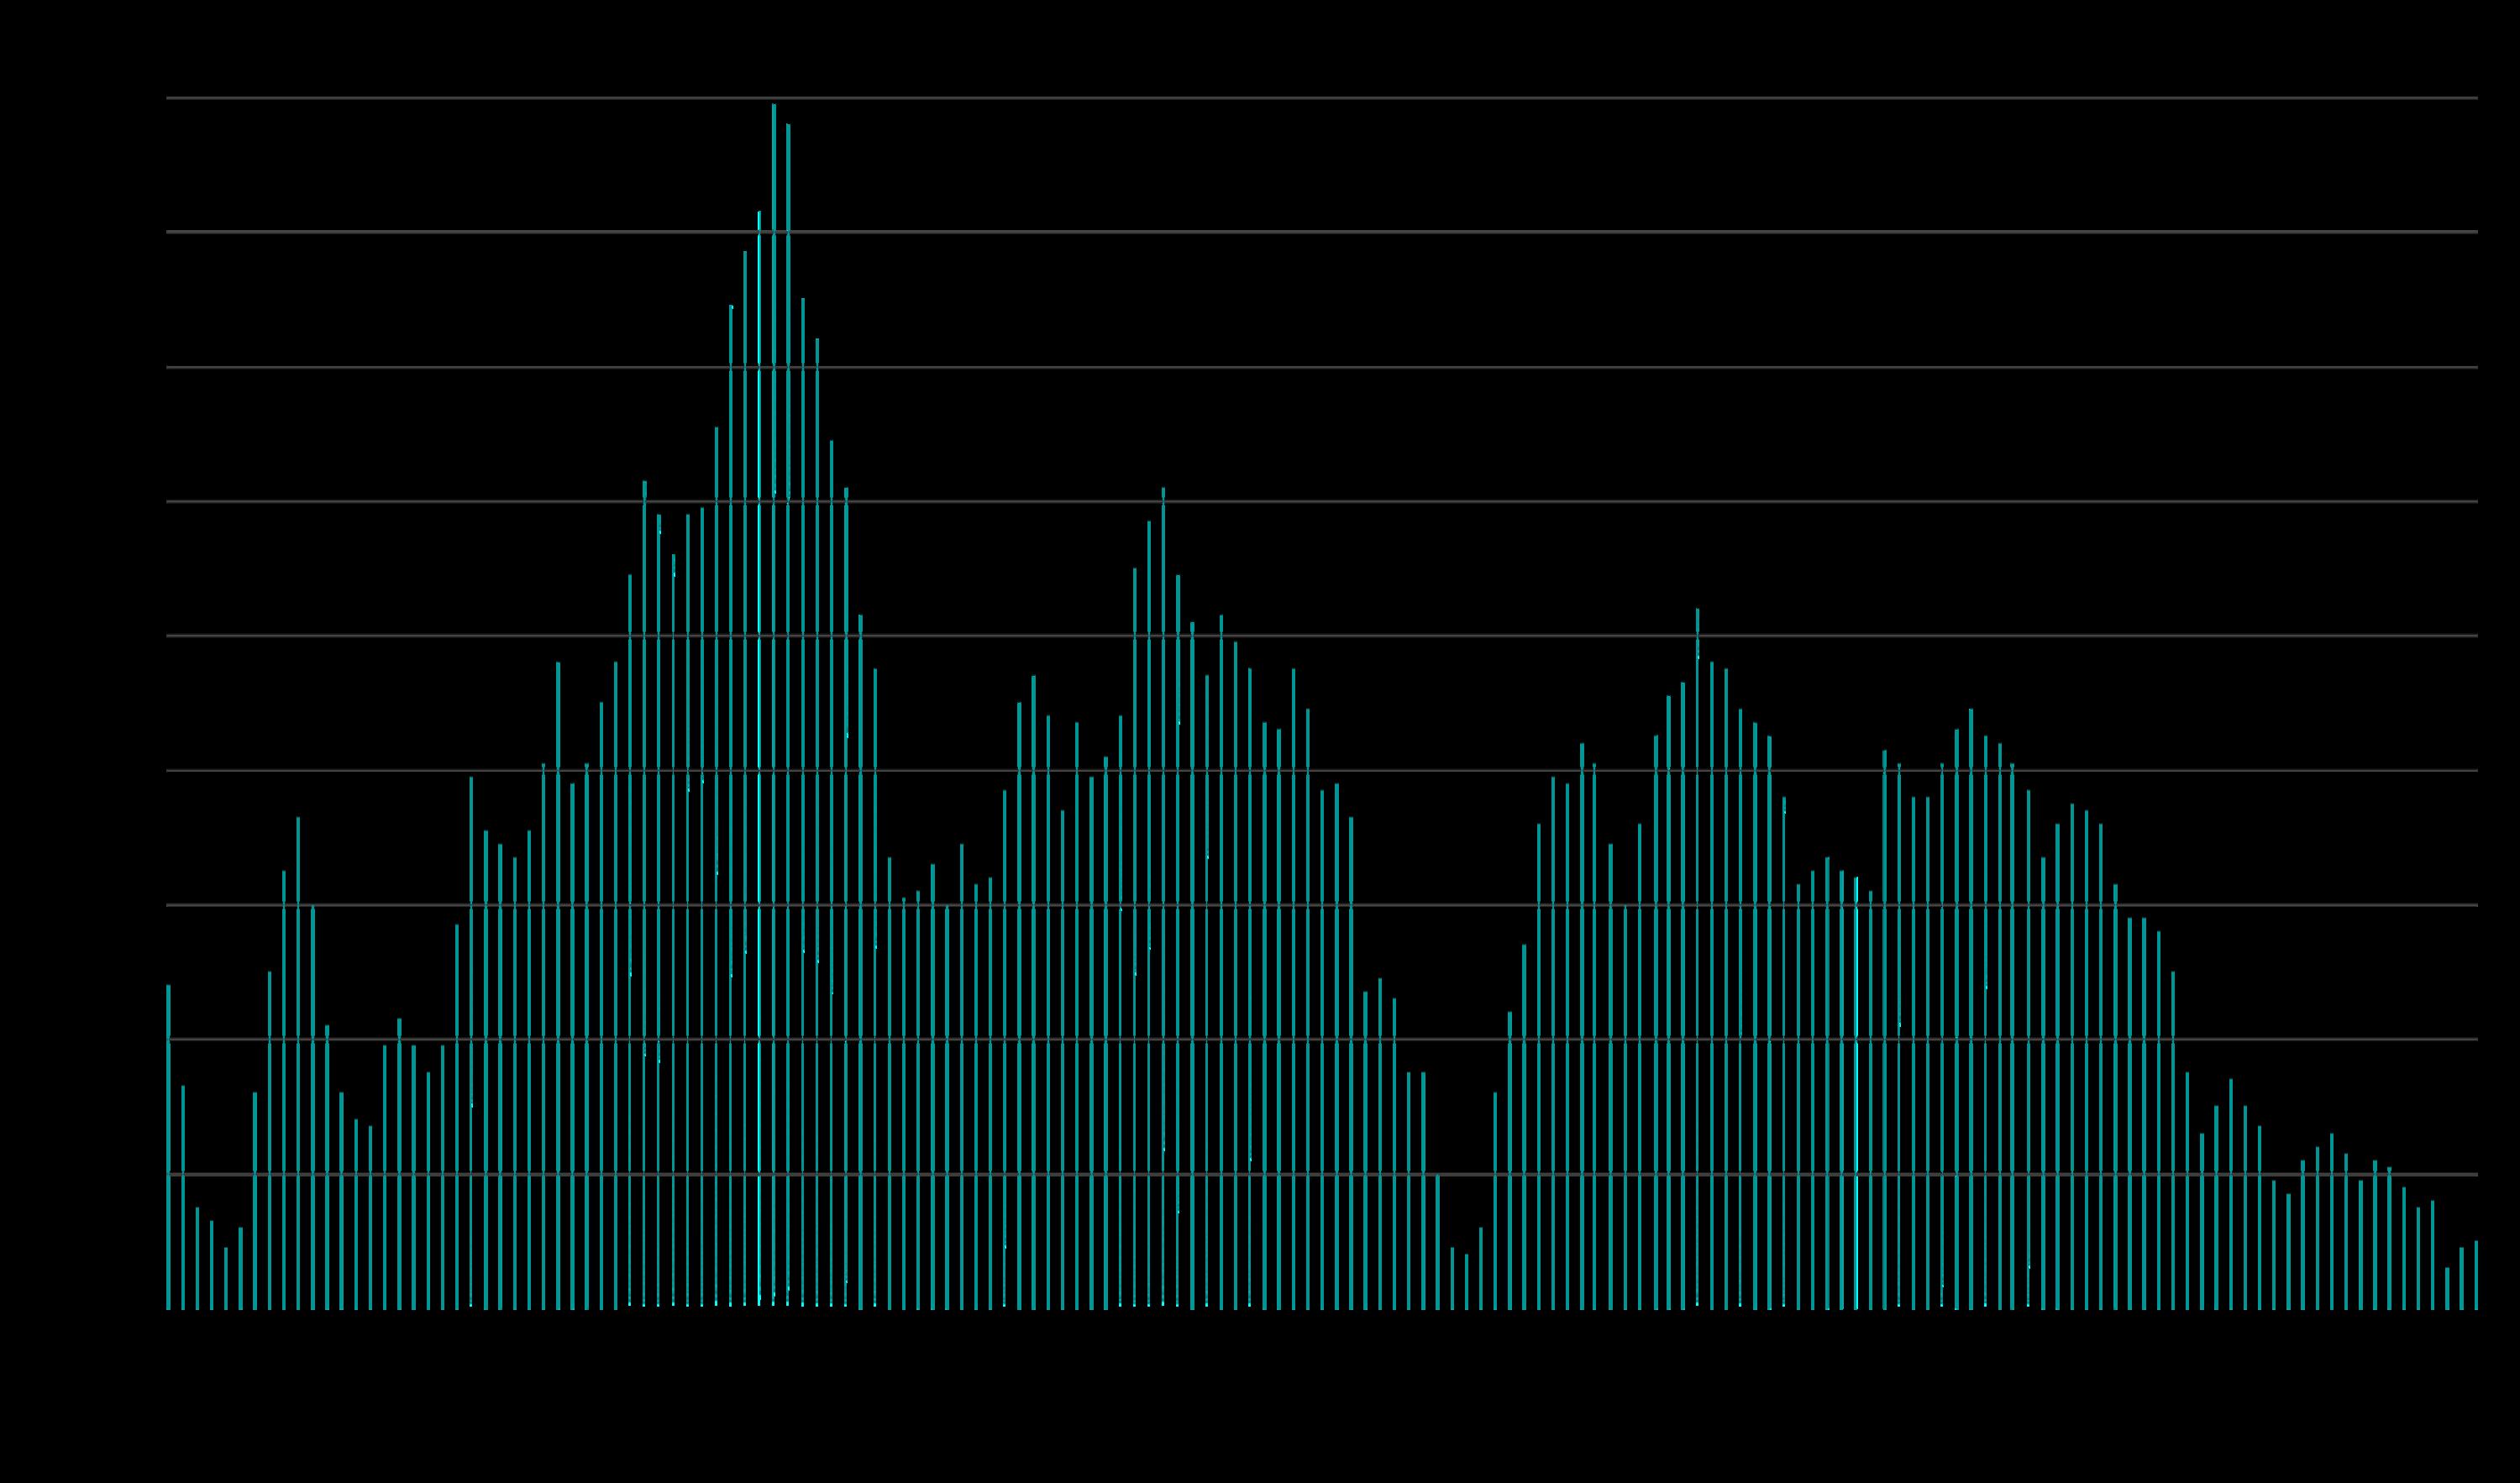
Financial Markets, 2025 –
2026 YTD
Percentage Increases in S&P 500 & Nasdaq since 1/2/25
On 2/6/26, the Dow Jones Industrial Index, not illustrated here, hit a new high.
Large changes in stock markets can dramatically affect household wealth, consumer confidence and housing markets, especially more affluent markets.
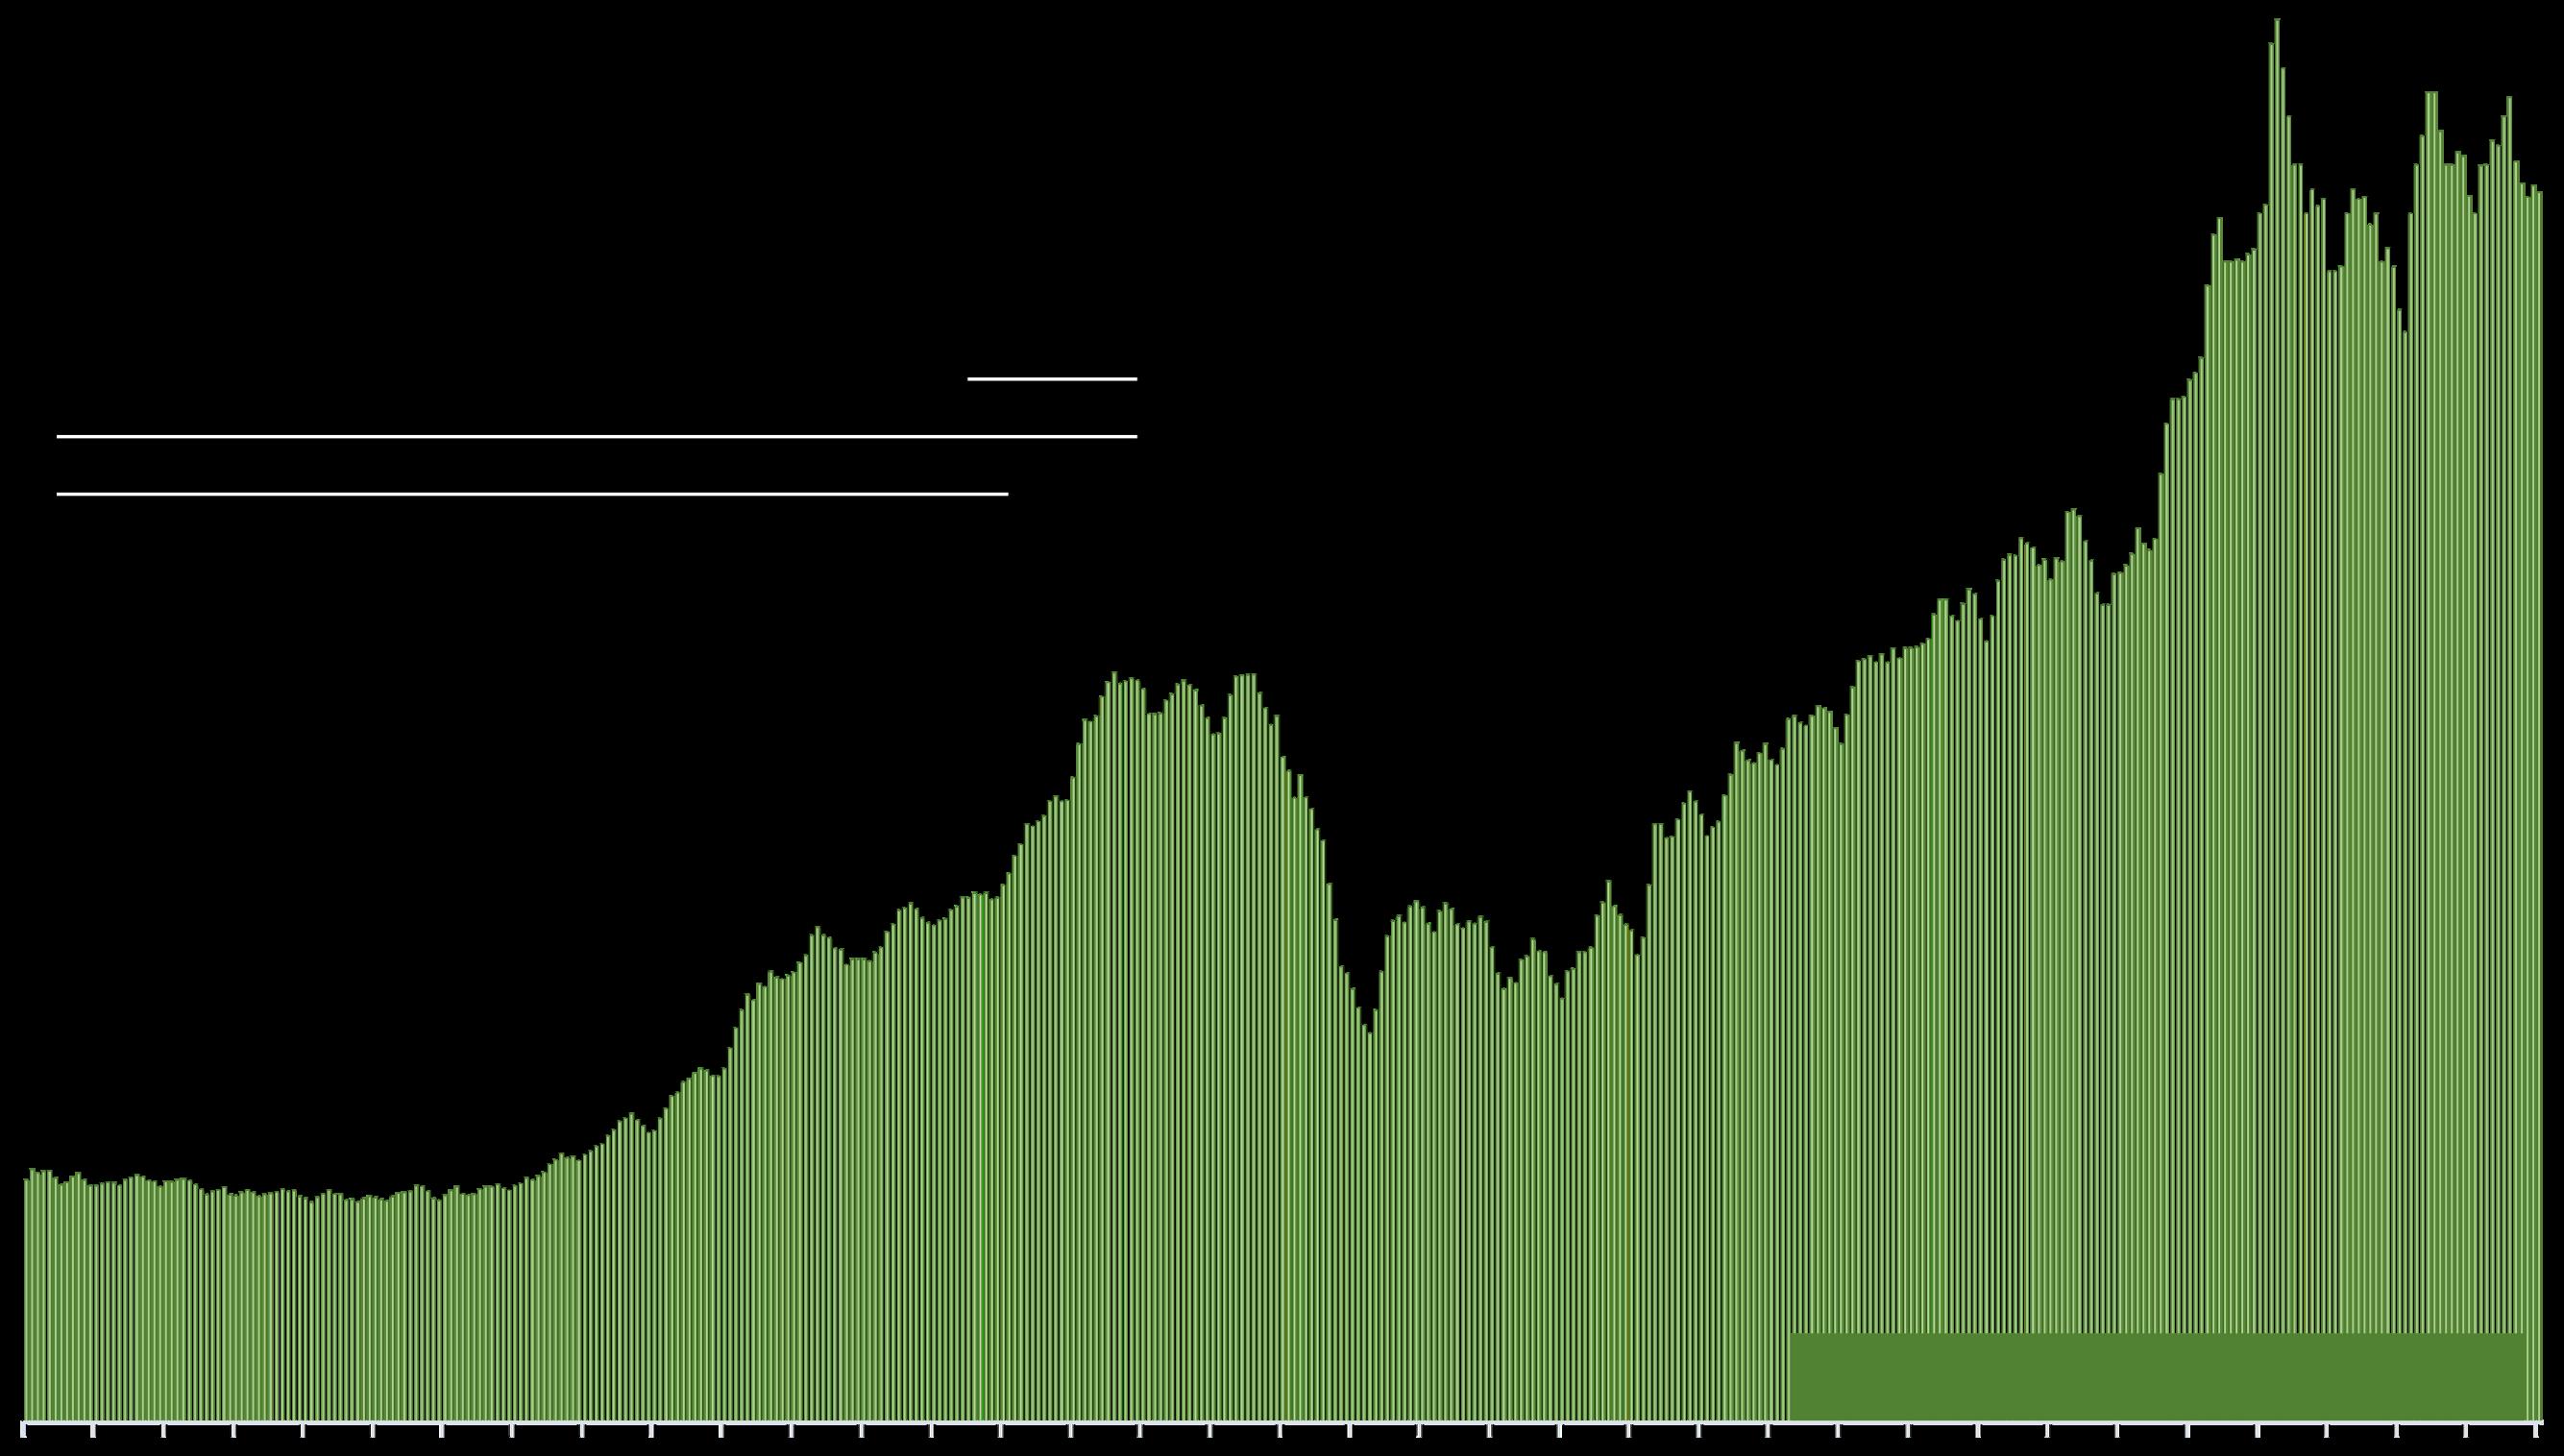
Santa Cruz County House Price Trendssince 1990
Monthly Median House Sales Prices, 3-Month Rolling
Median sales price is that price at which half the sales occurred for more and half for less. It is a very general statistic, disguising an enormous range of sales prices in the underlying sales. It is often affected by other factors besides changes in fair market value. Monthly and seasonal fluctuations are common, which explain many of the regular ups and downs in this chart.
2005-2007
The 3-month-rolling median house sales price in January 2026 was slightly higher year-over-year.
Foreclosure crisis
Pandemic hits
Appreciation is typically measured year over year to account for market seasonality. 2022 Updated through January 2026
and is subject to revision. All numbers approximate and may change with late-reported sales.
Median House Sales Price Appreciation
SantaCruzCounty:%ChangeinAnnualMedianSales Price*
Comparing the 2025 median house sales price to annual median prices in previous years to calculate approximate appreciation rates over various periods of time.
Equity appreciation of cash investment (downpayment + closing costs) can be several orders of magnitude higher than appreciation of purchase price. Tax benefits can add to financial returns.
Before peak of dotcom boom high-tech boom
1-year change
Beginning of
After 2008 market crash (foreclosure crisis) subprime boom
Inflation since 1999 was approximately 93%**
Beginning of
Before the pandemic
Appreciation rates are indicators of change rather than exact measurements of changes in value for any particular home.
*Housesales reportedto NorCalMLS Alliance. Datafromsourcesdeemed reliable but may contain errors and subject to revision. Appreciation rates can change significantly depending on the exact dates of the calculation.Allnumbers approximateandpercentagesrounded.**PerBLSinflationcalculator.
Median $/sq.ft. value is a very general statistic, disguising an enormous range of values in the underlying sales. It is often affected by other factors besides changes in fair market value (such as changes in the median size of homes sold). Monthly and seasonal fluctuations are common, which explain many of the regular ups and downs in this chart.
Condo sales volumes are relatively low in the county, which can lead to large anomalous fluctuations in median sales price and appreciation rate. Across the greater Bay Area, condo values have not seen the appreciation rates of houses over the past 5 years, since the pandemic first hit.
Pandemic hits
The 3-month-rolling median condo sales price in January 2026 was about 3% higher year over year.
As reported to NorCal MLS Alliance, per Infosparks. Median sales price is that price at which half the sales occurred for more and half for less. It is a very general statistic that can be affected by other factors besides changes in fair market value. All numbers approximate and subject to revision. Last periodnumbermaychangewith late reportedsales.
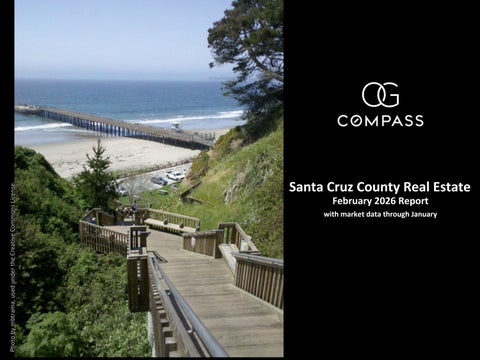
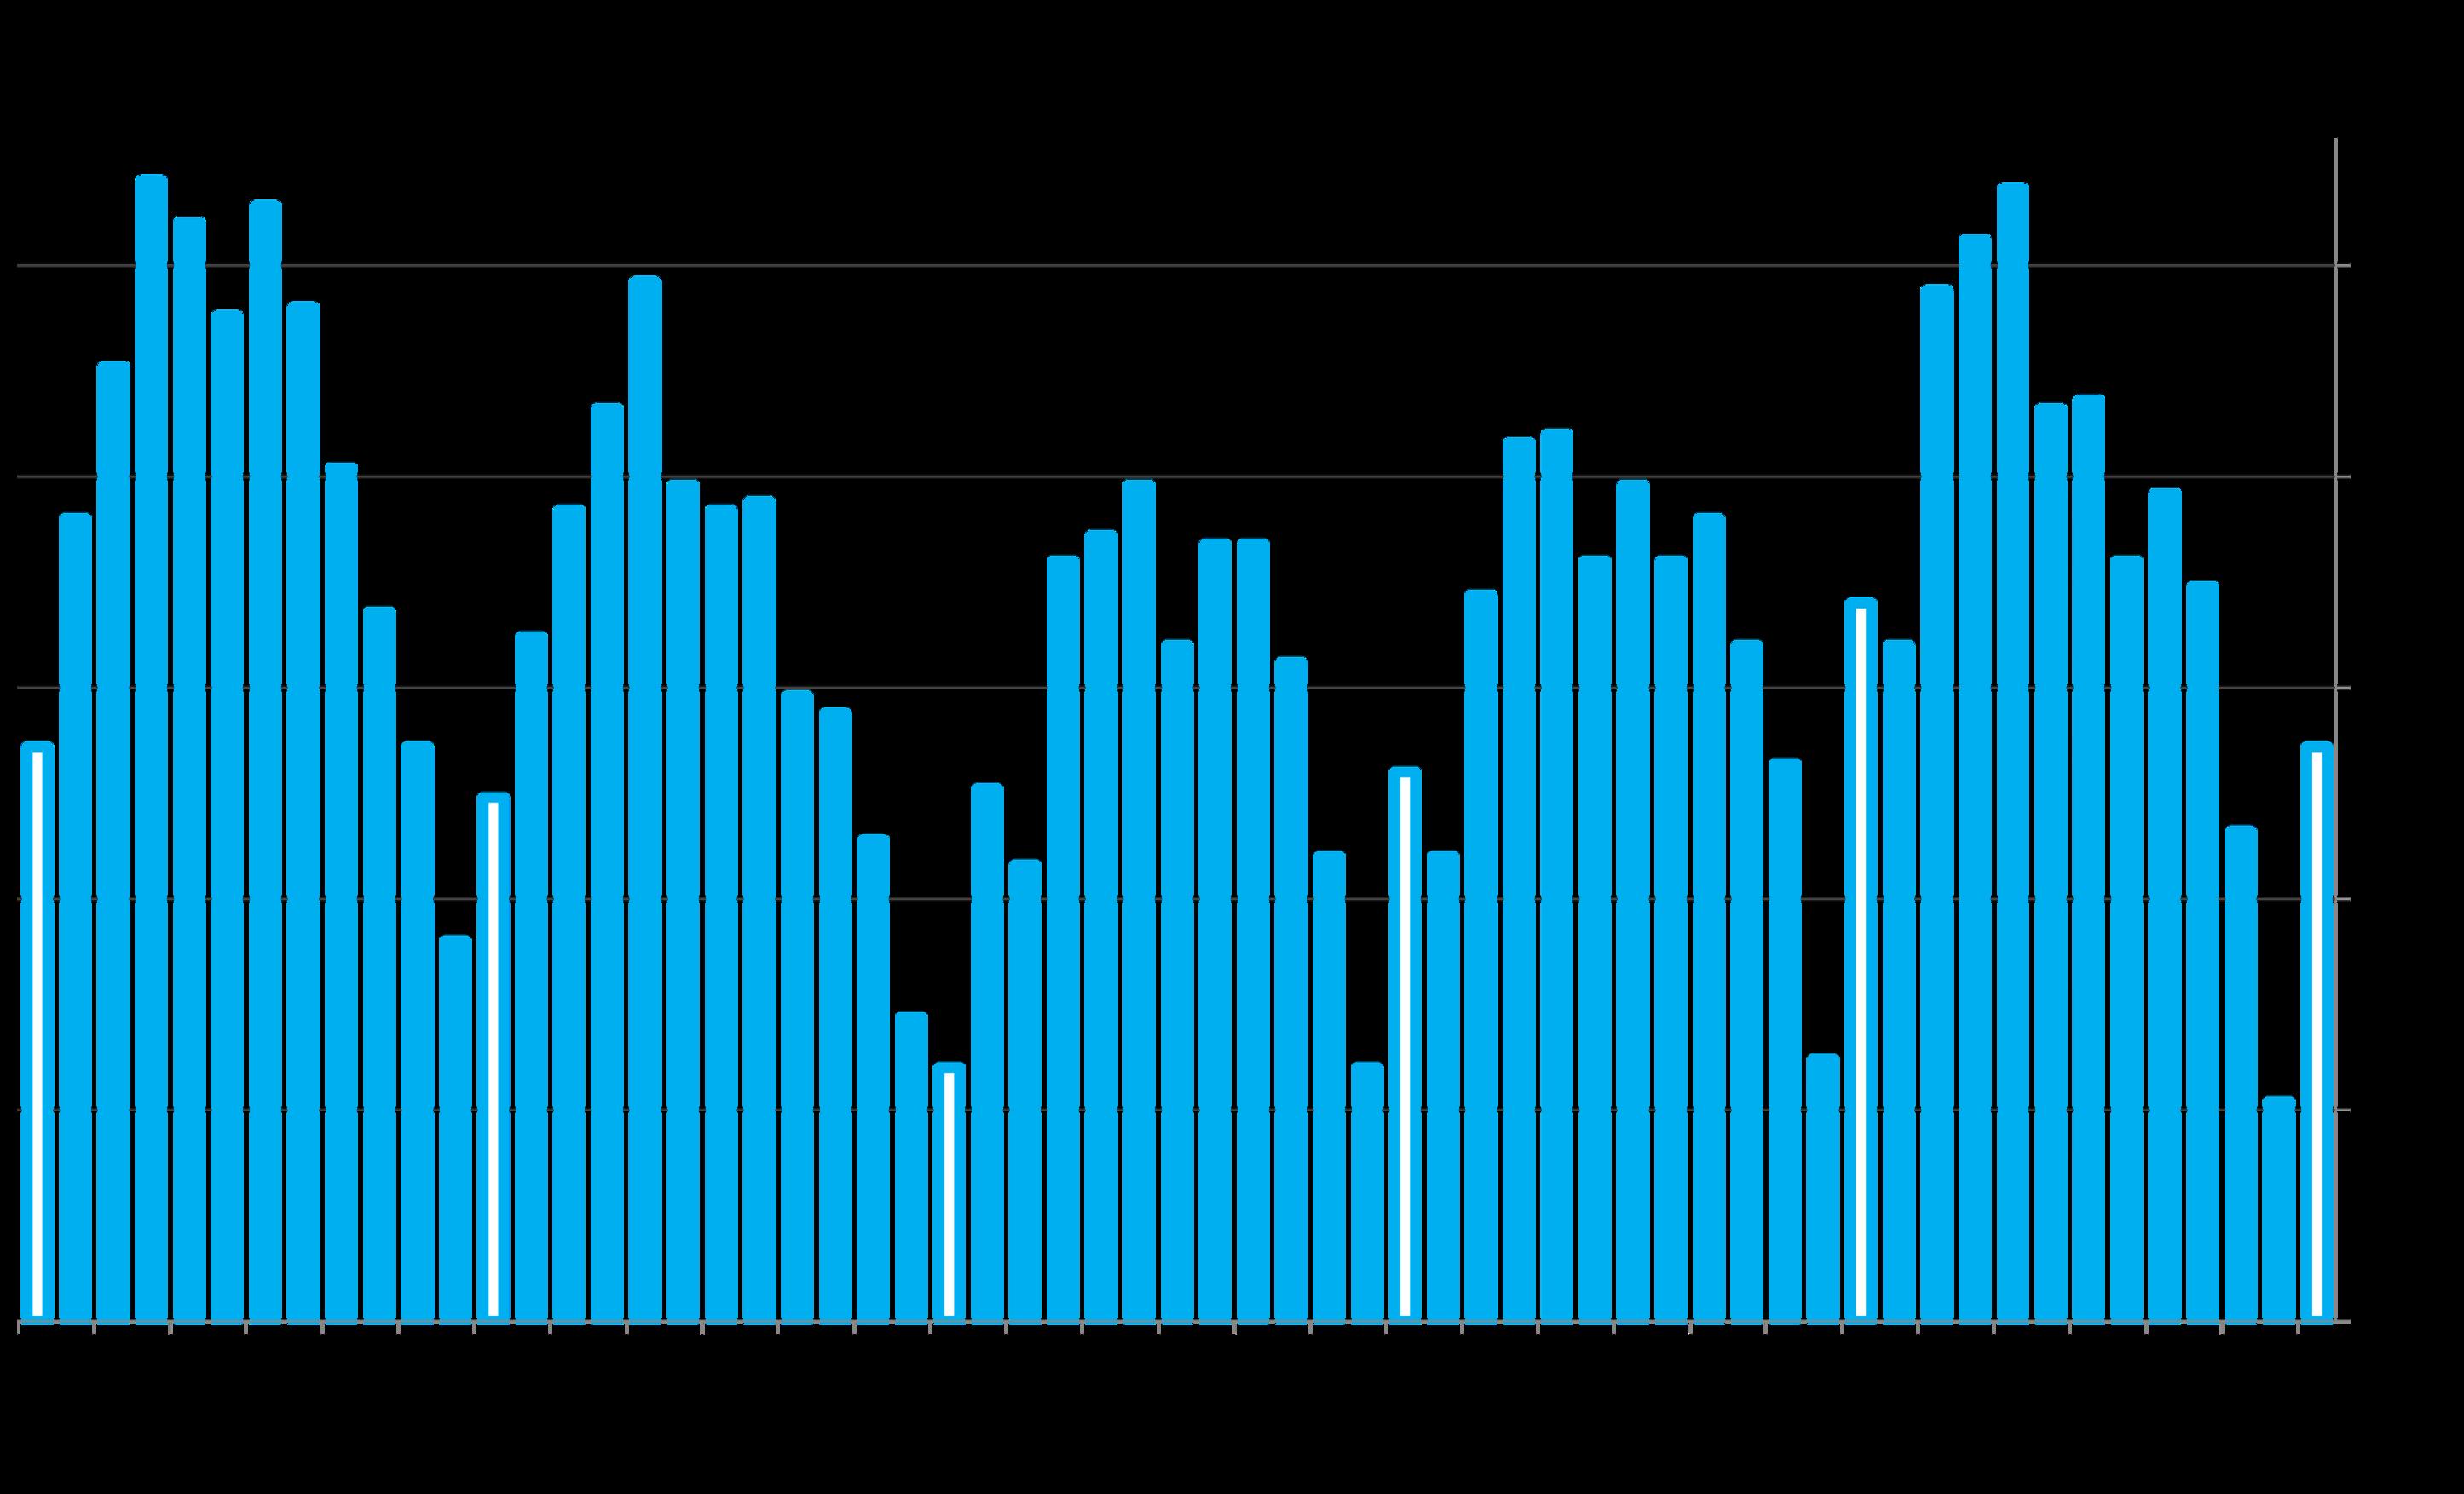
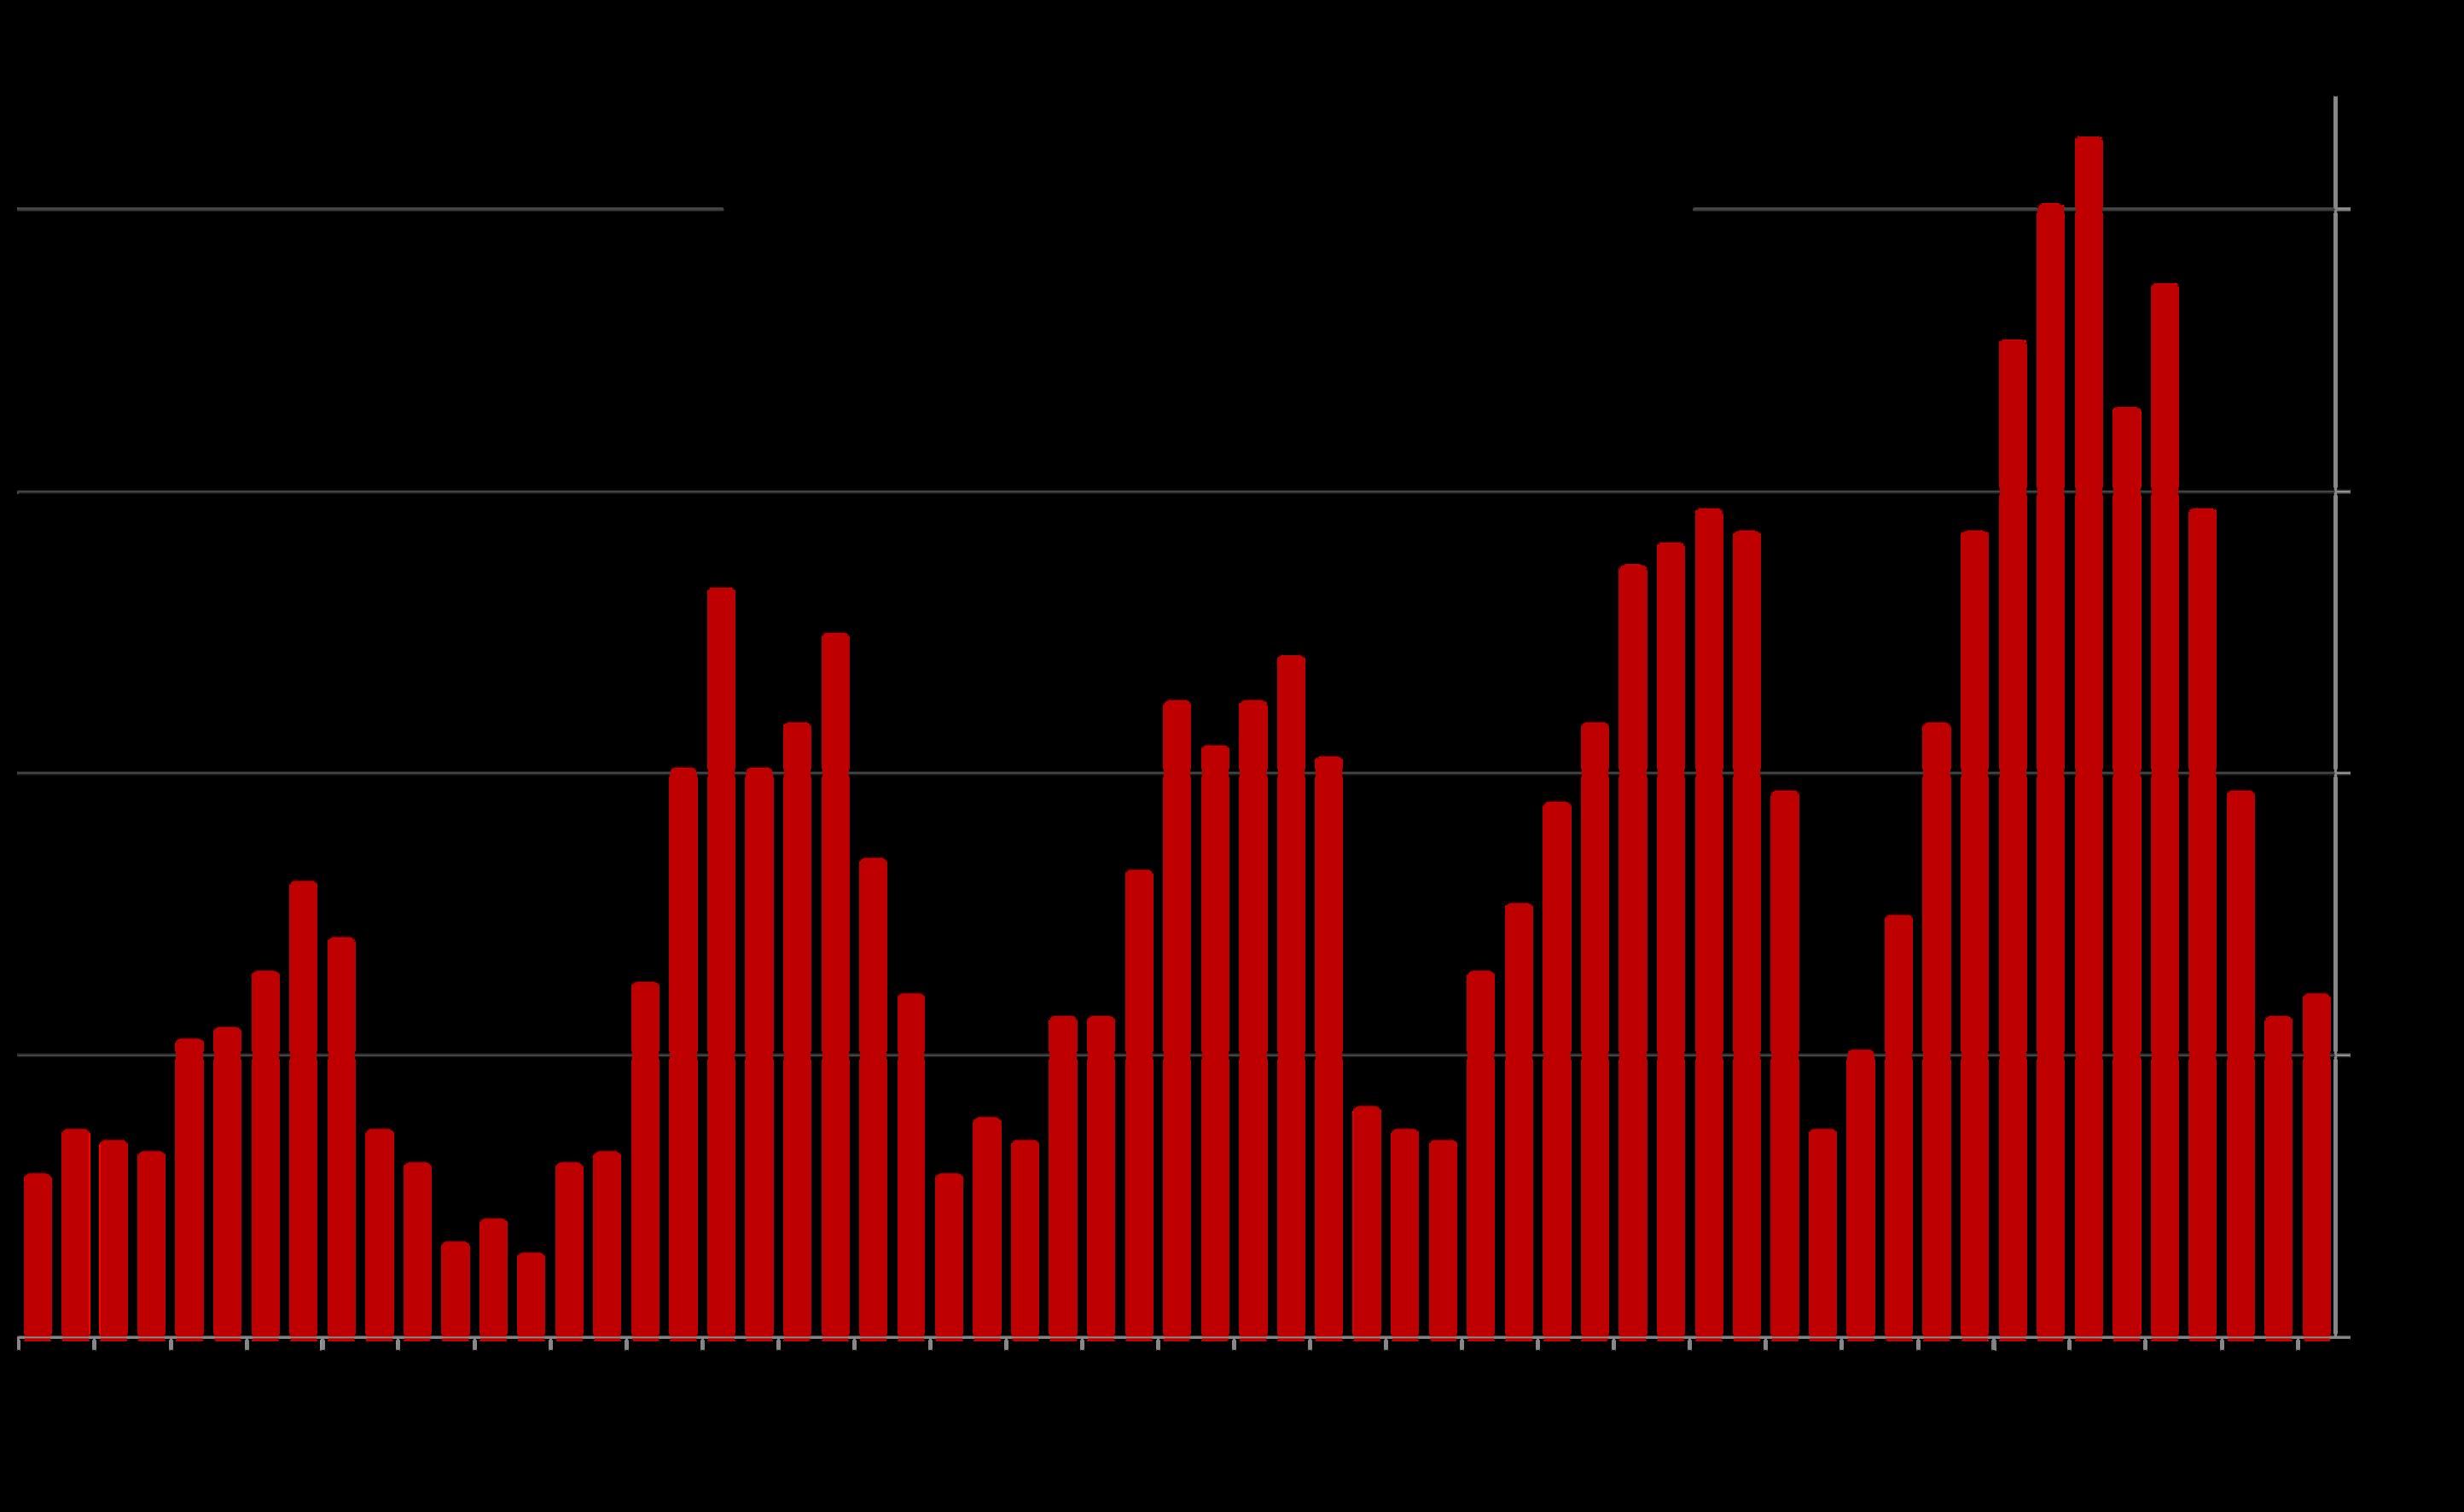
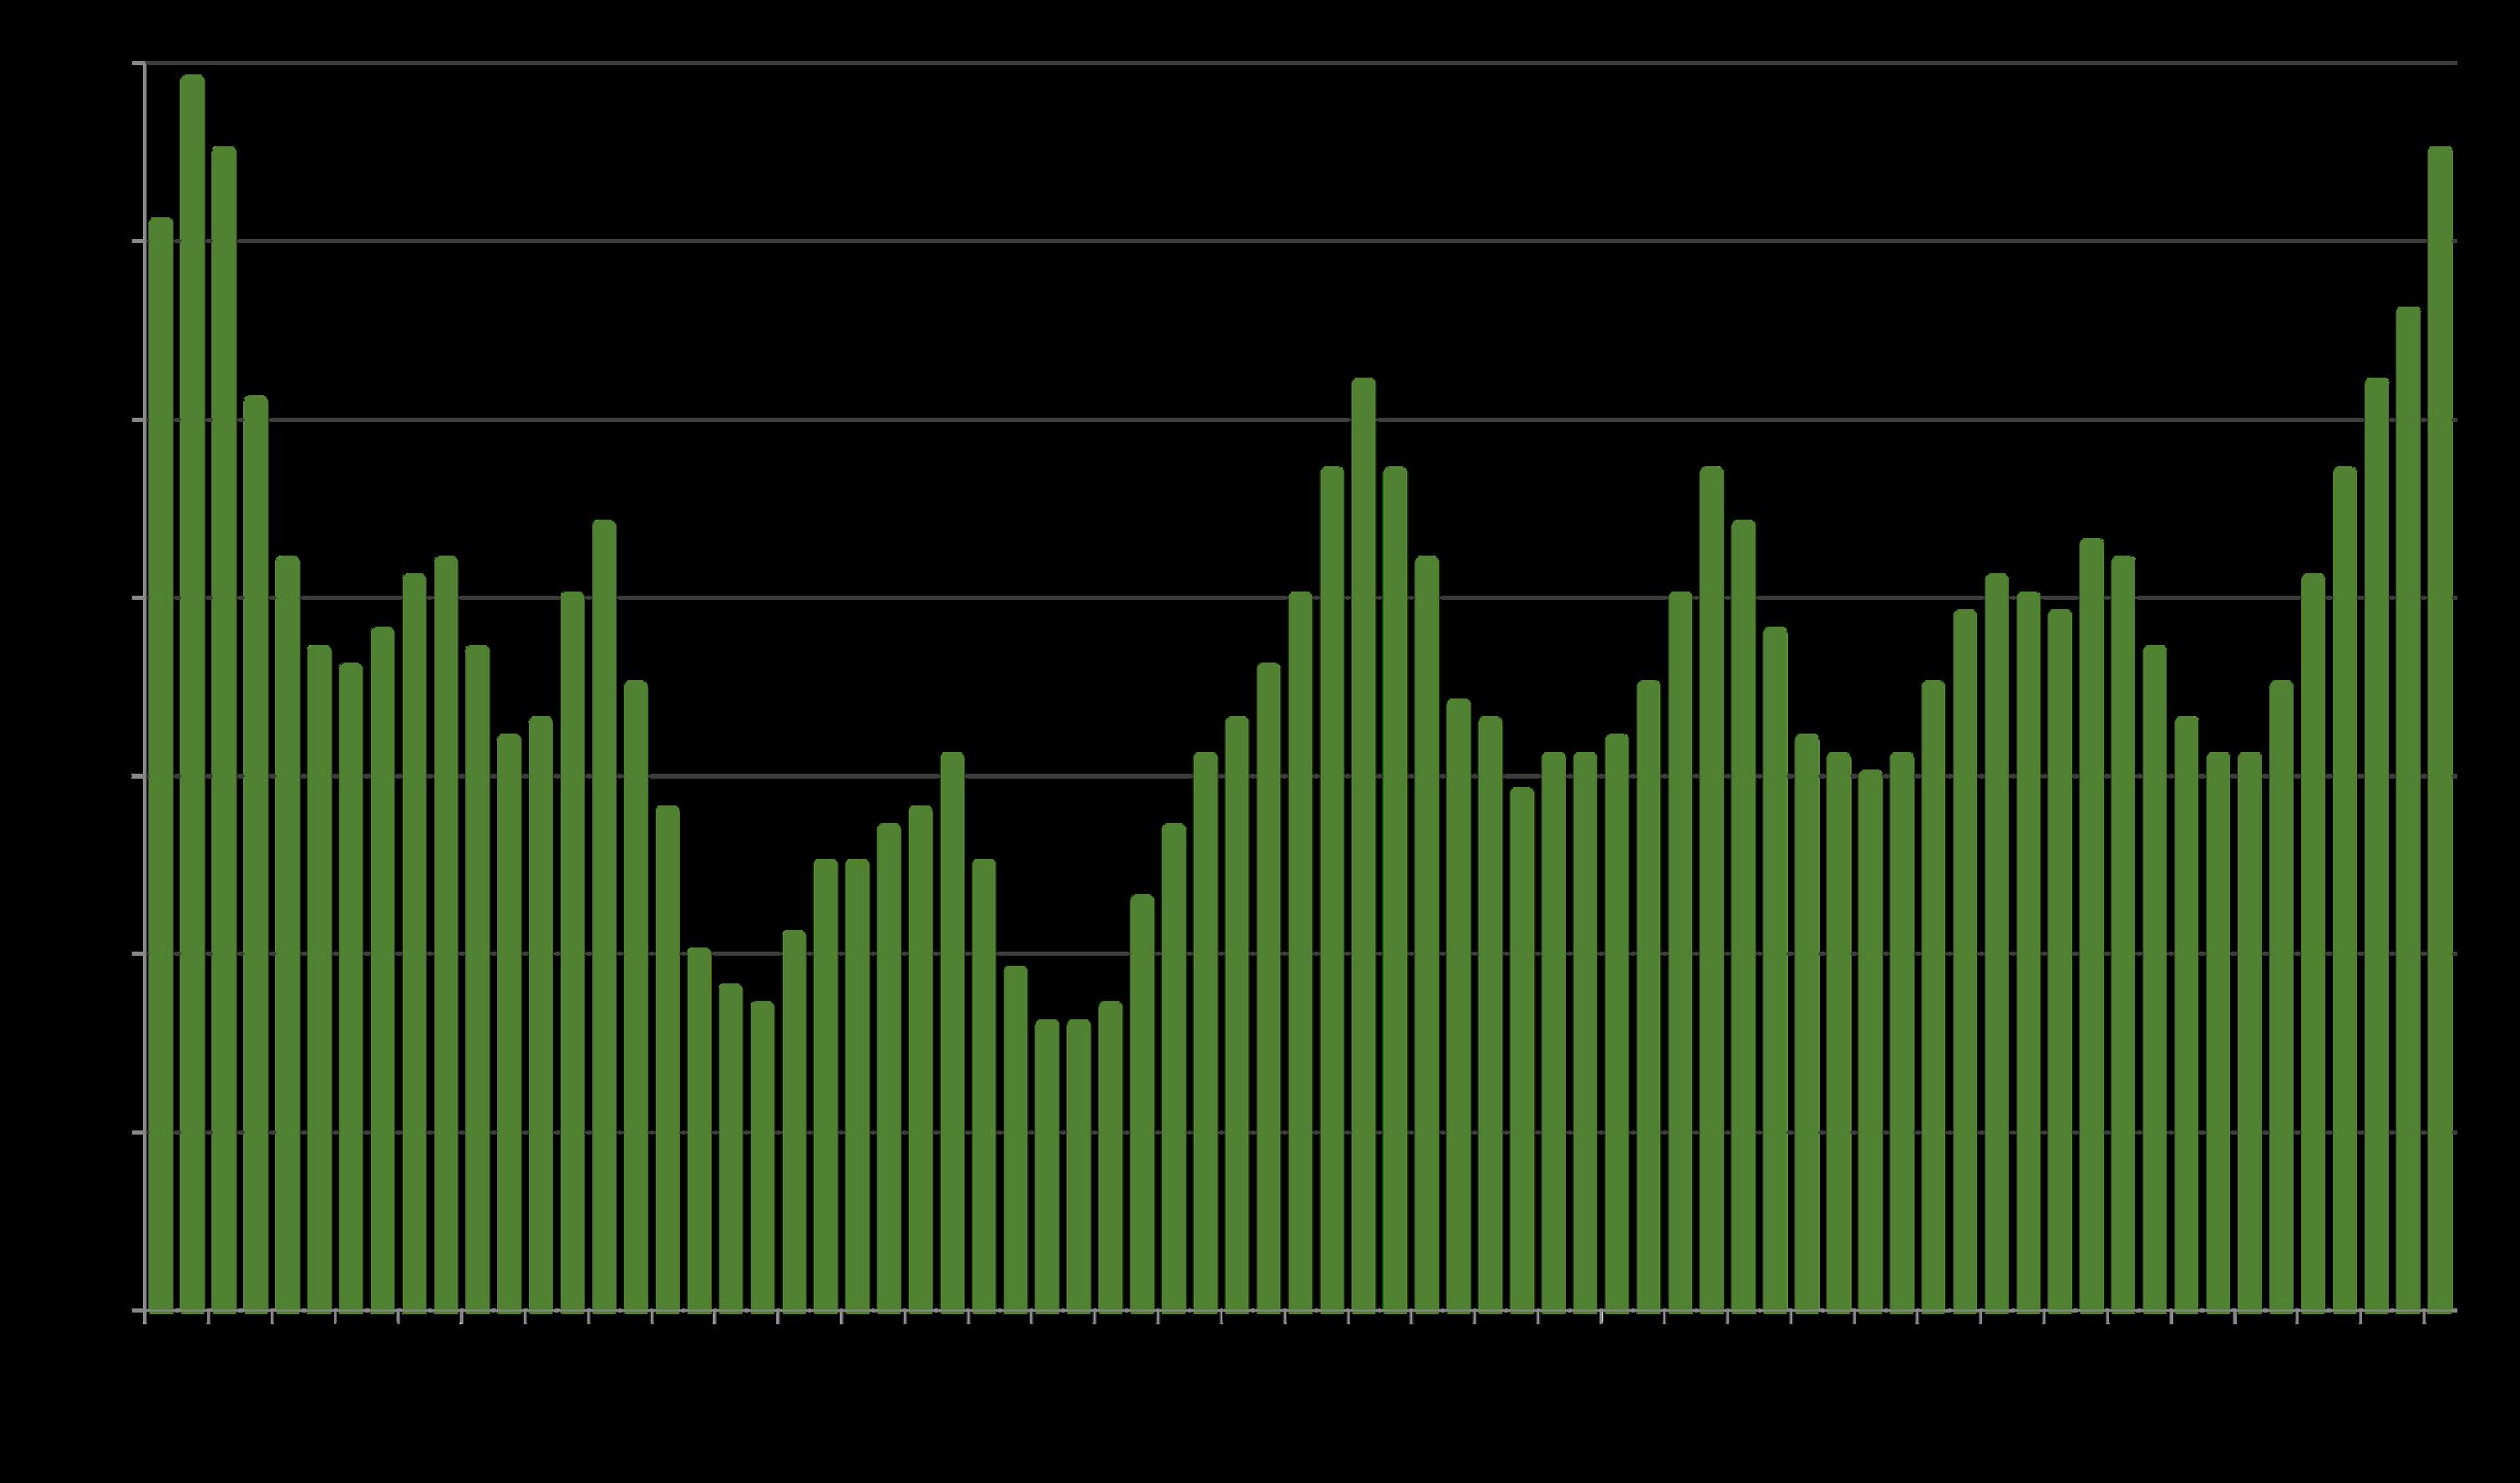
New Listings Coming on Market
The number of new listings coming on market ebbs and flows by seasonal trends, though it can be affected by specific market dynamics.
Santa Cruz County Homes Market
As of 2/1/26, the number of listings for sale was increasing from the typical mid-winter nadir but fell slightly year over year. 77% of listings were houses, 16.5% condos, and 6.5% townhouses.
Listing inventory will typically continue to increase through summer or fall.
The # of active listings on a given day is affected by 1) the # of new listings coming on market, 2) how quickly buyers put them into contract, 3) the sustained heat of the market over time, and 4) sellers pulling their homes off the market without selling.
* Active/Coming-Soon listings posted to NorCal MLS Alliance. Data from sources deemed reliable but may contain errors and subject to revision. Not all listings are posted to MLS. All numbers approximate. The number of active listings constantly changes.
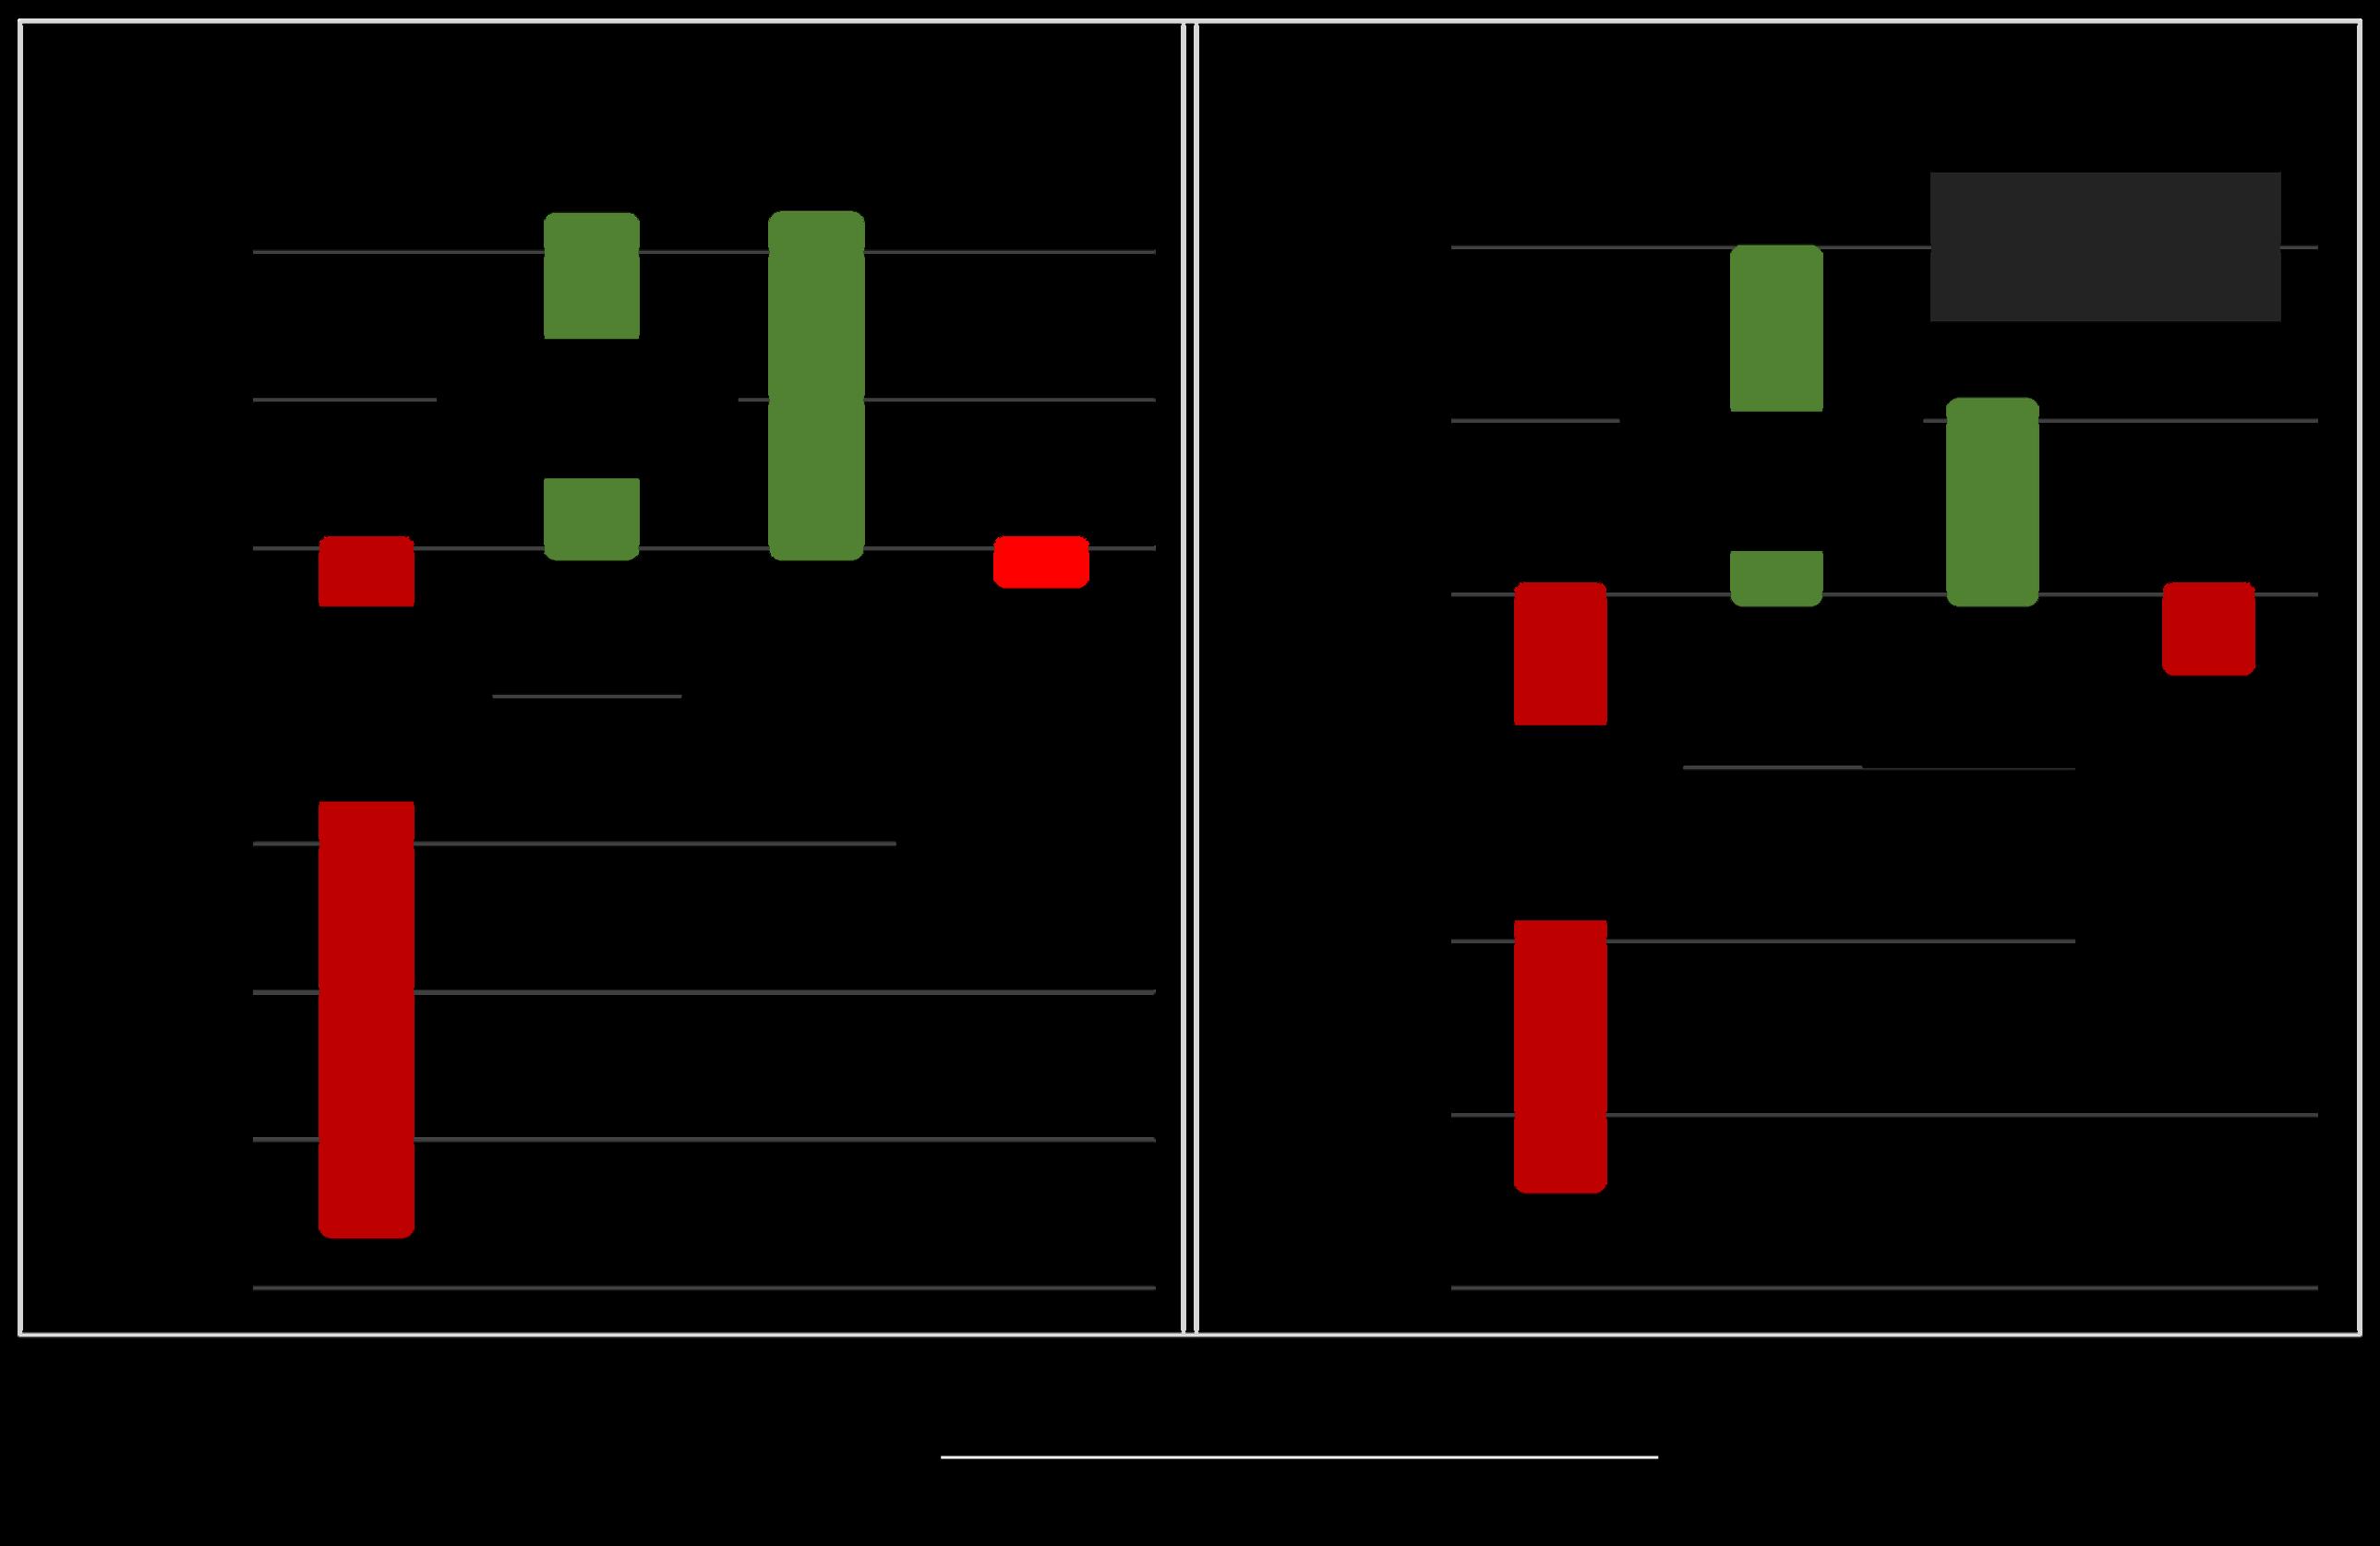
Santa Cruz County
MarketDynamicsbyPrice Segment/Property Type
Market conditions can vary dramatically due to seasonal trends in supply & demand. As of 2/1/26, as the new year’s market is waking up from the midwinter holidays, inventory levels are extremely low.
$1,000,000
$1,000,000
$1,499,999
$1,500,000
$1,999,999
$2,000,000 -
$2,999,999
$3,000,000 -
$3,999,999
$4 Million+
*Active/Coming-Soon Listings & Listings in Contract posted to MLS as of 2/1/26. **Sales statistics per last 12 months of sales, i.e. the annualized rate of activity. ***Months Supply of Inventory measures approx. time required to sell listings for sale at estimated annualized rate of sale: Lower readings signify higher demand compared to supply. Market activity typically ebbs and flows to seasonal trends.
Data reportedto NorCalMLS Allianceand Infosparks,may containerrors andsubject to revision. Notall activityis reported to MLS. All numbers approximate. Statistics based on annualized activity may not apply to current conditions and can be distorted by outlier data (especially in low sales volume segments). Numbers change constantly.
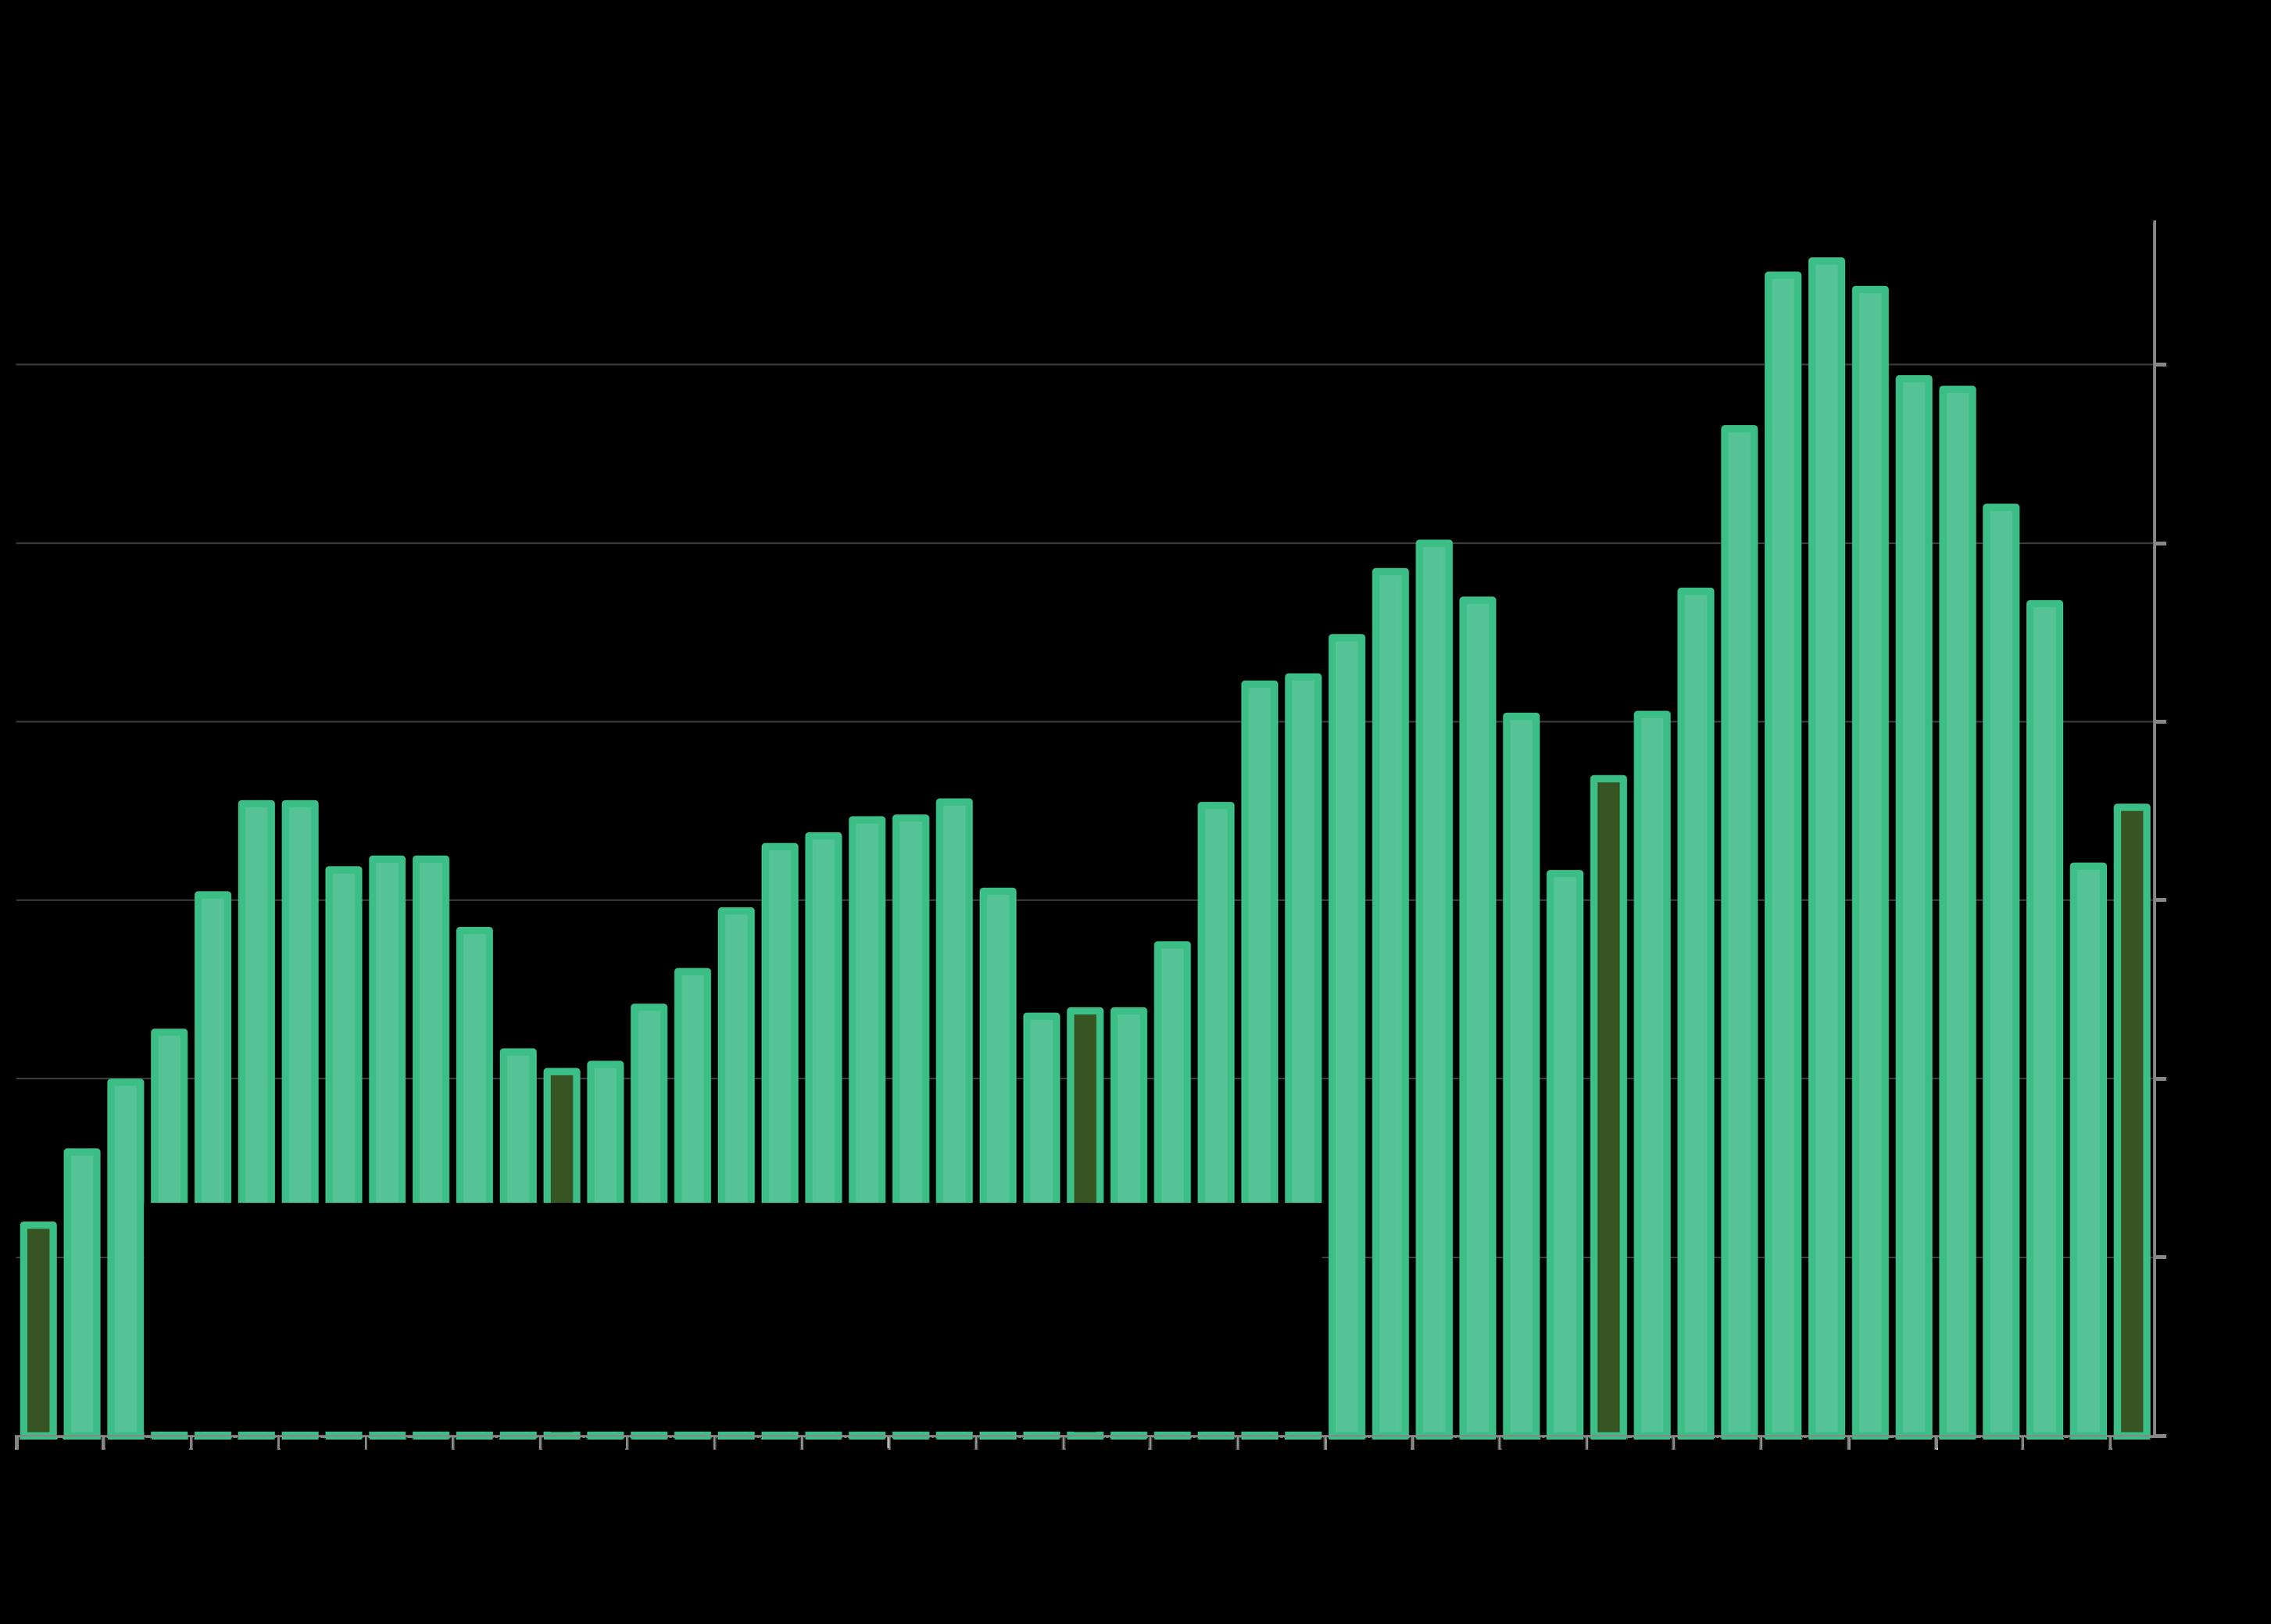
The number of listings going into contract in January 2026 ticked up from the December low count and was essentially unchanged year over year. Market activity should accelerate quickly in coming months.
The pending ratio is the ratio of the pending listing count (listings in contract) to the active listing count within the month. It is an approximate measure of demand vs. supply.
The pending ratio is a version of absorption rate: The higher the percentage, the greater the demand as compared to the supply of listings available to buy.
Sales in one month mostly reflect accepted offers in the previous month. January’s low count generally reflects the slow holiday market of December and early January. Sales volume will usually rise rapidly through spring/early summer.
& Luxury Home Sales Volume
Higher-price home sales ebb and flow per seasonaltrends,typicallyclimbing quicklyin spring. Sales numbers sometimes fluctuate dramatically month to month.
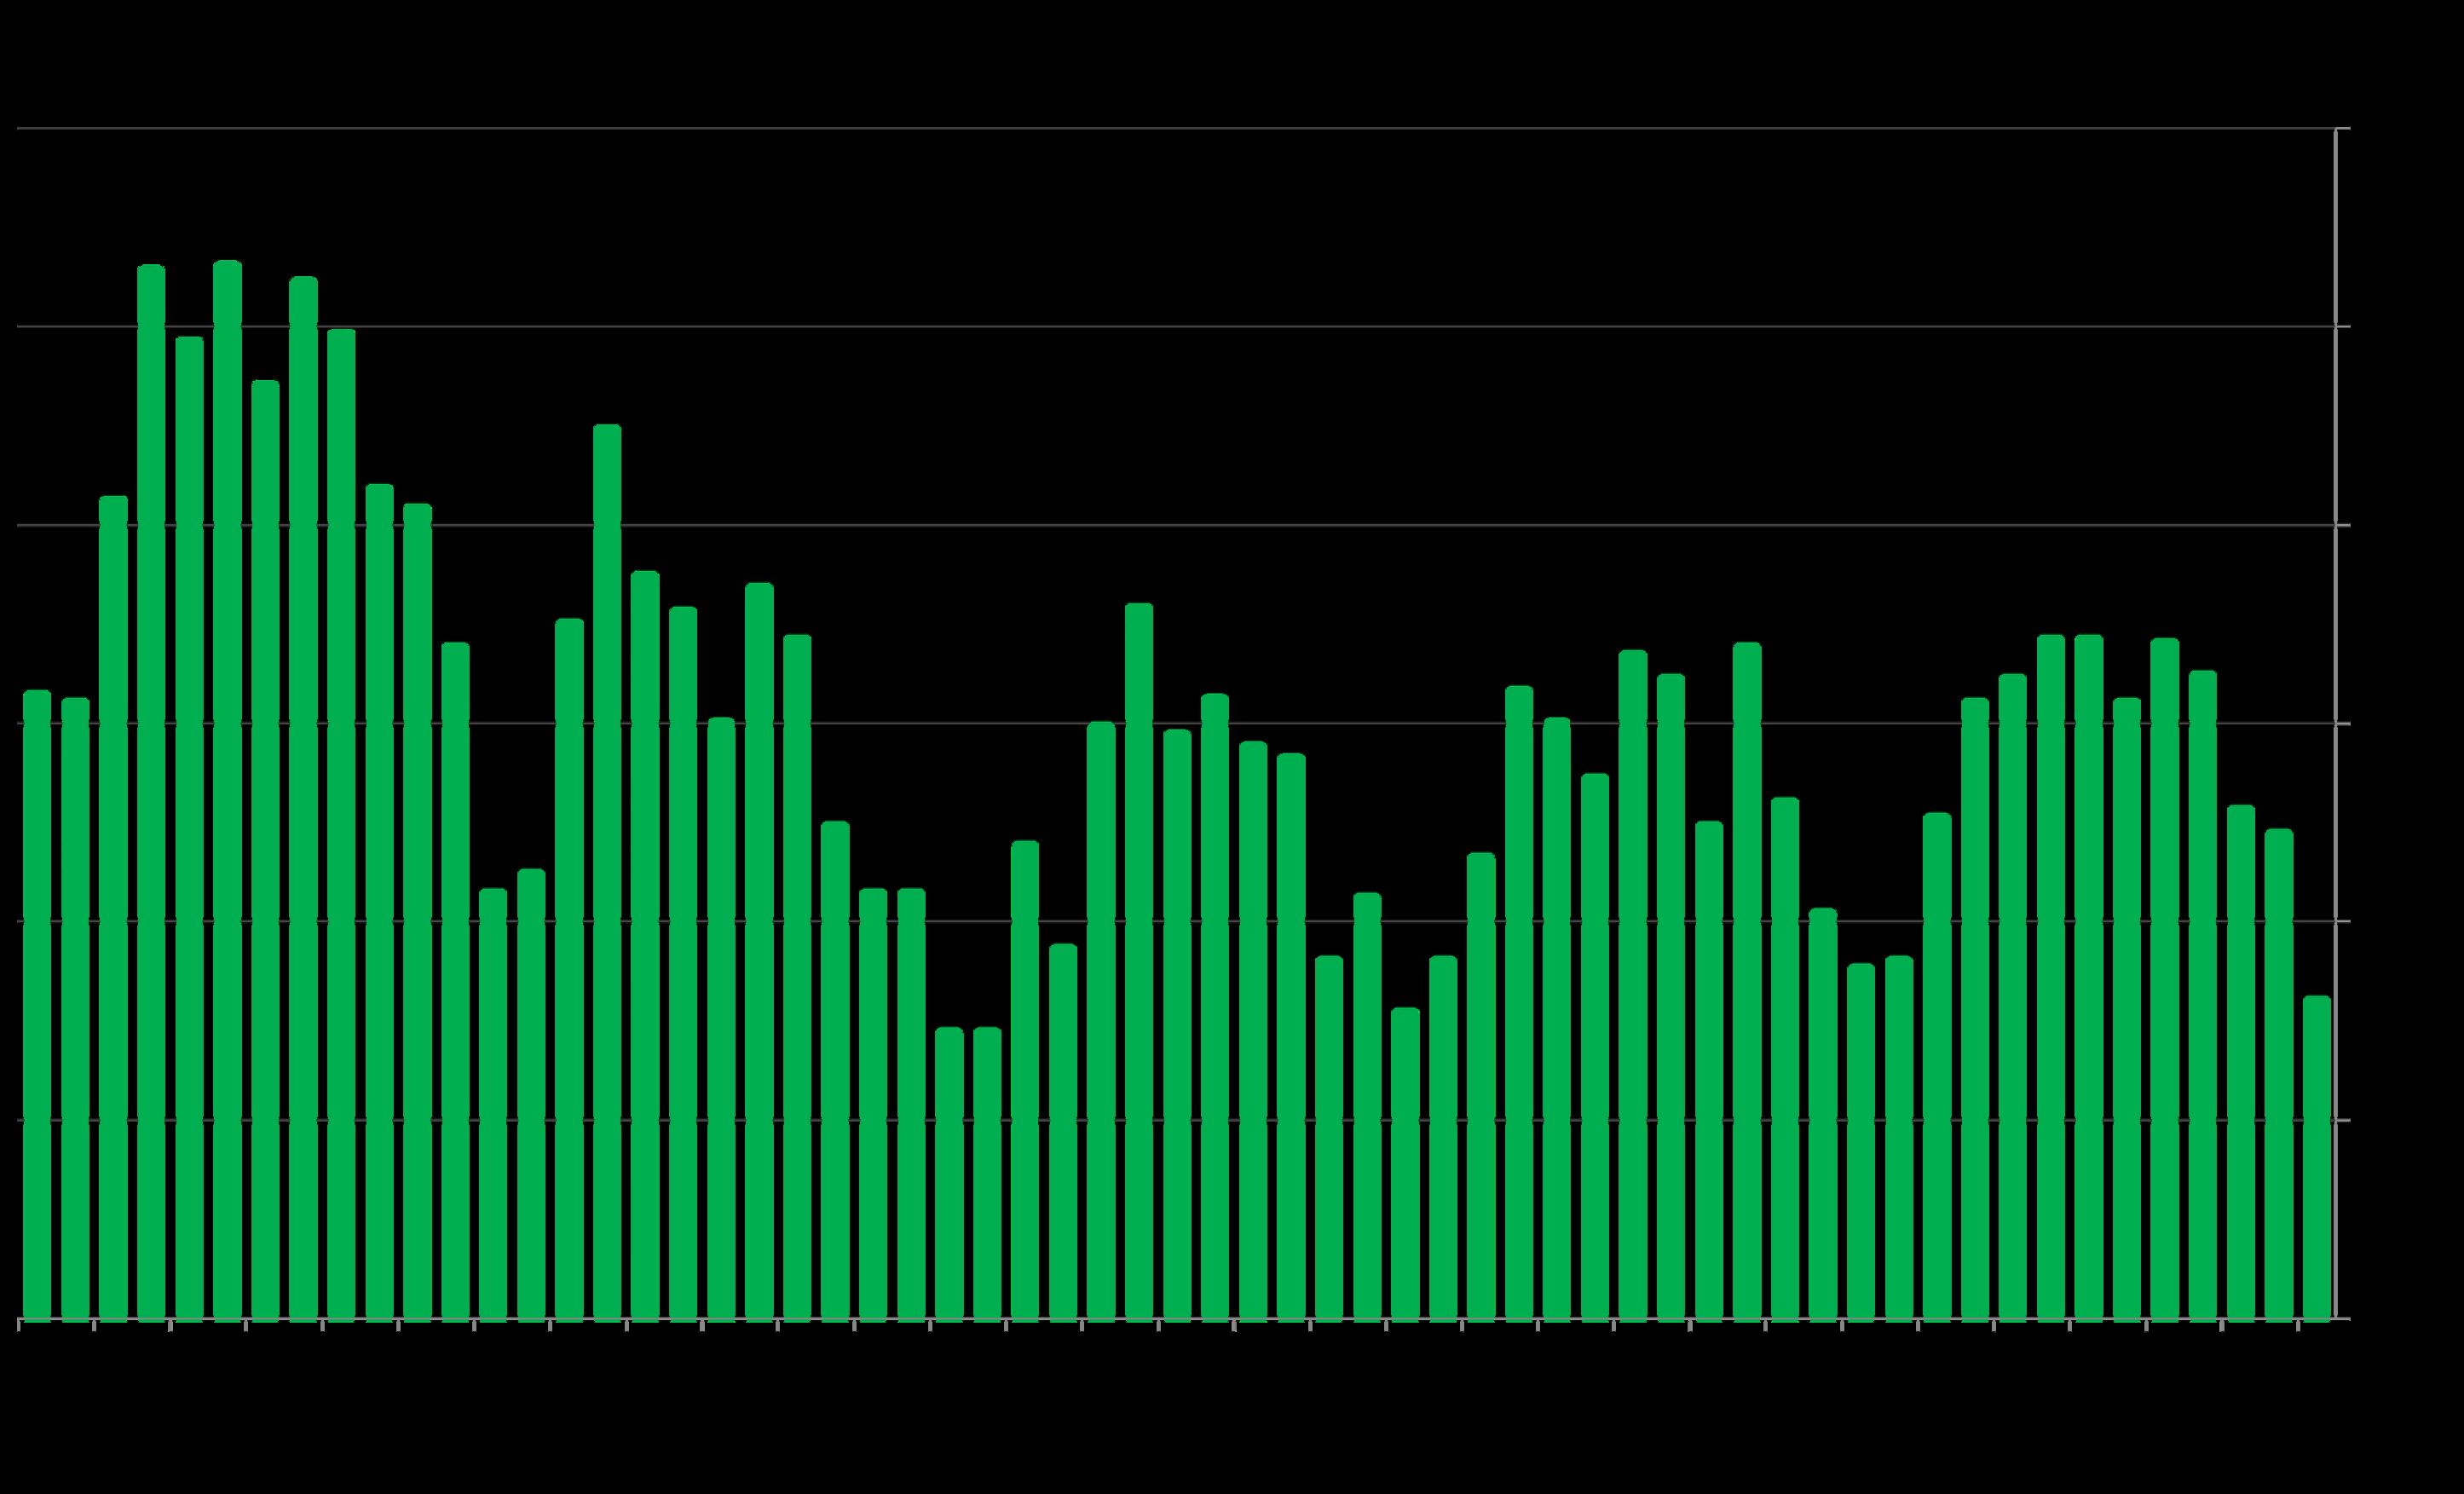
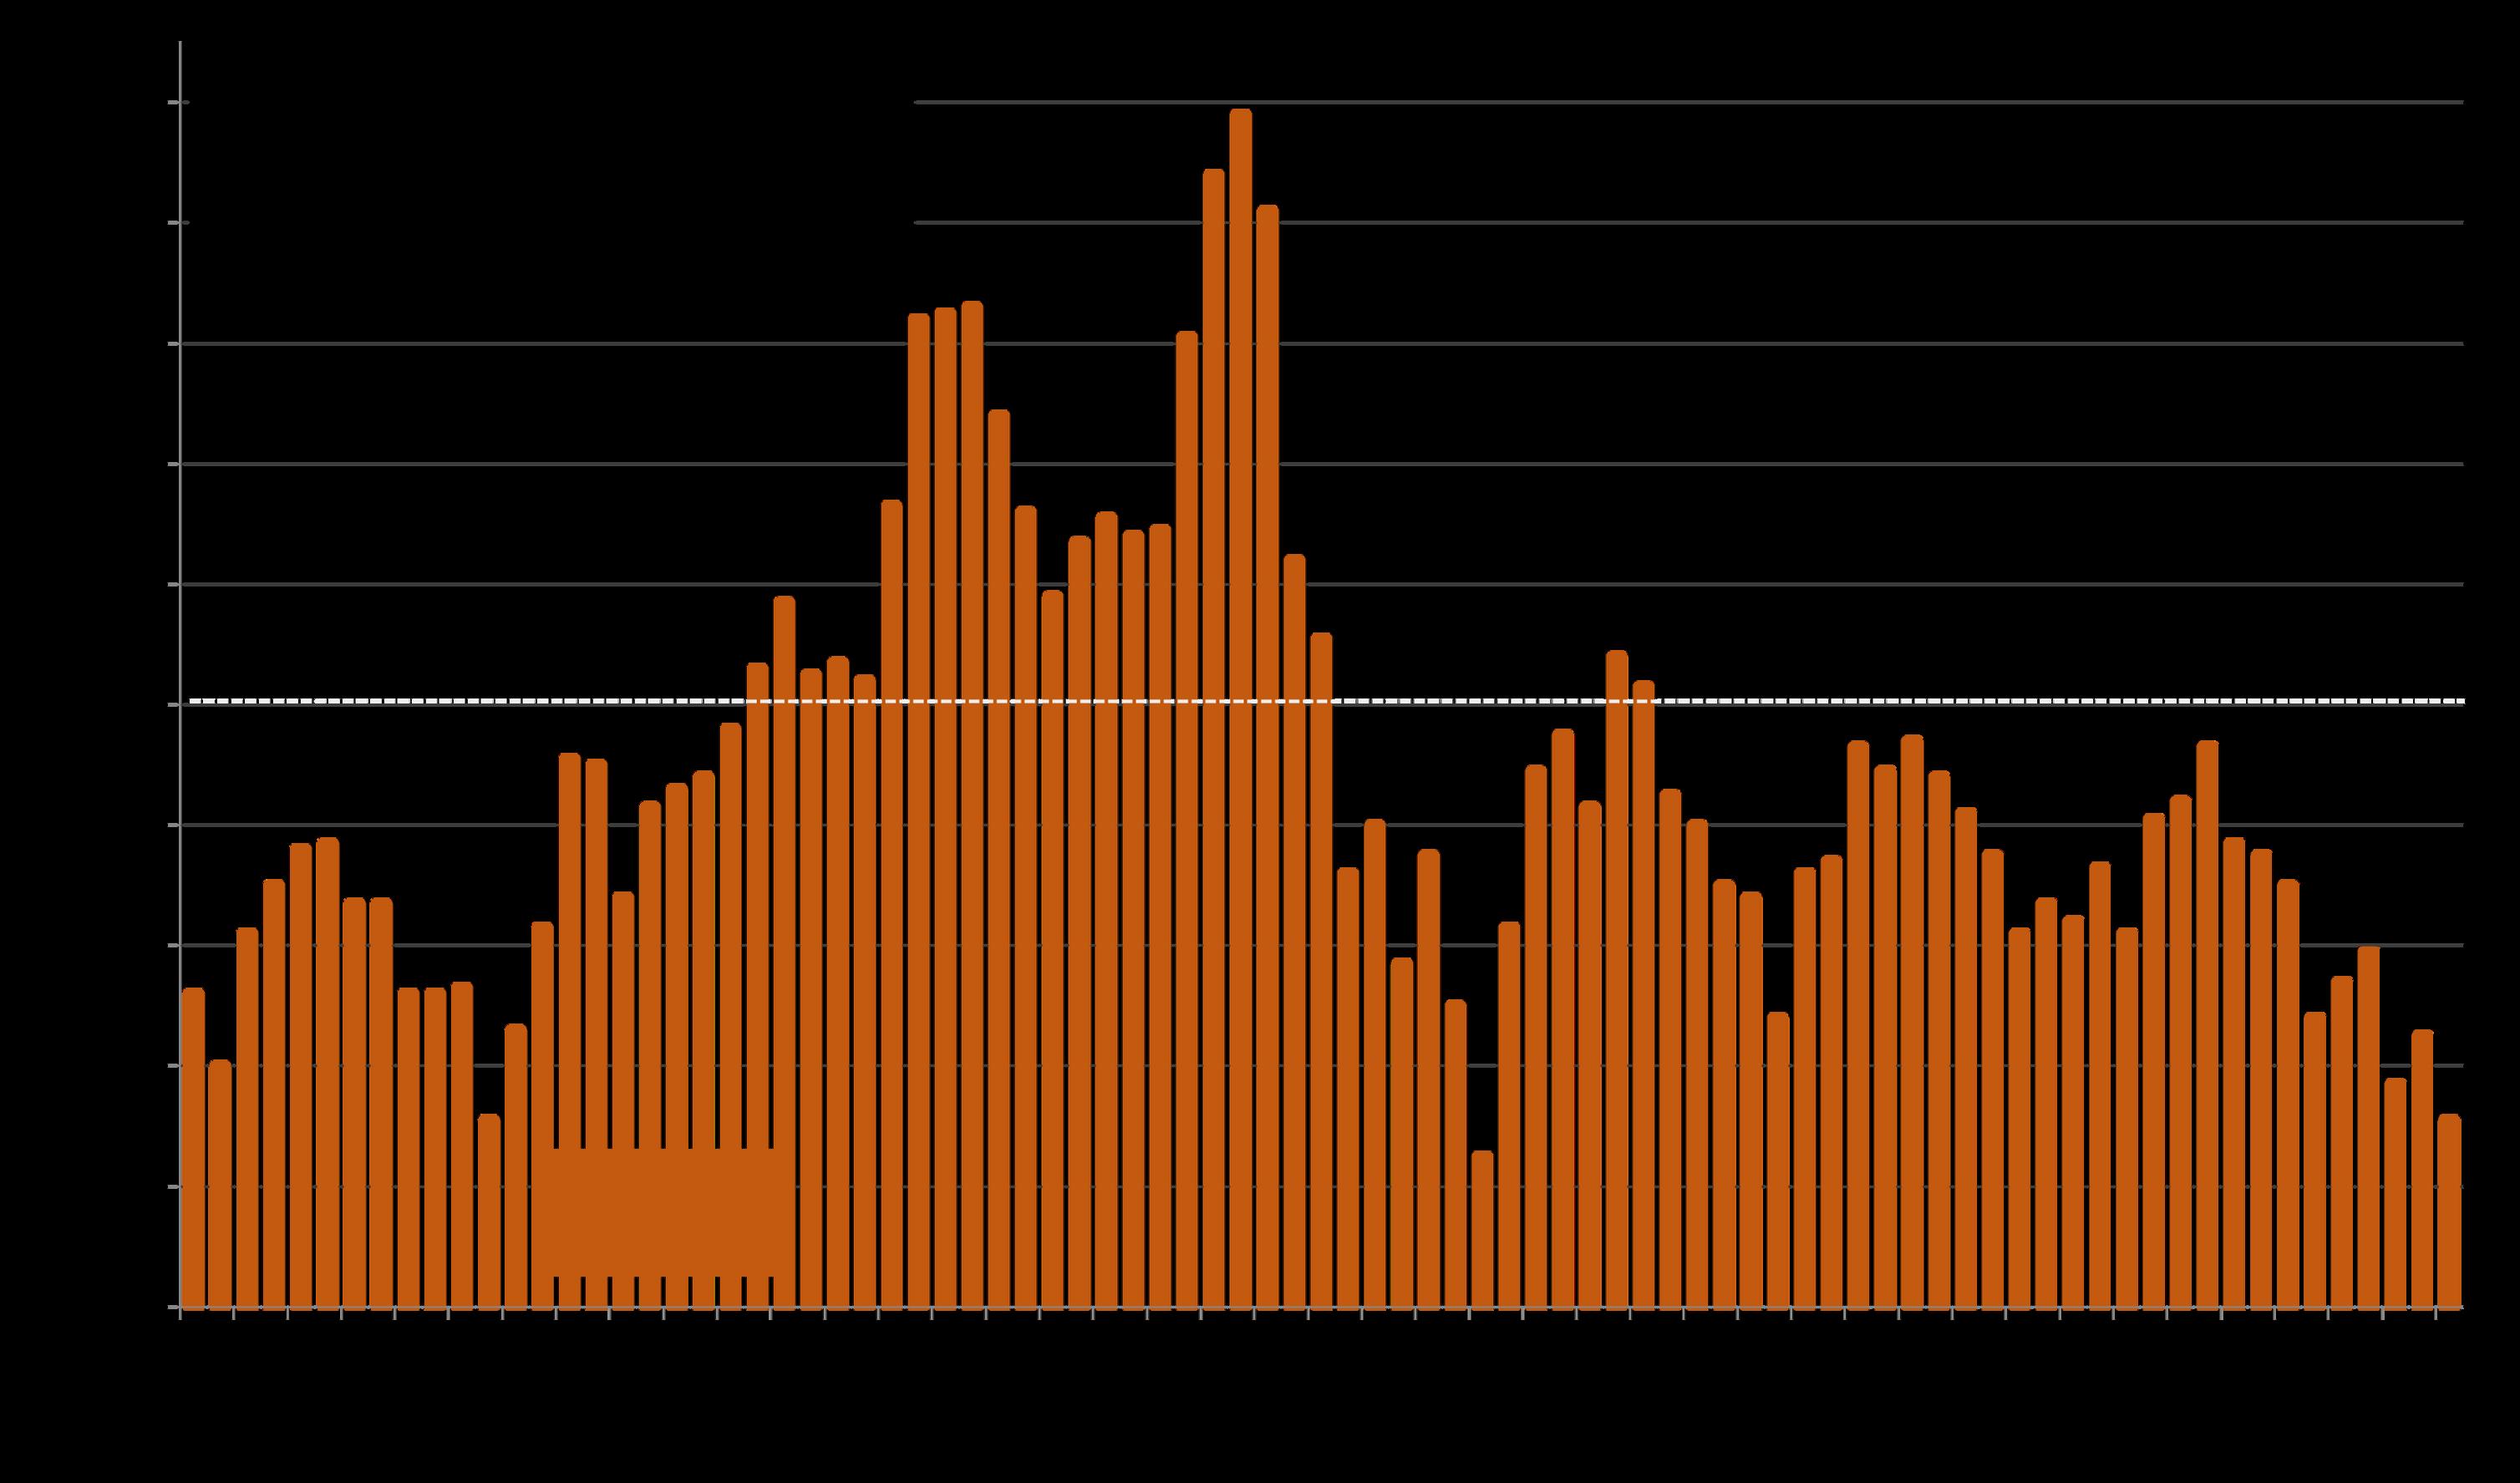
Overbidding List Prices in Santa Cruz County
Percentage of Home Sales Closing over List Price
Sales in 1 month mostly reflect market dynamics in the previous month. Overbidding list price is one of the clearest reflections of buyer demand.
Higher overbidding percentages signify more competition for new listings. The percentage typically peaks in spring. In January 2026, 23% of sales sold over list price, unchanged from January 2025.
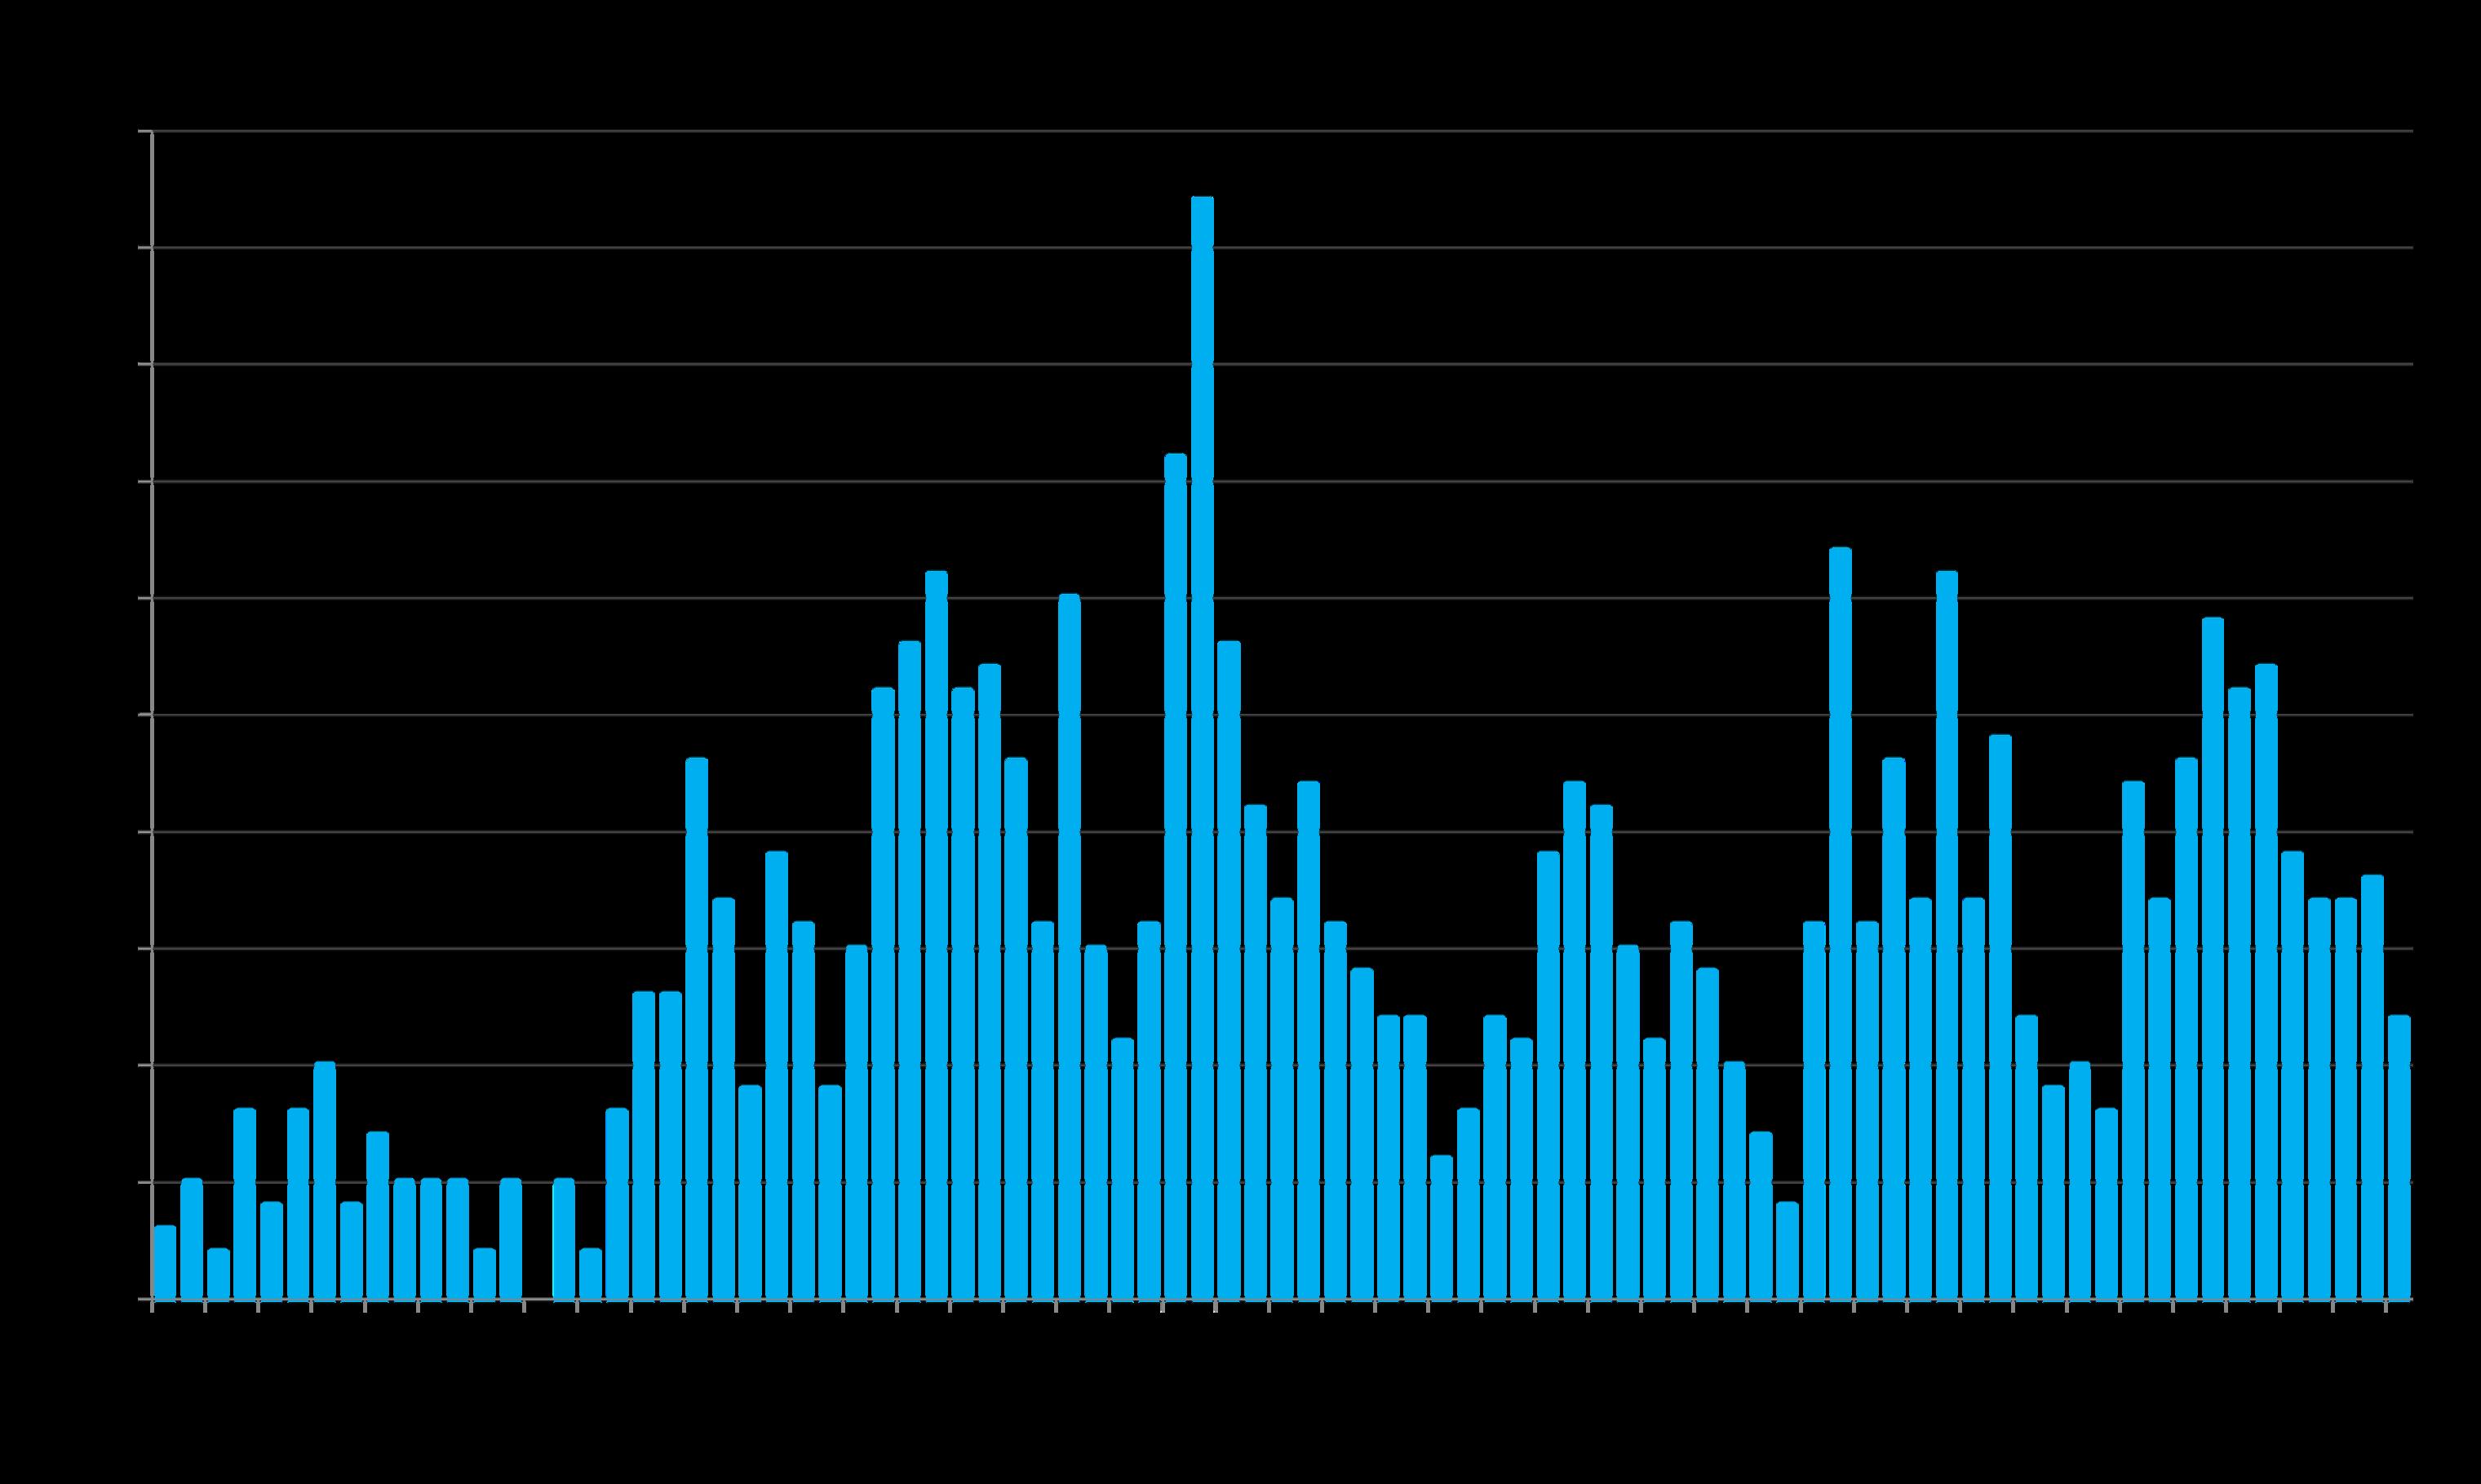
Average Sales Price to Original List Price Percentage
Santa Cruz County Over/Under Bidding: Market Dynamics & Seasonality
100% = an average sales price at original list price. 110% = an average sales price 10% over asking price; 95% = 5% below asking price.
Higher percentages signify greater buyer competition for new listings.
In January 2026, the average home sale sold about 7% below asking price.
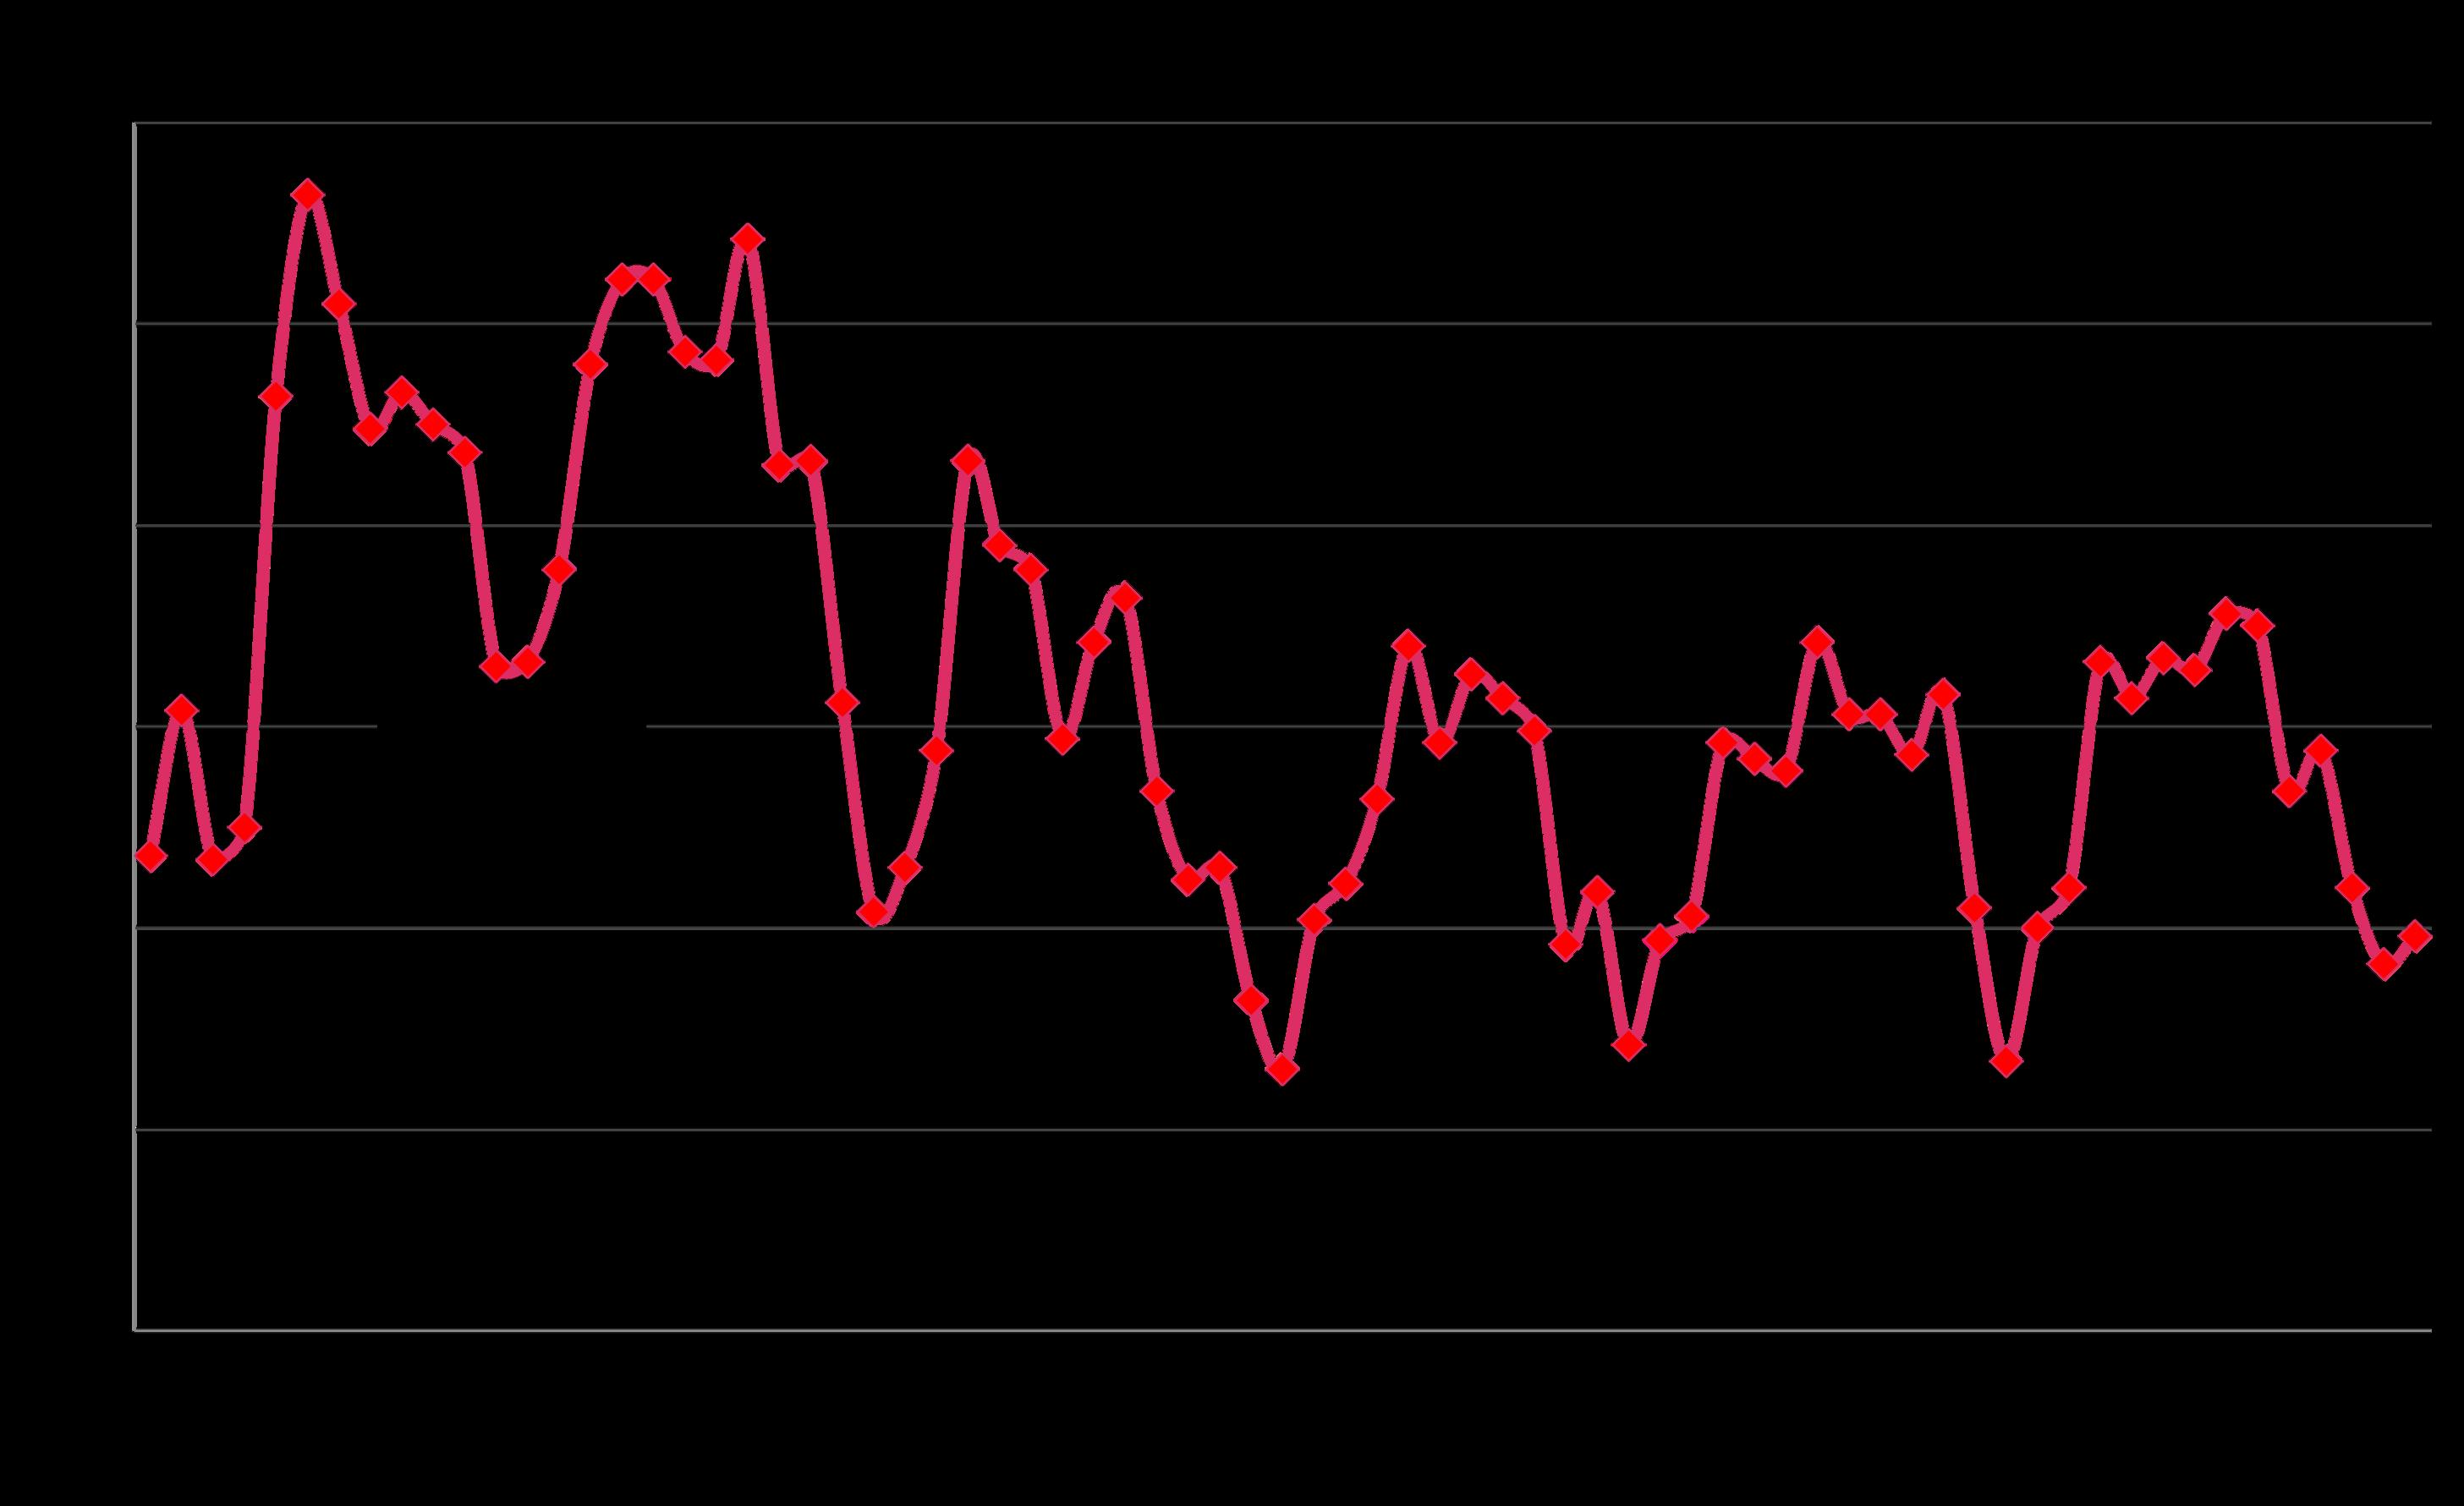
Average Days on Market – Speed of Sale, Since 2020
Homes typically sell fastest in spring as buyers
A measurement of how quickly the listings which sell go into contract, this statistic fluctuates by season and is a lagging indicator of market activity 3-6 weeks earlier.
respond to the rush of new listings. In midwinter, sales are dominated by listings that have been on the market for longer periods of time.
3-month-rolling sales of houses, condos, townhouses reported to NorCal MLS Alliance, per Infosparks. Data derived from sources deemed reliable but may contain errors and subject to revision. All numbers approximate and may change with late-reported sales.
Selected Economic & Demographic Data
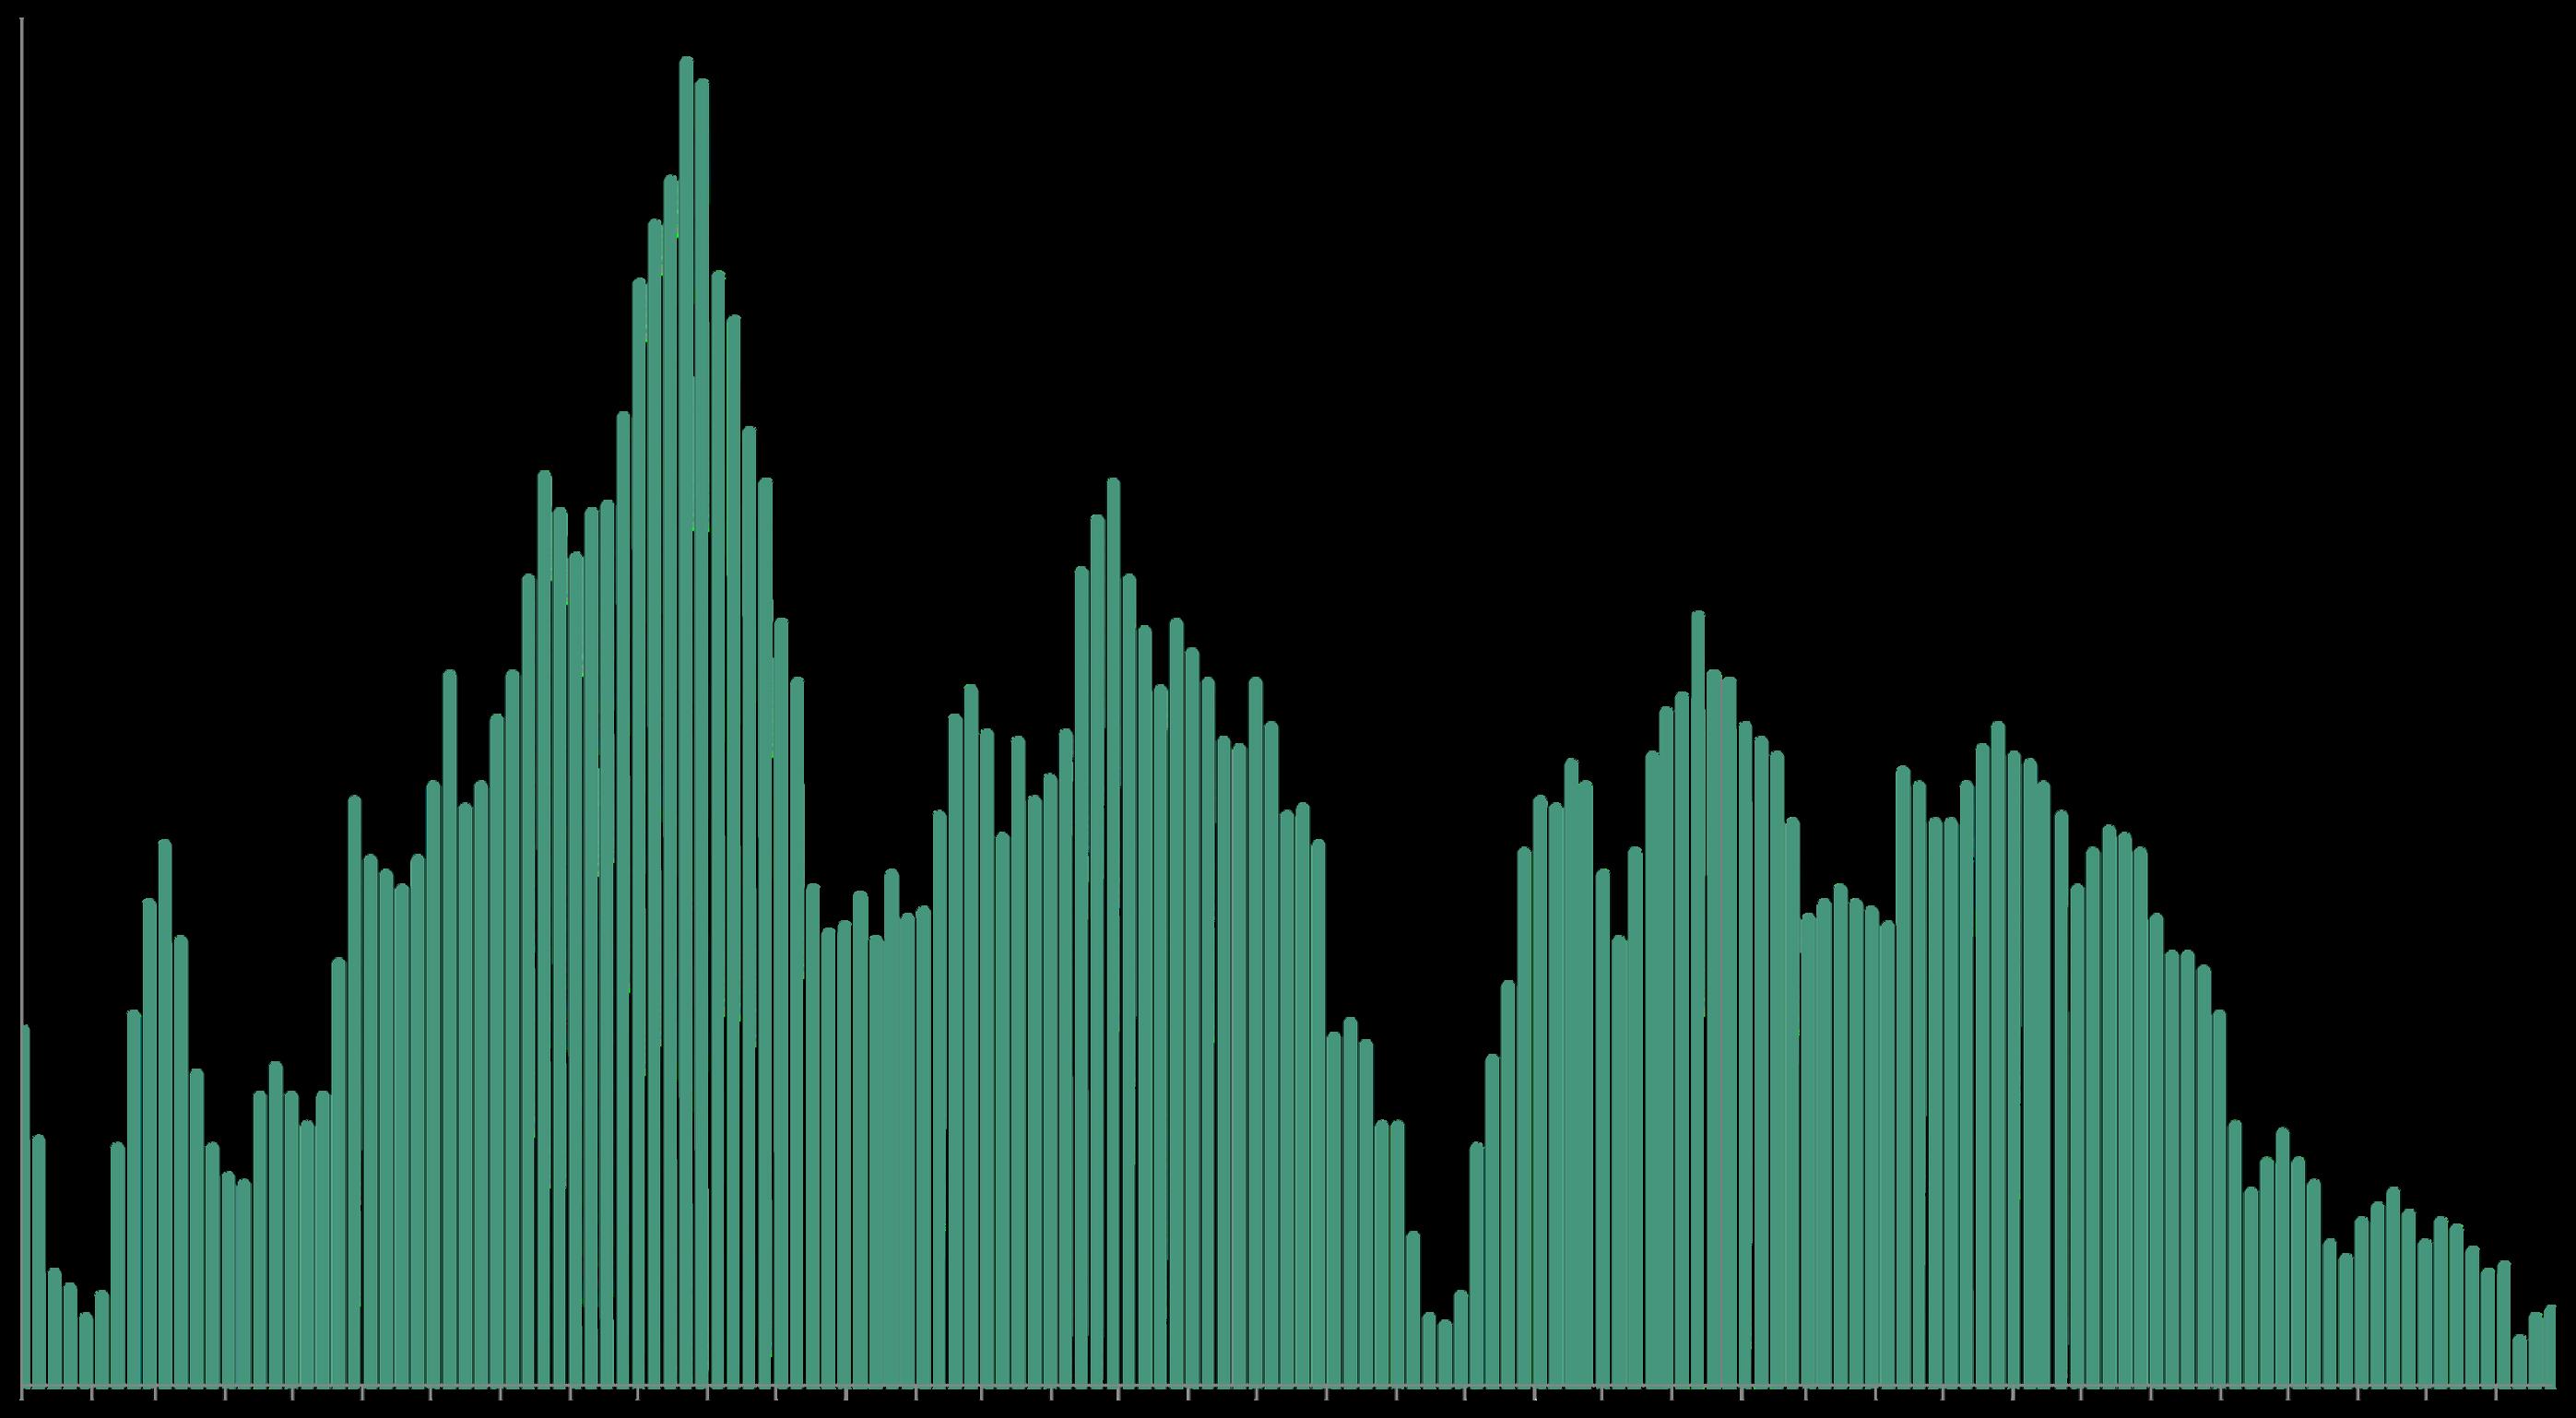
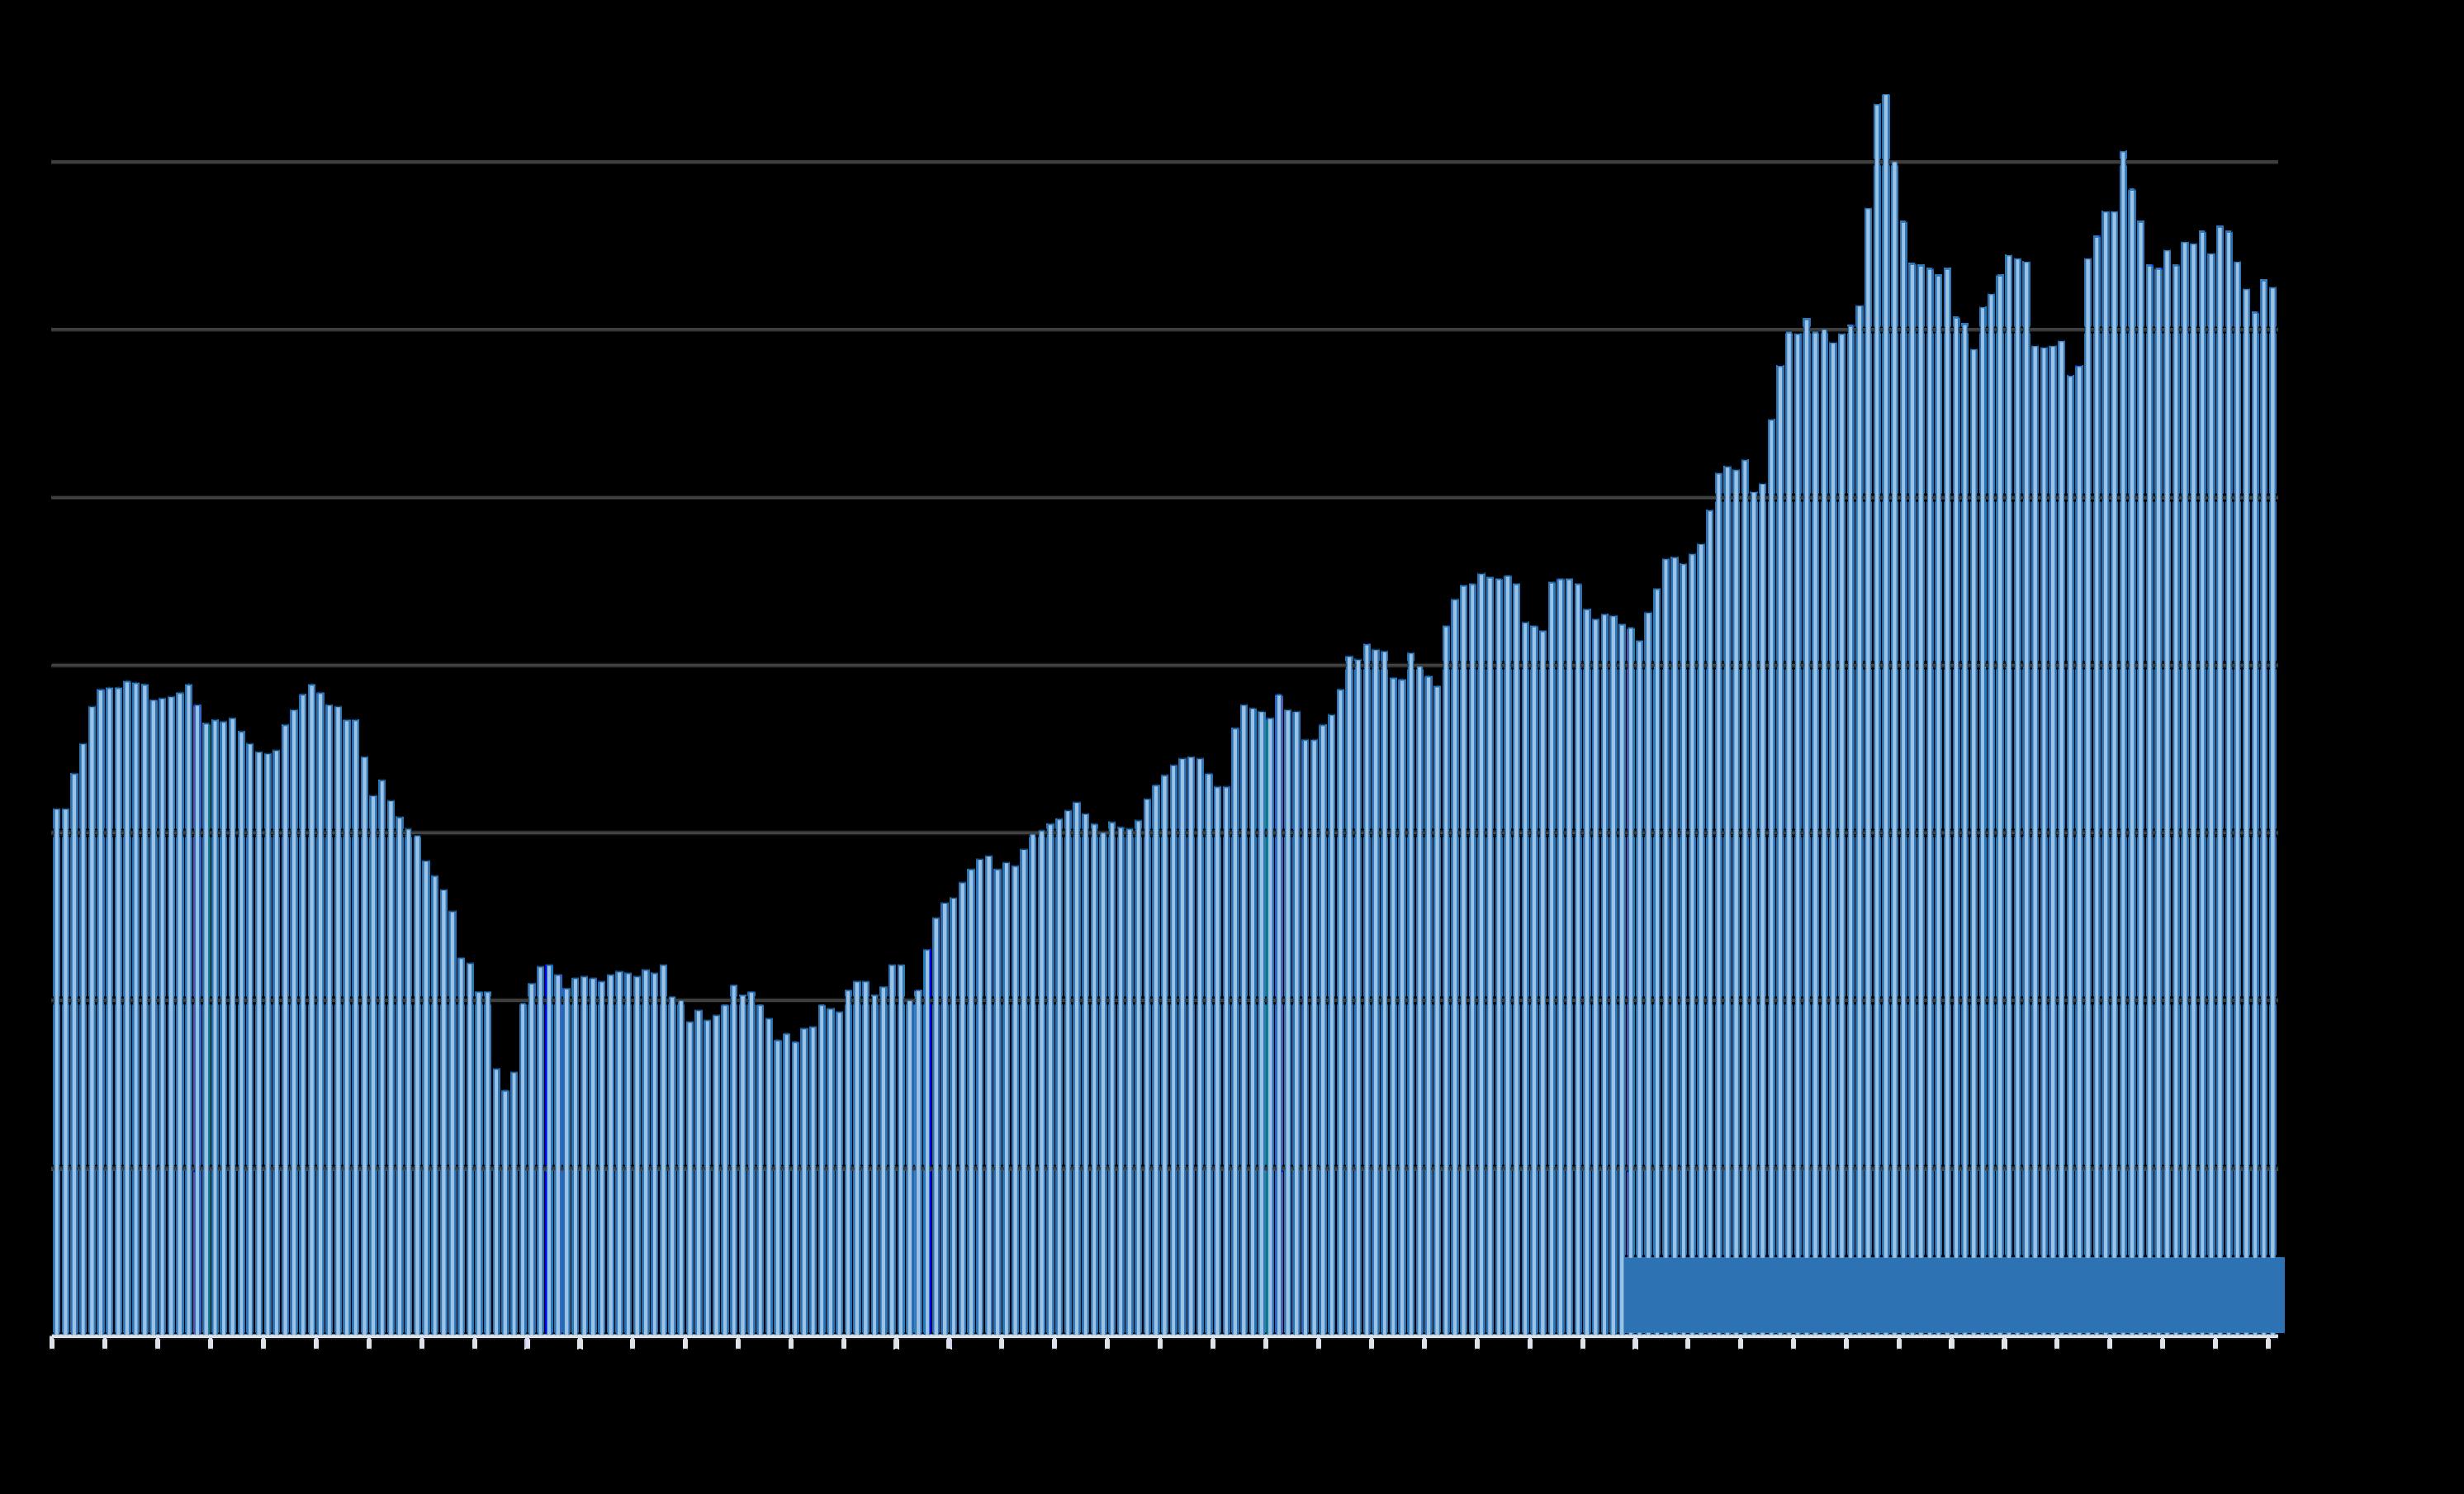
Federal Funds Interest Rate since 1981
& Economic Interventions by Federal Reserve Bank*
◄ Early 1980’s: Fed aggressively raises fed funds target rate to lower inflation rate
In September 2024, the Fed reduced the rate by a half point, and then by a quarter point in November and December. In September, October and December 2025, the rate was reduced by a quarter point each time. There was no change in January.
Junk bond
Subprime crash: Fed drops rate 10 times to effectively zero in 2007-08 boom
2019, 2020, 2021: With the pandemic, the Fed drops the rate to effectively zero High-tech & 2022/2023: Acting to counter inflation, Fed increases target rate 11 times, then pauses 8/2023 –8/2024
Subprime pandemic booms
* Per Federal Reserve Bank of St. Louis and New York; https://fred.stlouisfed.org/series/FEDFUNDS; Last reading per https://www.newyorkfed.org/markets/reference-rates/effr. Other data referenced from sources deemed reliable but may contain errors and subject to revision.
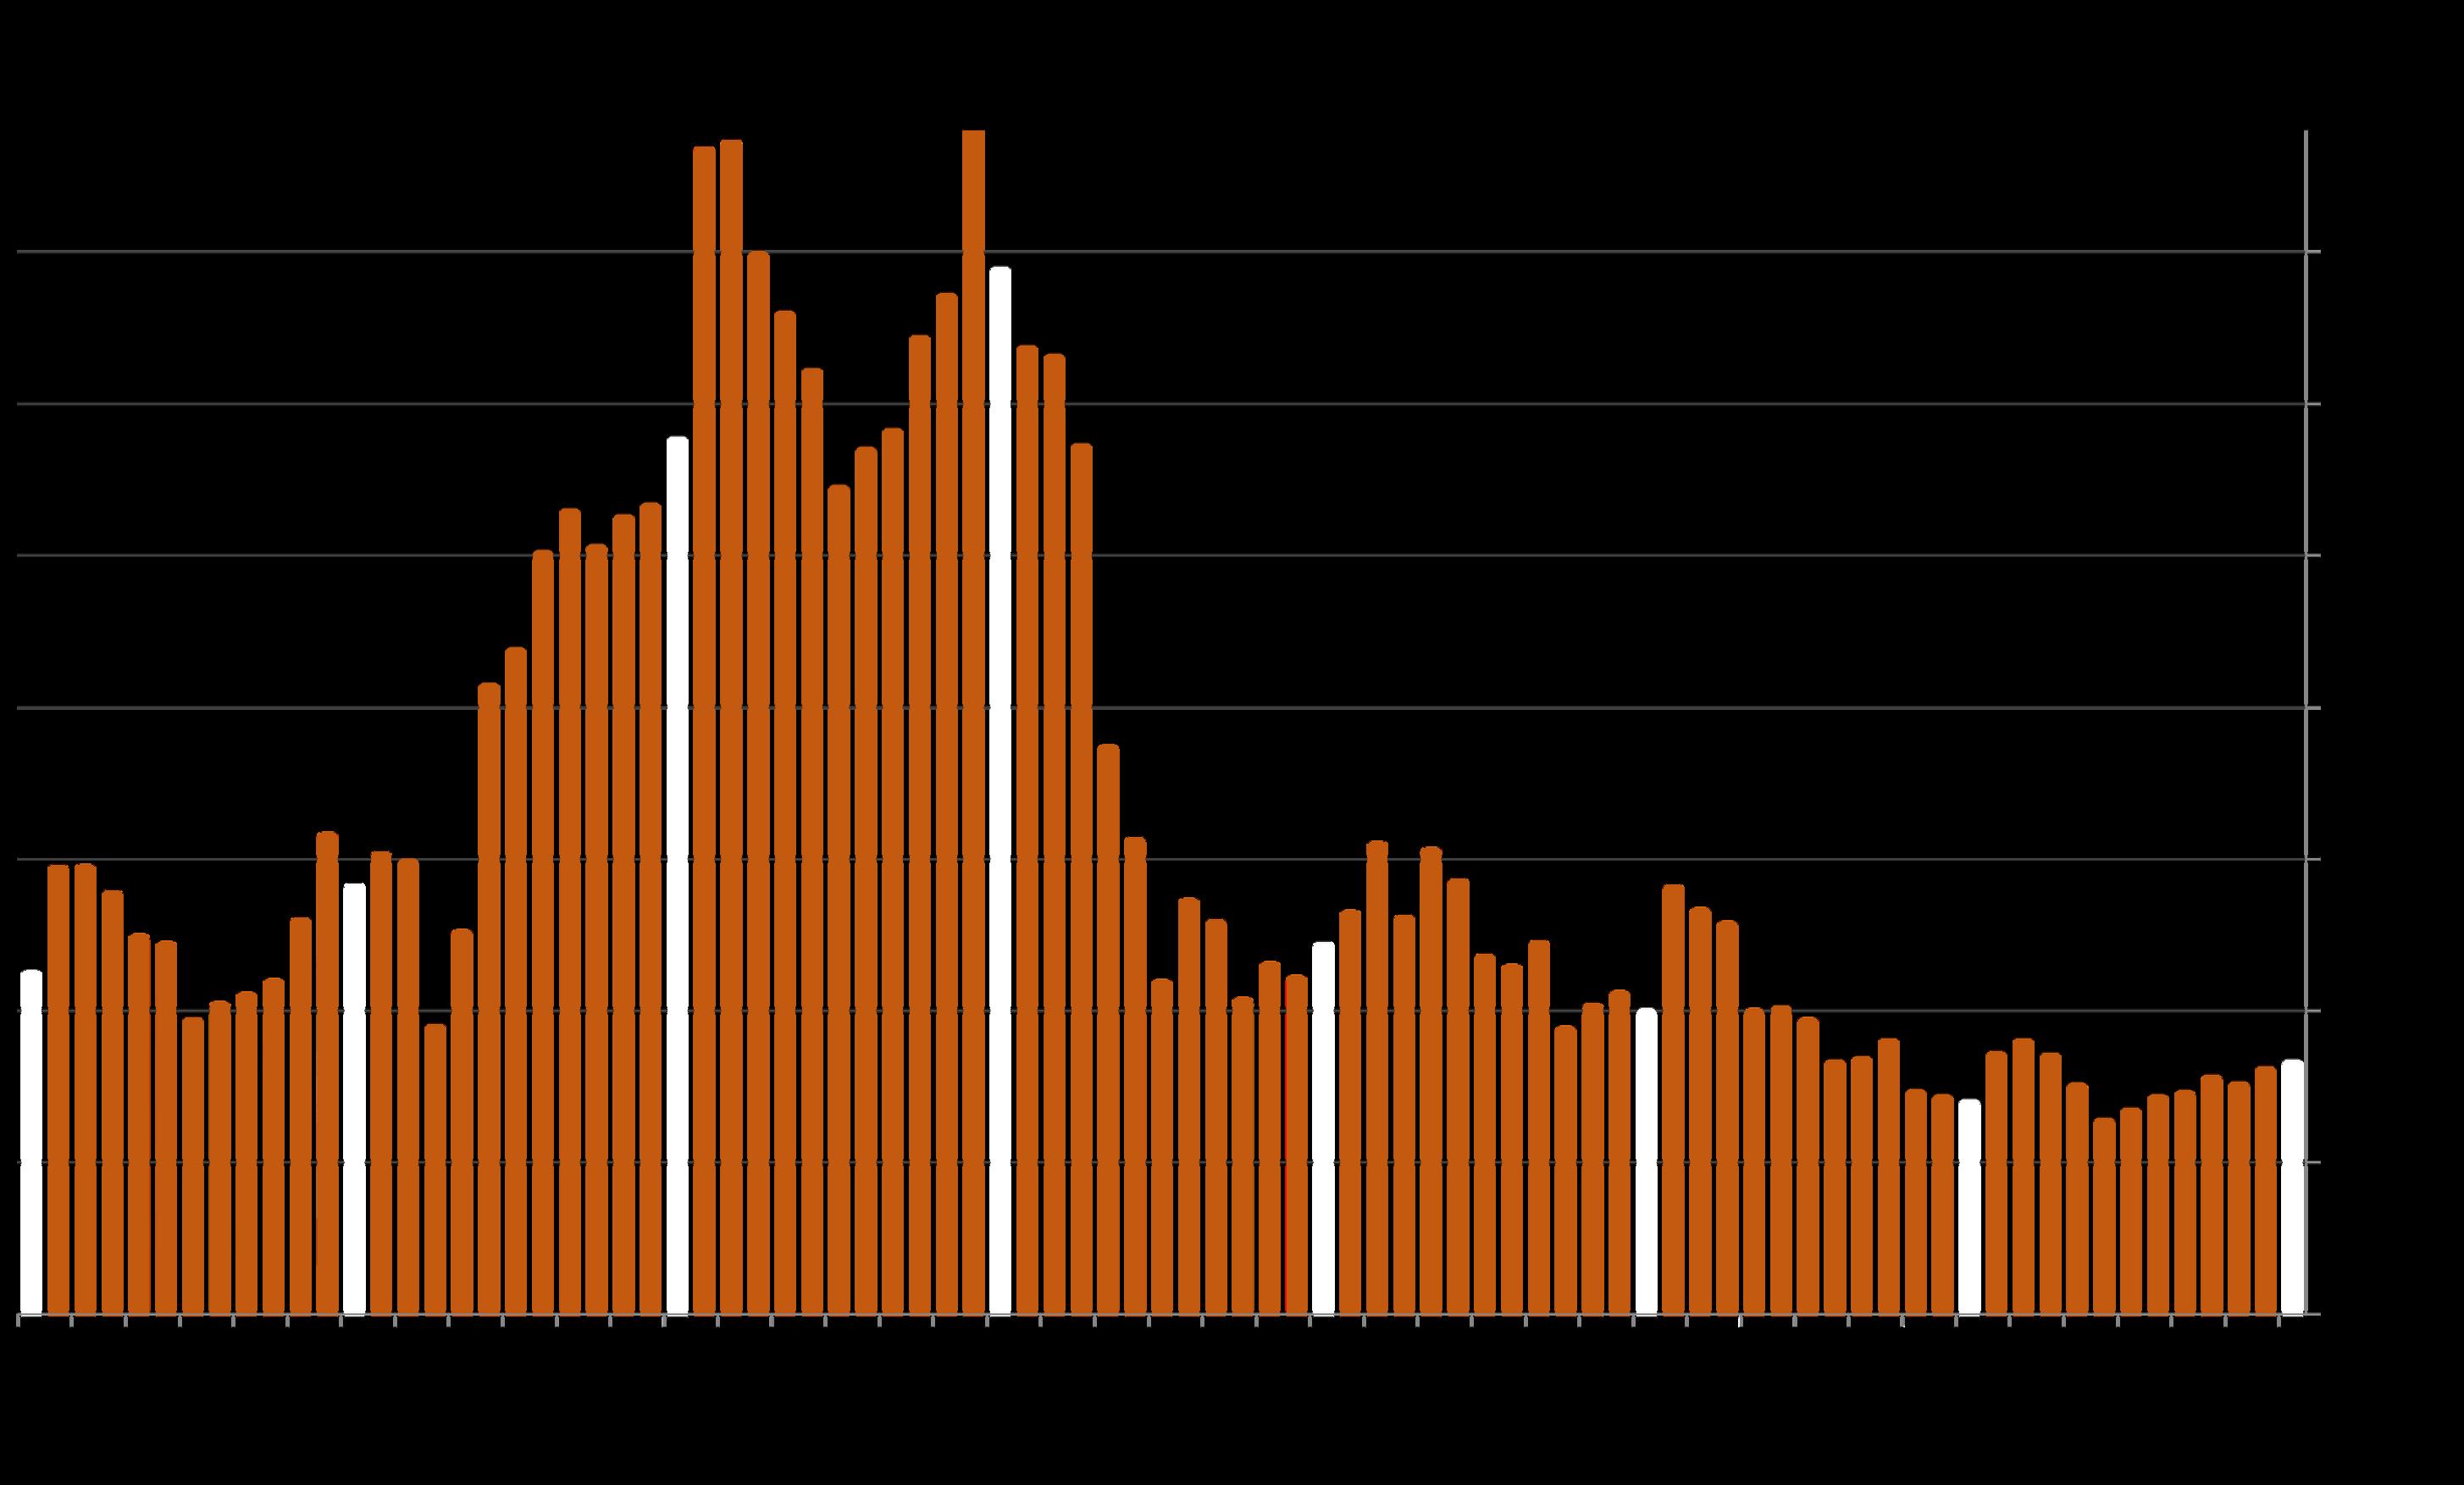
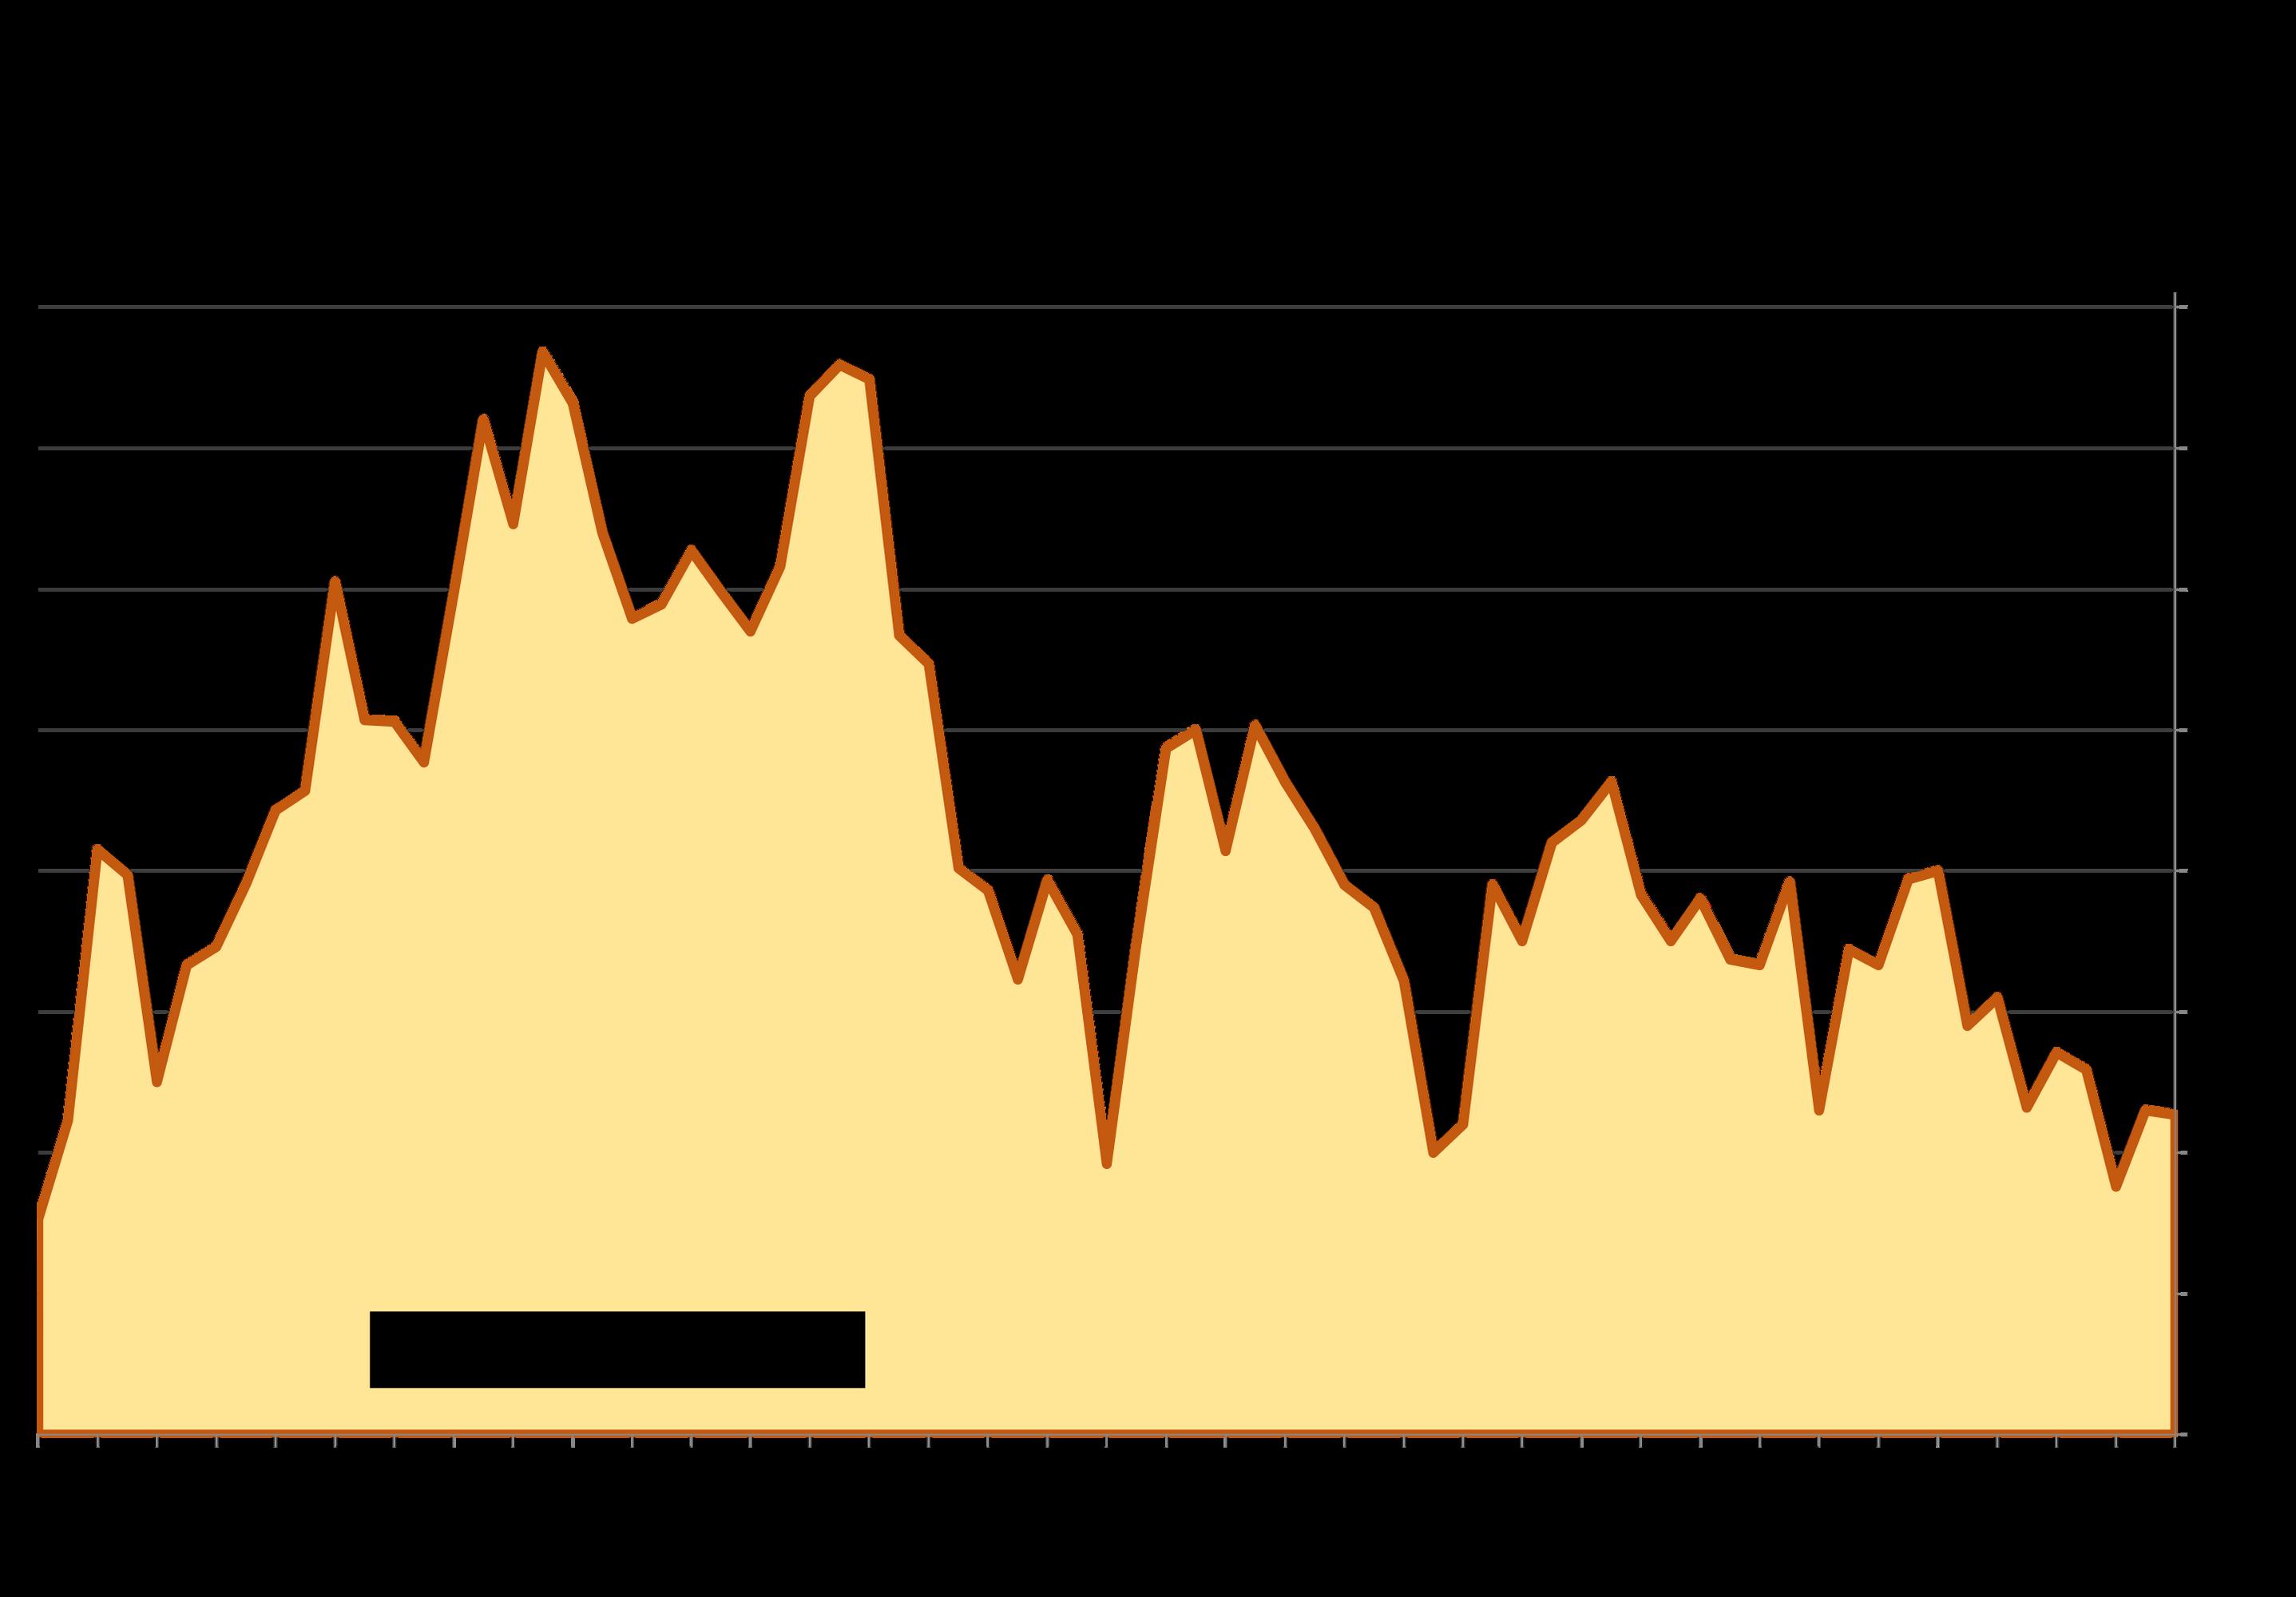
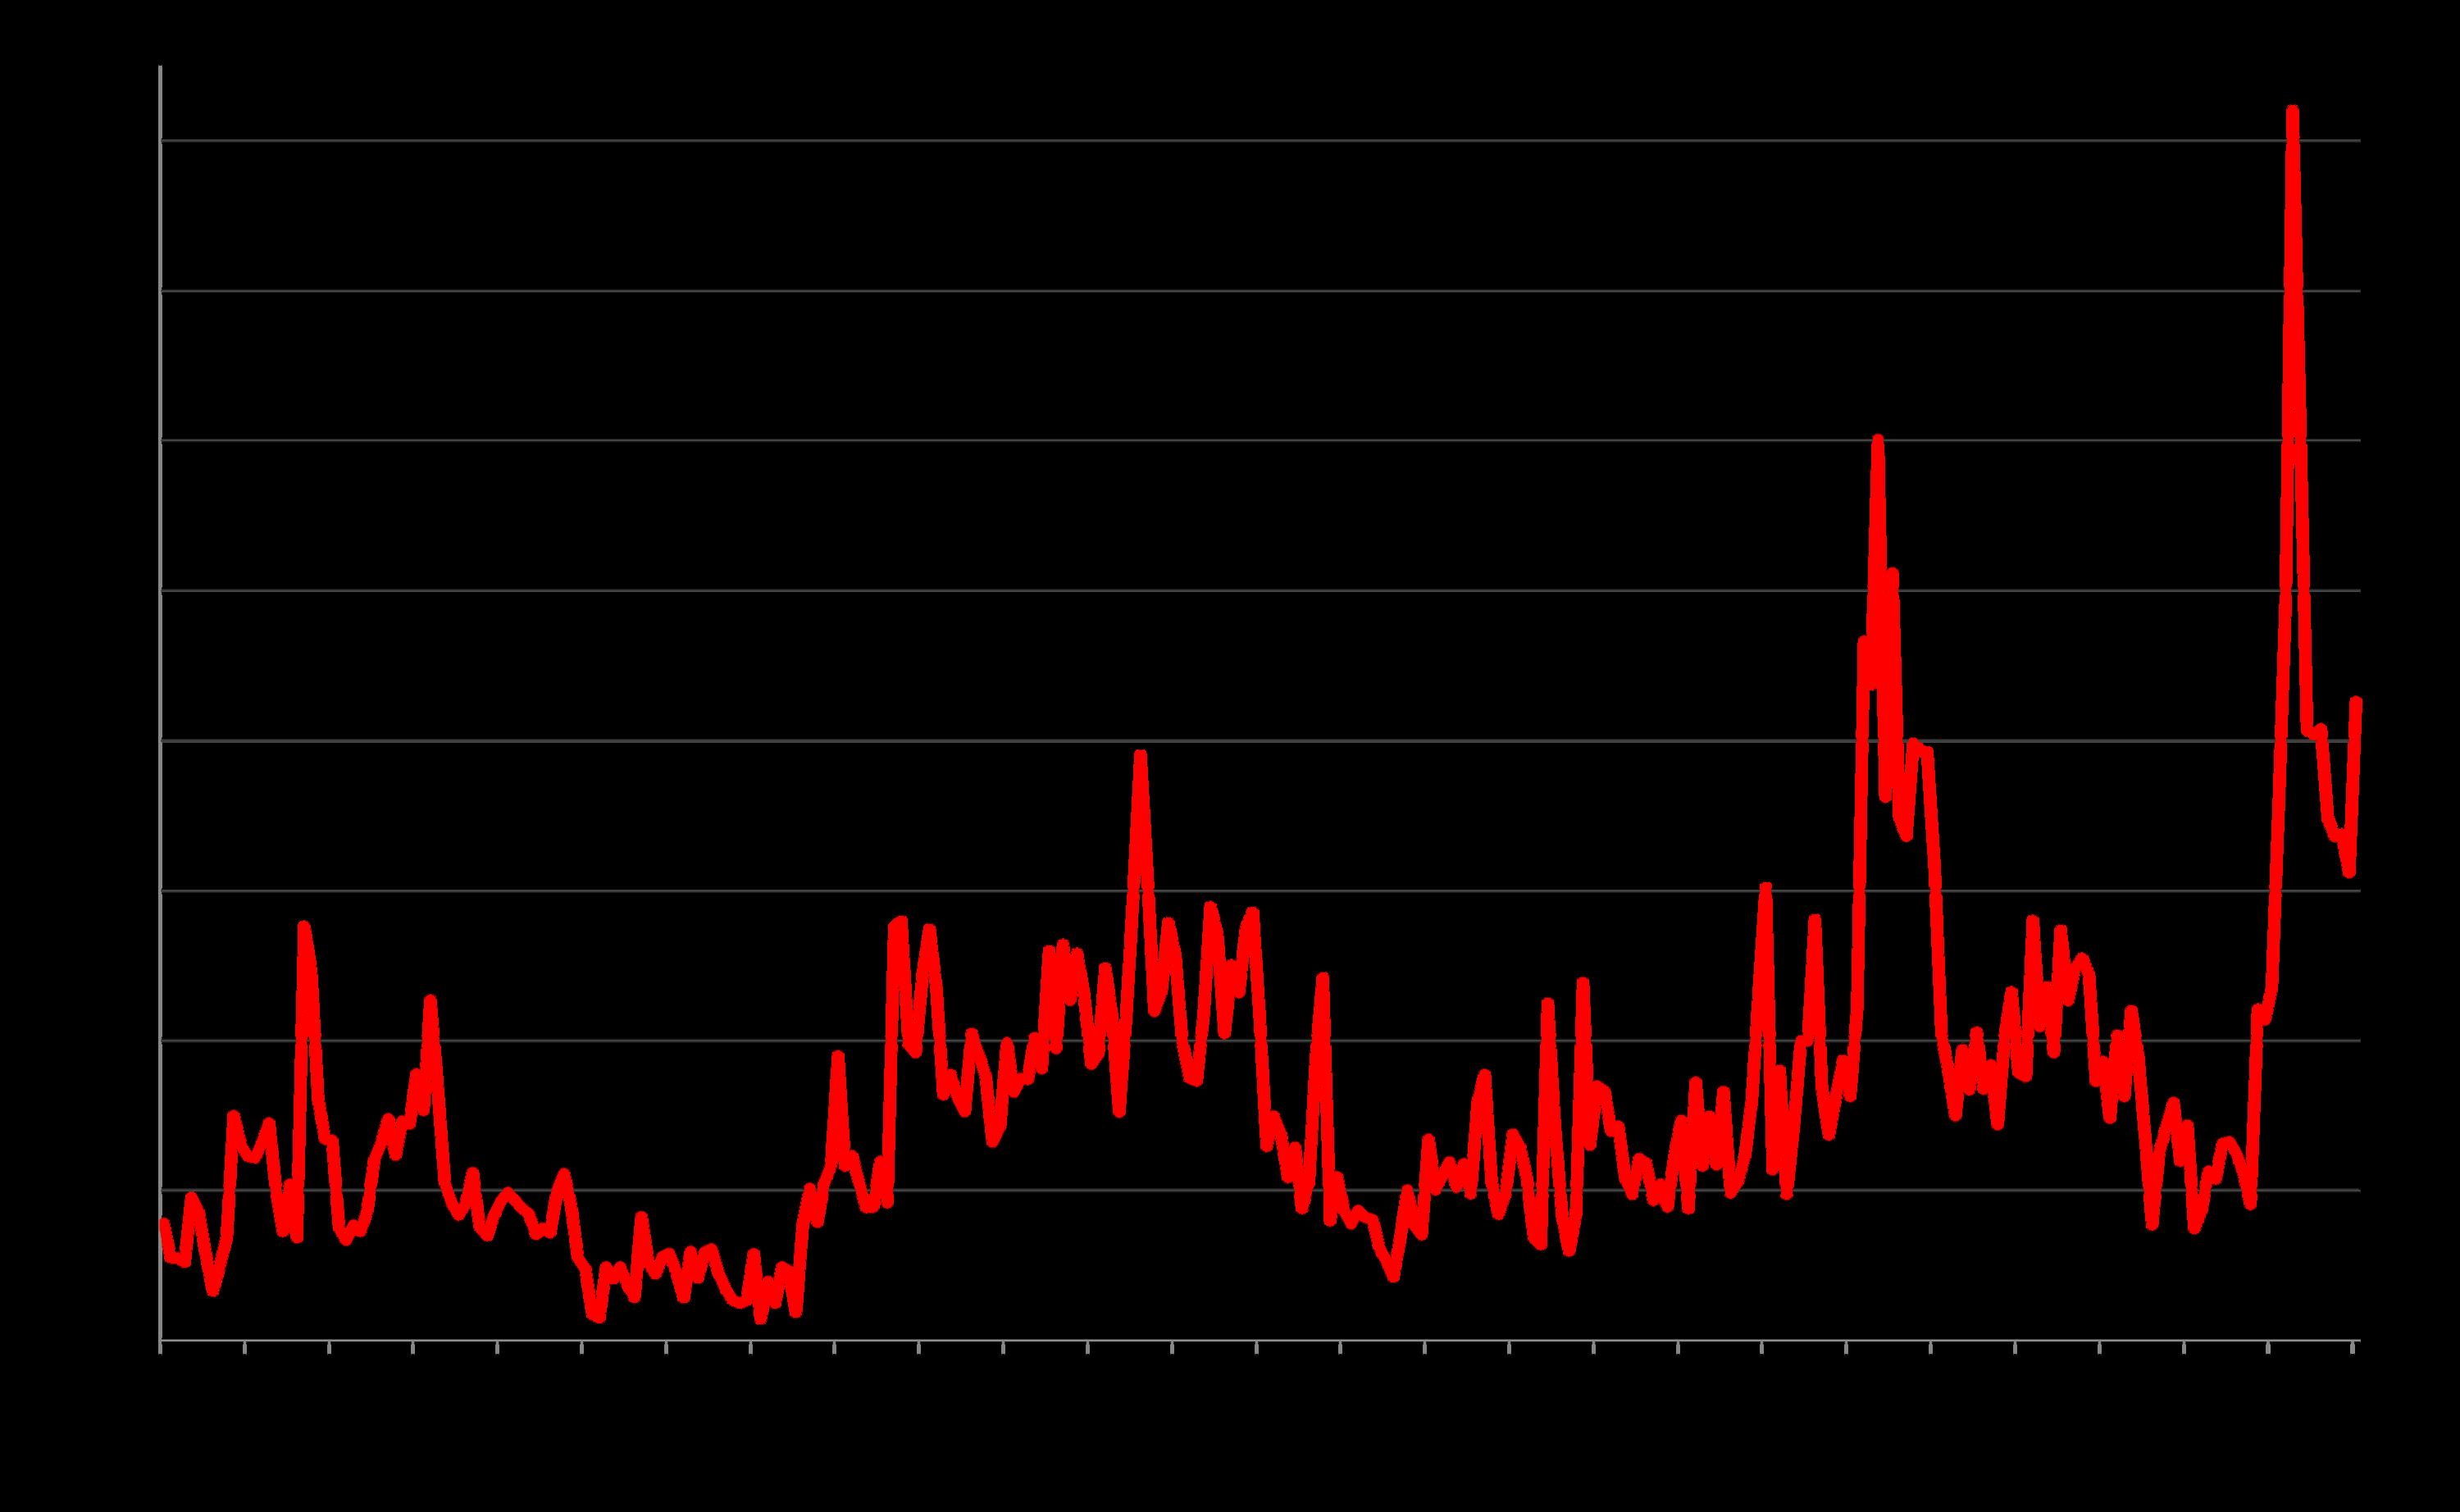
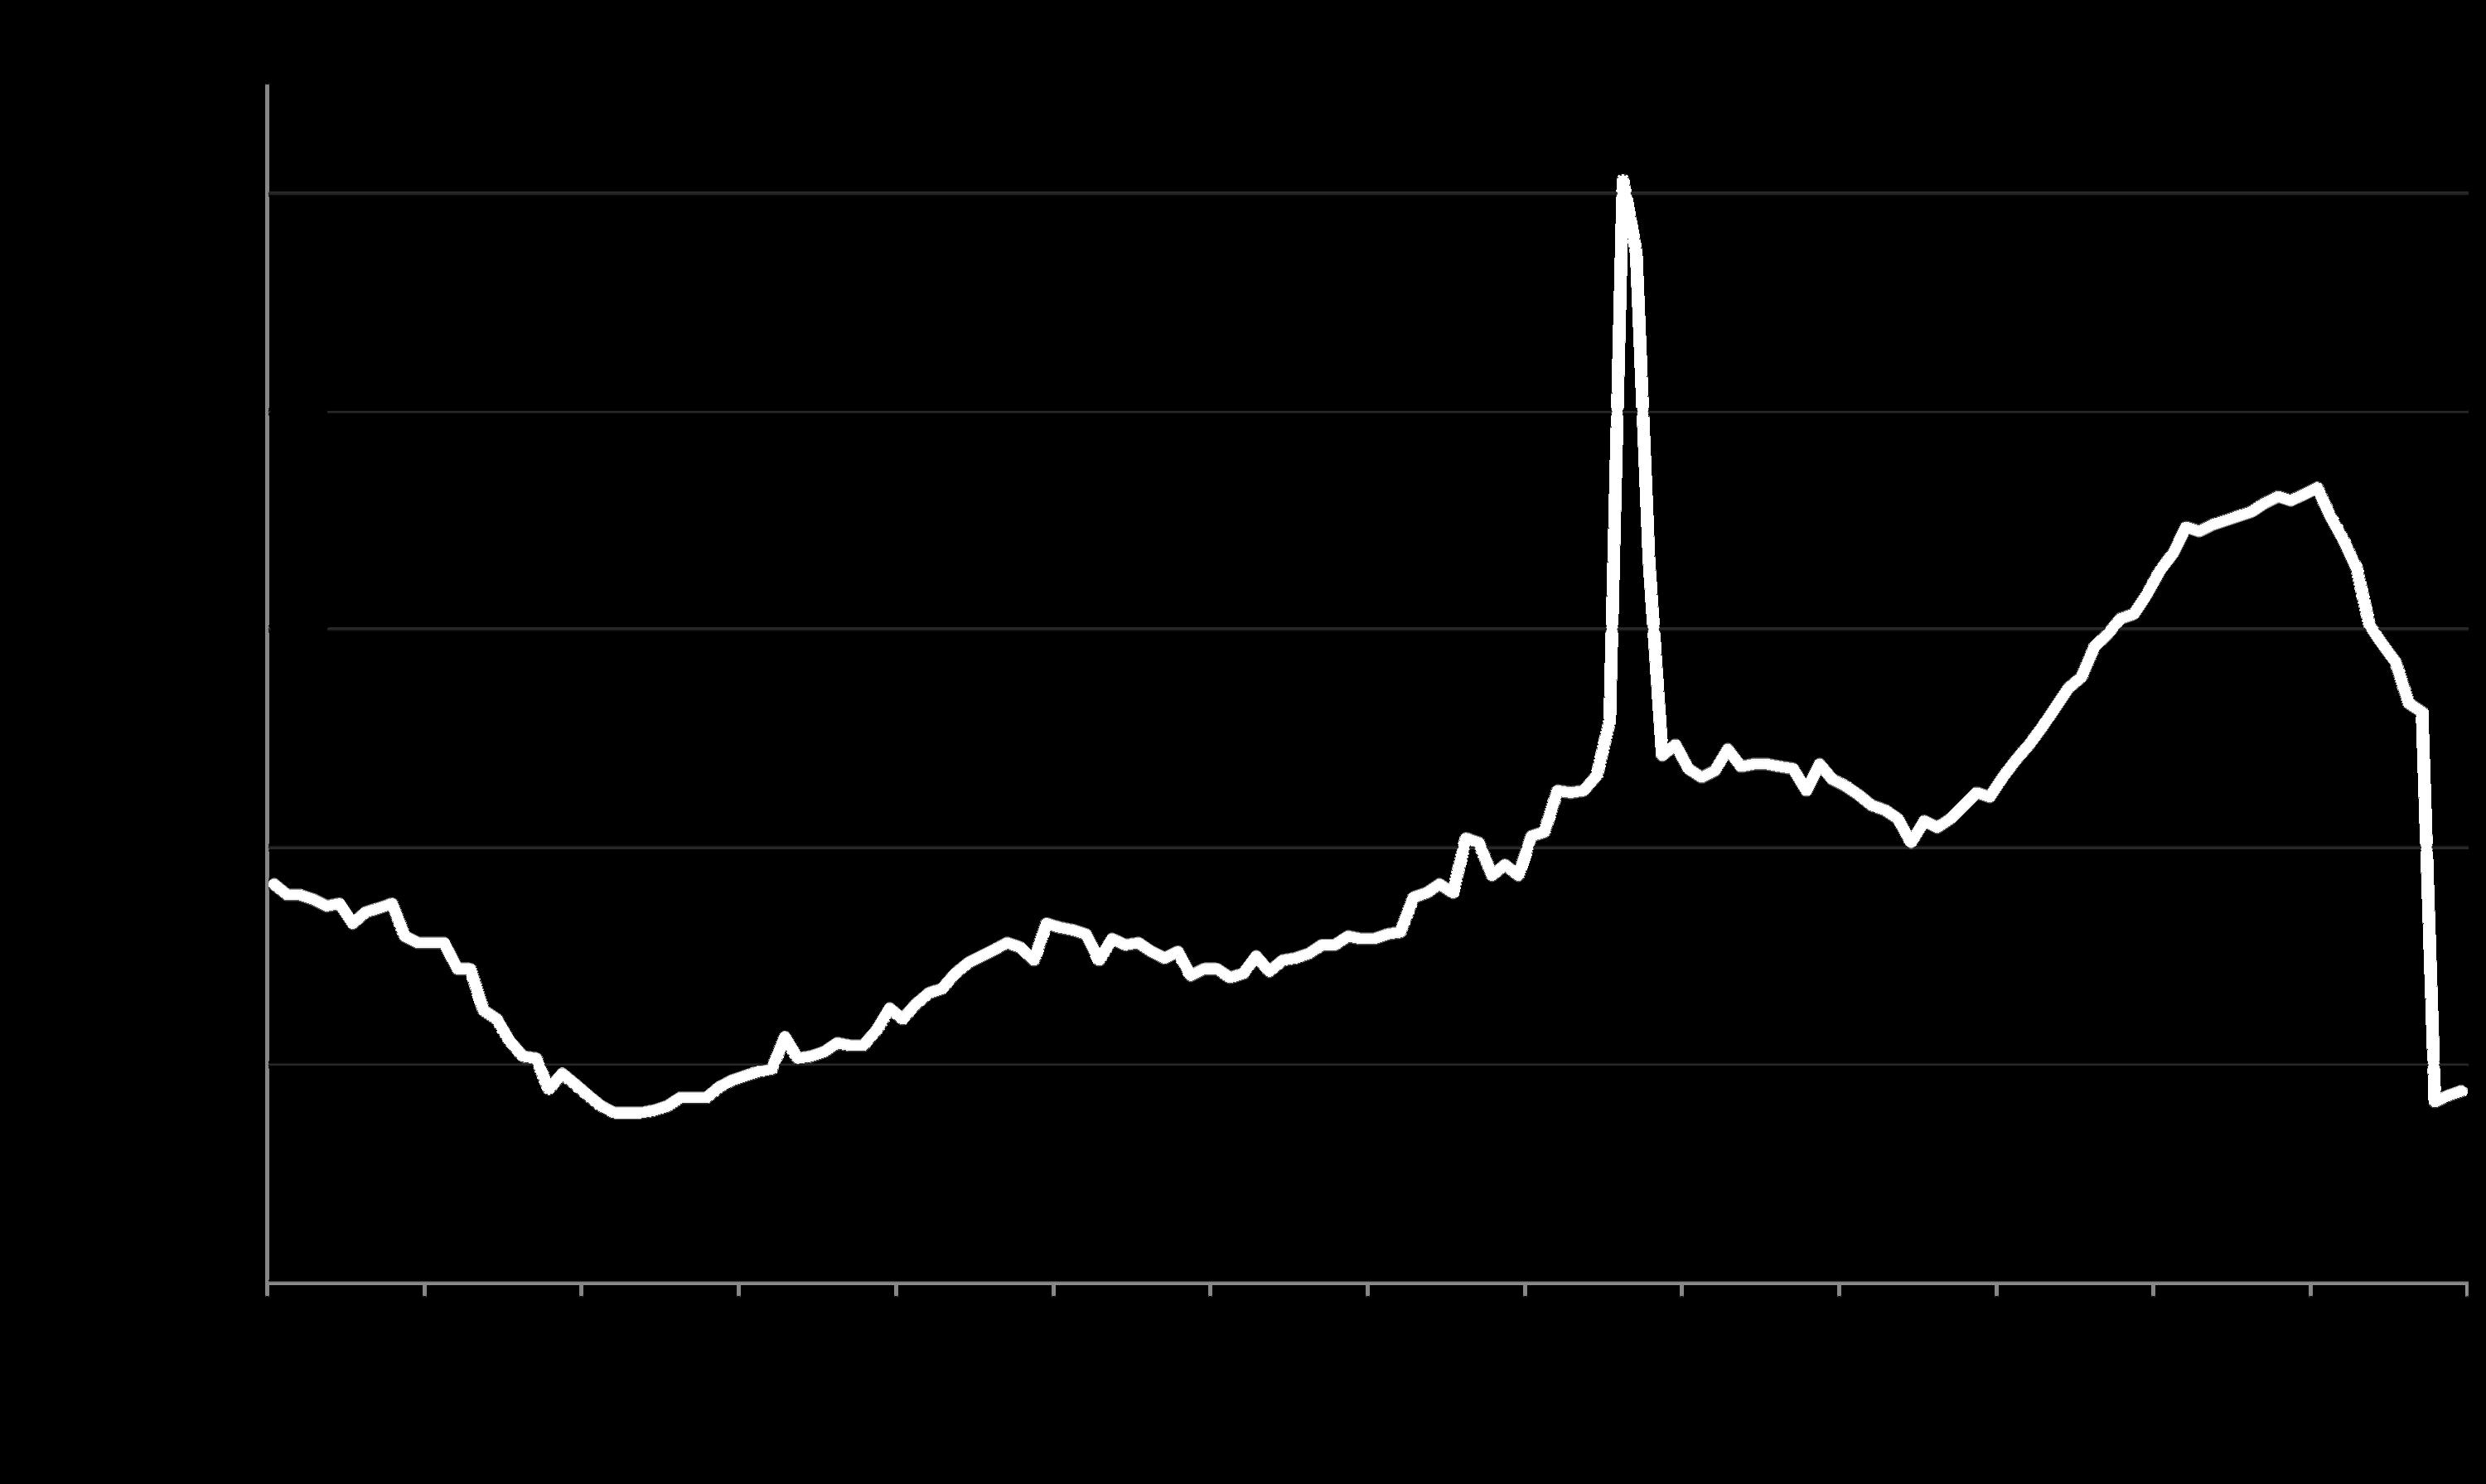
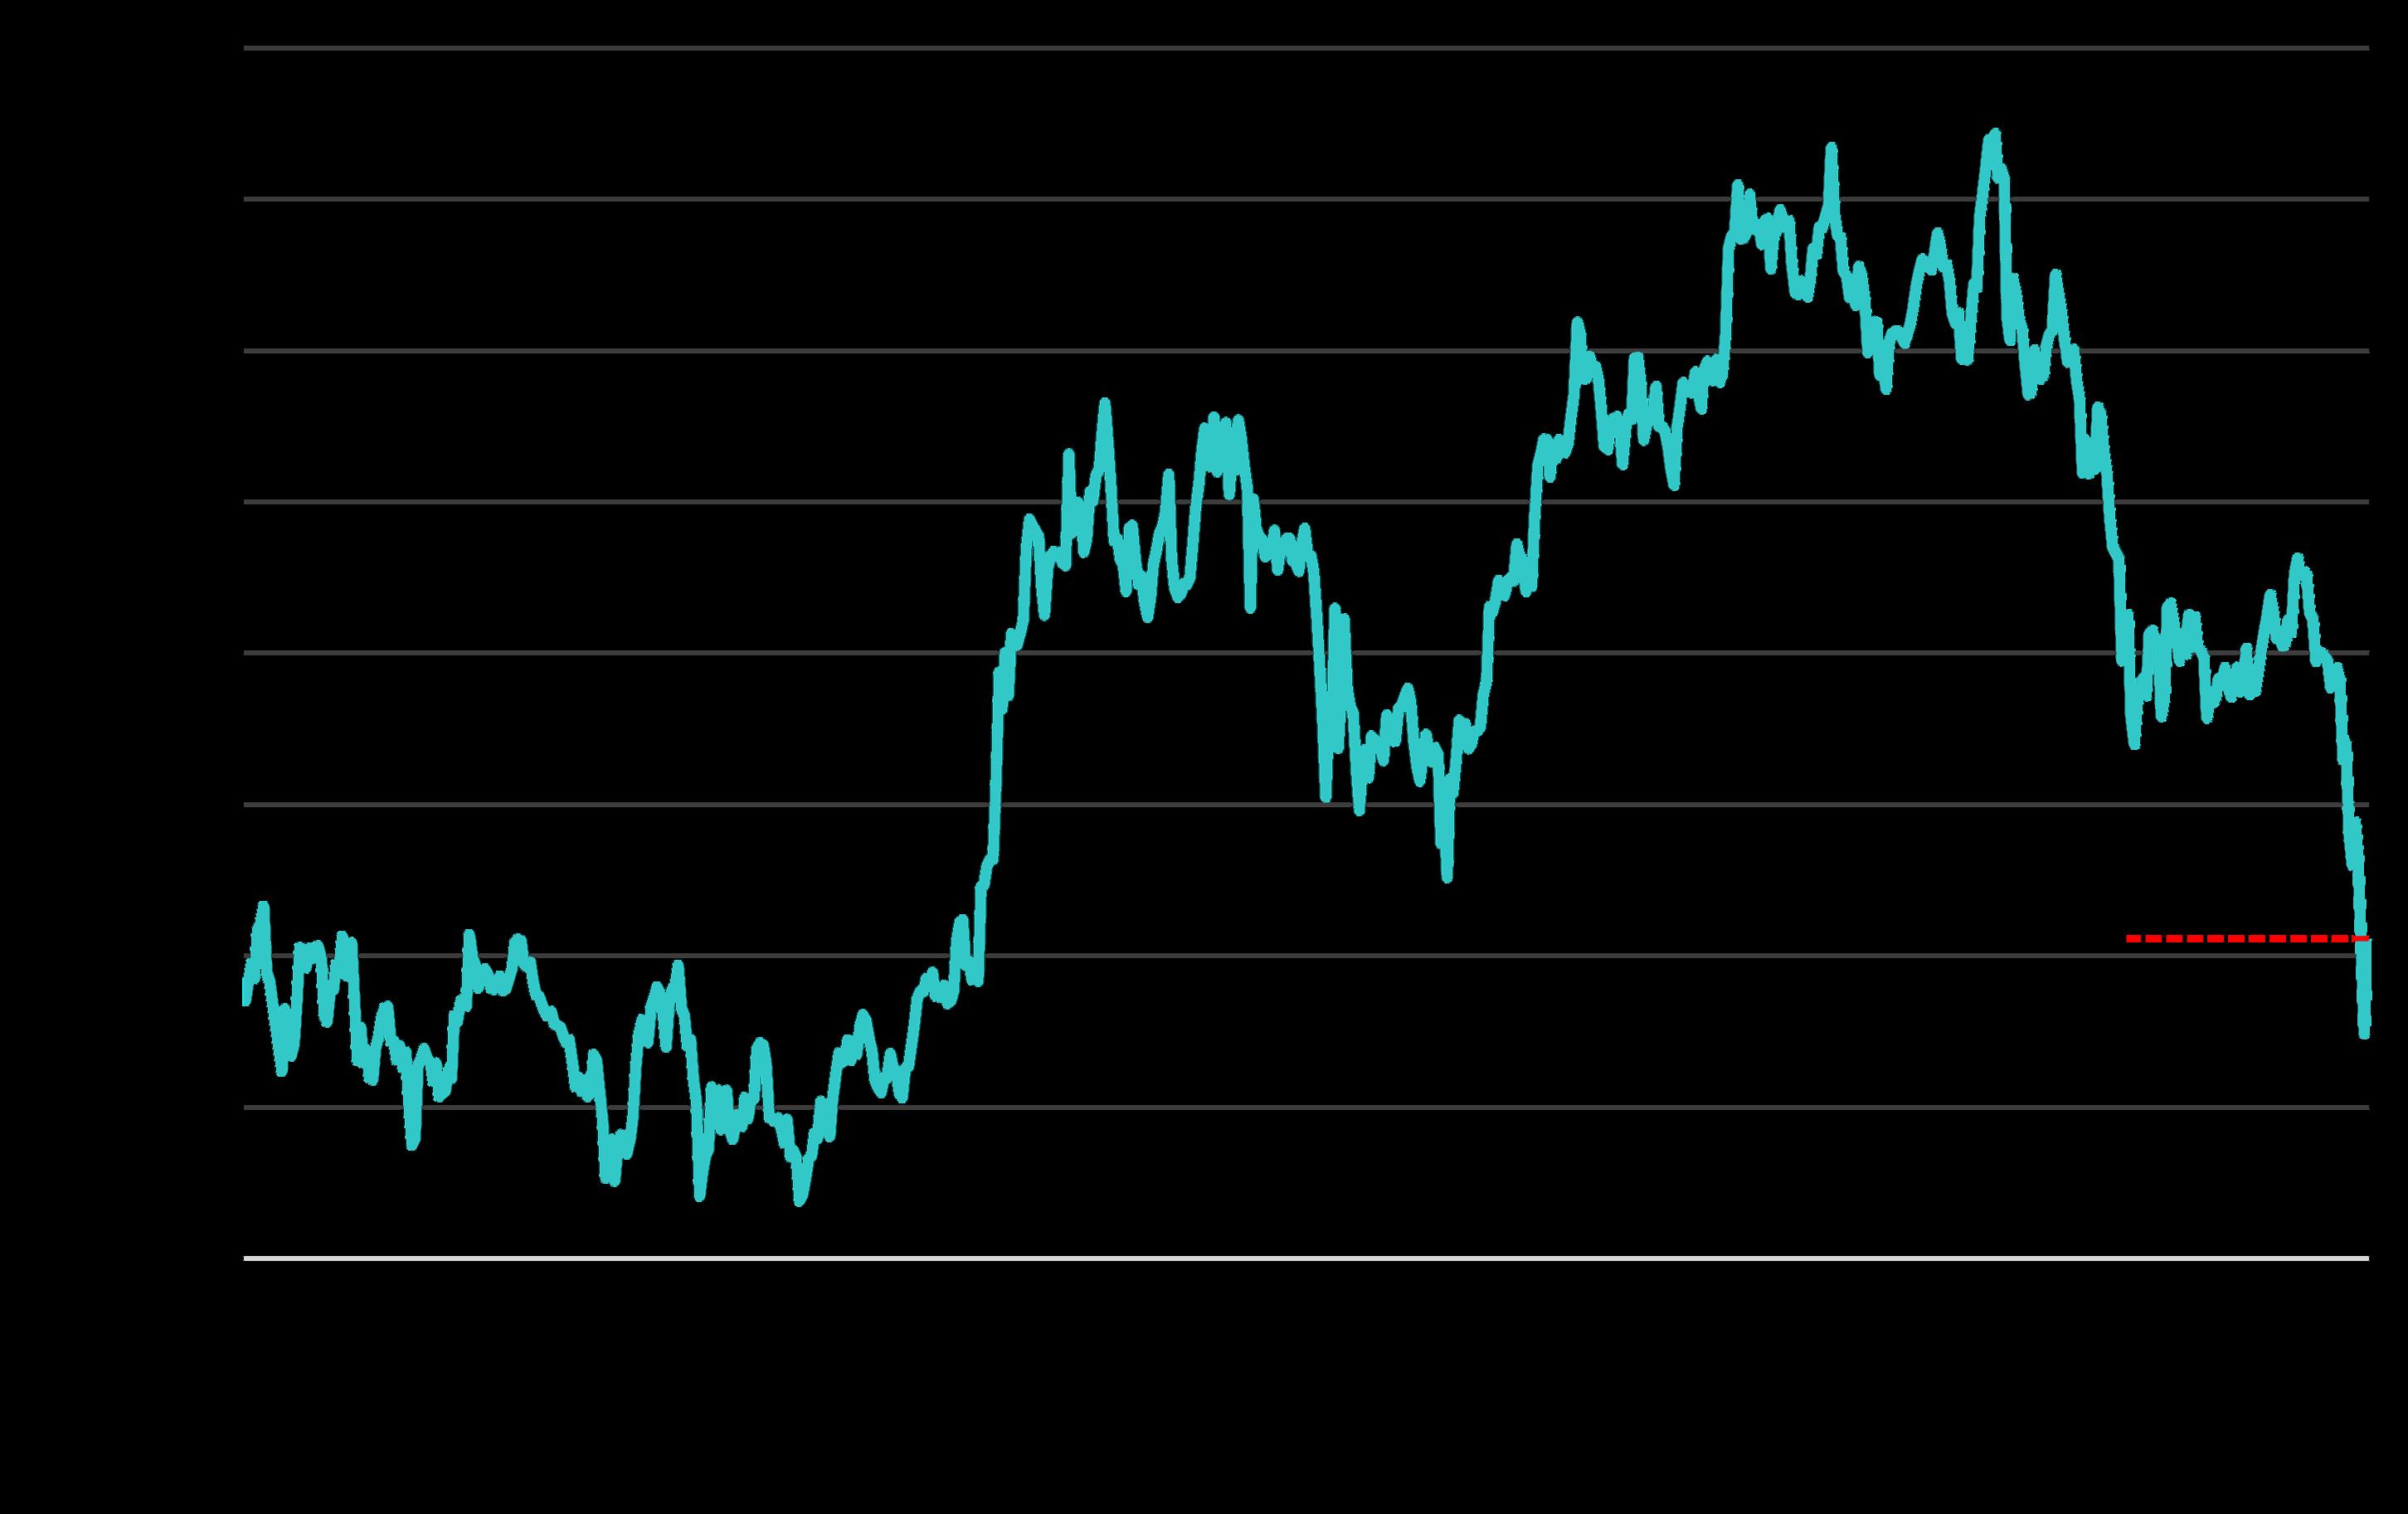
Economic Policy Uncertainty Index*
By Month since January 2000
The Economic Policy Uncertainty Index reading has plummeted since the April 2025tariff shockbutreboundedhigherinJanuary2026toalevelveryhighby long-term standards.
The Economic Uncertainty Index is constructed from data analysis of 1) an index of search results from 10 large newspapers for terms related to economic and policy uncertainty, 2) reports by the Congressional Budget Office, and 3) the Federal Reserve Bank of Philadelphia's Survey of Professional Forecasters.*
Tariff shock►
& great recession
*Source: 'Measuring Economic Policy Uncertainty' by Scott Baker, Nicholas Bloom and Steven J. Davis, 3component index, www.PolicyUncertainty.com, https://www.policyuncertainty.com/us_monthly.html. Data from sources deemed reliable, but numbers to be considered approximate and subject to revision.
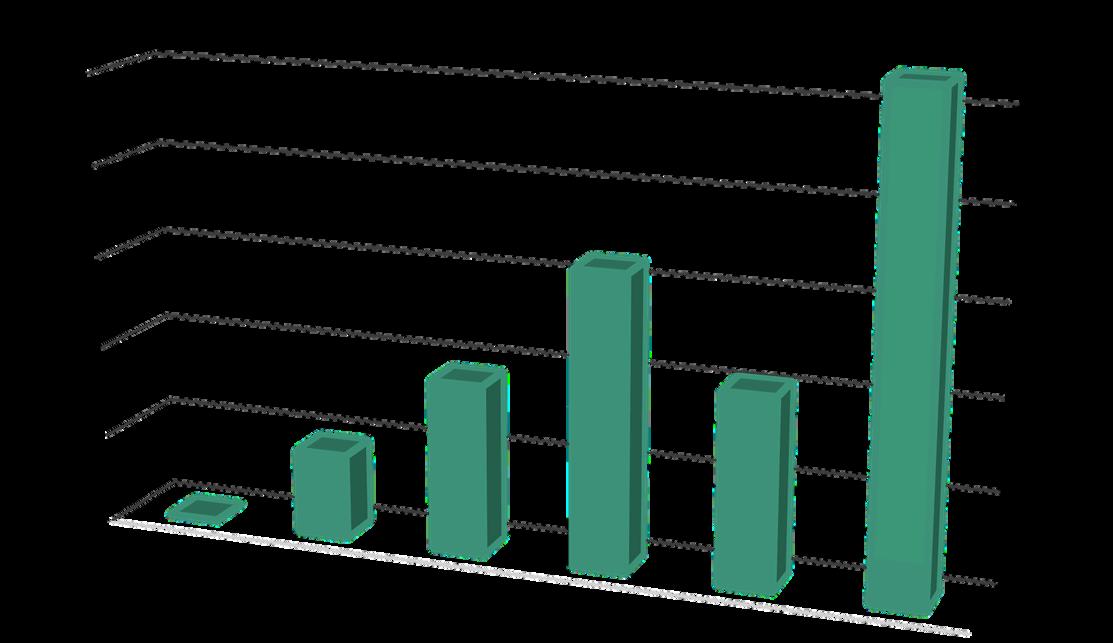
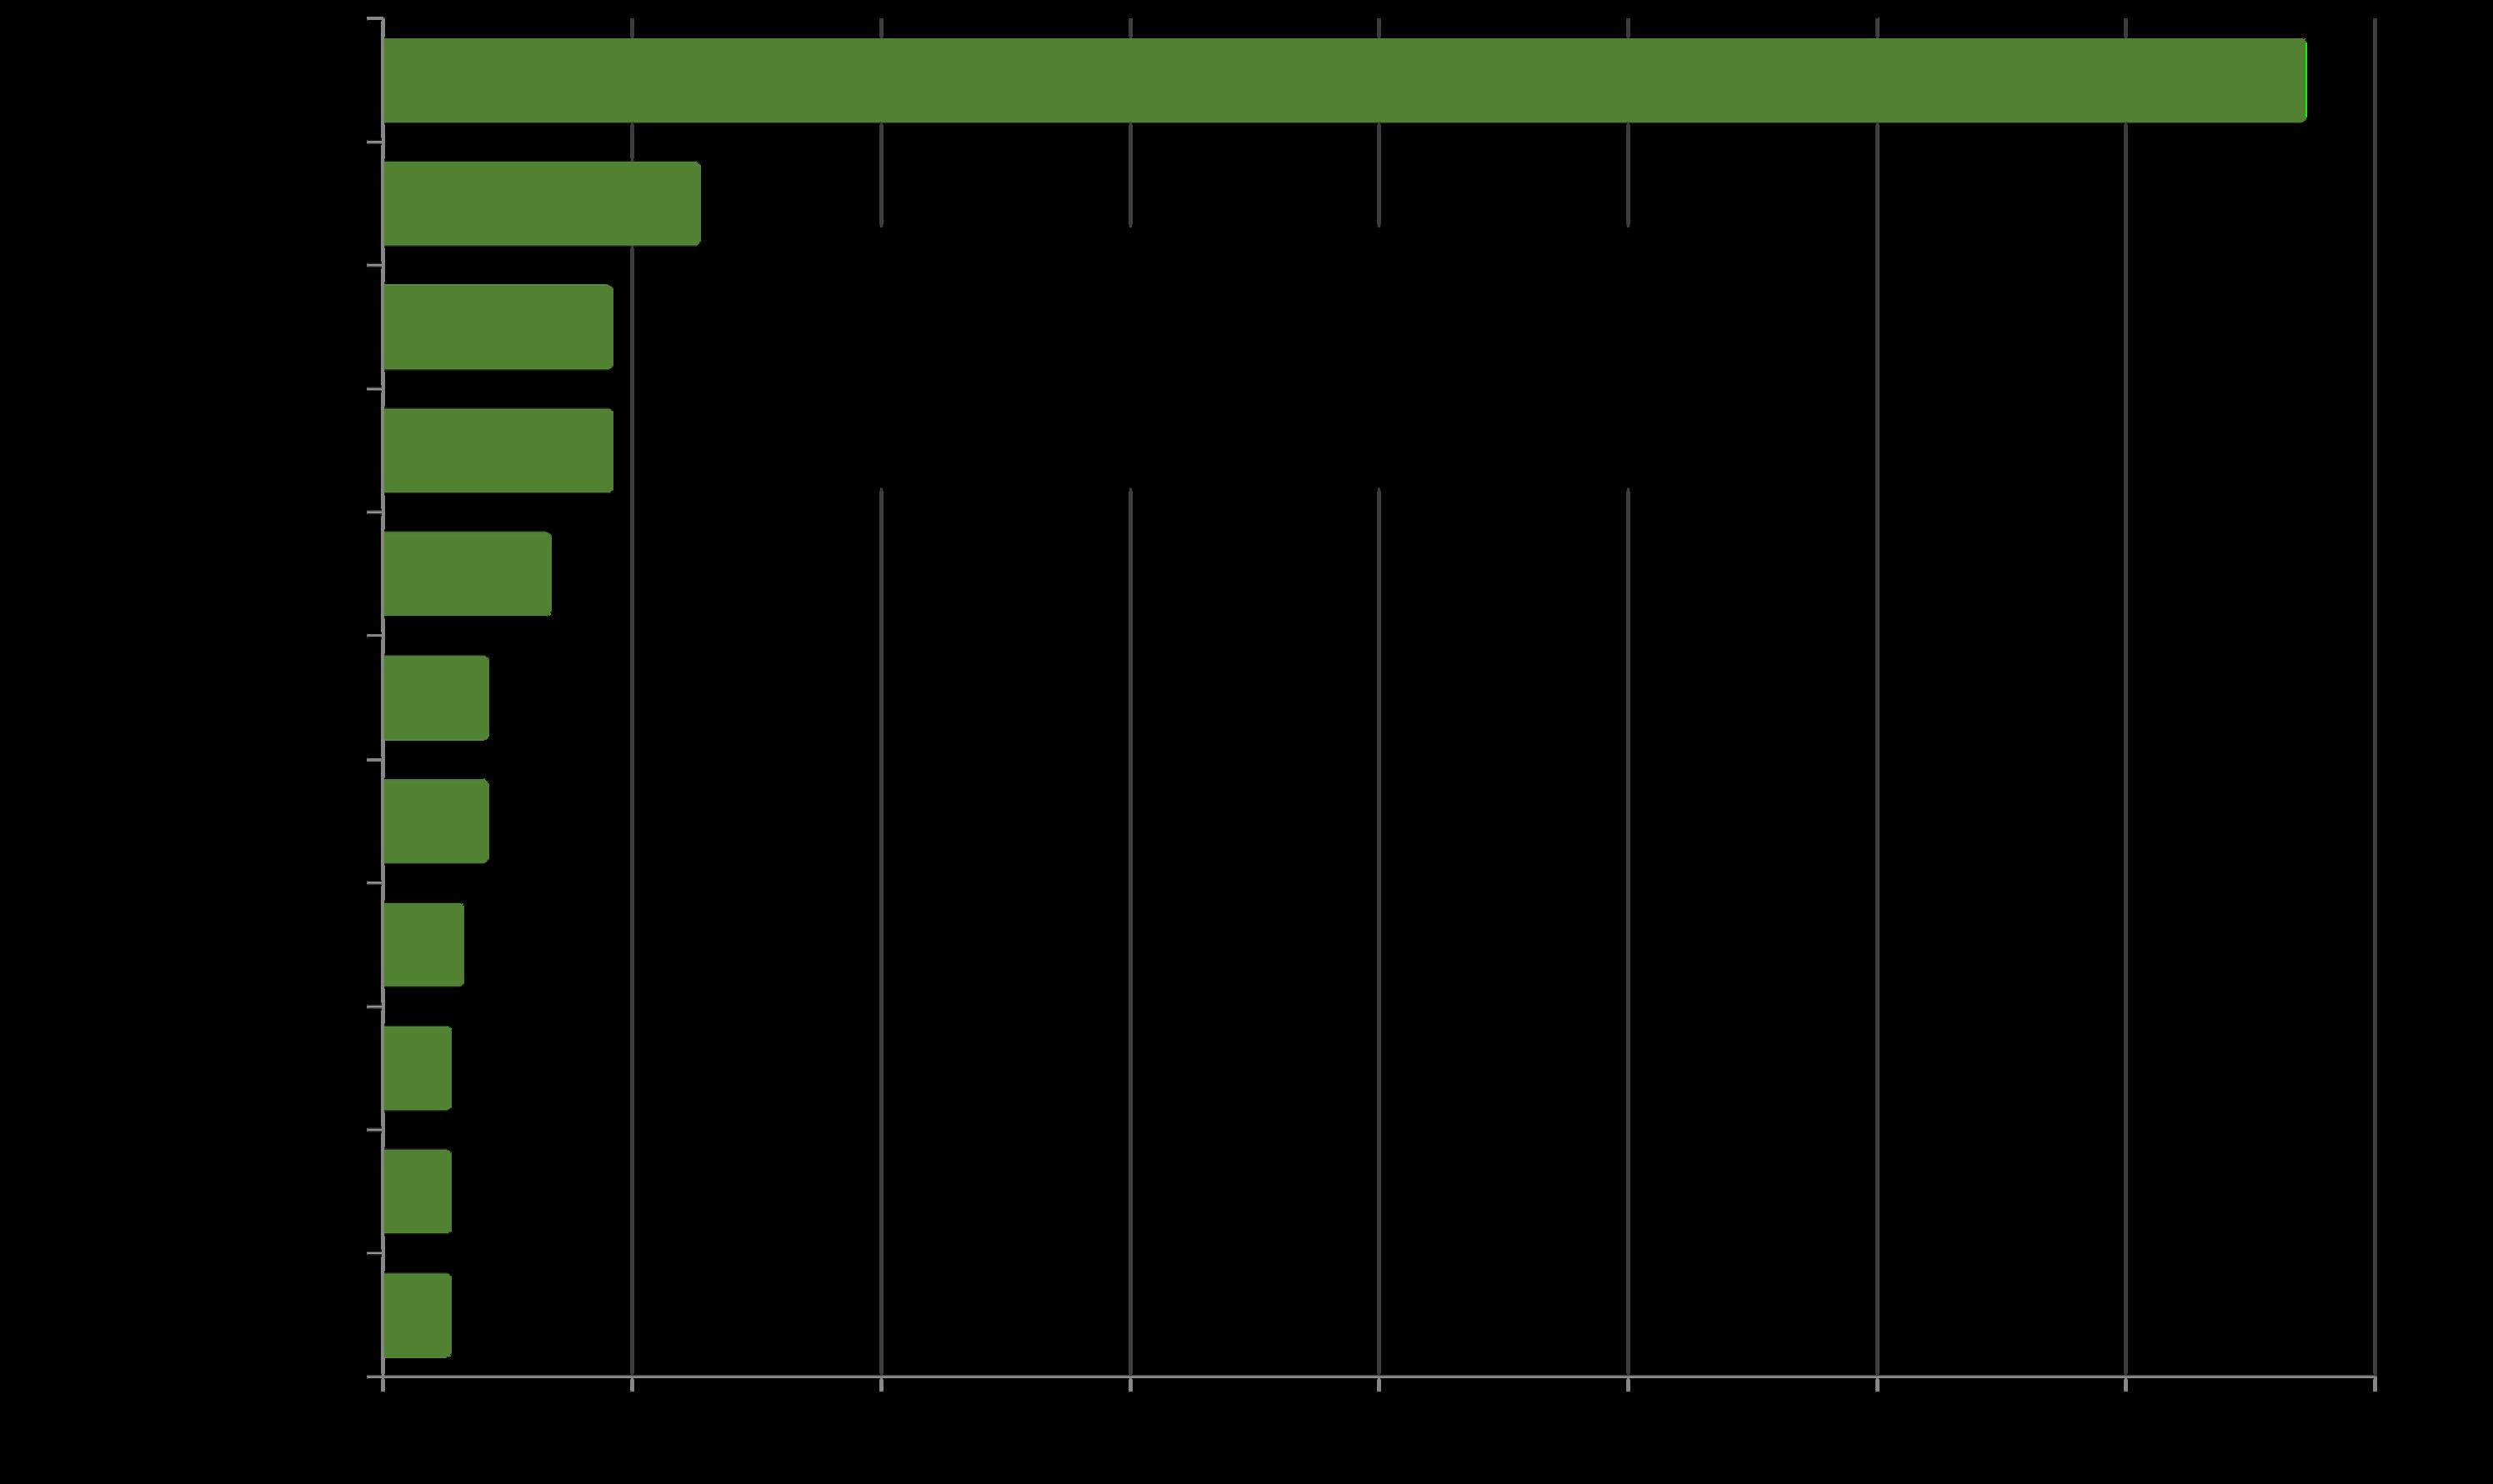
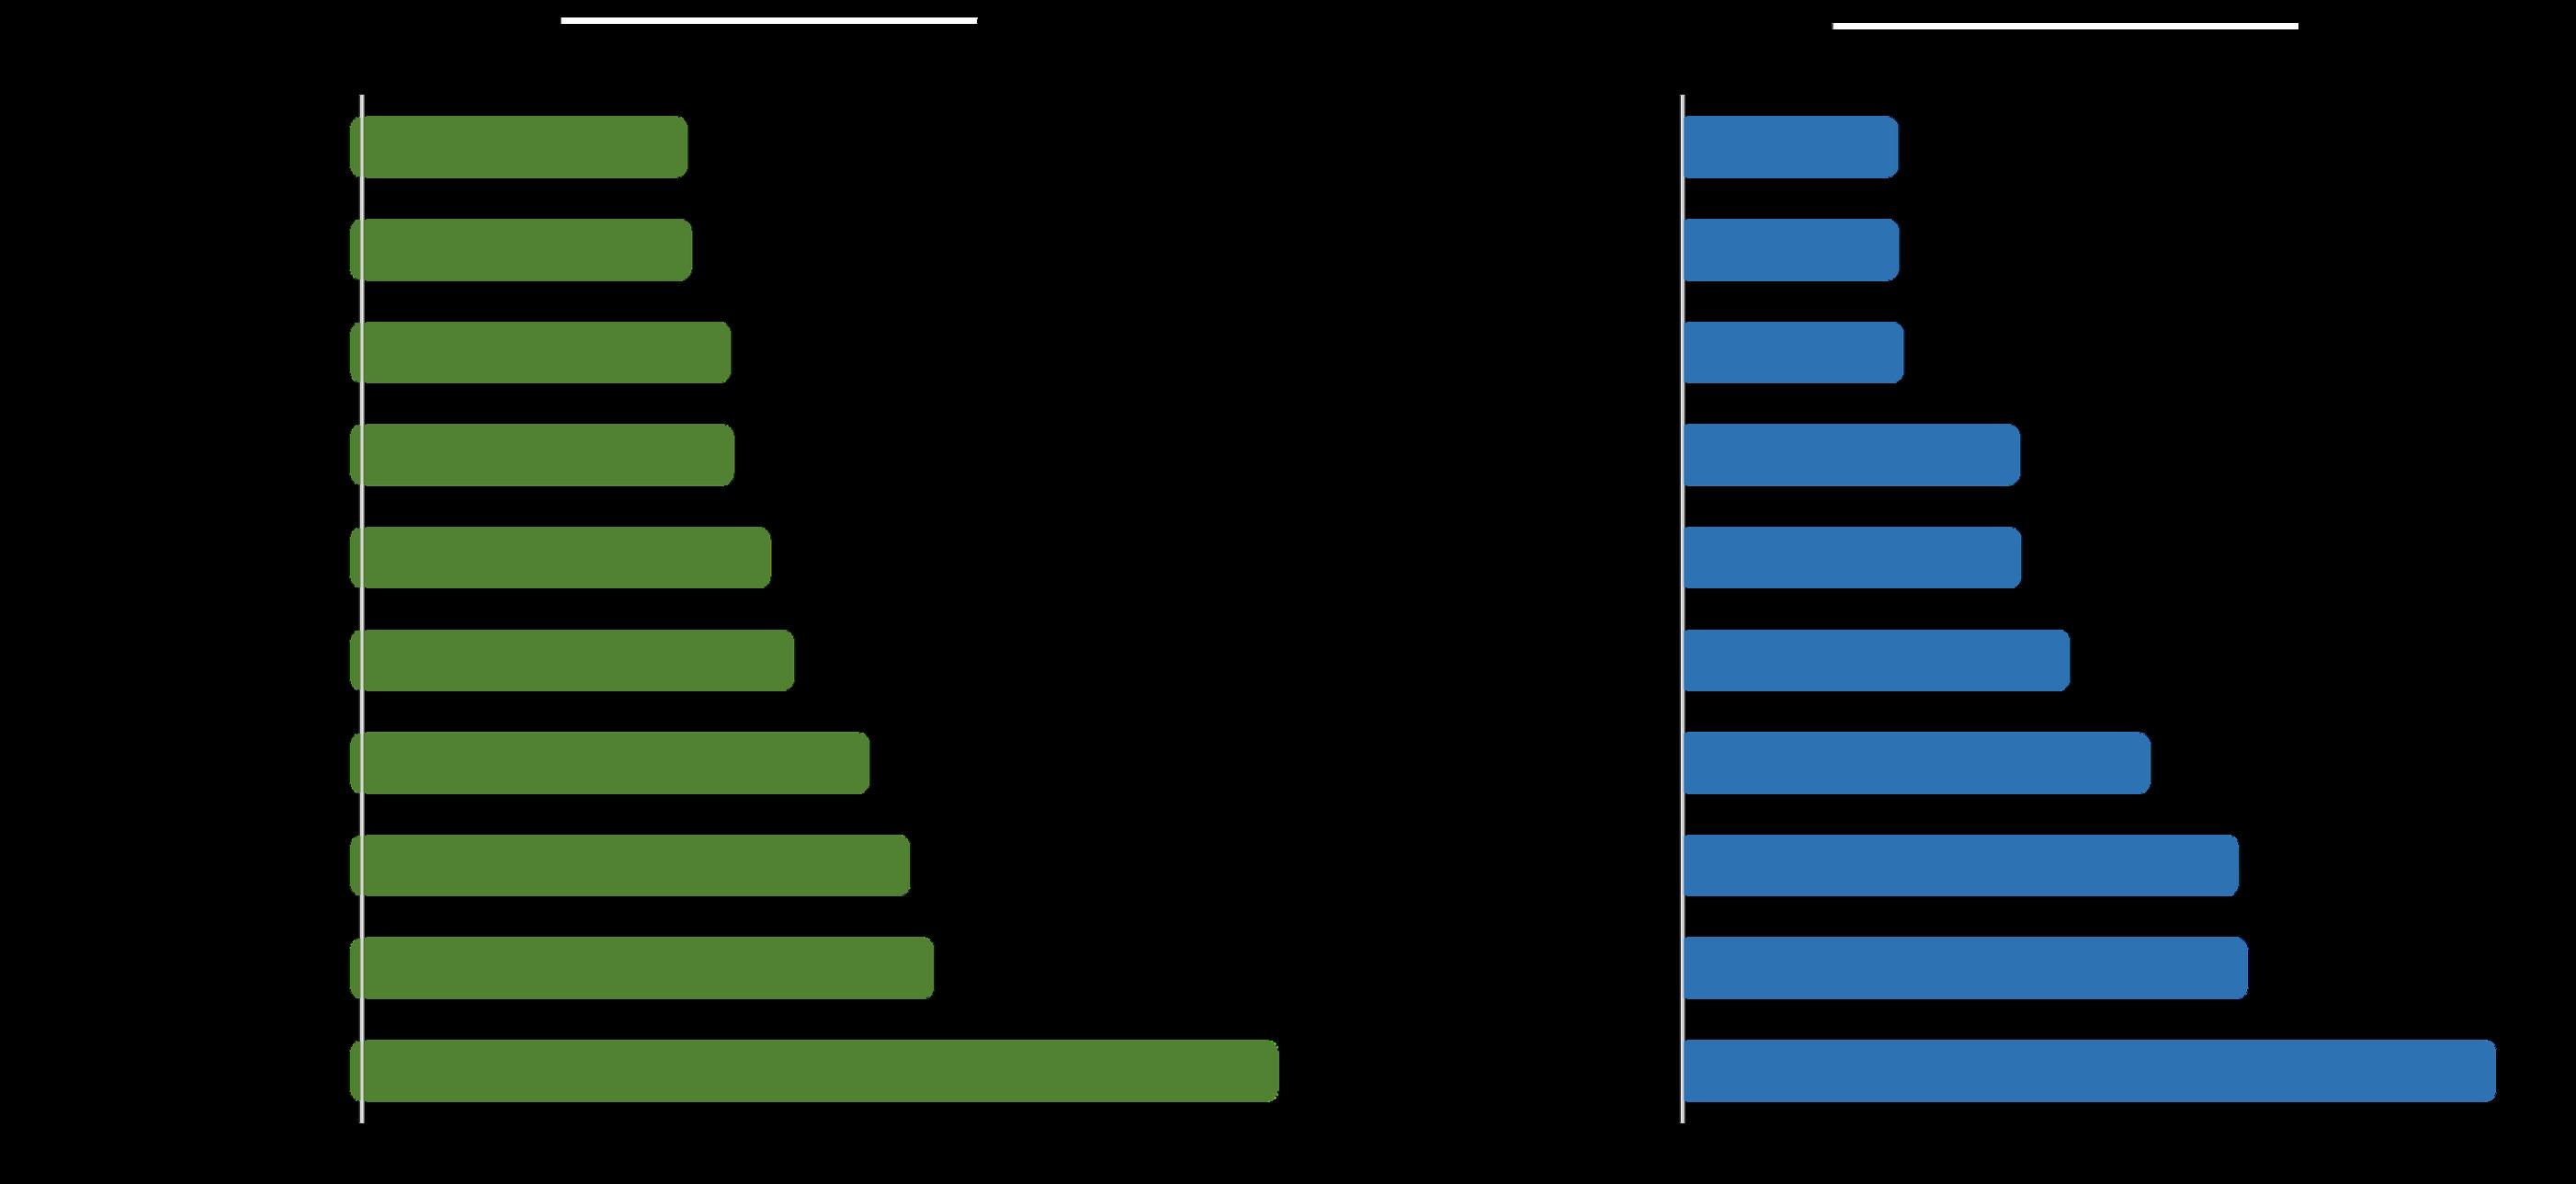
Venture Capital Raised in 2025
In Billions of Dollars, by City/Region*
SF
According to The Economist, the San Francisco
Bay Area raised approximately 39% more venture capital in 2025 – estimated at $154 billion – than the next 10 cities/regions combined.*
Billions of Dollars
*As published by The Economist on 1/27/26, using data from Dealroom. Data from sources deemed reliable but not guaranteed and may contain errors. All numbers should be considered approximate.
California Population Trends since 2010
U.S. Census Estimates, July 1 to July 1
Changes measured from July 1st of previous year to July 1st of labeled year.
Population changes are driven by domestic and foreign migration into and out of the state, and by natural causes, i.e. births less deaths. In recent years, the state has experienced negative domestic migration, positive foreign migration, and more births than deaths.
The Census estimates population changes from July 1st to July 1st.
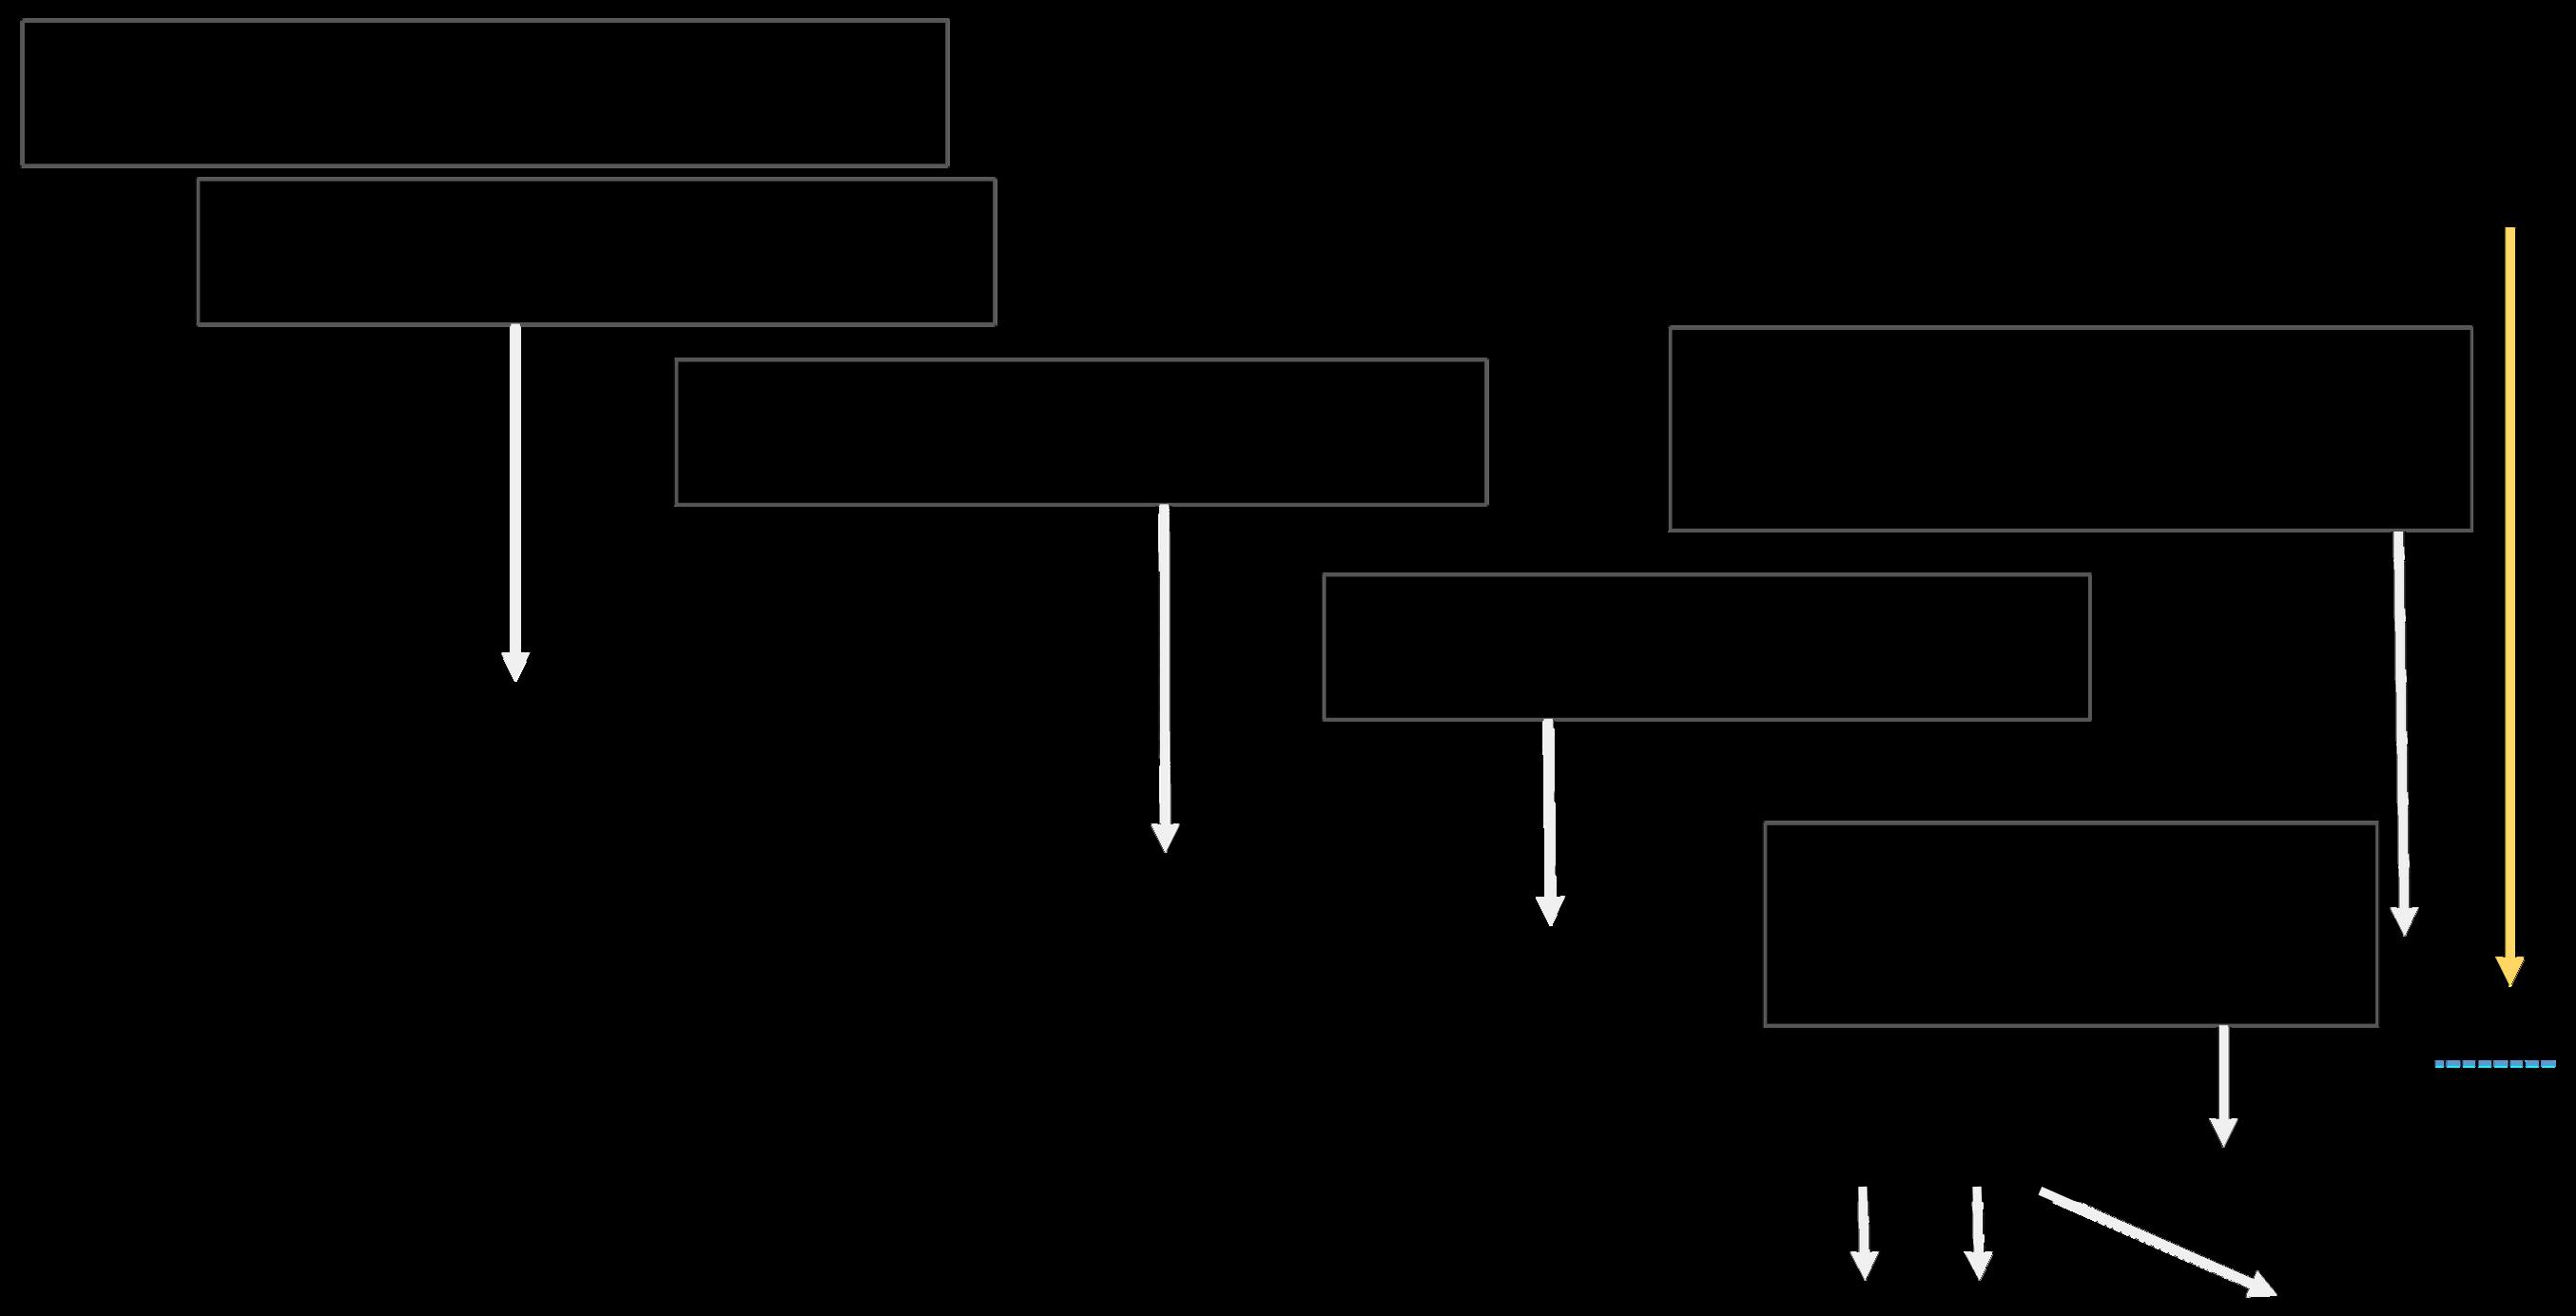
CApopulation changes inrecent yearshave beencharacterized by 1) many more residents moving to other states than moving into CA (negative net domestic migration), 2) high net foreign immigration, and 3) more births than deaths (natural cause). Total population was essentially unchanged in the last year (down .02%) but has declined since the pandemic hit. Due to new federal policies, net foreign immigration plunged 65% in the last 12-month period and is expected to decline further – and perhaps turn negative (more immigrants leaving than arriving).
July 1, 2024 – July 1, 2025 April 1, 2020 – July 1, 2025
-100,000 -150,000 Net Domestic Migration (229,077) 109,278
Last 12-Month Period
Foreign Immigration Natural Cause 109,715 Foreign immigration declined 65% year over year in the last 12-month period. (9,465)
Since the Pandemic Hit
Population -200,000 Natural Change
*Estimates published 1/27/26 by U.S. Census. All numbers approximate, may contain errors, and may be revised in future estimates. Census numbers will not total perfectly due to “Population change that cannot be attributed to any specific demographic component.”
California 2024 Migration Trends*
Out-Migration States receivingthehighestnumber of residents moving out of state in 2024 States with the highest number of residents moving into state in 2024
Substantial two-way traffic between states is common.
Total In-Migration from other states: 406,873
In-Migrationfromabroad/U.S.islands:306,867
Total Out-Migration to other states: 661,205
Residents moving within state: 3,339,836
*Per U.S. Census 1-Year ACS estimates released 1/21/26: Published with significant margins of error. https://www.census.gov/topics/population/migration/guidance/state-to-state-migration-flows.html. State population is also affected by births and deaths, and residents moving abroad. Data from sources deemed reliable but may contain errors and subject to revision. All numbers approximate.
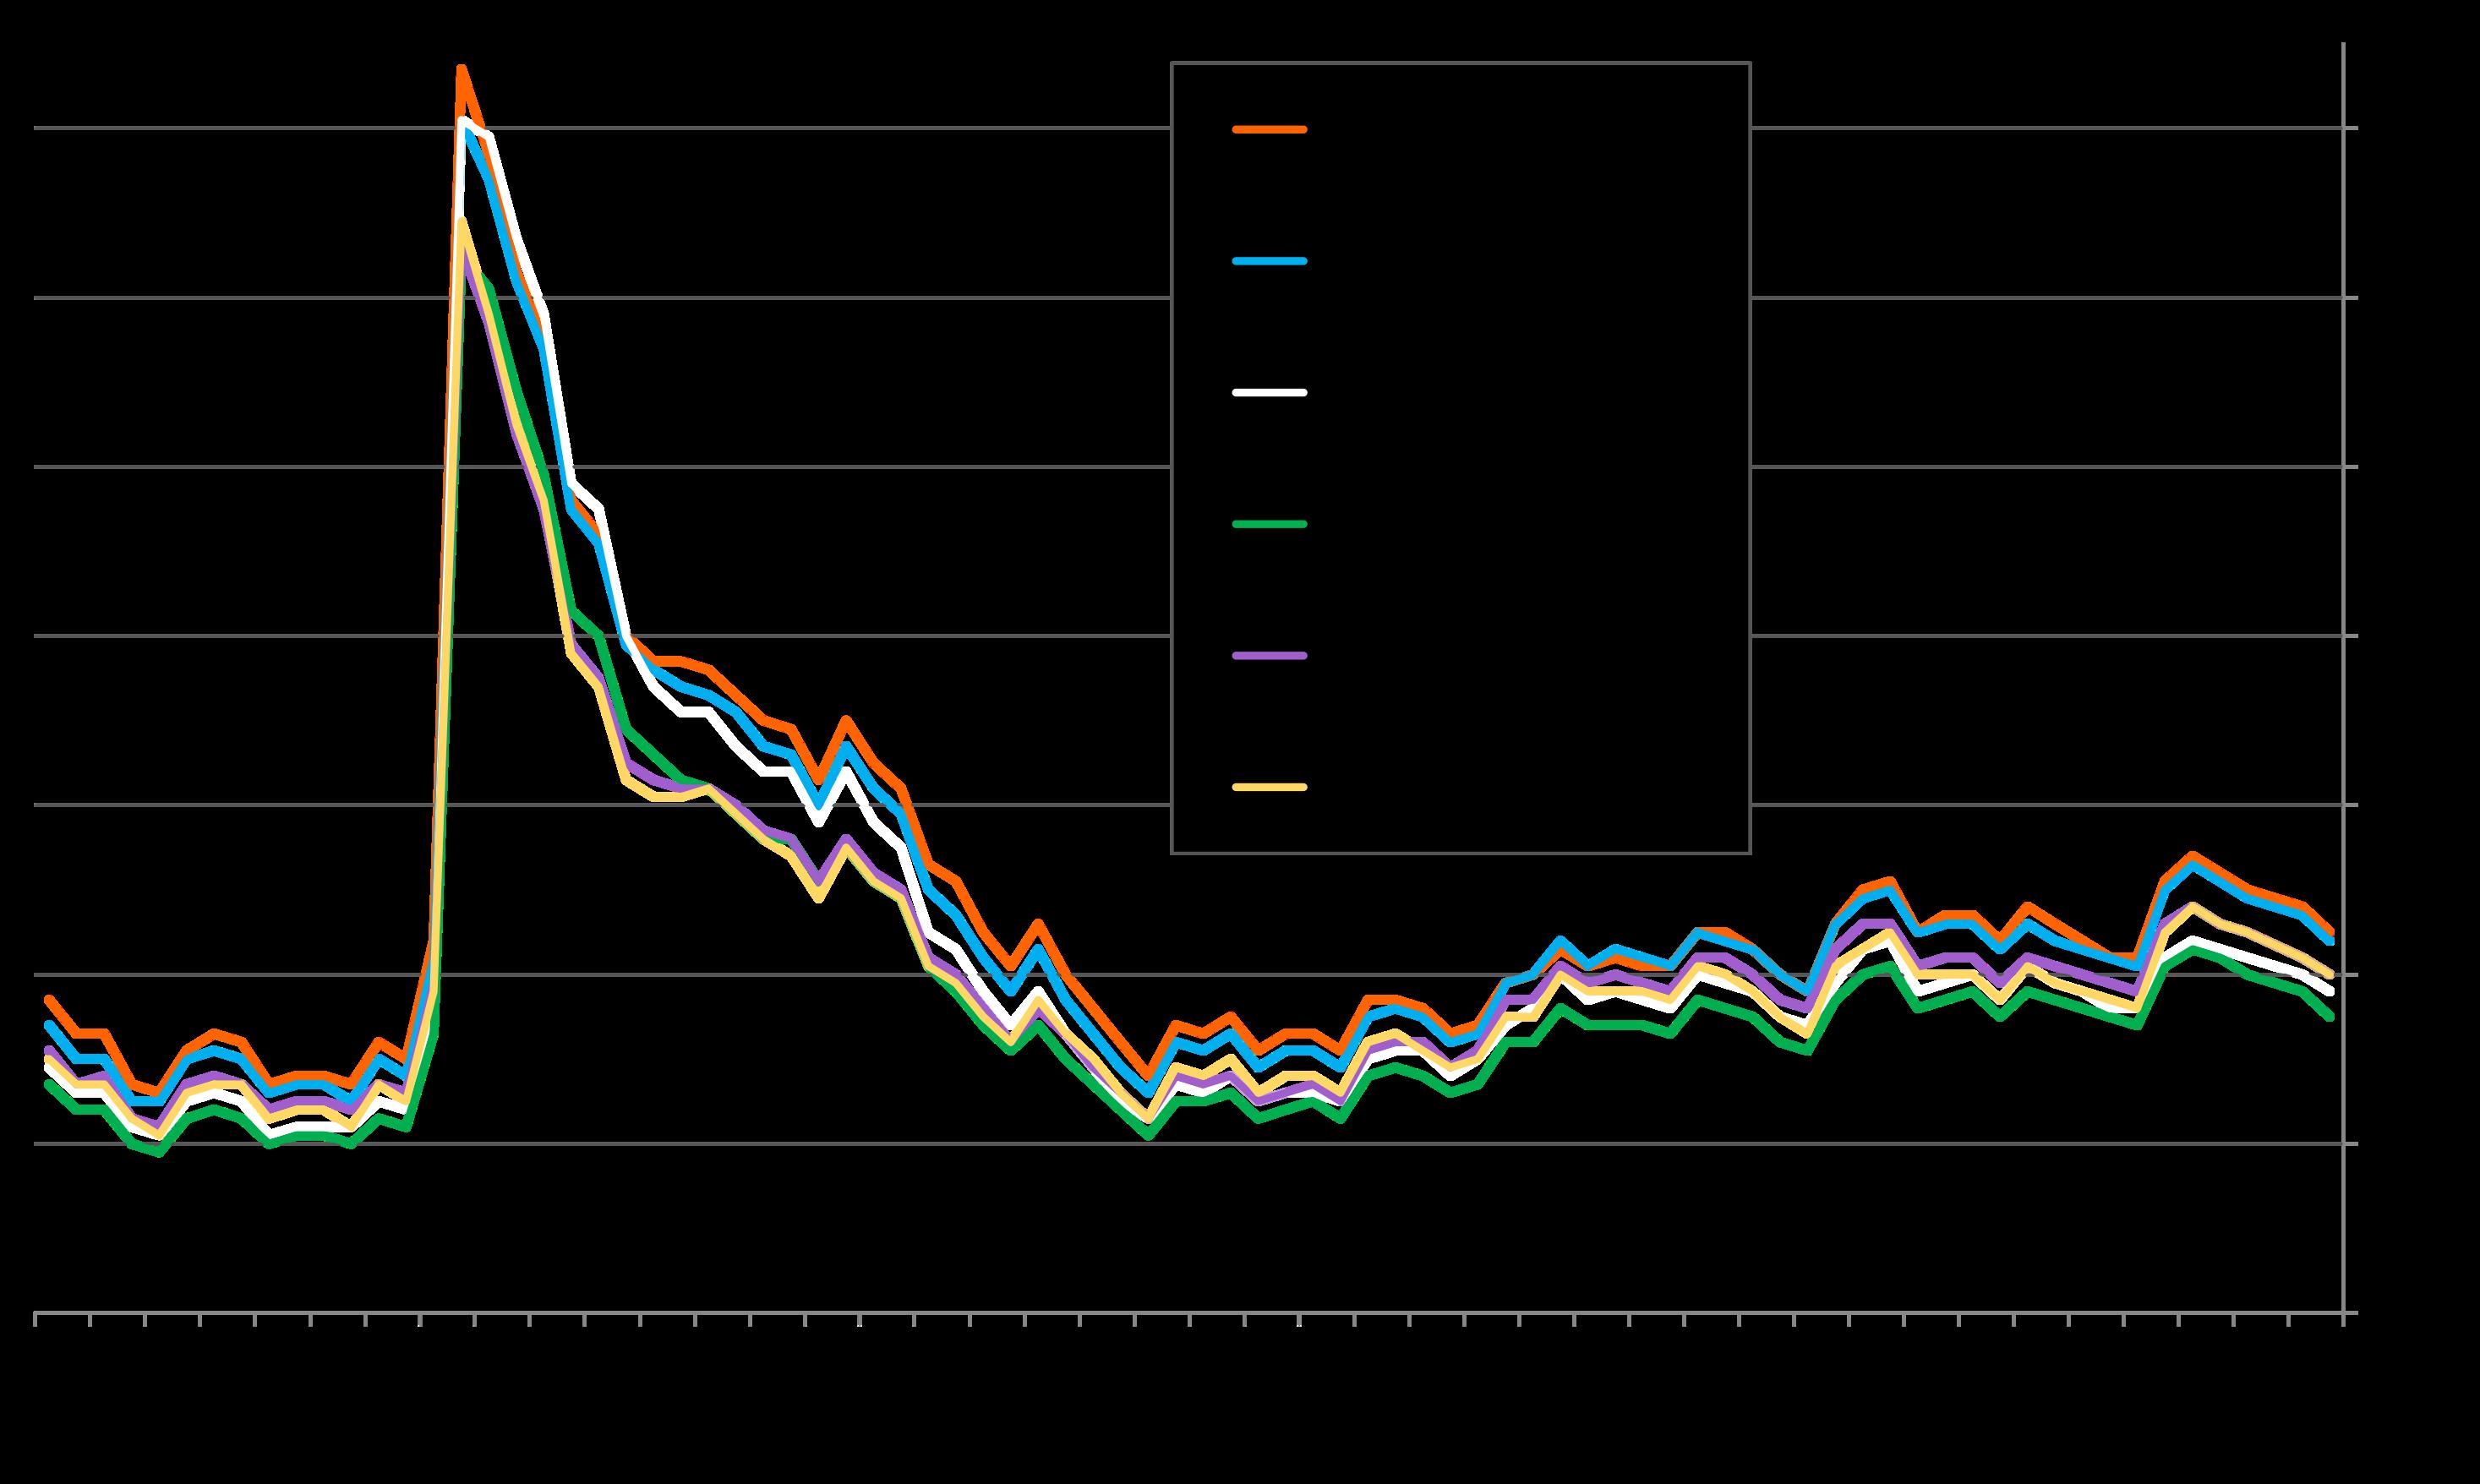
San Francisco Bay Area Unemployment Rates
Selected Bay Area Counties, since 2019
3,150,000
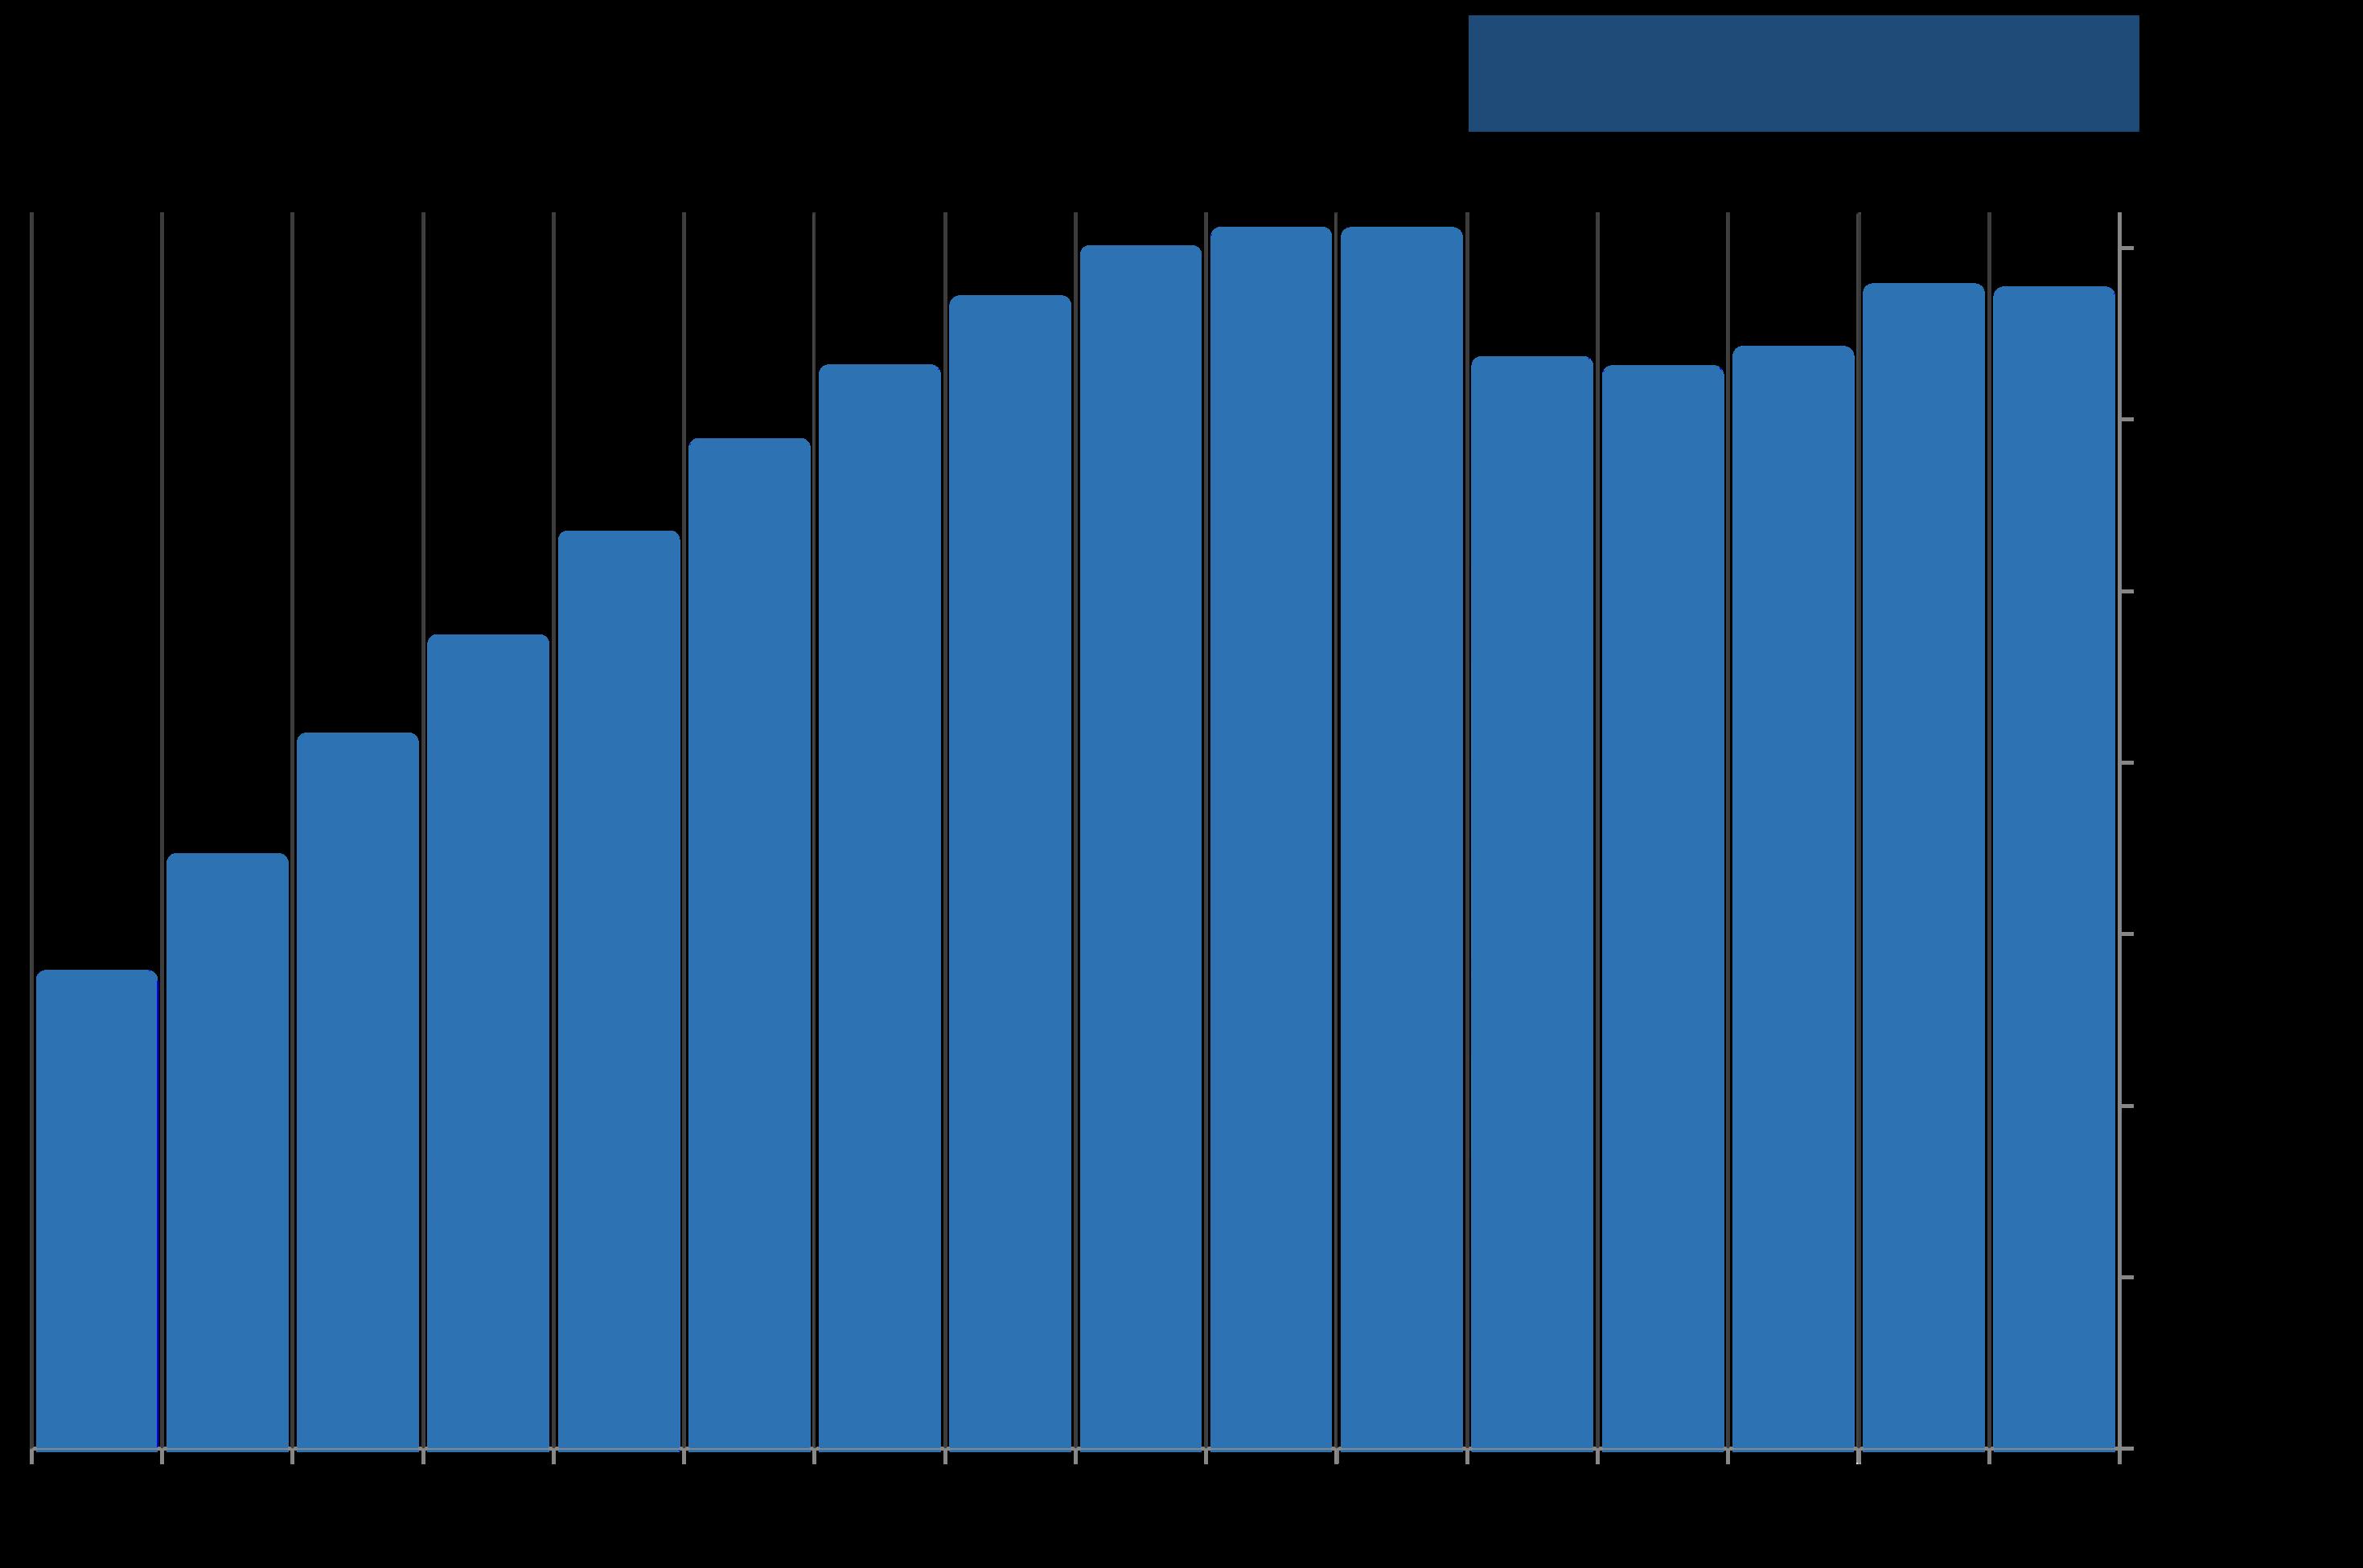
Federal Government Employment by
Month
since January 2012*
3,050,000
2,950,000
2,850,000 2,750,000 2,650,000
Federal government employment fell by 274,000 in 2025— the largest decline in any calendar year since 1946. Through November, the Dept. of Defenseshed 68,000 jobs,federal hospitals shed 16,000 jobs, the Postal Servicelost 6,000, and other Federal agencies, 185,000. U.S. Immigration and Customs Enforcement (ICE) added 12,000 employees.
Federal government employment spikes every 10 years because of temporary hiring for the decennial census. → New administration begins |
*Per U.S. Bureau of Labor Statistics (BLS), https://data.bls.gov/timeseries/CES9091000001. Seasonally adjusted. Data for last 2 months is preliminary. Data from sources deemed reliable but not guaranteed. All numbers approximate and subject to revision.
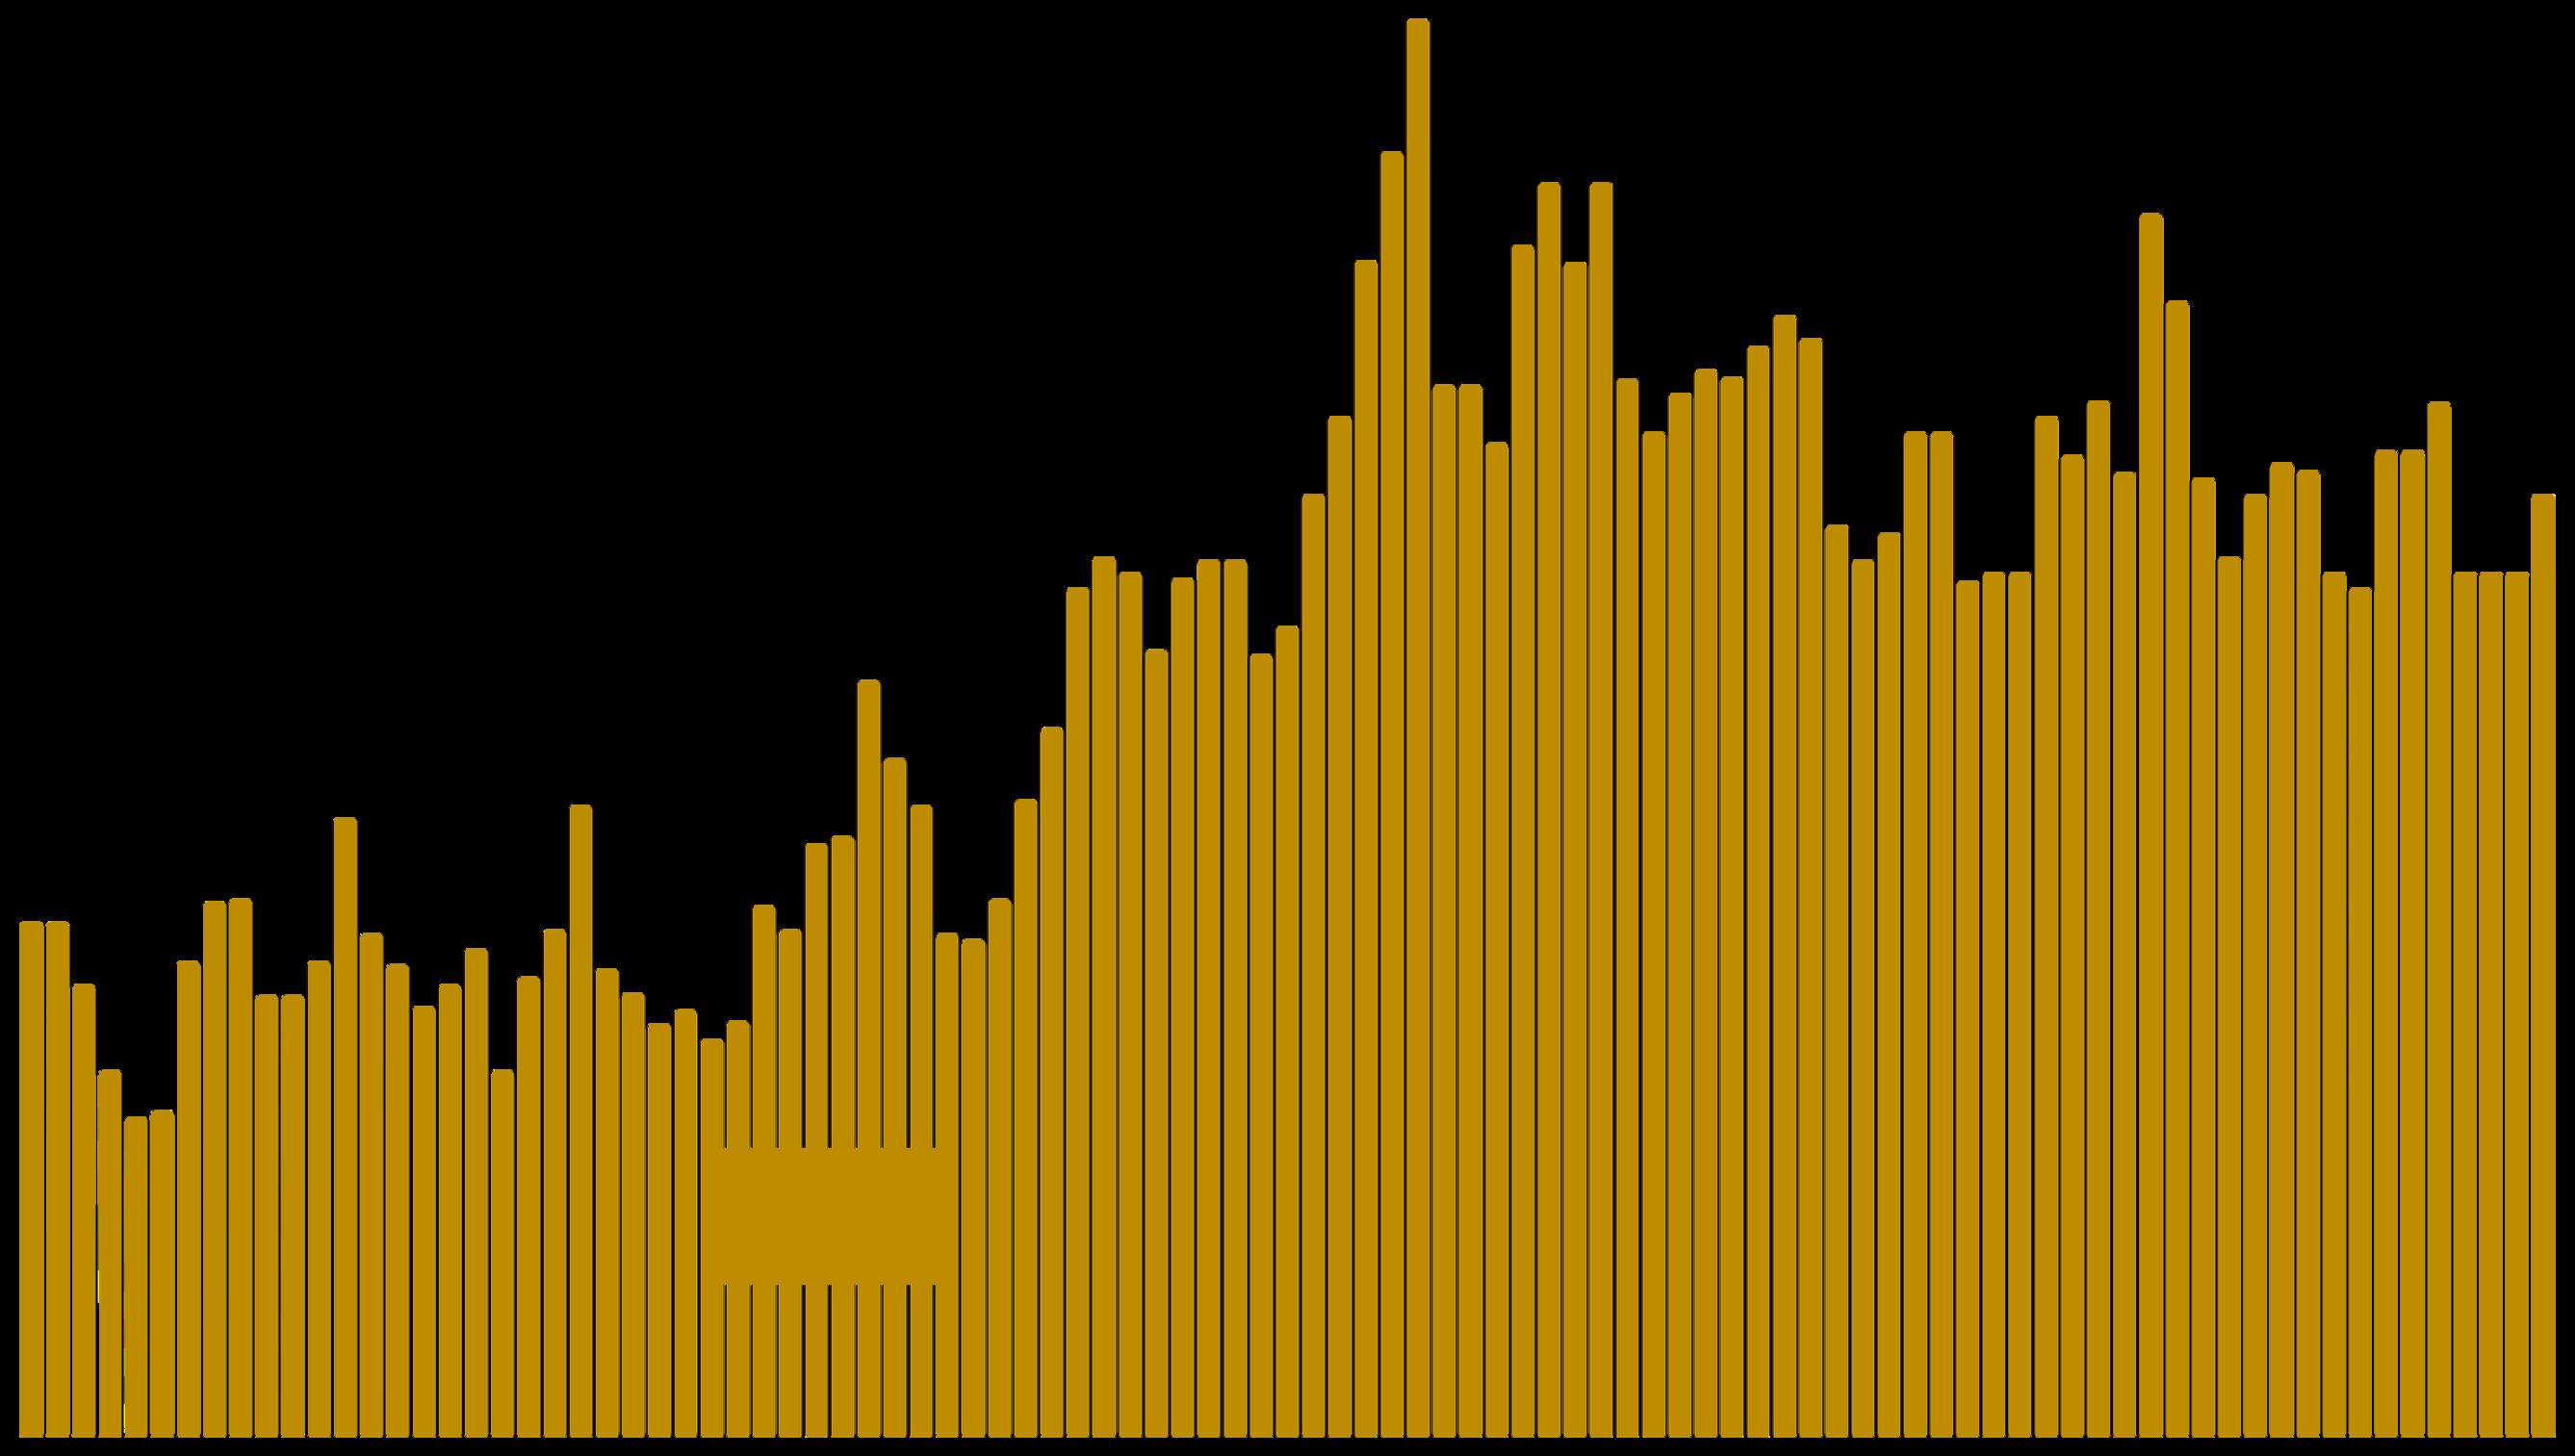
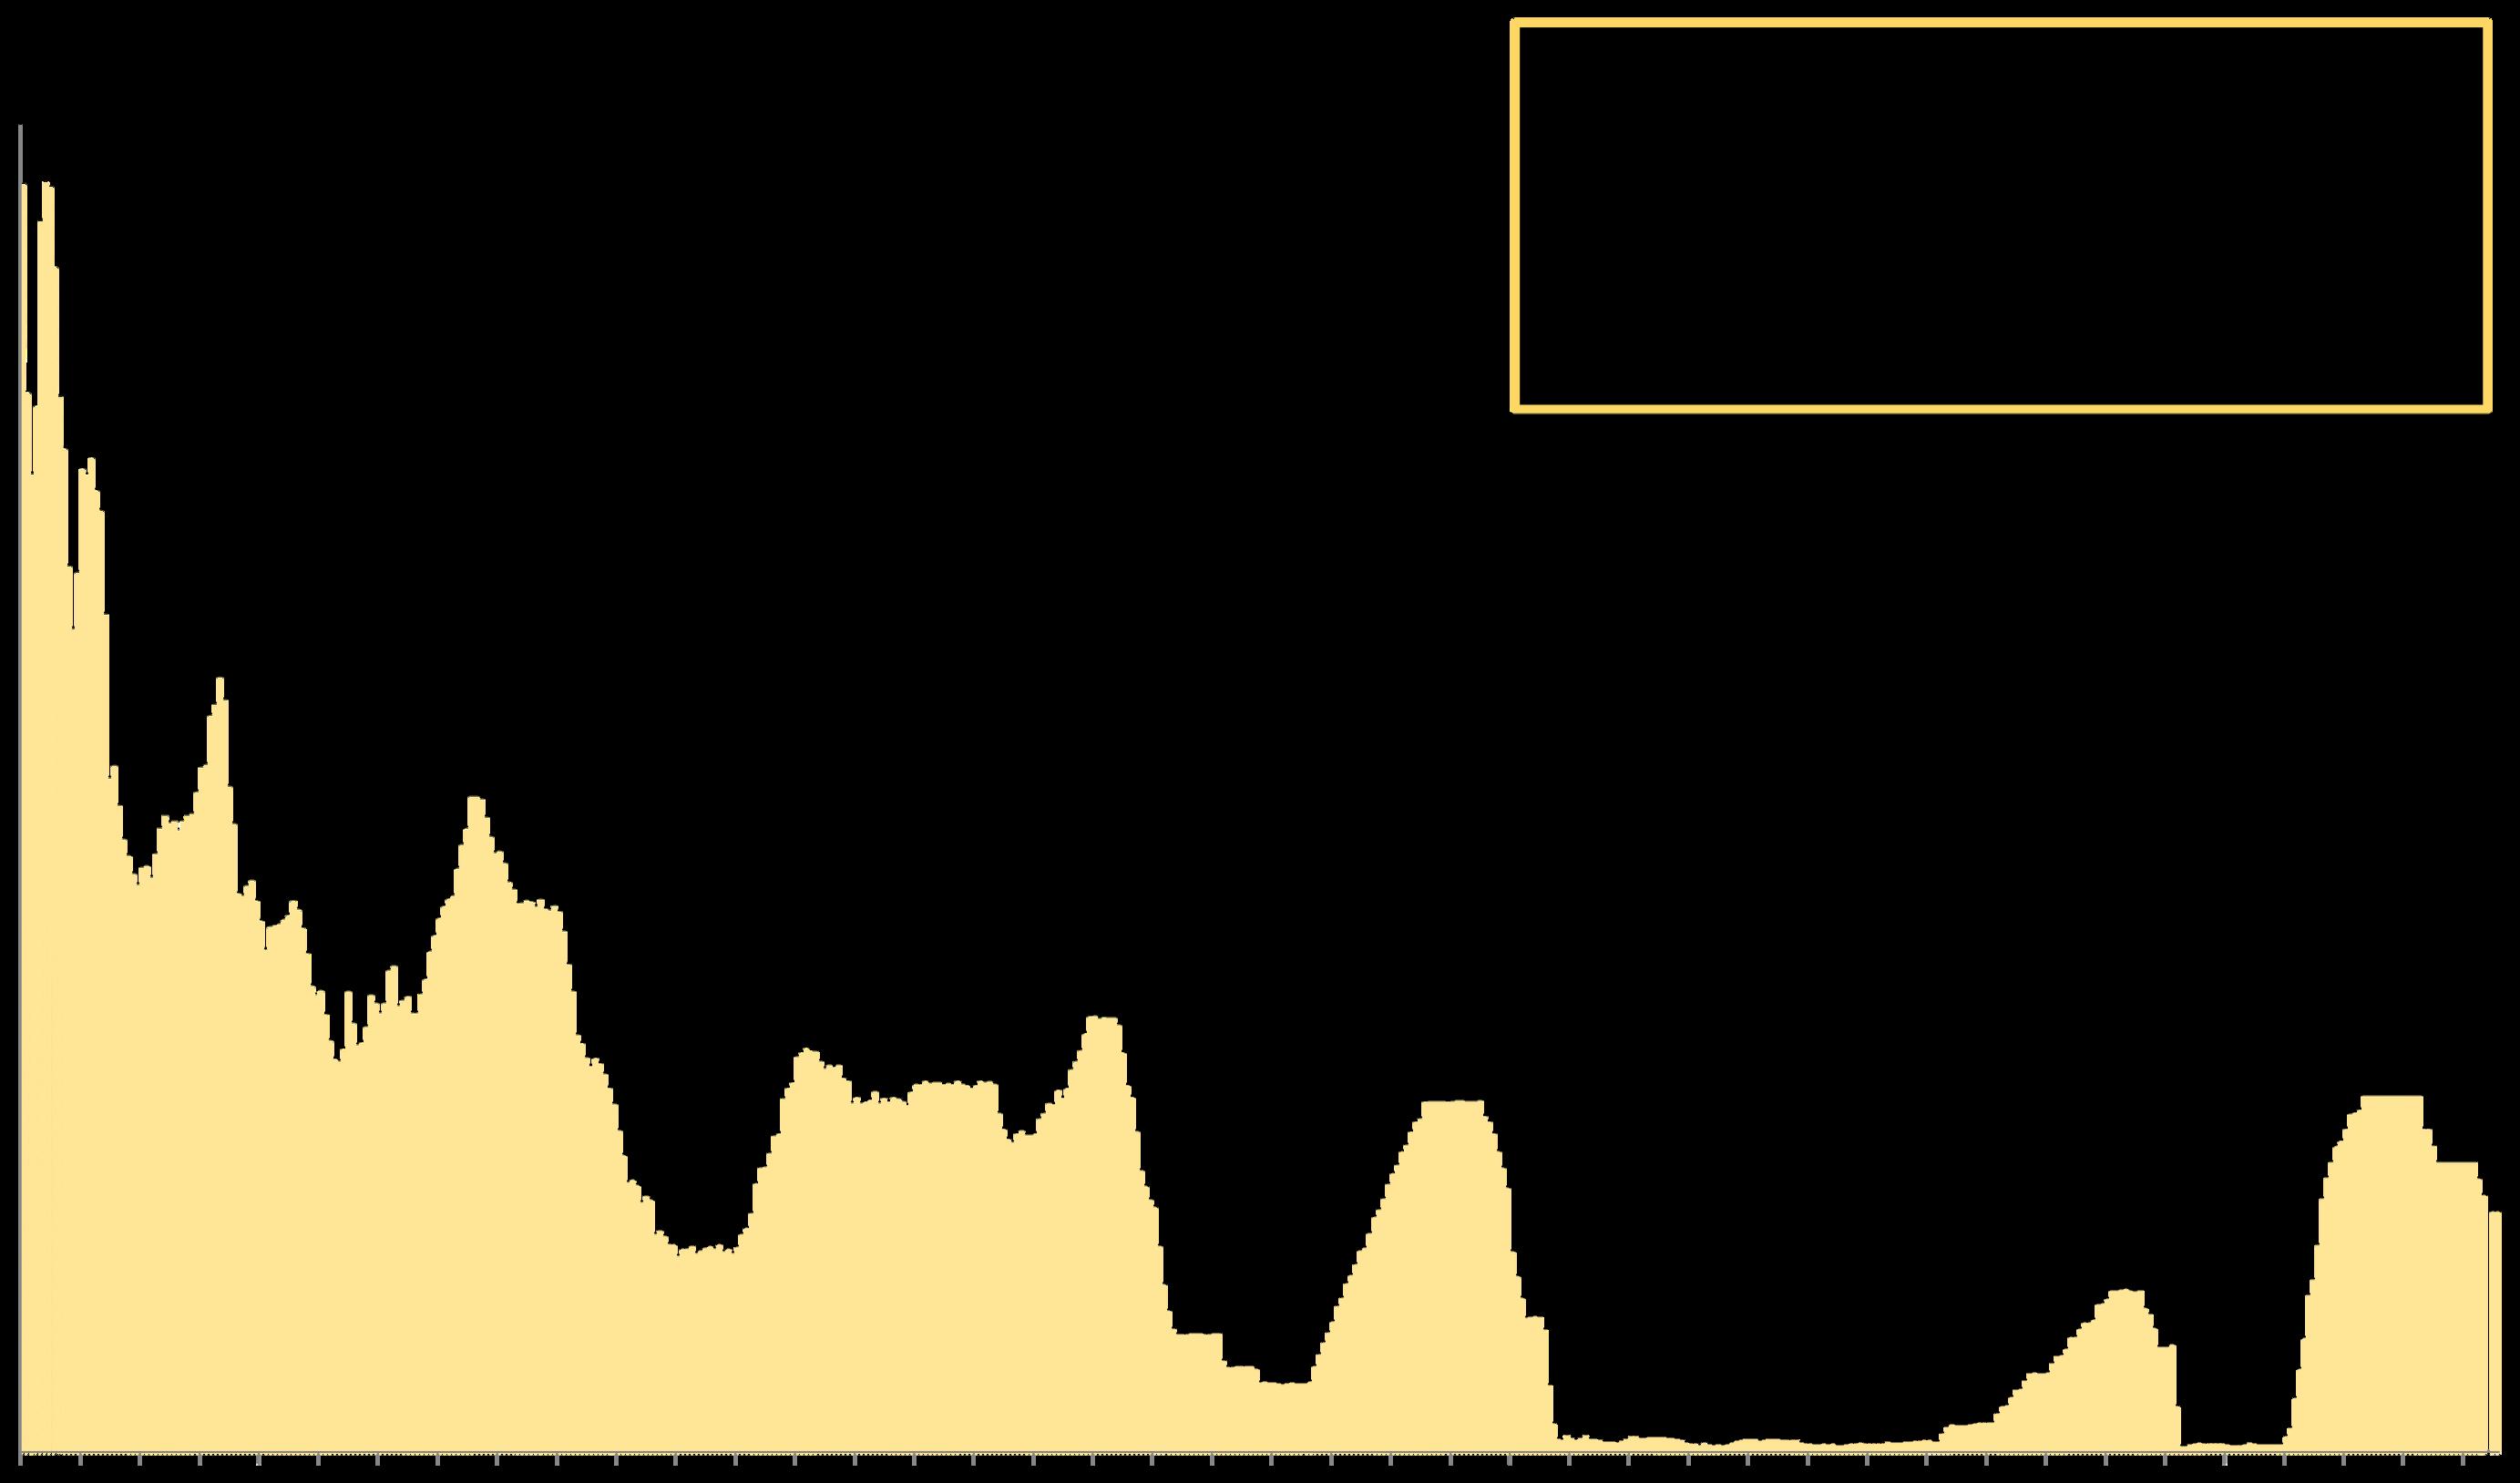
ByDaysinceMarch 7, 2024
Data per https://www.nasdaq.com/market-activity/cryptocurrency/btc/historical. Data from source deemed reliable but may contain errors and subject to revision. Cryptocurrency values change constantly and all numbers to be considered approximate.
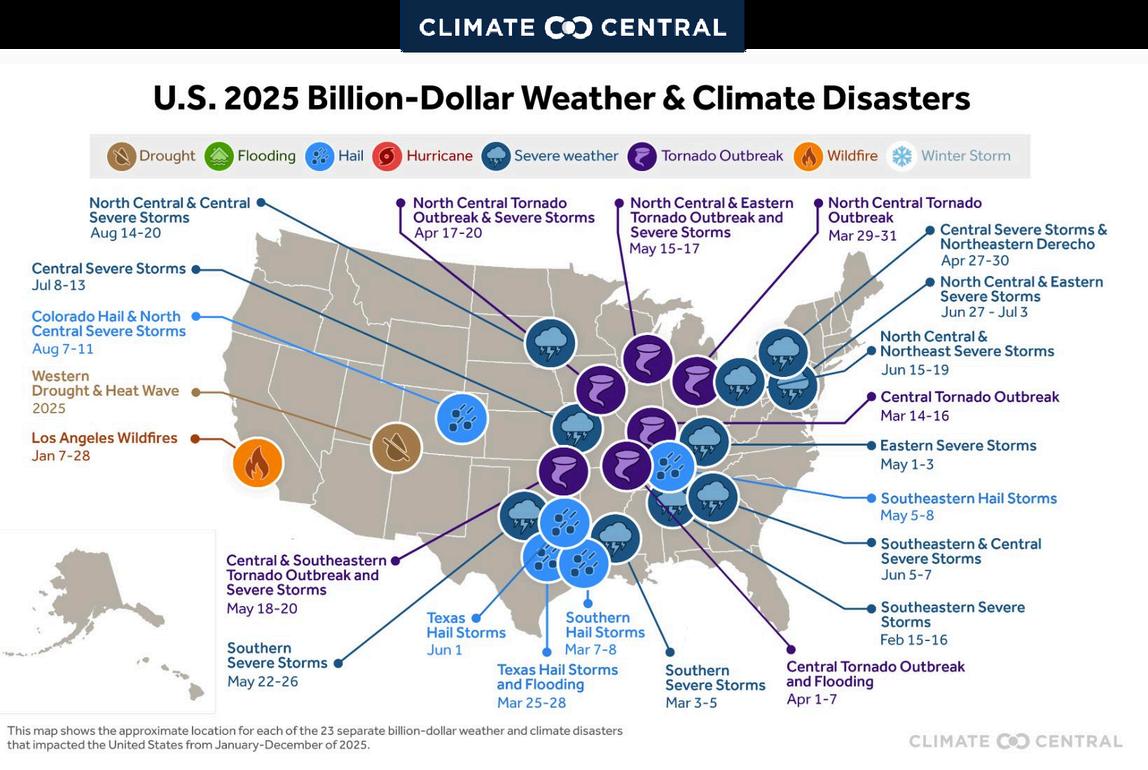
Per https://www.climatecentral.org/climate-services/billion-dollar-disasters. Data from sources deemed reliable but may contain errors and subject to revision.
Statistics are generalities, essentially summaries of widely disparate data generated by dozens, hundreds or thousands of unique, individual sales occurring within different time periods. They are best seen not as precise measurements, but as broad, comparative indicators, with reasonable margins of error. Anomalous fluctuations in statistics are not uncommon, especially in smaller, expensive market segments. Last period data should be considered estimates that may change with late-reported data. Different analytics programs sometimes define statistics – such as “active listings,” “days on market,” and “months supply of inventory” – differently: what is most meaningful are not specific calculations but the trends they illustrate. Most listing and sales data derives from the local or regional multi-listing service (MLS) of the area specified in the analysis, but not all listings or sales are reported to MLS and these won’t be reflected in the data. “Homes” signifies real-property, single-household housing units: houses, condos, co-ops, townhouses, duets and TICs (but not mobile homes), as applicable to each market. City/town names refer specifically to the named cities and towns, unless otherwise delineated. Multi-county metro areas will be specified as such. Data from sources deemed reliable, but may contain errors and subject to revision. All numbers to be considered approximate.
Many aspects of value cannot be adequately reflected in median and average statistics: curb appeal, age, condition, amenities,
views, lot size, quality of outdoor space, “bonus” rooms, additional parking, quality of location within the neighborhood, and so on. How any of these statistics apply to any particular home is unknown without a specific comparative market analysis.
Median Sales Price is that price at which half the properties sold for more and half for less. It may be affected by seasonality, “unusual” events, or changes in inventory and buying trends, as well as by changes in fair market value. The median sales price for an area will often conceal an enormous variety of sales prices in the underlying individual sales.
Dollar per Square Foot is based upon the home’s interior living space and does not include garages, unfinished attics and basements, rooms built without permit, patios, decks or yards (though all those can add value to a home). These figures are usually derived from appraisals or tax records, but are sometimes unreliable (especially for older homes) or unreported altogether. The calculation can only be made on those home sales that reported square footage.
Photo use under the Creative Commons License: https://creativecommons.org/licenses/by-sa/2.0/
Compass is a real estate broker licensed by the State of California, DRE 01527235. Equal Housing Opportunity. This report has been prepared solely for information purposes. The information herein is based on or derived from information generally available to the public and/or from sources believed to be reliable. No representation or warranty can be given with respect to the accuracy or completeness of the information. Compass disclaims any and all liability relating to this report, including without limitation any express or implied representations or warranties for statements contained in, and omissions from, the report. Nothing contained herein is intended to be or should be read as any regulatory, legal, tax, accounting or other advice and Compass does not provide such advice. All opinions are subject to change without notice. Compass makes no representation regarding the accuracy of any statements regarding any references to the laws, statutes or regulations of any state are those of the author(s). Past performance is no guarantee of future results.