5 minute read
01.3 Historic Character Overview


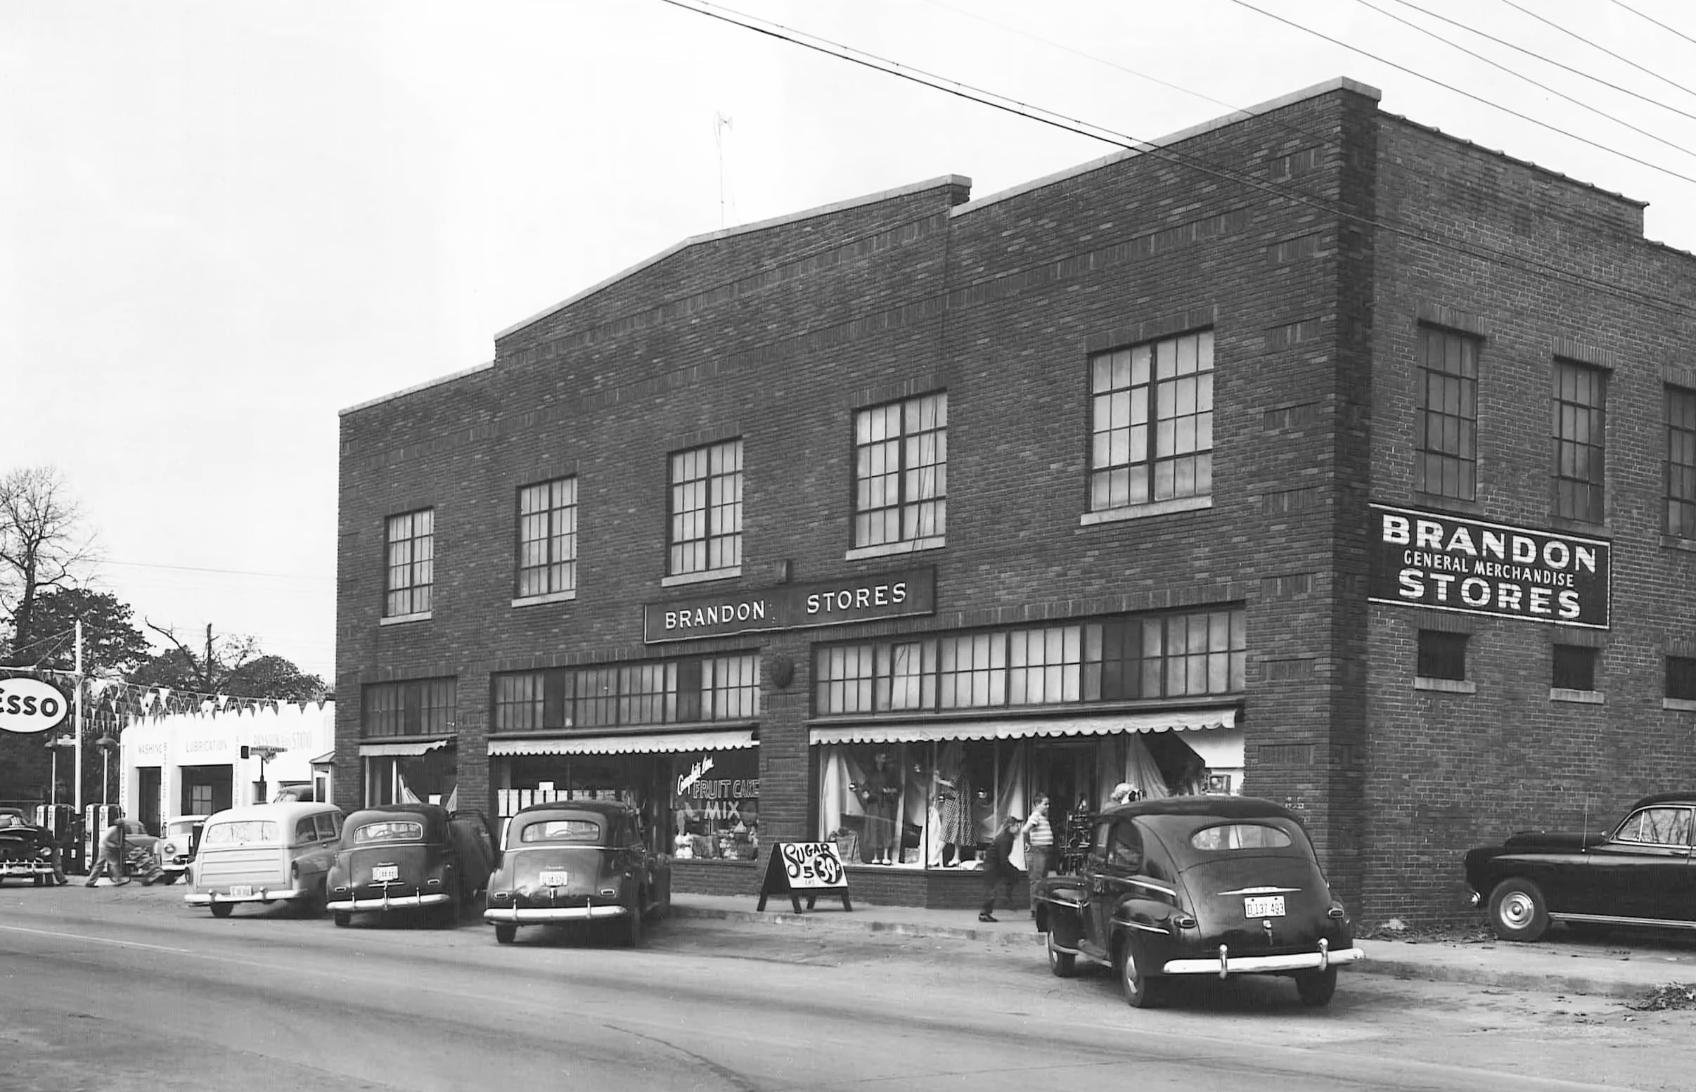
Due to its origins as a textile mill community, many of the Village’s dominant buildings are low-slung, and composed of 1, 1.5, or 2-story masonry construction, intended to house the small-scale businesses that served local mill employees until the mid-twentieth century. As they were constructed to prioritize pedestrians, such as those walking from homes in the surrounding blocks, the structures offer attributes conducive to an active streetscape, such as high levels of ground floor glazing, minimal setbacks, and a human scale. Furthermore, instead of long, repeating forms, the buildings along Pendleton Street exhibit a diversity of facade designs, helping to make the local urban environment more inherently interesting. As planners and designers nationally have called for a return to walkable cities, and especially urban retail districts, the Village represents a premiere existing example of this form and has embraced these designbased roots to fuel its resurgence.
Even within its limited area, the Village contains other large commercial buildings not located directly along Pendleton Street. Aside from the mills, most prominent among these are Poe West, a 1940s non-textile industrial facility with a large addition dating from the 1960s, and West Greenville Plaza, a midcentury, suburban-style strip mall, occupied with various discount tenants. Due to their out-of-the-way situation and less pedestrianfocused or interesting design, adapting them to better engage with the Village of today has proven more challenging.
Advertisement
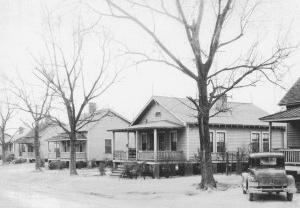
The Village also contains many blocks of single-family homes dating from the mill’s heyday, arranged along irregular street grids, some of which partially fall into the 20-acre boundary. These saddlebag homes are small, almost all single-story with gabled roofs, and feature front porches. Once home to those locally employed, the examples within the study area have generally fallen into disrepair. Located at 4 Smith Street, the Morgan House, however, stands apart from these other properties. The historic home of a Brandon Mill superintendent, this distinct, two-story structure boasts bright white paint and a wraparound porch, a feature unique for the neighborhood, establishing it as the best residential historic resource in the Village. Overall, the Village is what it is today because of its history. It has served as home to generations of mill workers and families, attracted adventurous small business owners, and cultivated local artists who provide its flare. It is through the history and contributions of each group, which is embedded in its built form, that the Village maintains its identity as a special node.
1.4 Importance of GVL 2040
Greenville’s comprehensive plan, GVL 2040, outlines a new approach to growth, centered on increased density and infill development in order to cultivate a more walkable, urbanized city over the next two decades. The document, and its accompanying land development regulations to be adopted in the spring of 2023, seek to concentrate densification across downtown and twelve other nodes -an industry term used to describe mixed-use community hubs along corridors suited for higher intensity development. GVL 2040 envisions these nodes serving Greenville’s neighborhoods as miniature downtowns and local commercial centers, providing locals with walkable access to daily needs. Nodes will be interconnected via densified corridors.
In the comprehensive plan, the Village of West Greenville, and Pendleton Street, which runs through the heart of the area, have been designated as node and corridor, respectively. In order for them to support a vibrant mix of uses, it has been recommended they are allowed to be developed at an average density of 30 dwelling units per acre (dua), with the Village’s Micro Area Plan suggesting individual buildings on catalyst sites be increased up to 90 dua (Wernick & Co, 2021, p. 63). GVL 2040 also highlights that this style of development will preserve existing neighborhoods while adding variety to the housing stock (both in terms of form and price) in the areas of higher density with the most services.
The importance of the comprehensive plan and land development regulations is that their recommendations and legislation outline the city’s vision for the Village to grow denser and increasingly mixed-use. Noting this, the suggestions in this plan offer how to reconcile these changes, which have been done in the interest of advancing affordable housing and environmental goals, with the demands of the neighborhood and the perspective of legacy residents.
Within the study area used to define the Village (discussed in Section 2.2b), there were 1,020 total residents across 465 households, by 2022 estimates. Nearly half of these were family households. Altogether, the area demonstrated low levels of median household income ($34,135) compared to the city ($58,259) and county ($62,422), as well as a low median disposable income of $28,654. As disposable income represents the amount remaining after taxes paid, residents generally do not have the income necessary to spend at destination restaurants or buy the expensive townhomes being developed in the Village today, highlighting one of the area’s current struggles.
The community is very diverse, with a population 42% African American, 32% white, and nearly 9% identifying with two or more races. About 24% of the population reported Hispanic origins. Employment is stable, at 95.1%, but only 14.1% of the population over age 25 holds a bachelor’s degree, far lower than the 50.8% citywide.
Between 2000 and 2020, the study area population has actually shrunk, but with the new housing developed in the last decade, this trend has quickly turned around and is projected to continue. In fact, between 2010 and 2020, the Village grew nearly twice as fast as the rest of the country. As such, this Plan is relevant and necessary to provide direction for the most appropriate growth, and to activate and redevelop the area in a way that benefits the existing population and their needs.
1.5 Demographics
Within the study area used to define the Village (discussed in Section 2.2b), there were 1,020 total residents across 465 households, by 2022 estimates. Nearly half of these were family households. Altogether, the area demonstrated low levels of median household income ($34,135) compared to the city ($58,259) and county ($62,422), as well as a low median disposable income of $28,654. As disposable income represents the amount remaining after taxes paid, residents generally do not have the income necessary to spend at destination restaurants or buy the expensive townhomes being developed in the Village today, highlighting one of the area’s current struggles.
The community is very diverse, with a population 42% African American, 32% white, and nearly 9% identifying with two or more races. About 24% of the population reported Hispanic origins. Employment is stable, at 95.1%, but only 14.1% of the population over age 25 holds a bachelor’s degree, far lower than the 50.8% citywide.

Between 2000 and 2020, the study area population has actually shrunk, but with the new housing developed in the last decade, this trend has quickly turned around and is projected to continue. In fact, between 2010 and 2020, the Village grew nearly twice as fast as the rest of the country. As such, this Plan is relevant and necessary to provide direction for the most appropriate growth, and to activate and redevelop the area in a way that benefits the existing population and their needs.
Sources: ESRI Business Analyst 2022 estimates, American Community Survey
2022 Total Population: 1,020
2020 Total Households: 465
2020 Family Households: 232
2020 Family Households: 49.89%
2022 Median Household Income: $34,135
2022 Median Home Value: $115,000
2022 White Population: 32.16%
2022 Black Population: 42.06%
2022 Total Population: 1,020
2020 Total Households: 465
2020 Family Households: 232
2020 Family Households: 49.89%
2022 Median Household Income: $34,135
2022 Median Home Value: $115,000
2022 White Population: 32.16%
2022 Black Population: 42.06%
2022 Asian Population: 0.29%