
8 minute read
Intuitive working with the new customer portal


Submitting and managing samples, controlling actions.
The OELCHECK customer portal www.LAB.REPORT (without .de or .com) has not only changed its address. The new interface offers additional functions that can be accessed more quickly!

coloured status bar on the right-hand side. By clicking on the red-coloured box, for example, you can deal with samples that, in the opinion of the OELCHECK diagnostic engineer, require action on your part. Under the ‚Unopened‘ tab, you will find an overview of samples that have not been viewed yet.
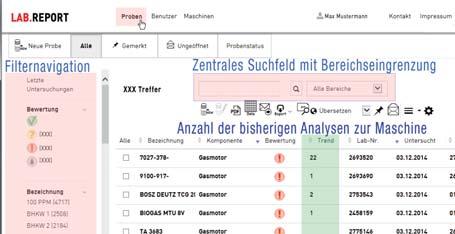
The ‚Samples‘ section
This gives you complete control over all your samples. Sort and filter according to a variety of different criteria and initiate desired actions using the icons.
The ‚Unopened‘ tab
Samples that have been analysed in the past 30 days and whose data table or PDF laboratory reports are still unopened are listed here. Using the search fi eld or the filter sidebar, you can easily add further filters.
‚Sample status‘ tab
Request login details and get going. Not yet a user of our www.LAB.REPORT customer portal? If you are a customer, navigate to www.lab. report in your browser and request your password by clicking on ‚Create account ‘. You will receive this immediately by email and should change it in your account settings after login. You can change your settings by clicking on your username. All the customer portal‘s functions are available for you online at any time.
If you are already a user of www.laborberichte.com you can use your existing access details on the new portal. Even if you have not already examined samples on our site, you can try out the portal‘s functions with its analysis results of more than 200 example samples through the ‚Guest login‘ link. Instead of just being able to search for and administer analysis data of all your samples, you now have access to a modern portal that can also be used with smartphones and tablets. Its intuitive interface gives you access to its enhanced functions. For example, you can now enter your own limit values for your machines and systems, and recognise trends with even greater precision, allowing you to organise the condition monitoring of your machines and lubricants in a more systematic and far more effective way. And all this with less data input and administrative effort!
The latest information at a glance
After you have logged in with your personal password, the number of unread laboratory reports in
Using the central search fi eld in the middle of the screen or filter sidebar on the left, you can search for your samples and filter them accord- the relevant evaluation category since your last visit (up to a maximum of 30 days) appears in the to cer tain criteria a search term or ing to certain criteria. Entering a search term or restricting the search in certain areas (dropdown menu next to the search fi eld) changes the entries listed in the filter sidebar to the left. Inspired by the major search engines, this approach allows you to filter in such detail that you can, for example, easily forward laboratory reports or analysis results for single or several machine units. Alternatively, you can choose the unit for which you want to send in a new sample, without having to manually fill in a sample form.
If a sample has been received by us, where can it be found? Using the links ‚Samples not received‘, ‚Samples in laboratory‘, ‚Samples being diagnosed‘ you can view the status of the samples for which no laboratory report has been compiled yet. Under ‚ All‘ you can also find samples that have already been examined.
If your sample has not yet been received by us, you can, under ‚Samples not received‘, still use the 】 icon to make corrections to your sample data.


‚All‘ tab can be ef
All samples to which you have access are listed under this heading. If ‚Recent analyses‘ is clicked in the left-hand filter sidebar, only the latest sample for the unit being searched for will appear as a oneline entry. In the ‚Trend‘ column you can then see how frequently a sample from the unit in question has already been analysed. The number of hits found next to the central search fi eld is updated accordingly. By clicking on ‚ All analyses‘ or ‚Reset all filters‘ analysed samples can be listed as a oneline entry again.
If you only notice the necessary changes when the samples have already arrived at the laboratory, are awaiting diagnosis or have already been evaluated, then these changes can only be effected through our technical secretariat. The changes will then result in a charge or will only take effect in the next study.
The ‚Units‘ section
One of the main reasons for the creation of the new portal was to simplify the sample input process – via PC and now by smartphone and QR code as well!
Before you can submit data for new samples, the unit to which the sample belongs has to be selected first. If a sample from the same unit has already been examined previously, the selection is easy.
If you want to send in the first sample for a unit, you can also register new units and their components under ‚Units‘. Even if you do not want to send in a sample at the moment, you or your employees can already set the unit up in advance. Thus, a 〠 QRCode can be generated and attached to the unit before the first sample is submitted. When entered by PC, the data will then be accepted seamlessly. In addition, unit management allows you to set your own limit values for each component or its lubricant.
Using unit management you can: set up new units change unit data set up a component for a unit set limit, warning or threshold values submit different or additional recipients of laboratory reports
Submitting a sample now by QR code and smartphone
Since December 2014, a square QR (Quick Response) code has been printed on the lower righthand corner of all laboratory reports. Using the free QR Scanner app, the QR code can be read with your smartphone or tablet.
The code contains a direct link to the sample for which the laboratory report was compiled. Scanning the QR code on the laboratory report or the sticker on the unit will take you directly to the sample input for the unit in question. All you then have to do is to stick the laboratory number sticker from the sample form onto the sample container and write the oil‘s current service life on it. All the remaining information that you would otherwise have had to fill in on the sample form has already been stored with QR code.
Make your life easier.
Stick the machine‘s QR code next to the oil access point and scan the QR code with your mobile phone when taking a sample. The machine will be found immediately in LAB. REPORT
Search in LAB. REPOR T for the machine and click on the 〙 symbol or scan the QR code of the previous laboratory report.
Only fill in the fi elds for the laboratory number and the service life. Complete or change the remaining information when possible or necessary.
Stick the laboratory number label from the sample form of the pre-paid analysis set onto the sample container.
generate or print QR code for sticking onto the unit or component export unit data in various file formats. Our tip: be structured and systematic. Specify the person who has responsibility for managing the unit, if several employees have access. Create consistent criteria for all entries. Avoid setting up the same unit with different names. Otherwise, trend observation will be practically impossible.
If you would like to switch to making sample submissions by smartphone and QR code only, you can generate the QR code in ‚Units‘ and attach a printout to the unit.
‚Users‘ section
Everything at once, but still separate. Are you managing and controlling oil analyses for more than one company department or various end users? Do you want to be able to grant your colleagues, customers or machine and lubricant manufacturers access to certain laboratory reports
An overview of the most important functions
Submitting new sample
Form for submitting a new sample opens. Have the laboratory number from the printed sample form ready!
Set up new units
Form for setting up a new unit opens.
Generate QR code
A QR code for copying and printing is produced for the selected unit. You will then only need the bar code with the laboratory number.
Laminate QR code and attach it to the unit to submit the sample by smartphone.
Show data sheet c Download laboratory report as PDF or selected units as ‚master user‘? No problem! By clicking on the ‚User management‘ button, which has to be enabled by us free of charge upon your request, you can set all details:
The analysis data of one or several samples for the same machine are shown along with diagnoses and pictures. If several samples are shown, the trend graph is incorporated above the analysis values. If there are more than 12 samples, export the data for greater clarity.
Simply send us your sample without the sample form once you have finished submitting the sample with your mobile device or PC.
De fine access rights for more users
Set up, change, block, delete users
Send access data by email
Export user data.
Compare and evaluate
The new customer portal has made it substantially easier to submit new samples for trend analysis. The development of individual components is listed in a clearer manner and can be evaluated more quickly.
The new filter functions allow all data to be presented in a targeted manner and easily compared. This provides you with quick answers to speci fi c questions such as:
Show sample form
Open individual laboratory report or download several reports at once as a zip file. a
The scanned sample form sent with the sample is shown. m
Forward laboratory report by email
An email is generated with the text of the diagnosis of the sample and, if required, your own comment and the laboratory report.
It is possible to set your own boilerplate texts and email services. 〔 Export sample data (CSV, Excel, XML)
Sample data can be exported and saved in different file formats, e.g. for inputting into Excel.
Set limit values, de fi ne warning and threshold values
Set individual limit values for every single component, such as the gearbox or bearing, or for its lubricant.
Translate laboratory report
Individual laboratory report can be translated into other languages if a standard diagnosis without individual adjustments has been compiled. Some comments in the diagnosis fi eld cannot be translated automatically.
If several samples have been ticked, the translated reports are supplied in a zip file.
Save sample i Mark specimen as read
The sample‘s line is marked yellow. Clicking on ‚ Saved‘ shows all saved samples.
Clicking on the line marks an unopened sample (bold) as read (unbolded). Same function as when opening the data view or the PDF laboratory report.
Samples already opened or yet to be edited can be restored to the unopened state.
Which lubricants were examined overall and with what evaluations? How do similar components of a machine type look when compared with each other e.g. with different service lives? And what is the volume of the oil charges?
Get going on www.LAB.REPORT

