














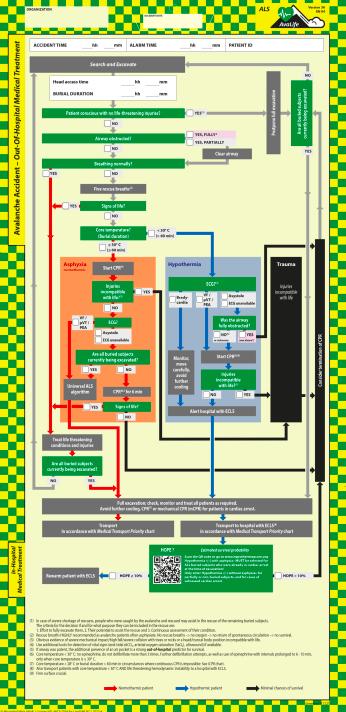
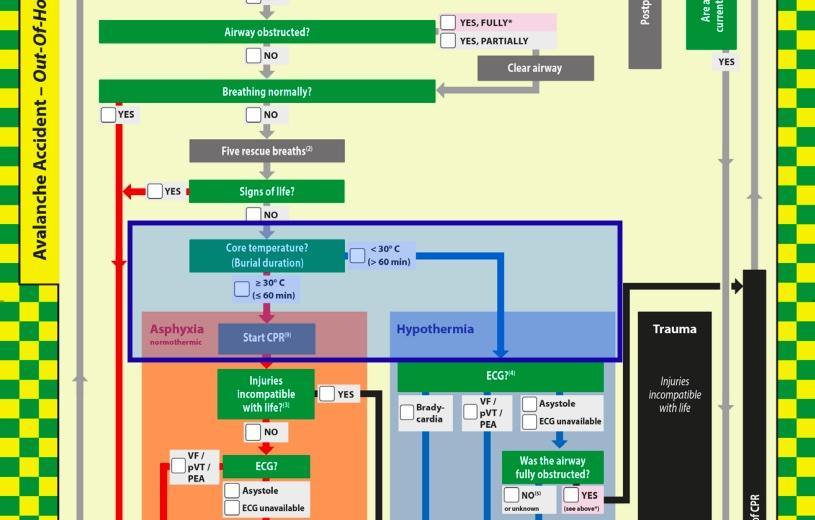
Introducing Core Temperature Monitoring and ECMO to Complete the Avalife Algorithm

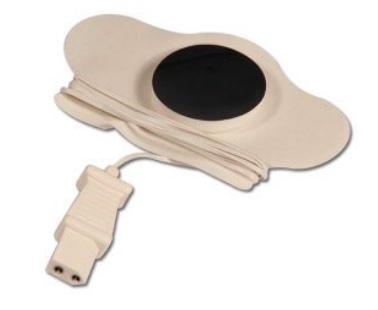
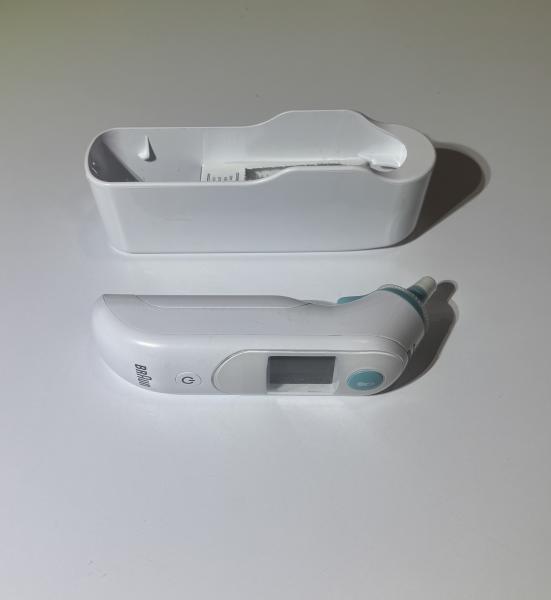
• Expected to be used on a large cohort of patient:
o Trauma patients
o Patients that are sedated and intubated
o Pediatric and Neonate ICU transfers
o Severely hyperthermic patients
o Accidental/environmental hypothermia patients
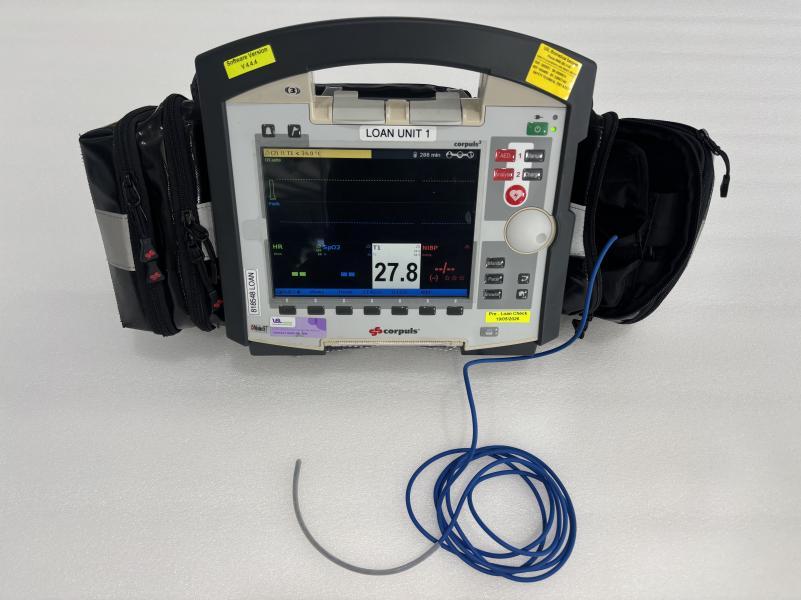
• Allows us to take accurate temperature readings
• Allows us to take a continuous temperature measurement
• Allows us to guide resuscitation during hypothermic cardiac arrest
• Allows us to triage and treat avalanche victims
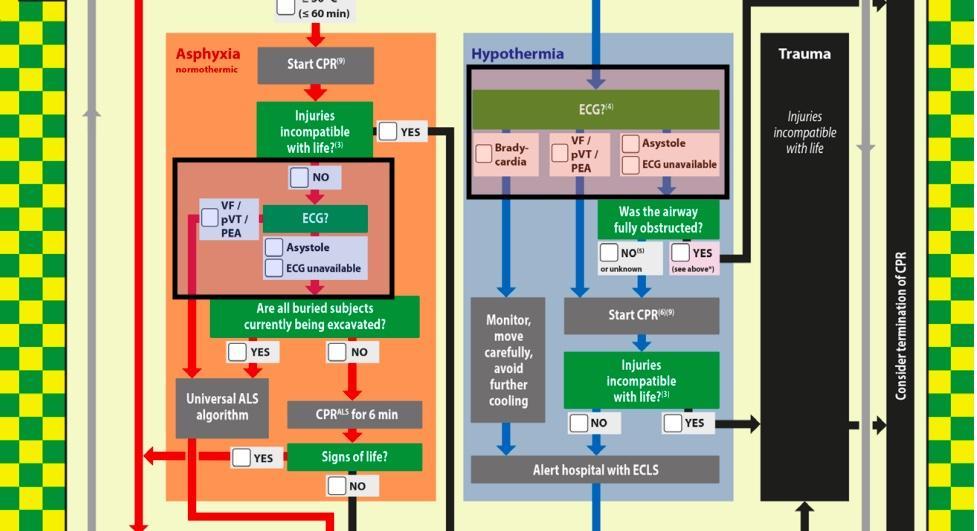
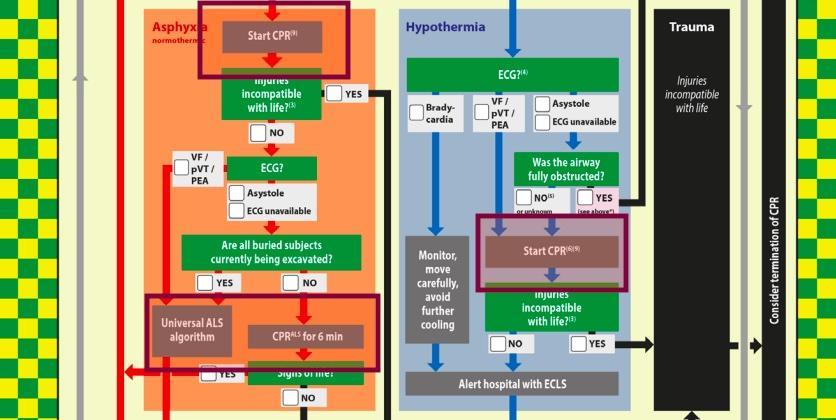
1. Using the measured core temperature to determine treatment pathways.
2. Using Electrocardiogram (ECG) analysis as a key decision point in triage, treatment and verification of death.
3. Advanced life support (ALS) techniques during cardiopulmonary resuscitation (CPR) that involves:
• End-tidal carbon dioxide (ETC02) monitoring.
• Point-of-care ultrasound (POCUS) to assess mechanical vs electrical activity of the heart.
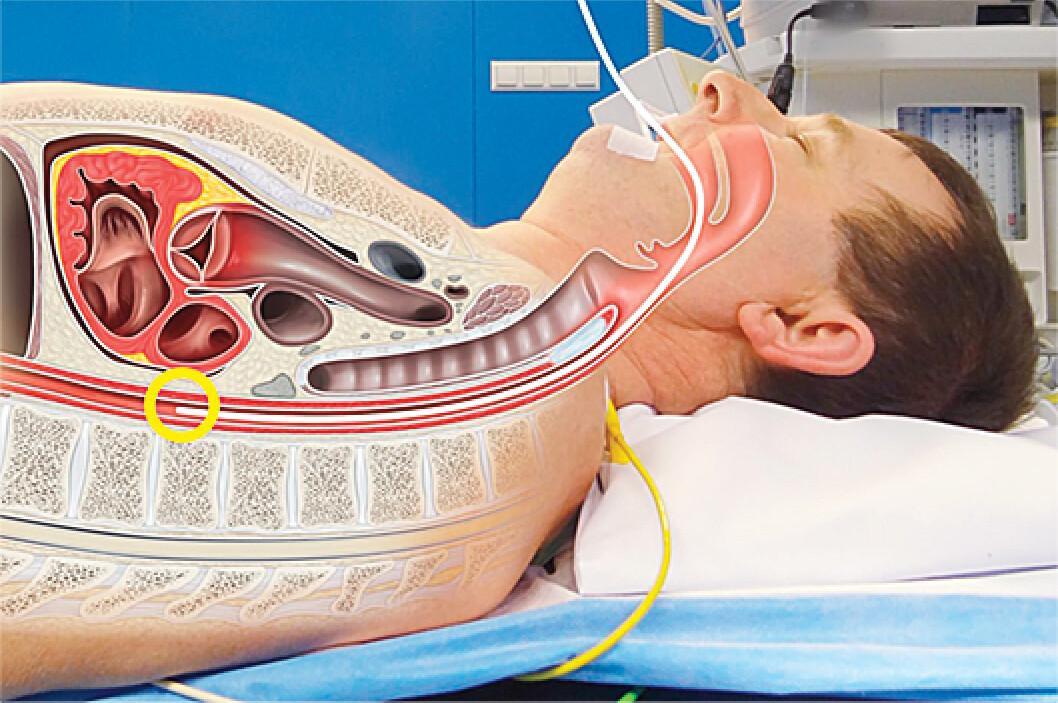
• Advanced airway and ventilation using endotracheal tube placement and mechanical ventilation.
• Mechanical chest compression device.
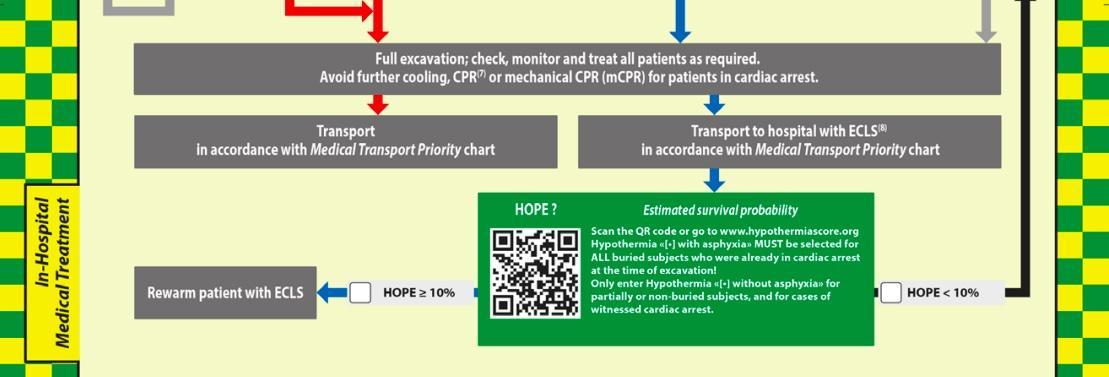
4. Hypothermia outcome after extracorporeal life support scoring
5. Extracorporeal membrane oxygenation (ECMO)

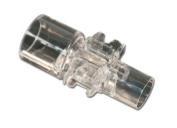
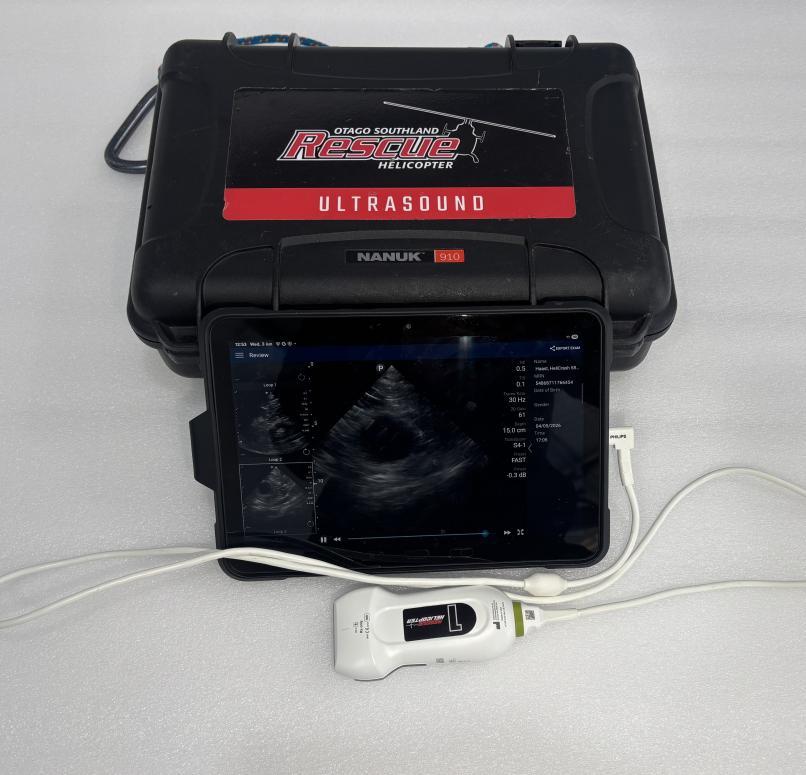
End-tidal C02 POCUS
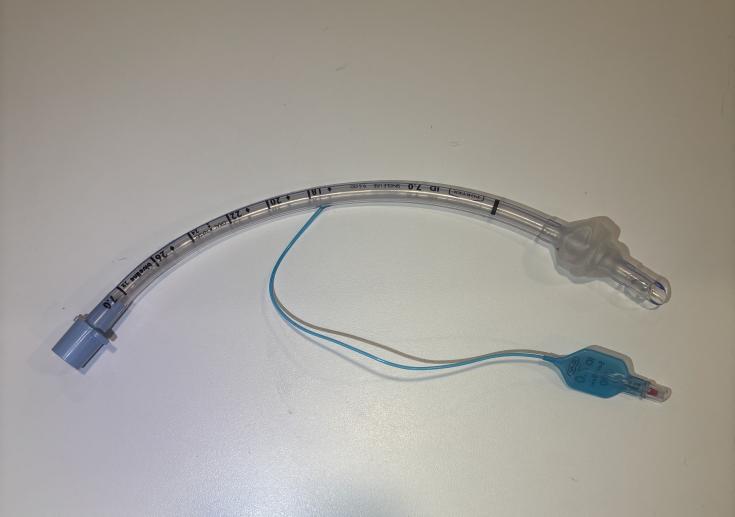

Endotracheal tube (intubation)
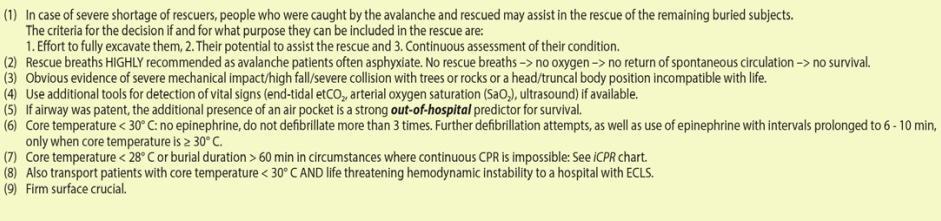
Core temperature guided drugs and electricity

• Advanced life support requires a multidisciplinary team with shared goals
• These goals are:
- Excellent patient care starting when the patient's head is uncovered.
- Informed and evidenced-based decision making to support reverse triage.
• This level of care is available from Queenstown and Dunedin.
- Get it moving early.
- Do not separate rescue and medical care.
Noah Sievers, Snow Safety Officer
Porters Alpine Resort
▪ Dave McNulty:
70s – 80s. Initial foundations, assessments, avalanche documentation and data still used today
▪ Academic research: 70s – 2000s. Snowpack phenomena, runout modelling and further terrain documentation
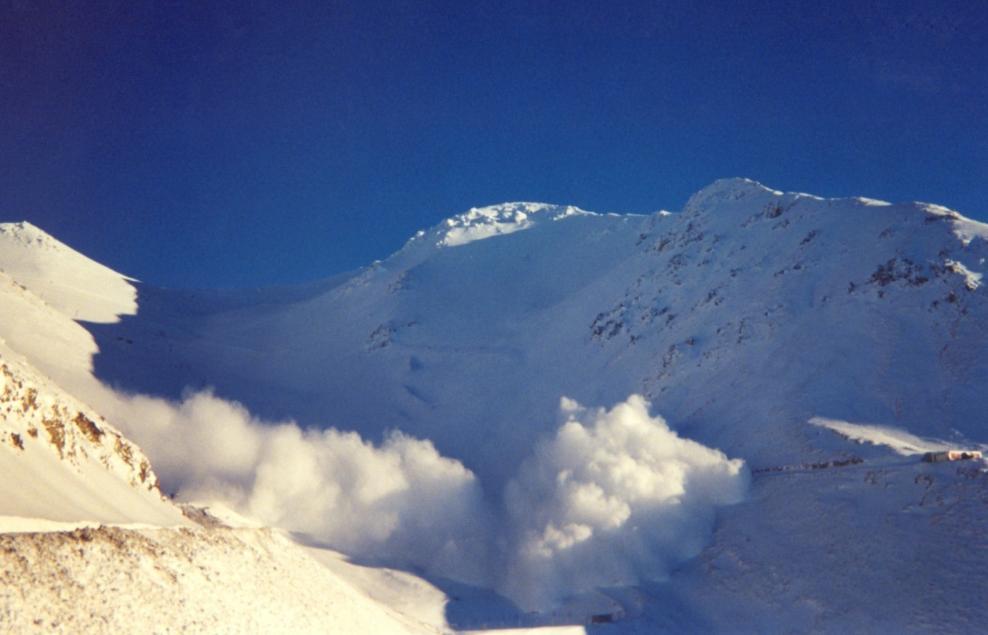
▪ Simon Morris and Brad Carpenter: 1990 – mid-2010s. Research, modernization, mapping, snow safety program expansion
▪ Previous and current patrol: Preservation and advancement of prior work, acknowledgments and gratitude to all
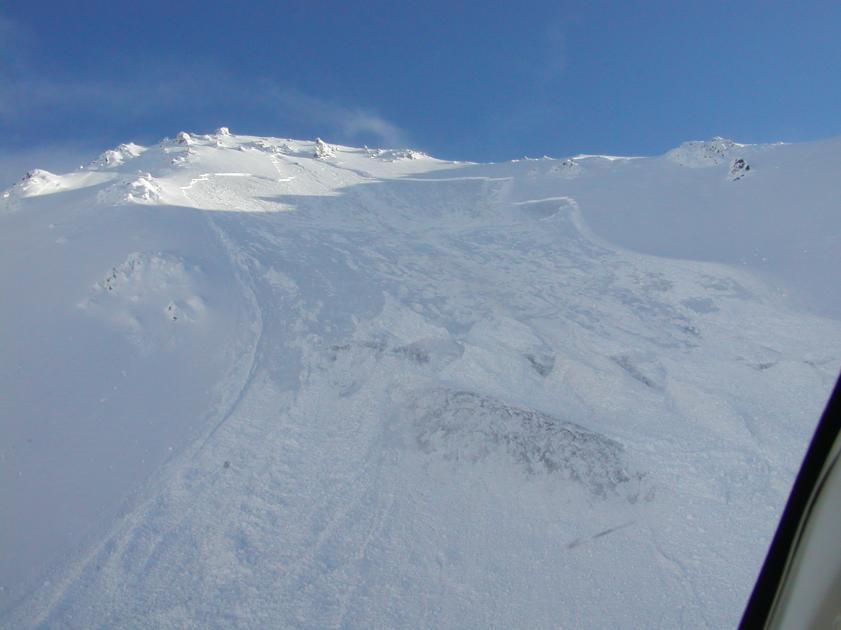
▪ Mapping and data management systems have evolved
▪ Institutional knowledge is static, siloed, at risk of being lost
Objective
▪ Extend institutional knowledge. Make it accessible, interactive and relevant to present and future operations. Pen to pixel.
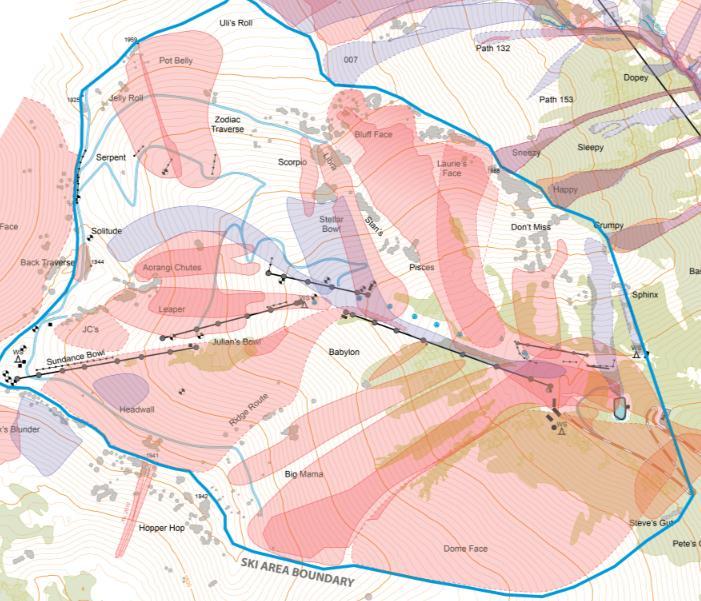
Approach
▪ Unify snow safety resources
▪ Expand data handling methods
▪ Enable team and terrain familiarity
▪ Keep it simple. Secure. One platform.
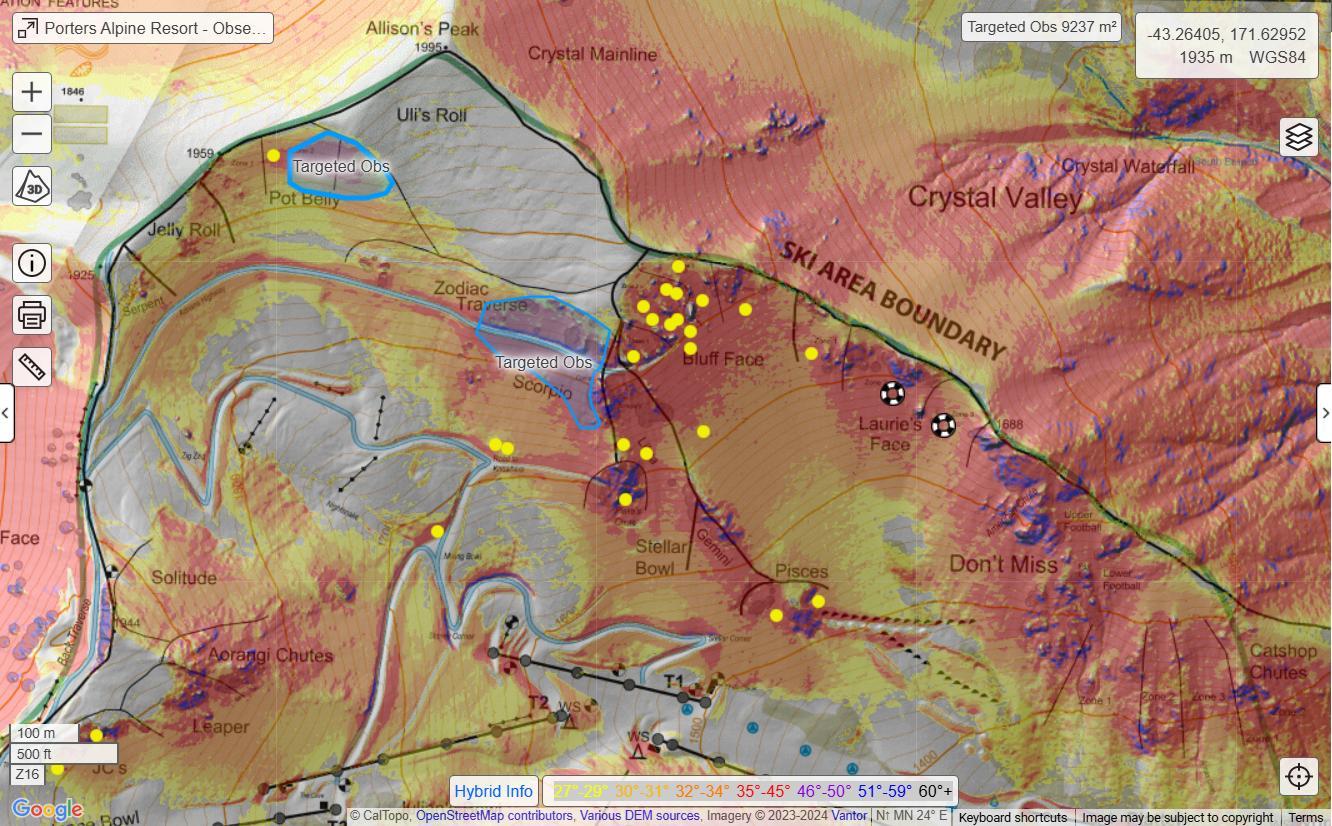
▪ Two operational maps – The Master Map Atlas and
Observations Map
▪ 2nd season of use
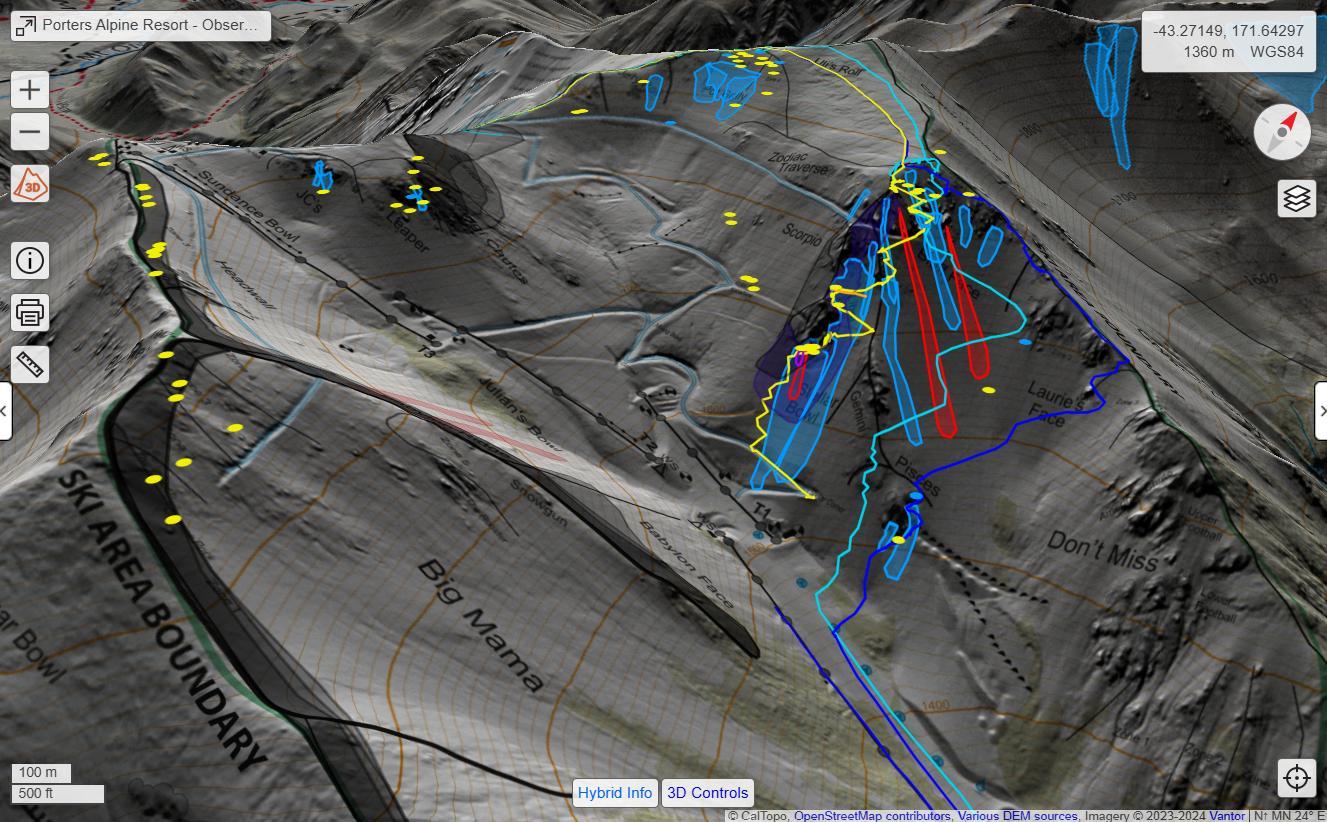
Map Atlas – Foundation and Contents
▪ CalTopo - affordable, accessible, userfriendly, a trusted platform

▪ Atlas map resources compiled, aligned
▪ The one-platform Atlas productunifying Porters Atlas and ARM
Contents include:
Contents also include:
▪ Documents, Methodologies, Links
▪ Porters & backcountry avalanche path data
▪ Historic Heli-bombing Shot Placements
▪ Infrastructure, locations, photos
▪ Mitigation Maps/Photos
▪ Backcountry User Uphill Routes
▪ Mitigation routes, shot placements
▪ Ski and Access Road Boundaries
▪ Wind loading maps
▪ Landing Zones
▪ AutoATES generations - terrain ID
▪ Skier Traffic/Ropeline Placements
▪ Access Points
▪ Forecasting Elevation Bands
▪ Radio Repeater Coverage Map
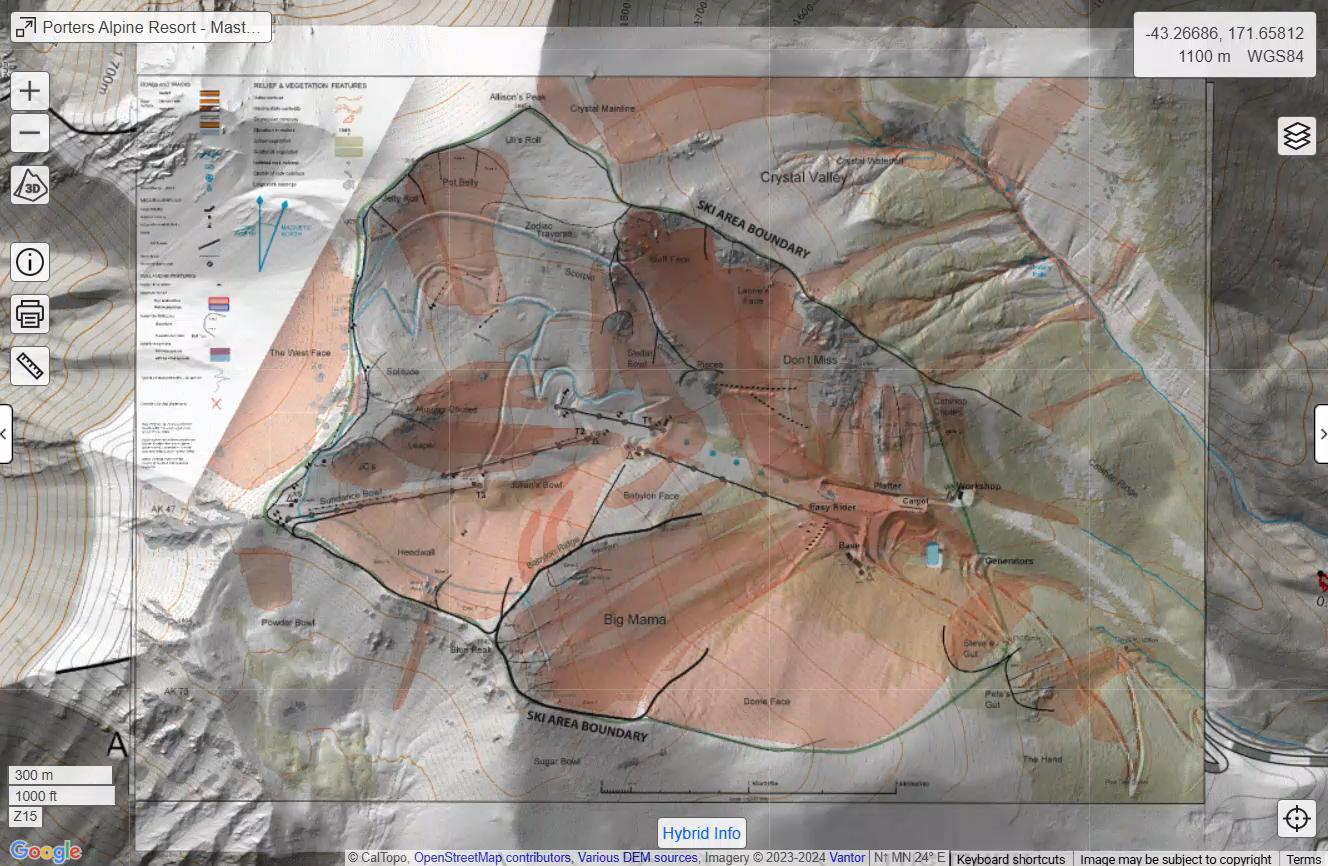
Secret by default, data exportable, cloud syncedoperationally secure and portable
▪ Relevant resources sourced and filtered from the Master Map Atlas
▪ Daily data collection platform –internal
▪ Expanding spatial data recording and review
Observational Data recorded:
▪ Avalanche Activity
▪ Route Movements
▪ Shot Placements
▪ Snowpack Observations
▪ Coverage Photos
▪ Weather Observations
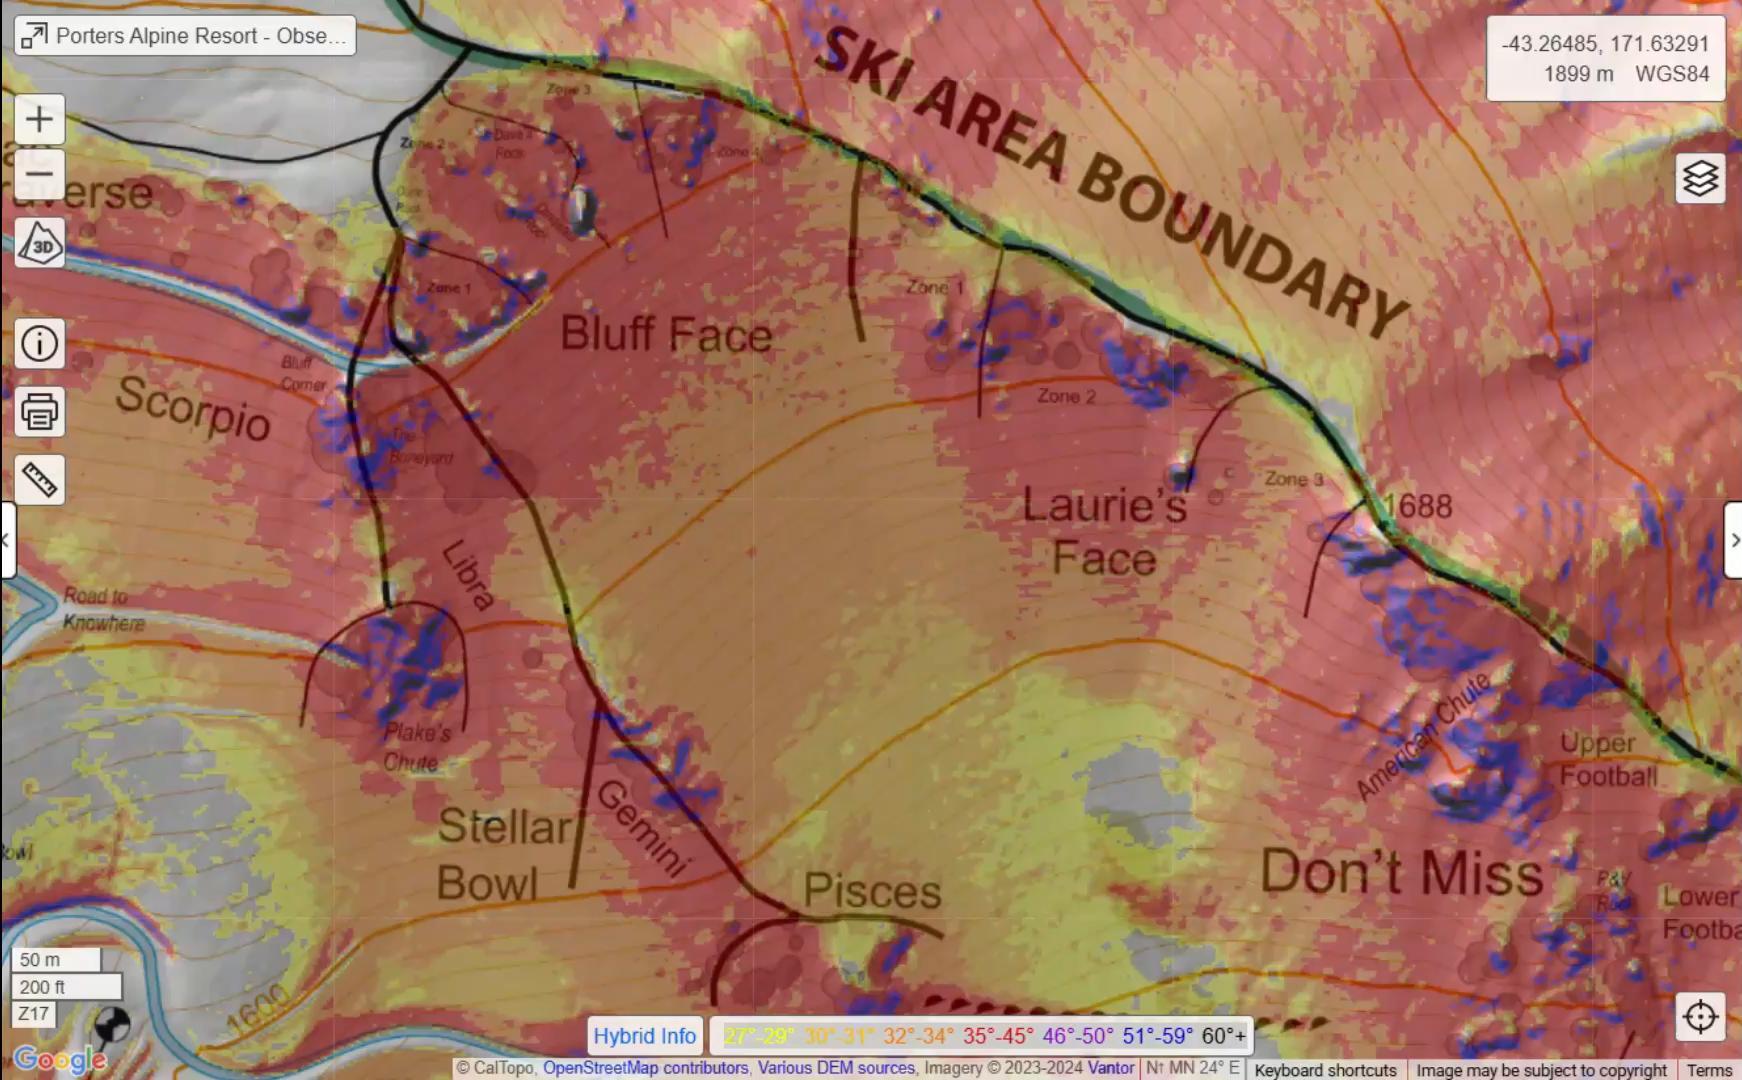
Data organized into folders, filtered by date and type
Master Map Atlas
Observations Map (Daily, Seasonal)
Forecasting & Planning
▪ Observation Analysis – spatial context, patterns
▪ Forecasting – elevation mapping
▪ Planning – ID areas to mitigate, plot routes and shots
▪ Emergency Response –mobile use, spatial awareness
▪ Seamless internal SSO information handovers
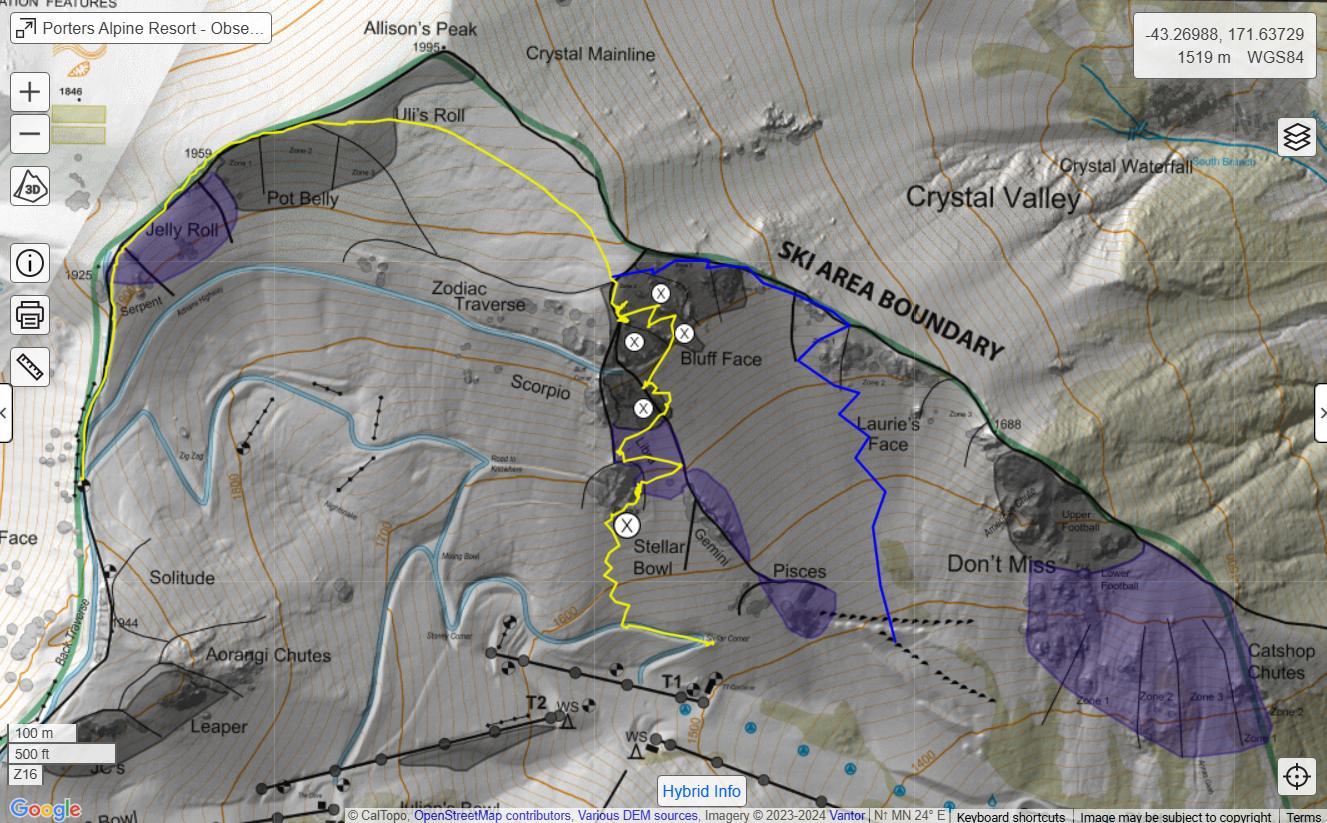
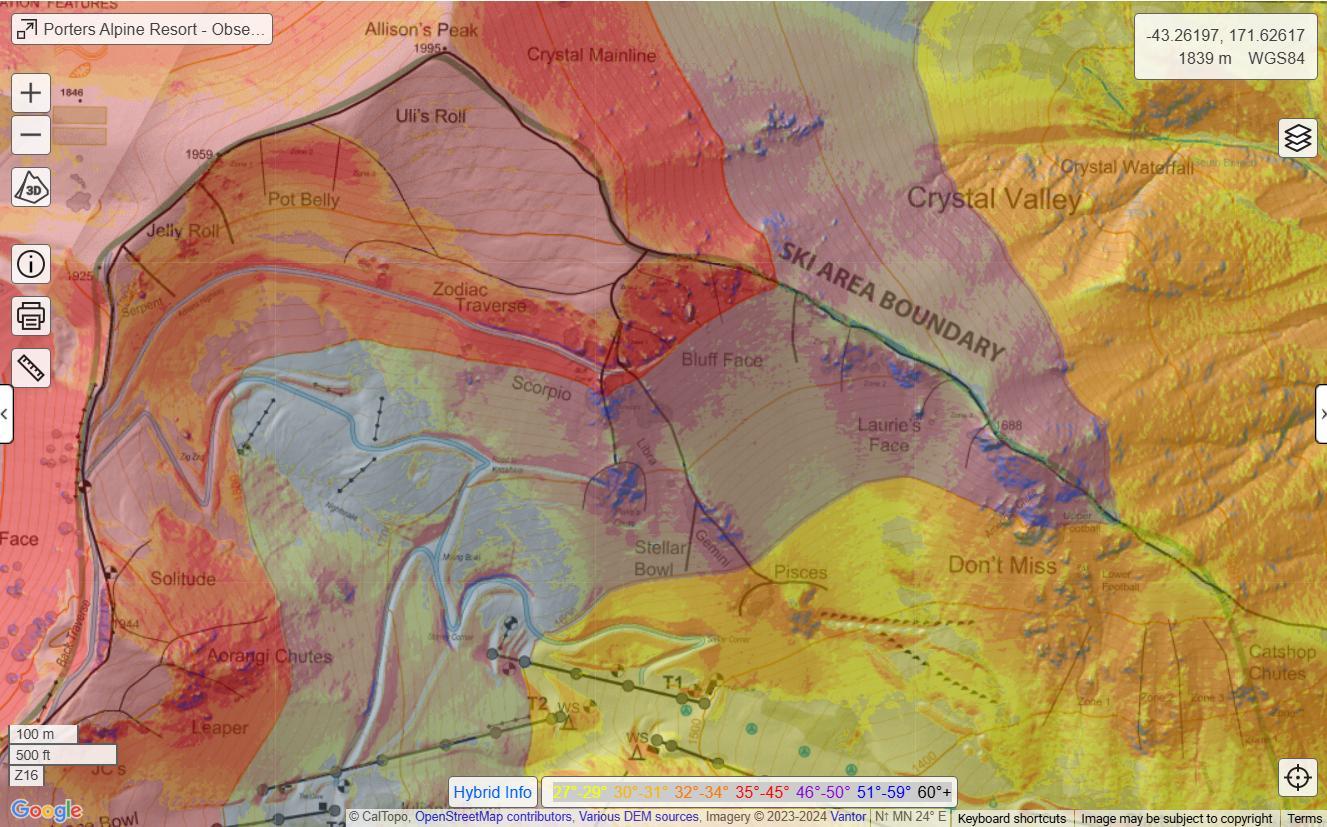
Plan, observe, reference, verify, repeat
– continue the loop
Data Collection
Avx - Spx - Wx - Mitigation
Hazard Analysis
Porters Observations Map
Spatial context - Fuller picture
Forecasting/Planning
MSC InfoEx
AMHA - Obs - Daily Submissions
Moving Forward
▪ Value and application depends on the operation
▪ Small steps, gain traction within the team, reevaluate efficacy
▪ Advanced features limited, other platforms exist –SmartMountain
▪ Develop code to integrate API key, continue backup
▪ Time consuming to digitize – dependent on user discipline, data available and map oversight
▪ One tool in the toolbox – stay curious
▪ Data redundancy – API integration limited
▪ Early in it’s operational life – relevance still being discovered
▪ Continue the Porters stewardship
Allen, S.K. (2004). Snow avalanche phenomena at Porter Heights Ski Area, New Zealand (Master's thesis). University of Canterbury, Christchurch, New Zealand.
McGregor, G.R. (1984). Snow avalanche phenomena on the eastern side of the Craigieburn Range, New Zealand (Doctoral thesis). University of Canterbury, Christchurch, New Zealand.
McGregor, G.R. (1990). Snowpack studies in the Craigieburn Range, New Zealand. New Zealand Journal of Geology and Geophysics, 33, 405–416.
McNulty, D., & Fitzharris, B.B. (1980). A large avalanche event at Porter Heights Skifield, New Zealand, 1977. New Zealand Journal of Geology and Geophysics, 23(1).
Carpenter, B. (2012). Crown profiles: Australian winter 2012 — New Zealand's South Island. The Avalanche Review, 31(2), 21–31.
Morris, S. (2012). Avalanche management programme developed at Porters Ski Area and Crystal Valley, South Island, New Zealand. The Avalanche Review, 31(2), 21–31.
Barnes, T. (2021). Porters Alpine Resort interactive avalanche atlas map. Unpublished internal document, Porters Alpine Resort, Canterbury, New Zealand.
Morris, S. (2022). Porters Alpine Resort avalanche atlas. Unpublished internal document, Porters Alpine Resort, Canterbury, New Zealand.
Sievers, N. (2026). Porters Alpine Resort avalanche risk management plan. Unpublished internal document, Porters Alpine Resort, Canterbury, New Zealand.
Sievers, N. (2026). AutoATES v2.0 generations, Porters Alpine Resort terrain. Unpublished internal document, Porters Alpine Resort, Canterbury, New Zealand.
Canadian Avalanche Association (CAA). (2016). Technical Aspects of Snow Avalanche Risk Management (TASARM). Canadian Avalanche Association, Revelstoke, BC, Canada.
Statham, G., & Campbell, C. (2025). The Avalanche Terrain Exposure Scale (ATES) v.2. Natural Hazards and Earth System Sciences, 25, 1113–1137.
Toft, H.B., Sykes, J., Schauer, A., Hendrikx, J., & Hetland, A. (2024). AutoATES v2.0: Automated Avalanche Terrain Exposure Scale mapping. Natural Hazards and Earth System Sciences, 24, 1779–1793.
Toft, H., Sykes, J., & Schauer, A. (2024). AutoATES v2.0 [Software]. Zenodo.
Neuhauser, M., D'Amboise, C., Teich, M., Kofler, A., Huber, A., Fromm, R., & Fischer, J.T. (2021). Flow-Py: routing and stopping of gravitational mass flows (Version 1.0). Zenodo.
Land Information New Zealand (LINZ). (2026). New Zealand LiDAR 1m DEM. LINZ Data Service, Layer 121859.
Morris, S. (2026, May). Personal communication [Microsoft Teams]. Milford Road Senior Avalanche Forecaster, New Zealand.
Young, R. (2026, January 21). Personal communication [Google Meet]. Wasatch Peaks Ranch Snow Safety, Utah, USA.
Penny Goddard
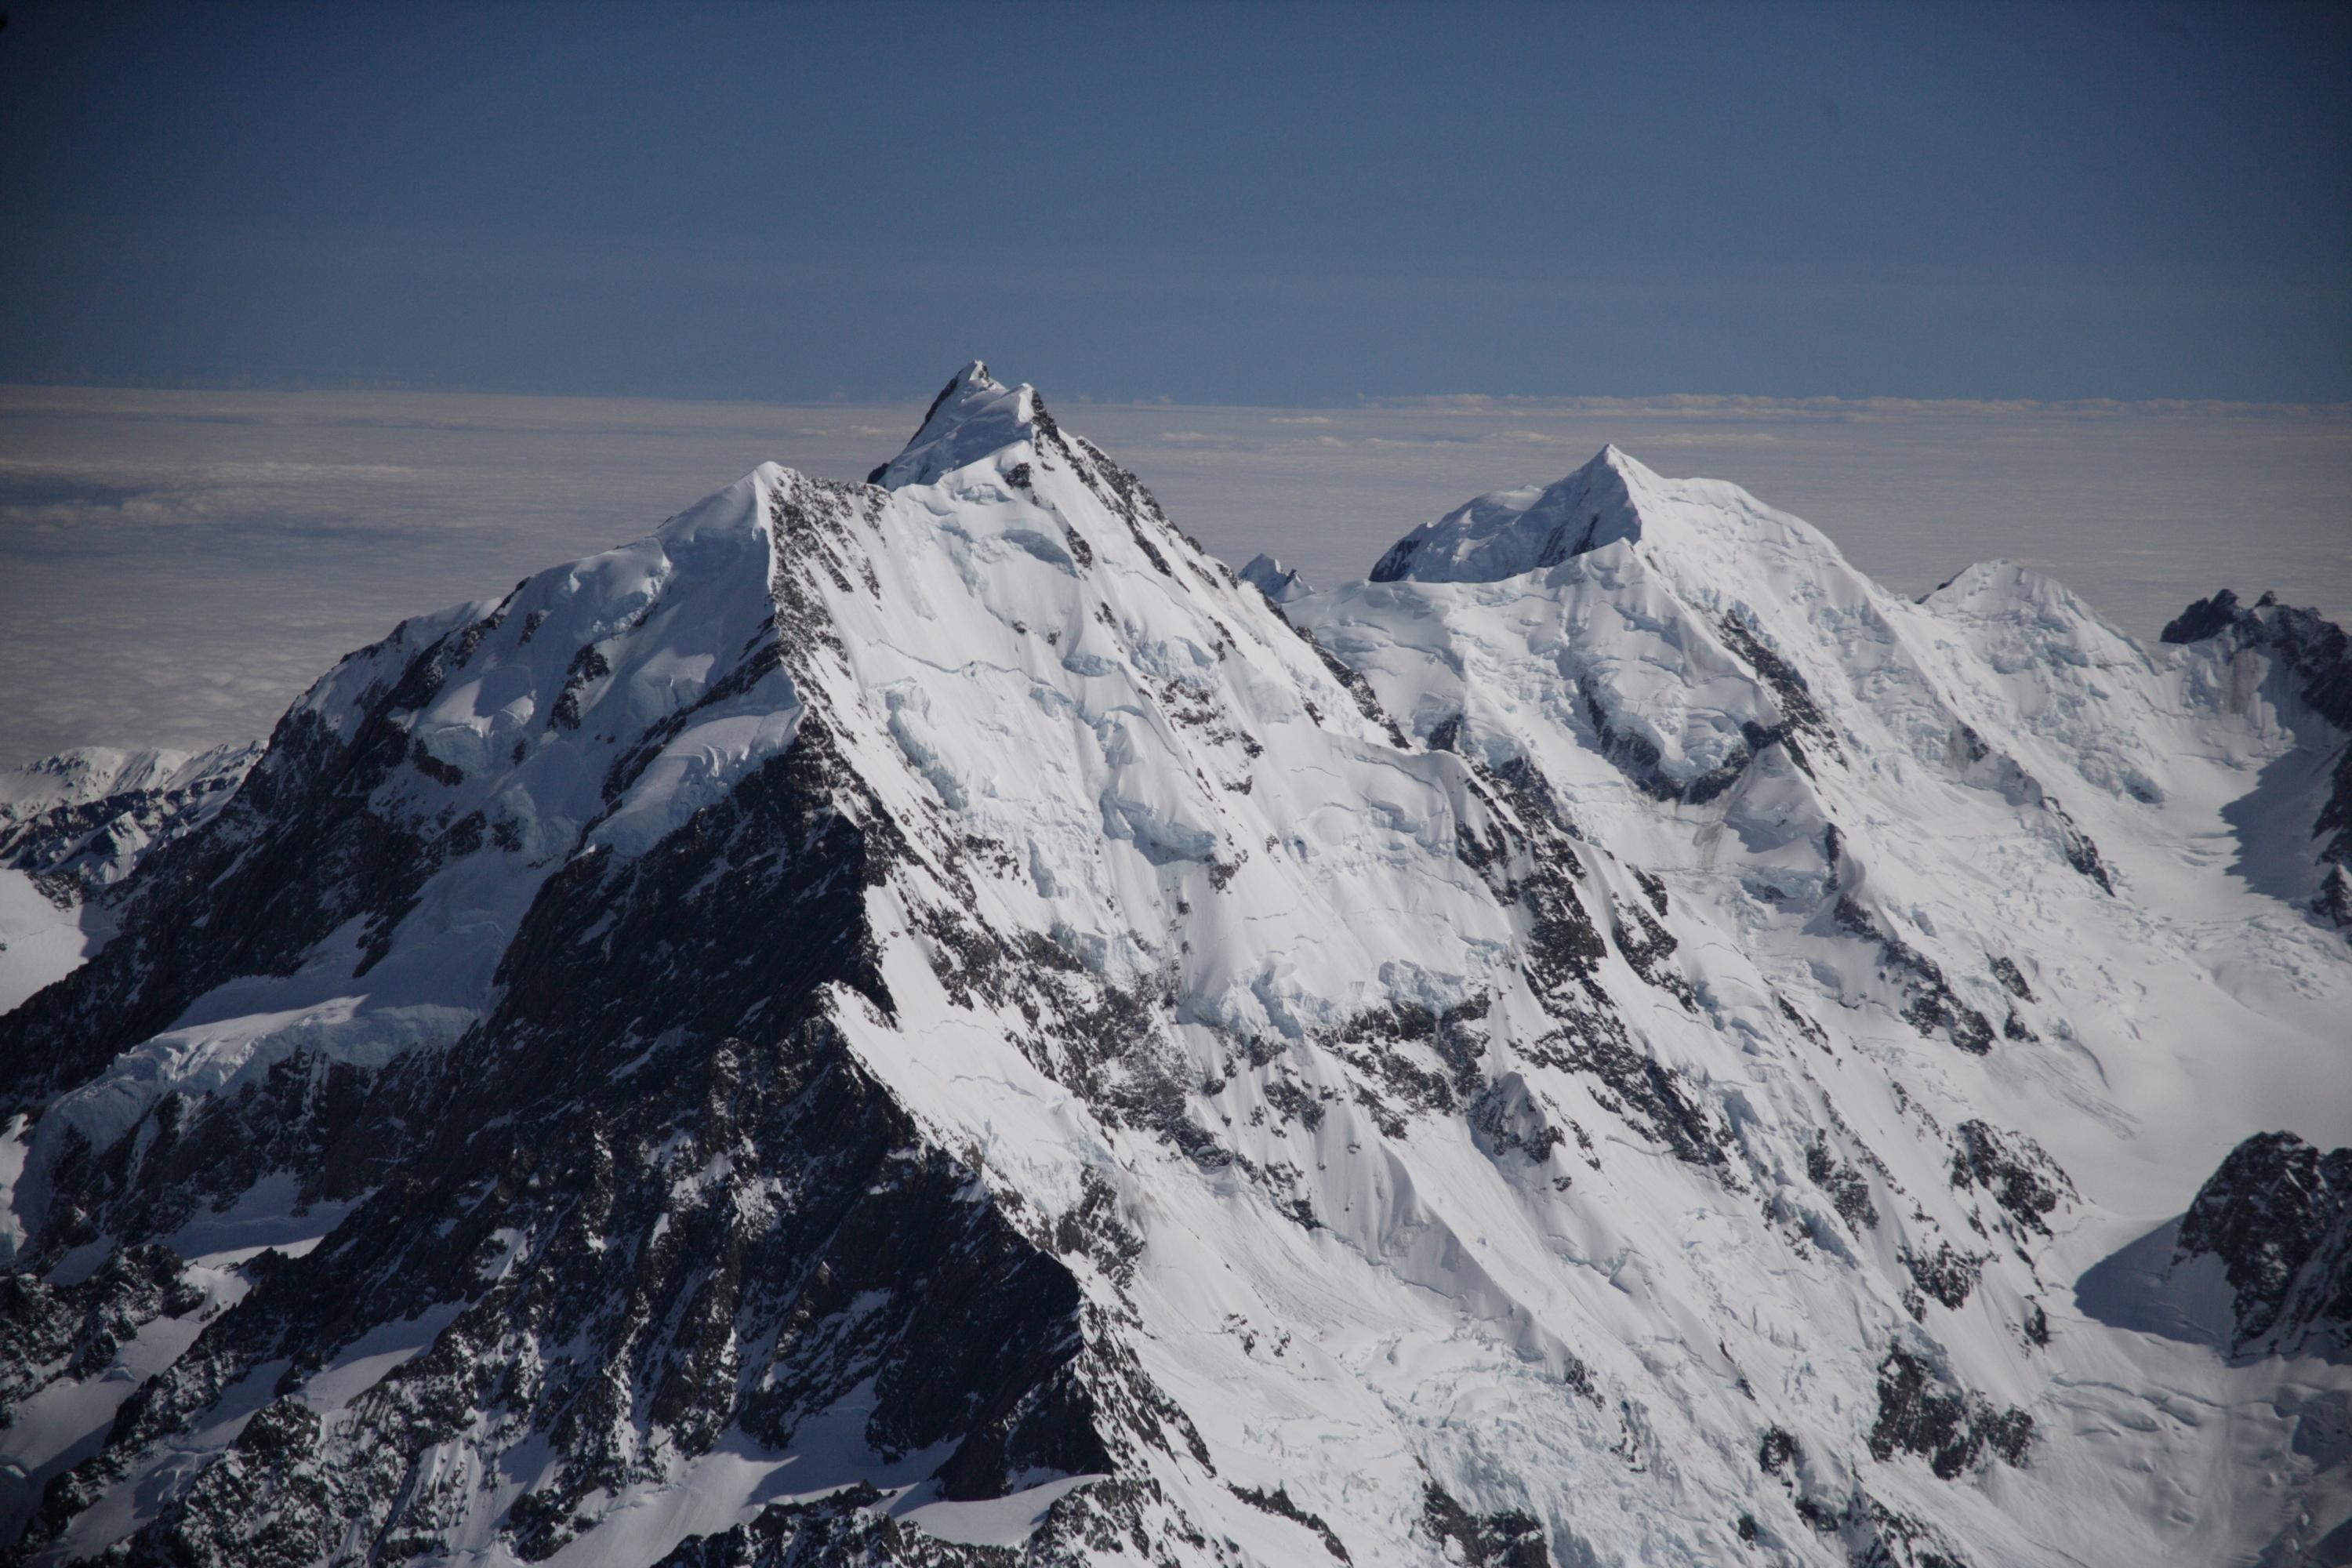
• 73 % of avalanche fatalities have involved mountaineers (1999-2025)
• Most of these were in spring and summer


New Zealanders have been adapting for years.
Interviews with representatives from:
• Alpine guiding companies
• NZ Mountain Safety Council (MSC)
• NZ Mountain Guides Association (NZMGA)
• NZ Outdoor Instructors Association (NZOIA)
• NZ Alpine Club (NZAC)
• Outdoor Education NZ (OENZ)
• Canterbury Mountaineering Club (CMC)
• Department of Conservation (DOC)
Theme #1: Timing is everything
• Spring = narrow high alpine season
• Cross-over of activities: ski mountaineering/ climbing
• Post storm window
• Time of day
• Exposure time
• Big squeeze!
Theme #2: Avoidance is the primary strategy
• Binary go or no-go decision-making
• Conservative mindset
Theme #3: It’s different to skiing
• Most training resources cater to skiers
• Small avalanches, huge consequences
• Can’t avoid avalanches or move quickly
• Use of rope complicates things
• More time in low elevation bands
• Climbing up into problem terrain
• Trampers/ trekkers seem to have limited awareness of avalanche hazards
• Use of avalanche rescue equipment not always a cultural norm for climbers
Theme #4: Practices are not universal
• High-level operational structure
• Often the “how-to” is not explained
• Actual content/approach often varies guide to guide/instructor
Theme #5: Avalanche education is challenging for non-skiers
• Appetite for more on-foot avalanche education
• Professional level (esp. ARM6) especially challenging for non-skiers
• Lack of mentorship
Theme #6: Other hazards also increasingly pronounced
• More slips and rockfall
• Ice cliff activity
• Sliding hazard on icy snow surfaces
• More intense storm systems
• Rivers widening
• More wet slabs and glide slabs
What are the initiatives?
Guiding companies, NZOIA, NZMGA, Clubs:
• Avalanche training pre-requisites for alpine instructors and guides
• Pre-trip avalanche hazard assessment year-round
• Include avalanche training in all instruction courses, year-round
• Conservative terrain use
• Client education
NZOIA:
• New scope and syllabus with strong focus on avalanches
• Alpine 2 includes ARM5 and specific 2-day avalanche assessment
OENZ:
• NZOIA Alpine instructor mentoring programme
NZAC:
• “Mountaineering pathway” for club members which includes avalanche training
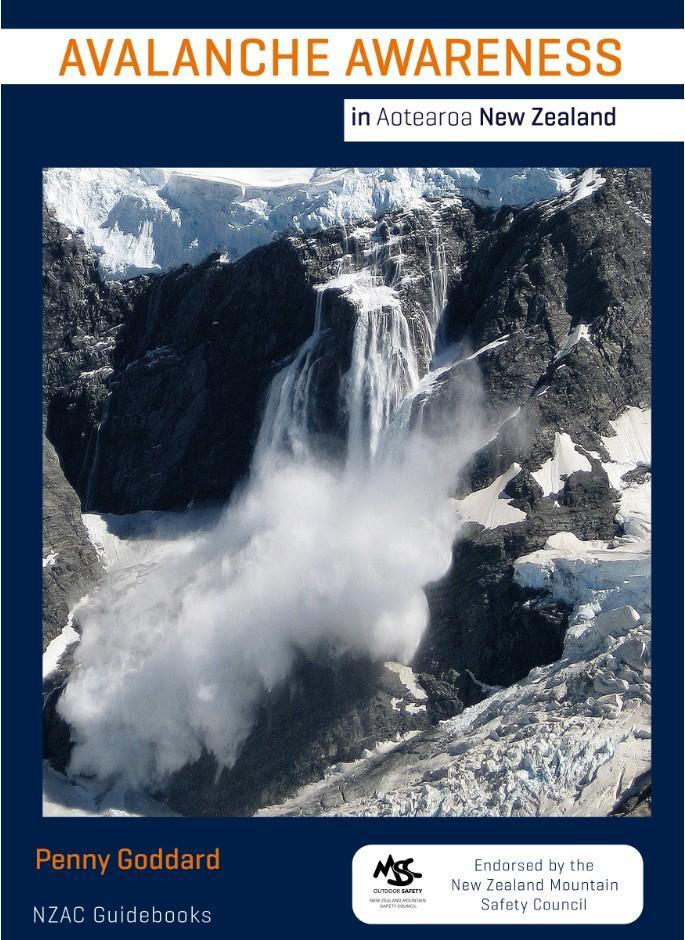
• New mountaineering guidebook with avalanche content and call out for avalanche incident reporting
NZMGA:
• Avalanche content in climbing guide training and exams
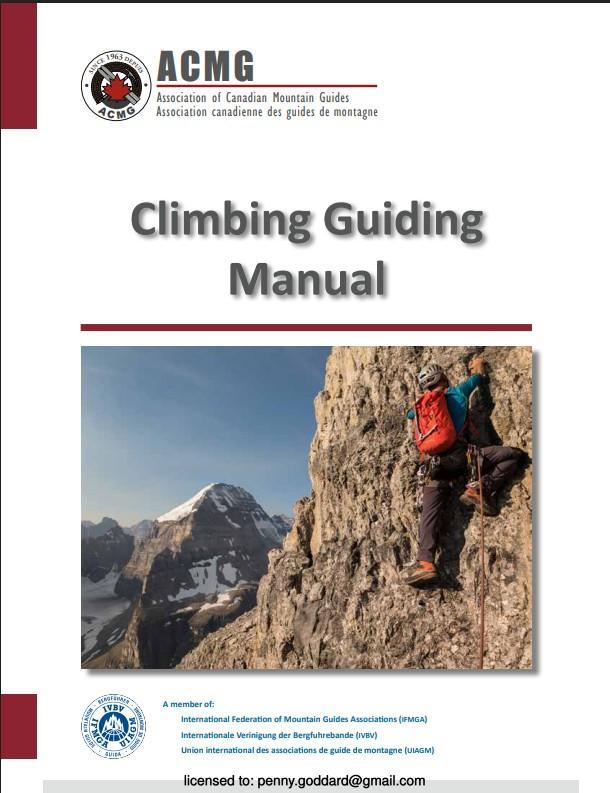
• Chapter in NZ Mountain Guide Manual
Mountain Safety Council:
• Extended advisory season
• Change in language and addition of ‘sliding danger’
• Extra research
• Development of mountaineering-specific resources and content
• Messaging into mountaineering channels
• Promoting public obs from mountaineering community
• NZ’s alpine environment and climate create distinct pressures
• Lots of initiatives already actively managing climber safety
• Room to grow in operational ‘how-to’, mentorship and education catering to those on foot
• New Zealand is at the forefront of managing this problem
• There’s lots of work to be proud of and that’s why I want to present this internationally
Thanks to everyone who contributed: Gregg Beisly Jamie Macalister
Sarah English Axel Reiser
Brenda George Jamie Robertson
Penny Holland Tim Steward
Anna Keeling Cam Walker



Mike Lundin & Luke Crow
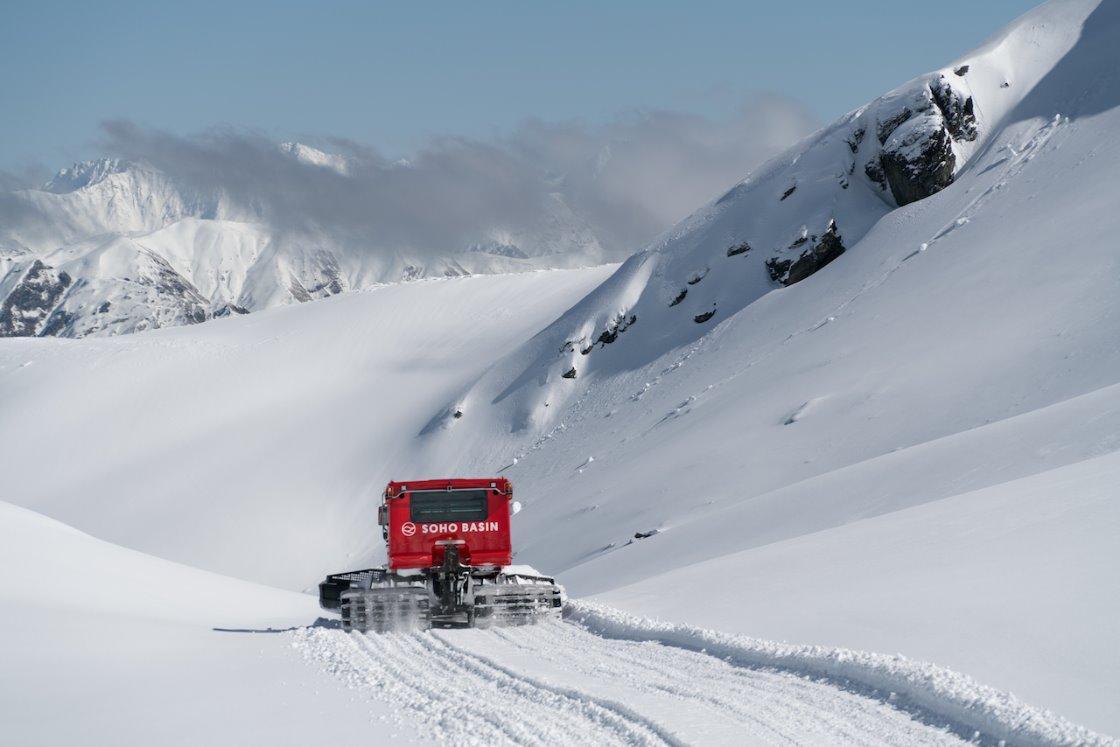
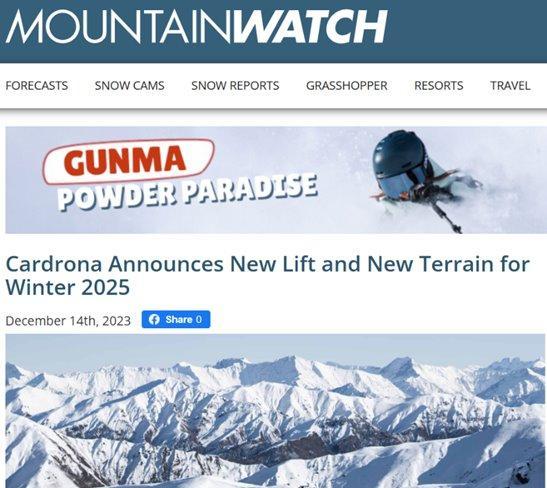
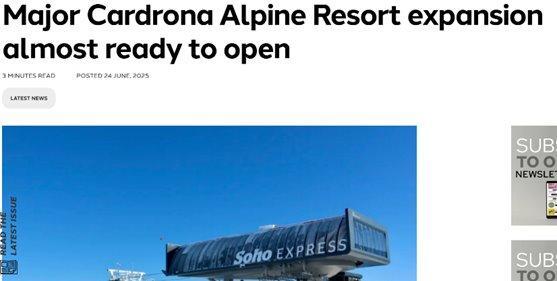
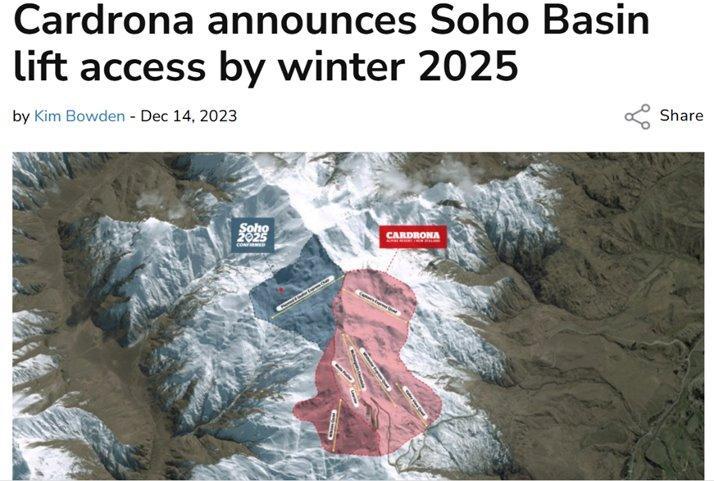
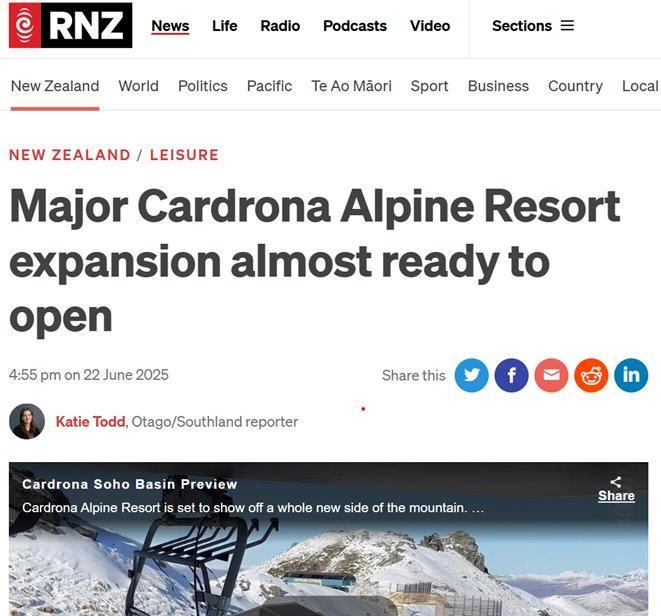
•Cardrona Cat skiing
•Soho Cat skiing
•Cardrona Ski touring packages
•Ski Touring access for all

What information did we have to work with?
•One season of information gathering
•Limited access to the terrain whilst Soho cat skiing were in there and not dry runs of control days.
•Access to the soho cat skiing atlas but format wasn't consistent with our current documentation
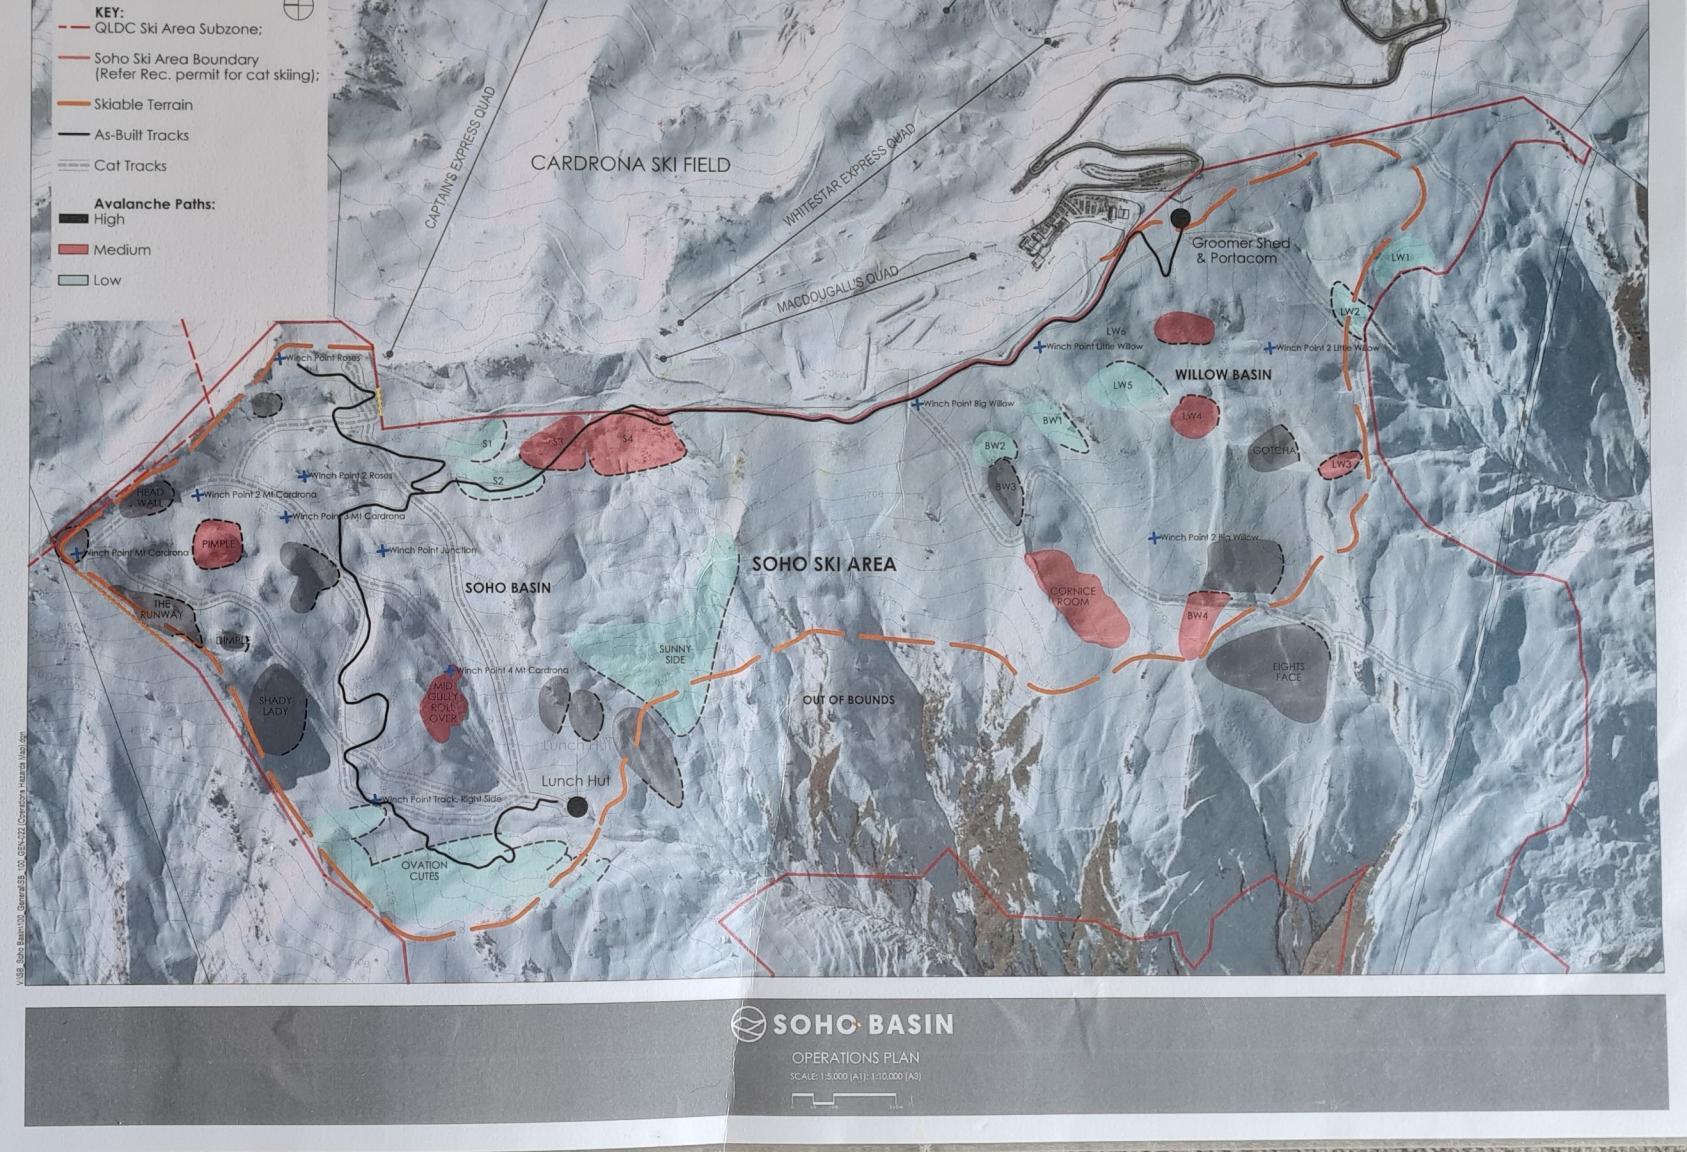
•Everything is now skiable.
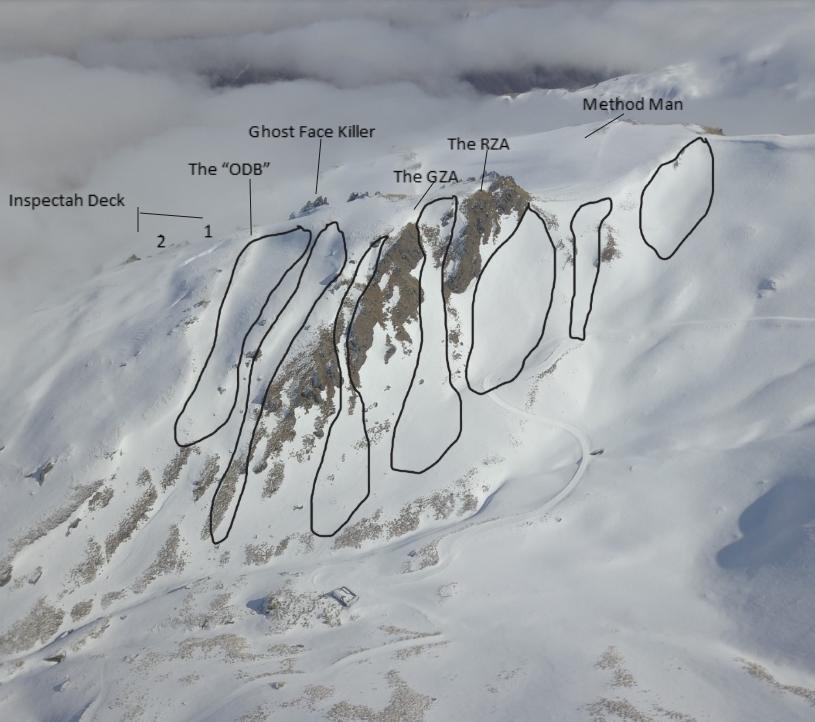
•Areas of concern fleshed out into individual paths
•Changes the snowpack structure.
•Terrain modification for this year.
•Summer observations.
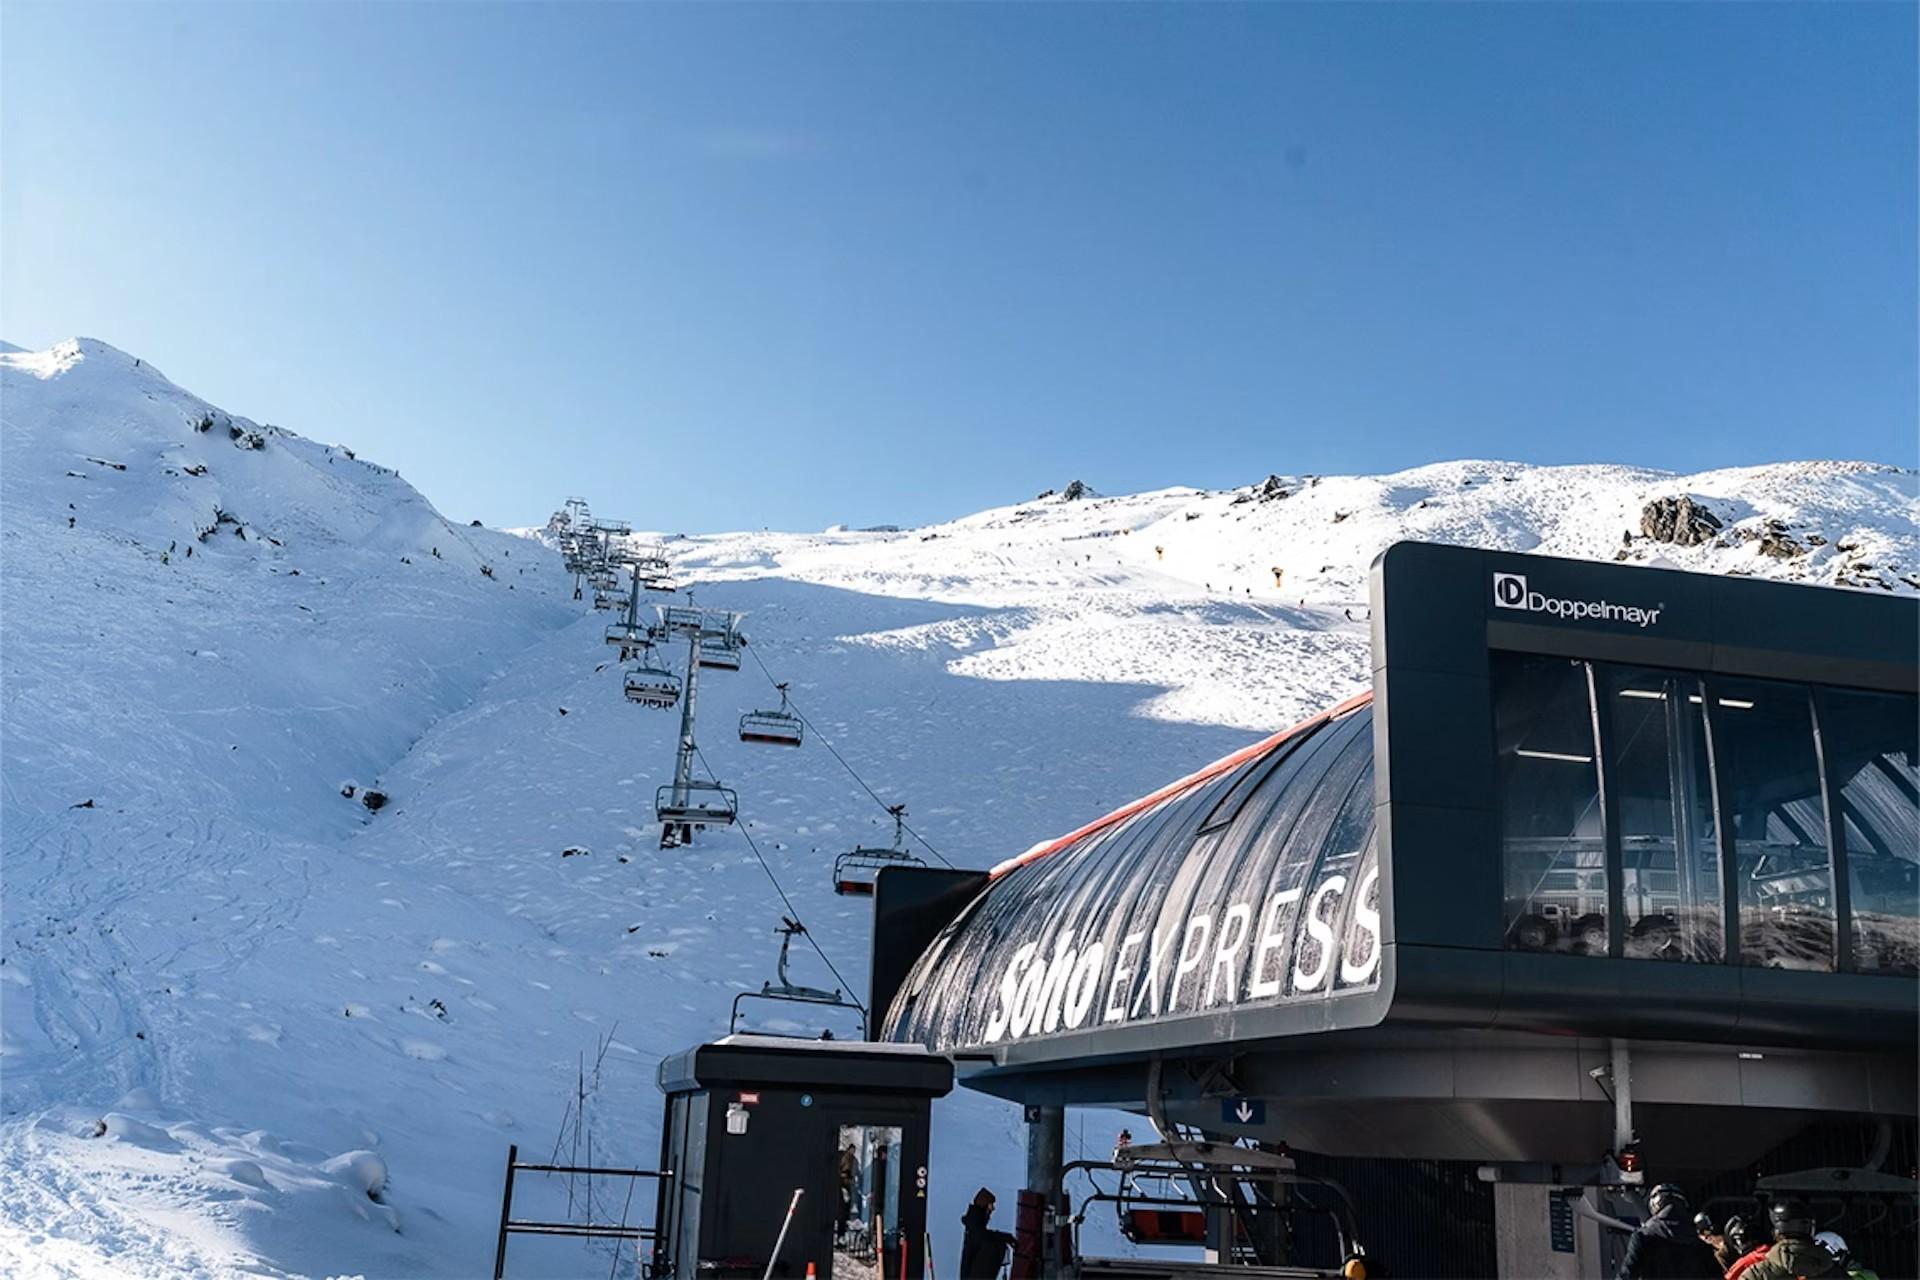
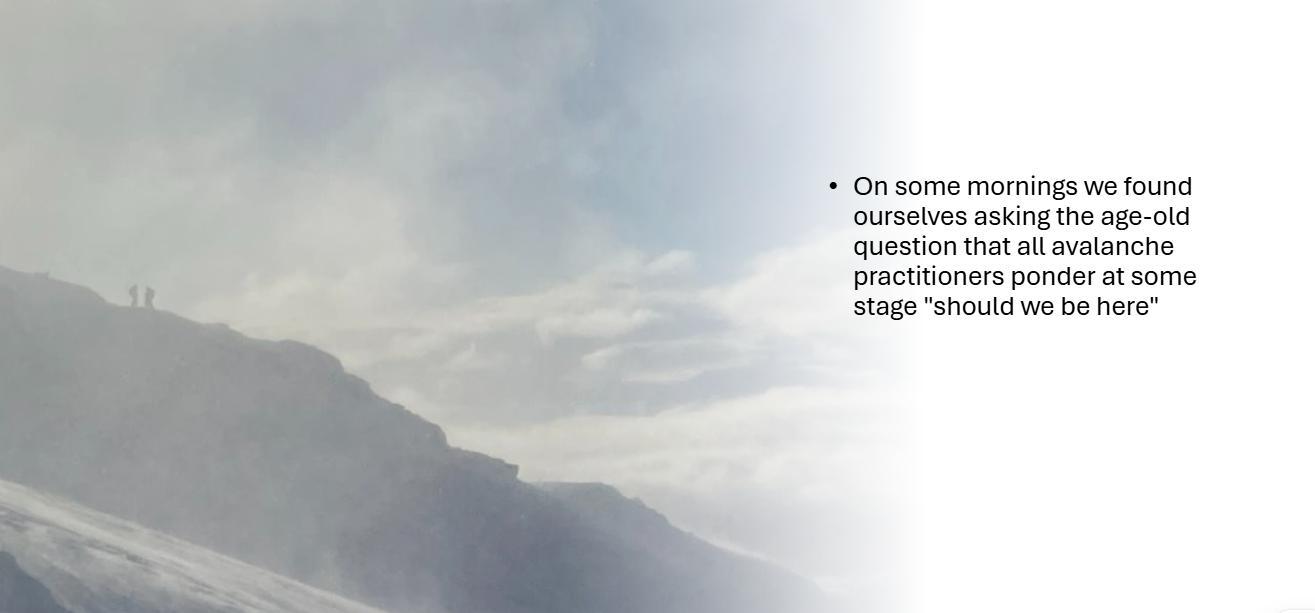
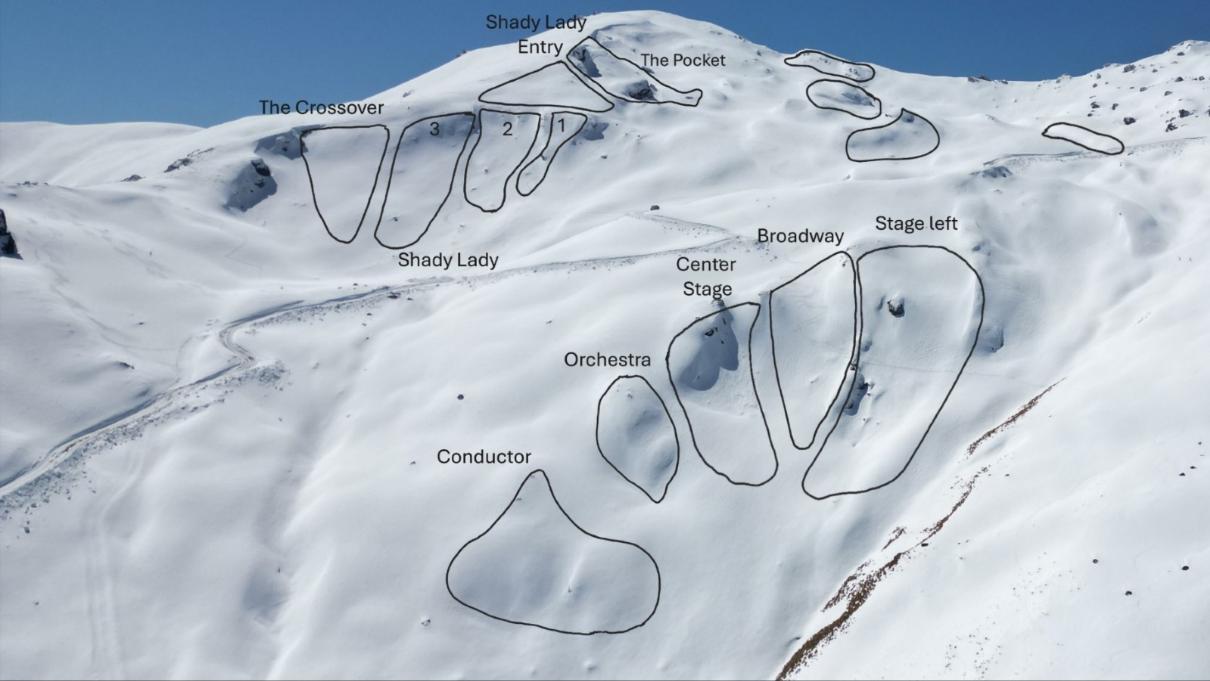
More infrastructure and People in the basin outside of “operational “ time
Language that we all understand
Re-building the team
A brand-new lift is only as good as the people that run it, open the terrain, and build the trails.
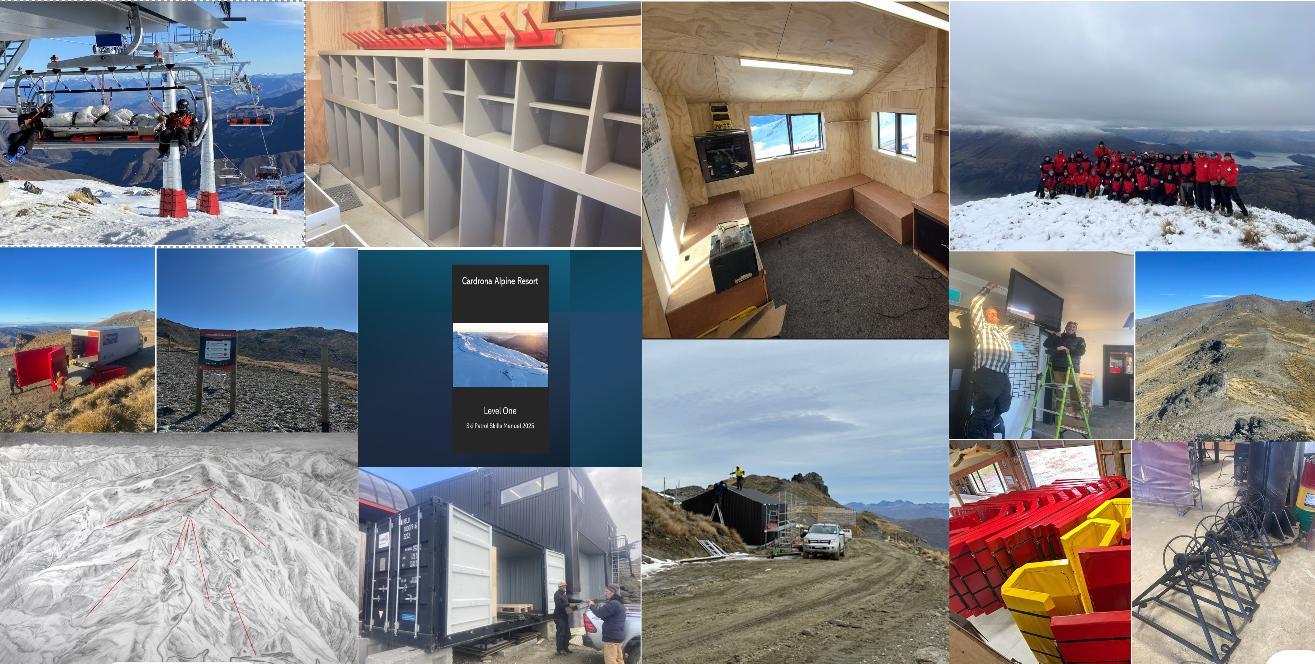
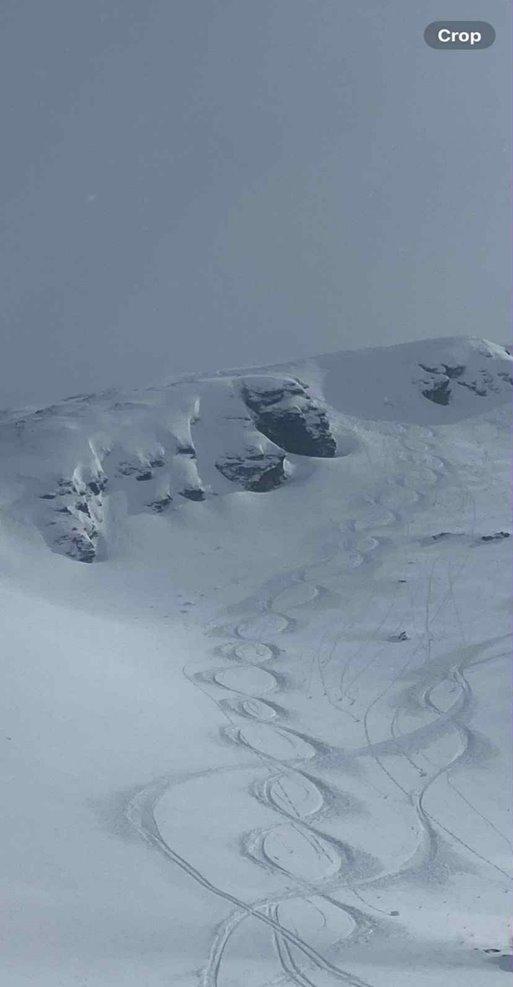
Despite the low tide nature of the winter some good turns were to be found along the way.

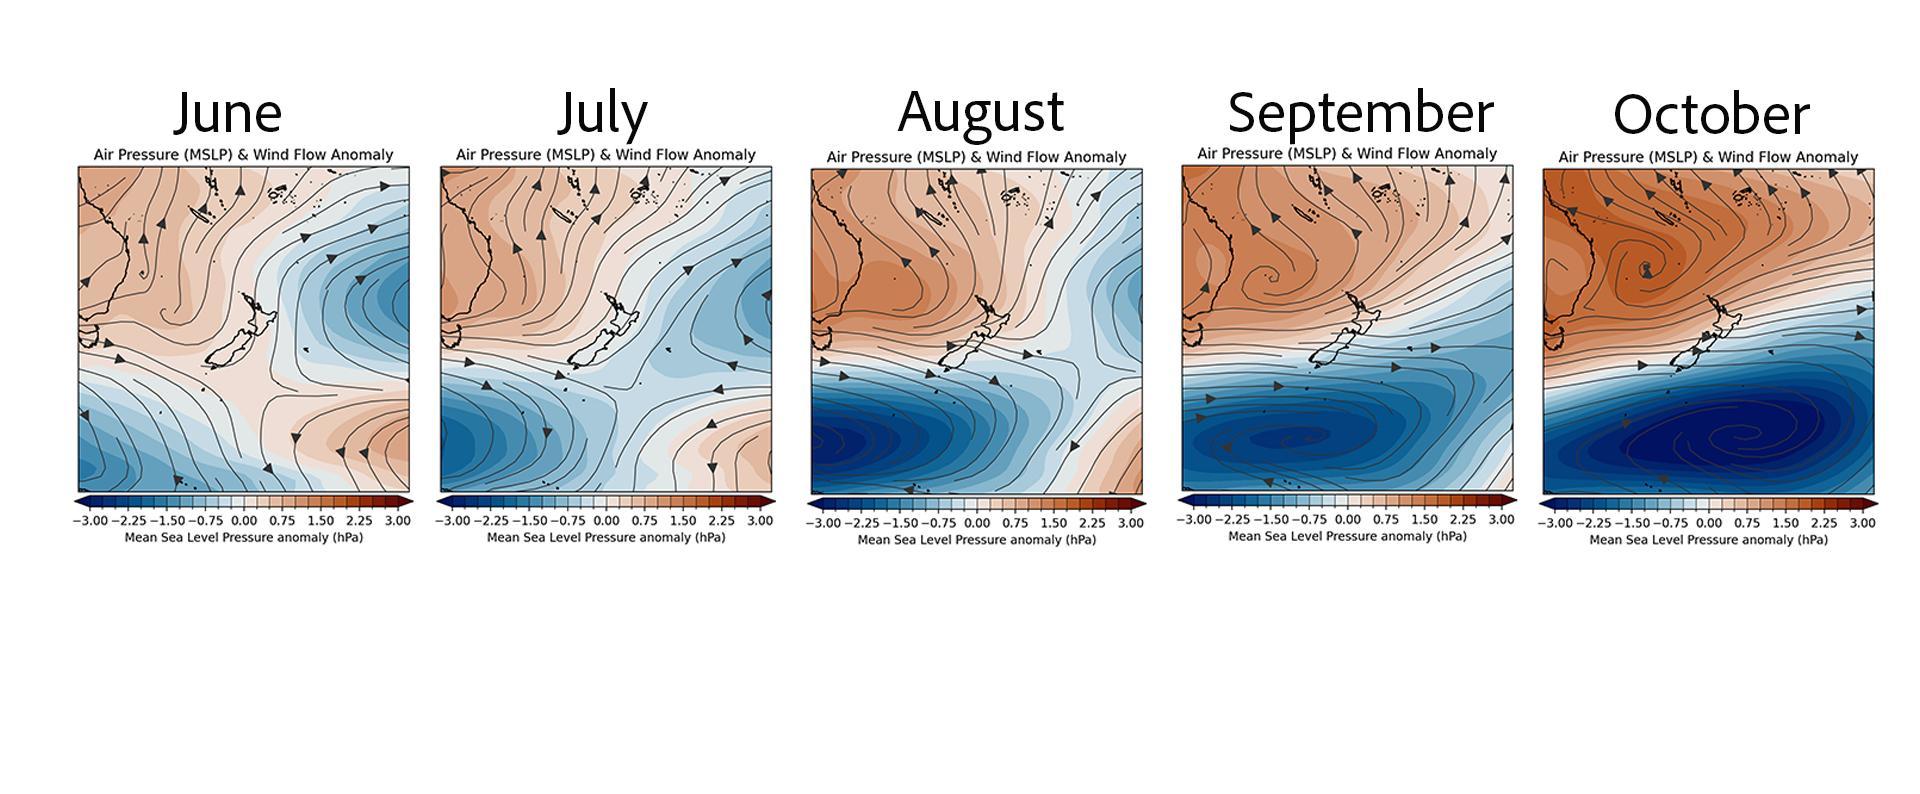
What can the Pacific tell us about our winter?
Using weeks-to-months outlooks in alpine decision making












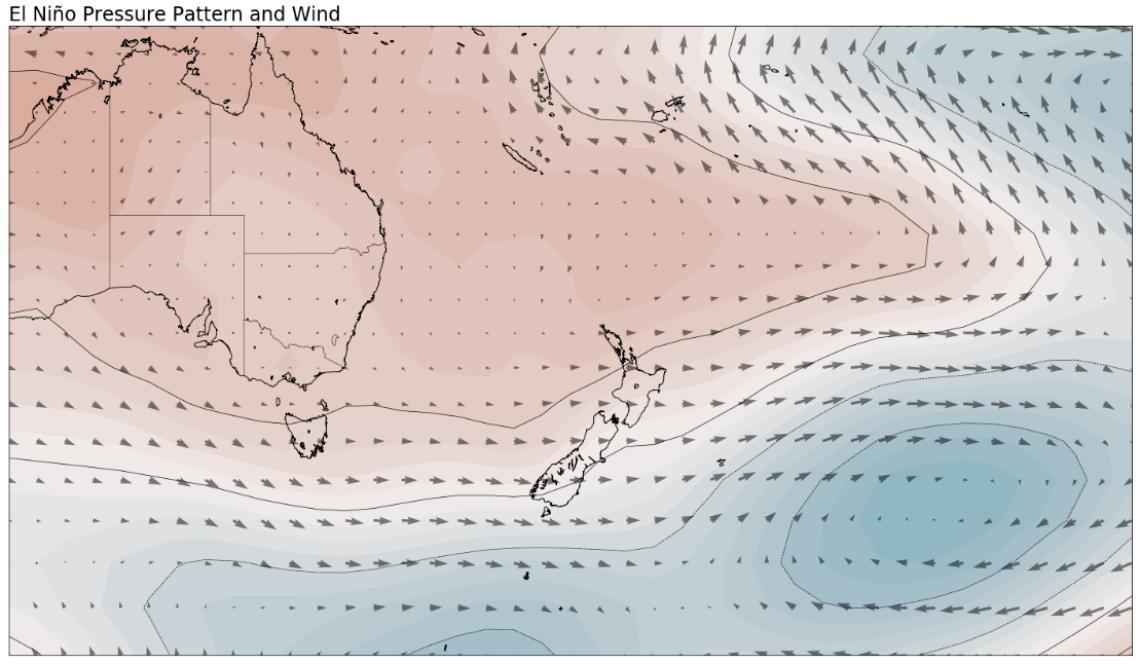
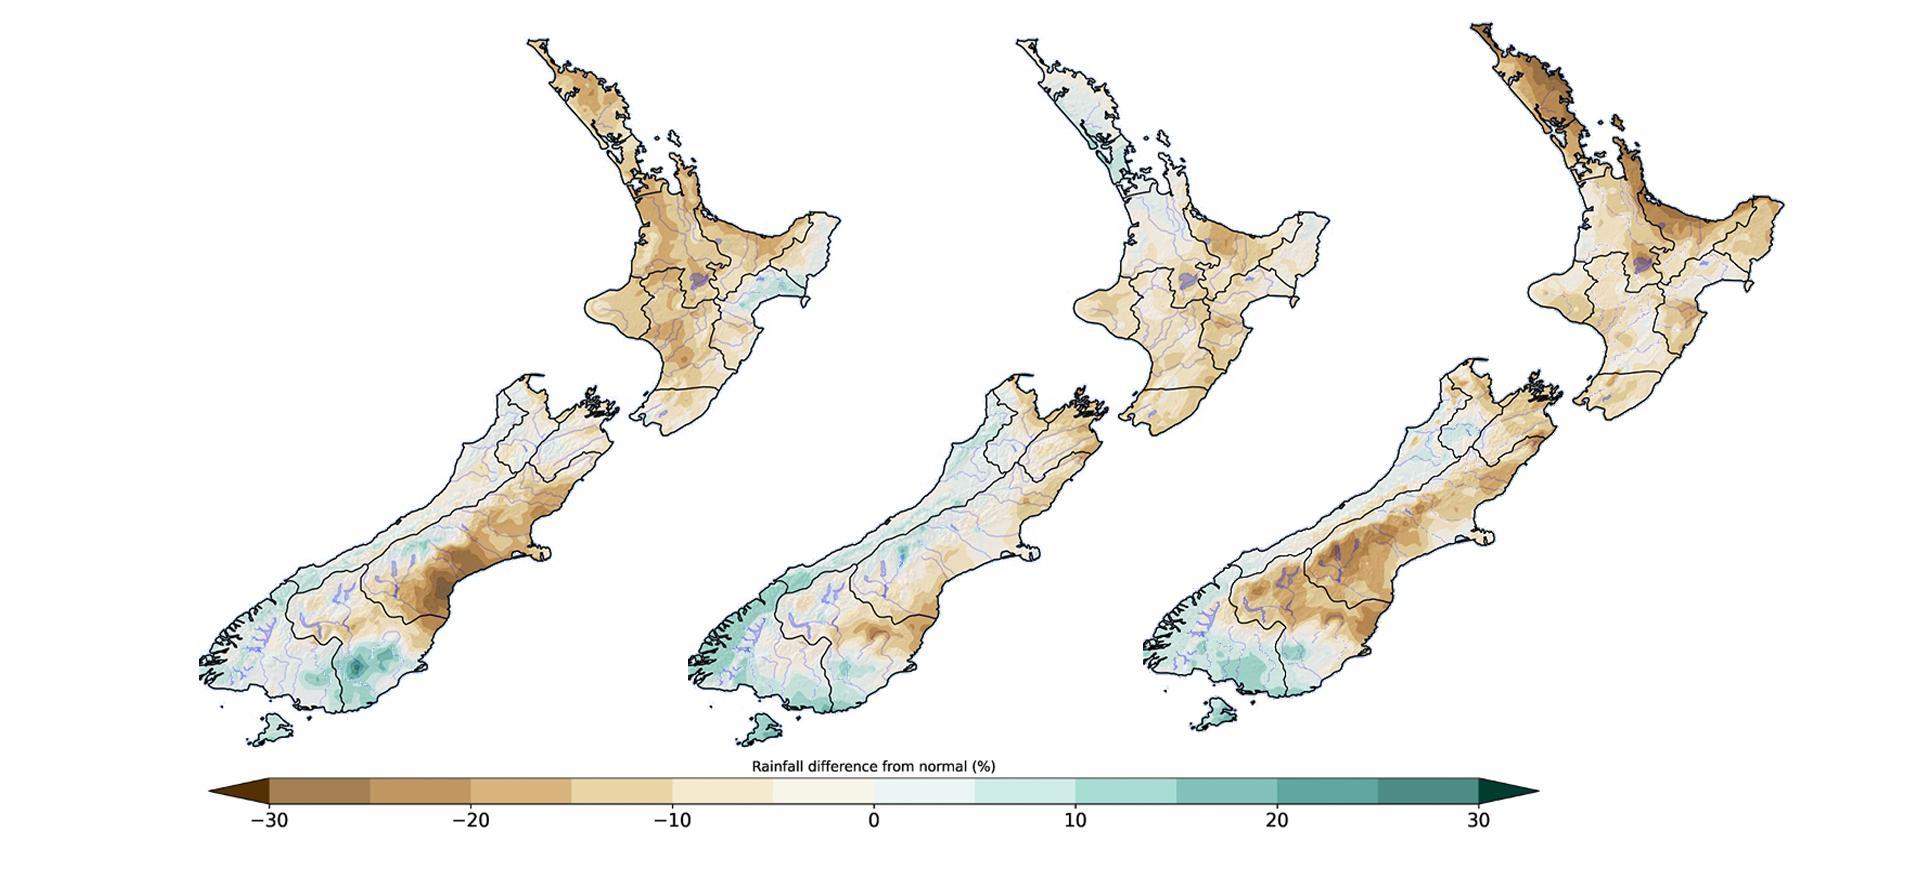
• Not just a media headline!
• Happens approximately every 10 to 15 years
• Recent events: 2015-16, 1997-98 and 1982-83
• Can make climate impacts more likely, sometimes more intense and persistent
• Shifts risks for droughts, floods, heat and humidity
• But no two El Niño events exactly alike
based on traditional El Niño index…
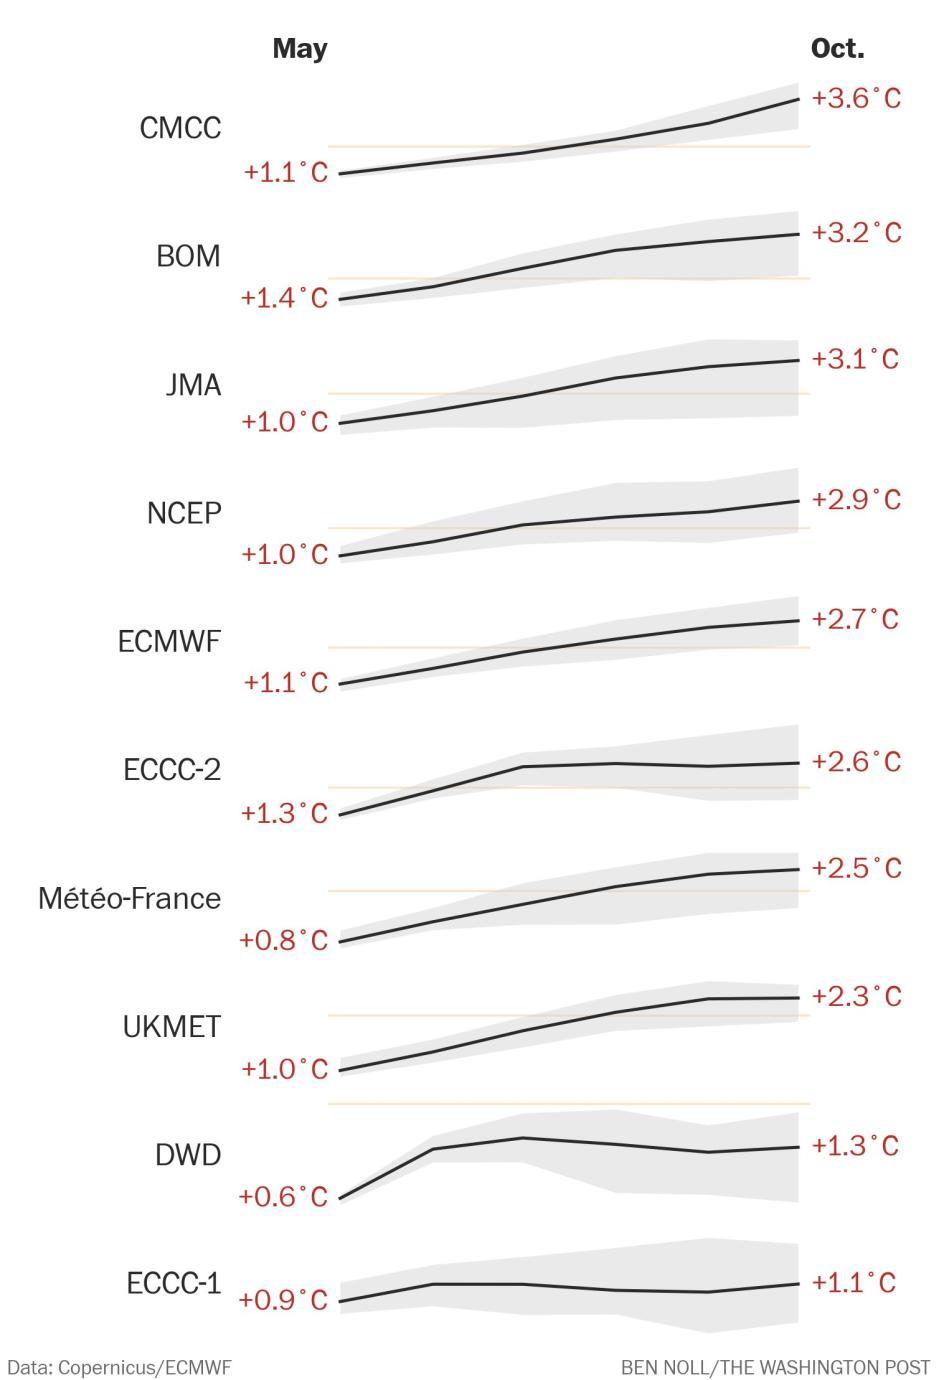
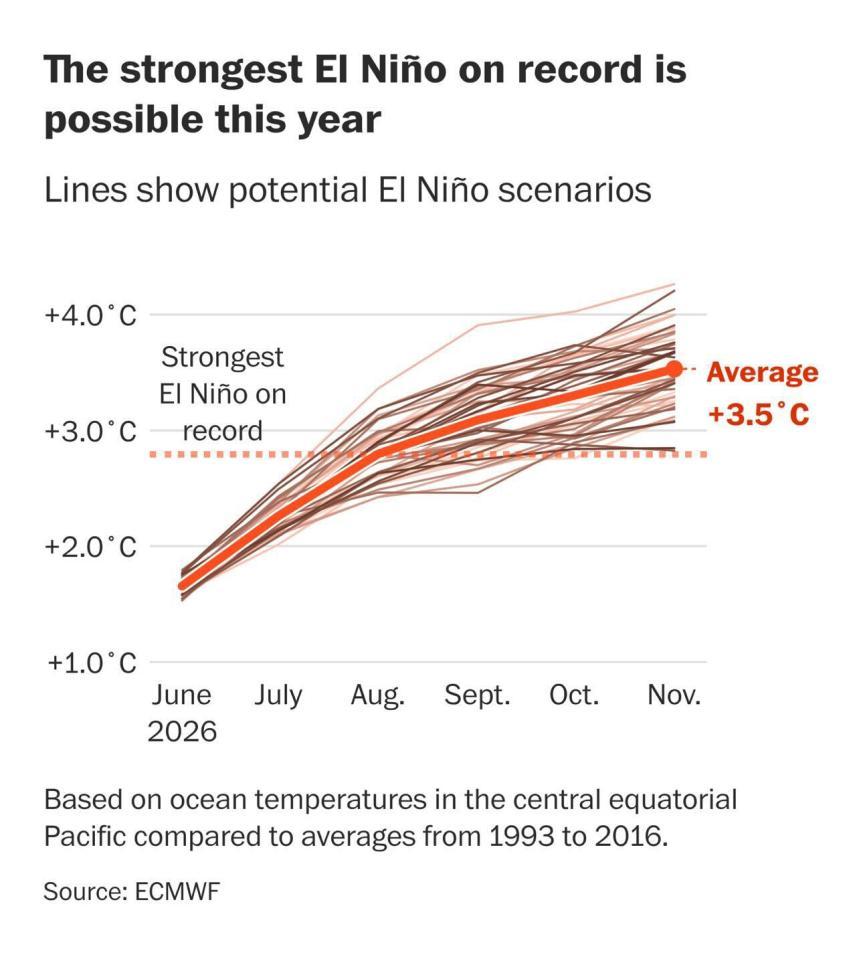
Impacts from a super El Niño in 2026 won’t be the same as 1982, 1997 or 2015. It’s warmer now.
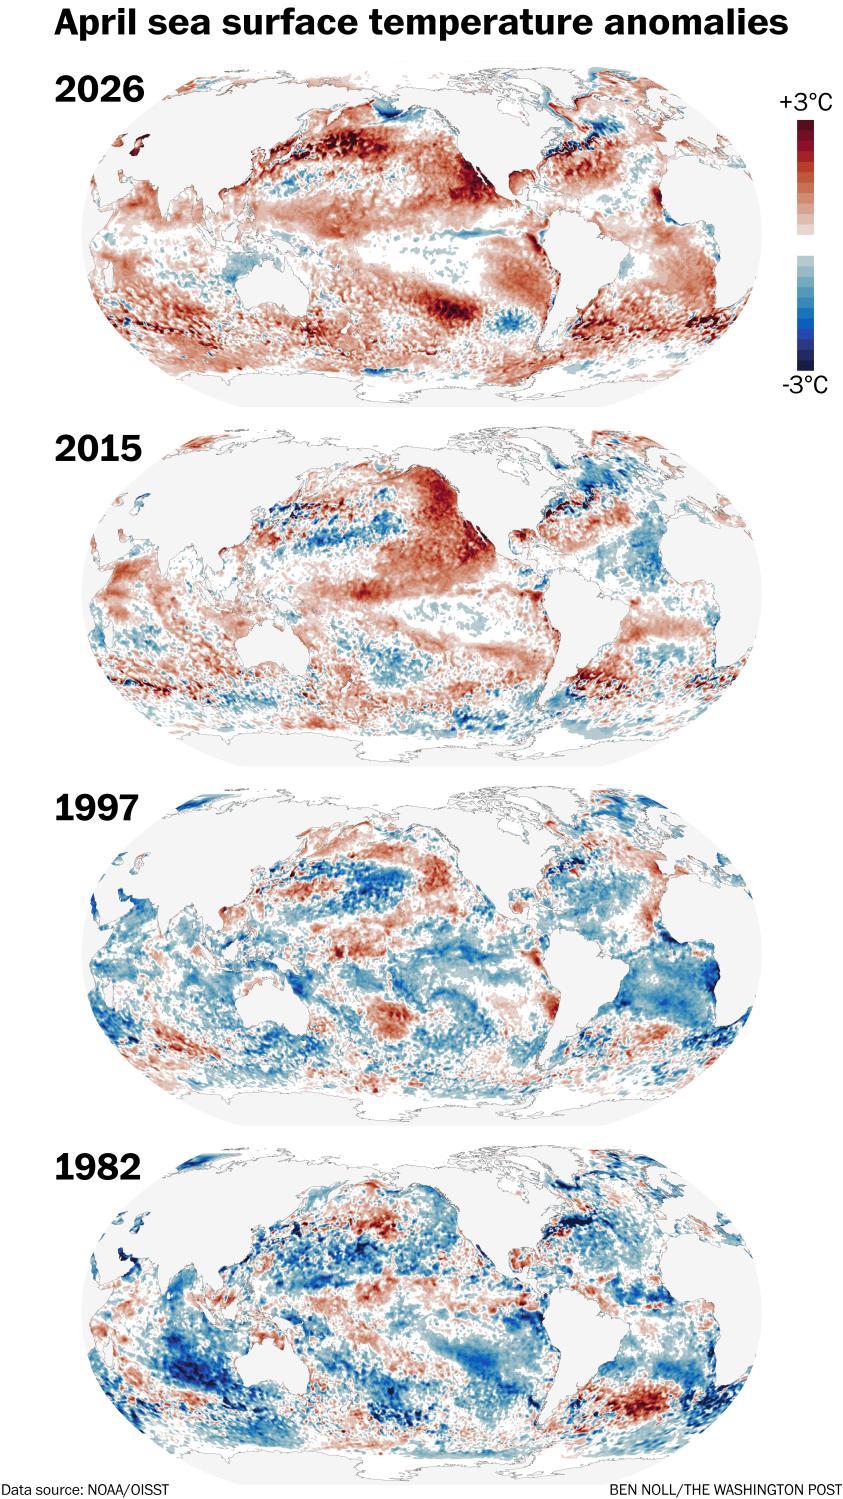
CLIMATE CHANGE
Decades
Long term planning decisions. Often associated with large assets, investment and land use.
Months
Medium term planning out to ~18 months, accounting for climate variability including El Niño/La Niña. Insight into the “flavour” of the climate e.g. prevailing wind flows, rainfall, and temperature patterns. SEASONAL SUB-SEASONAL WEATHER NOW
Weeks
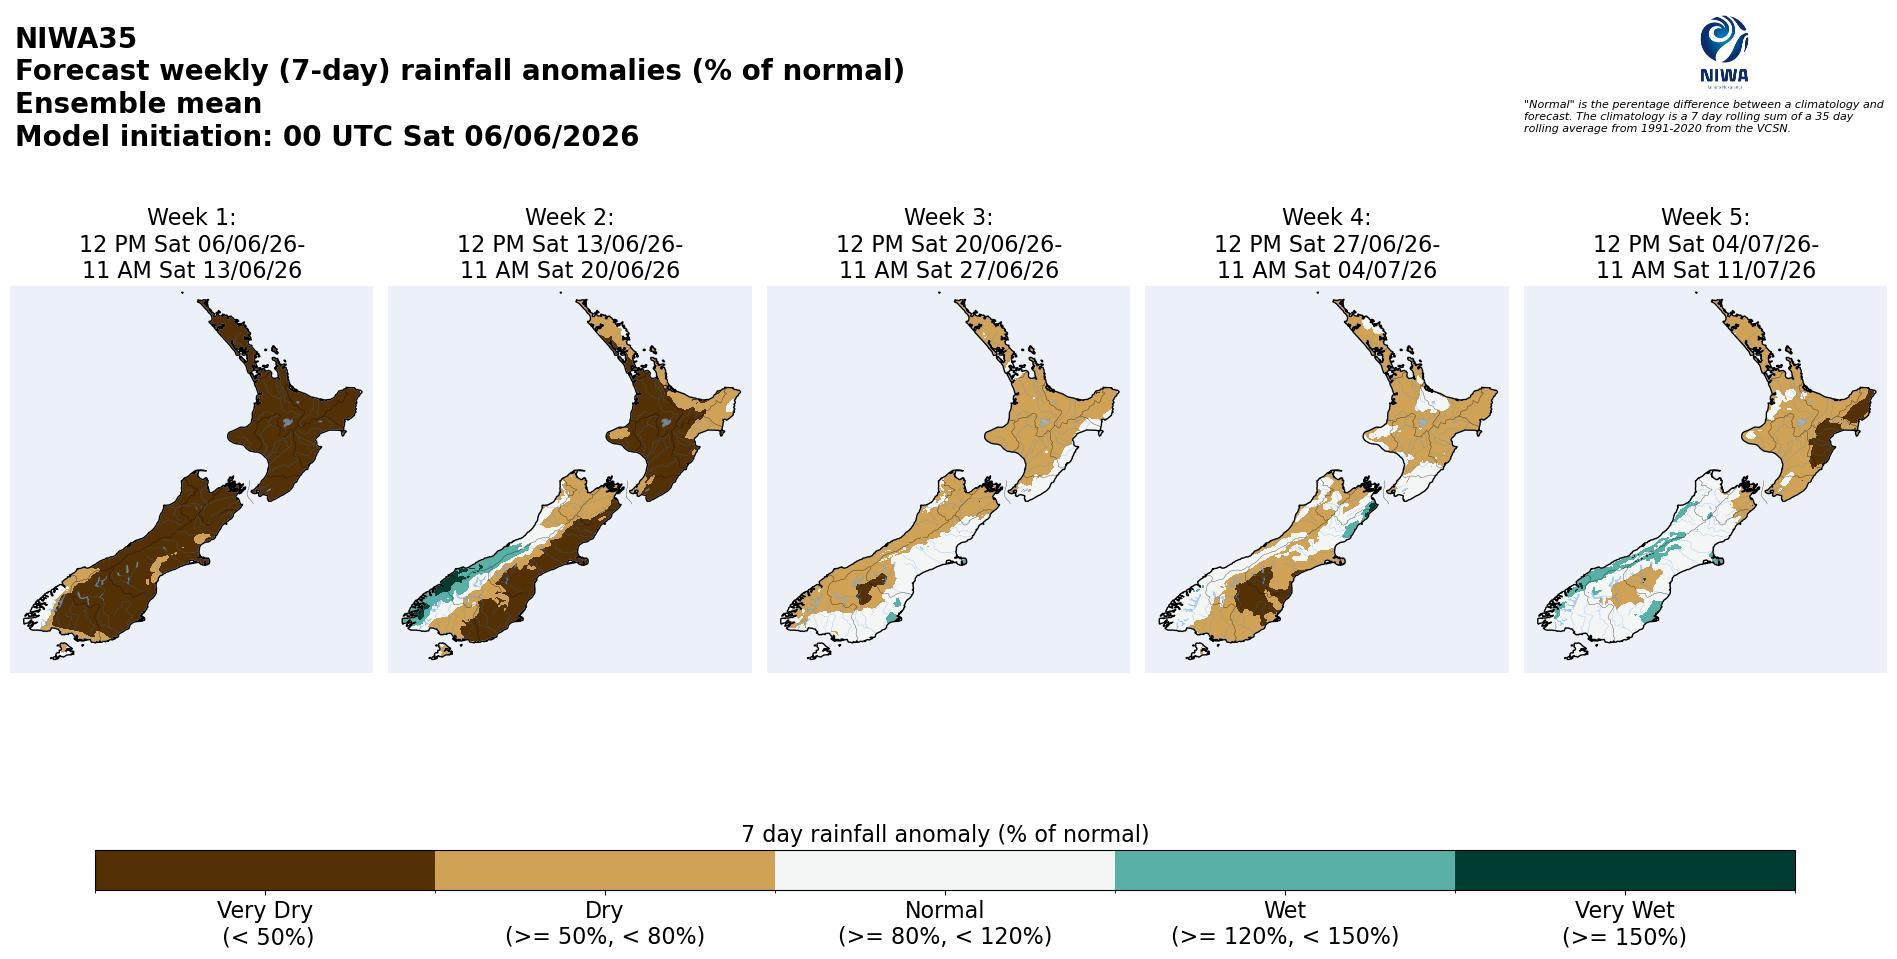
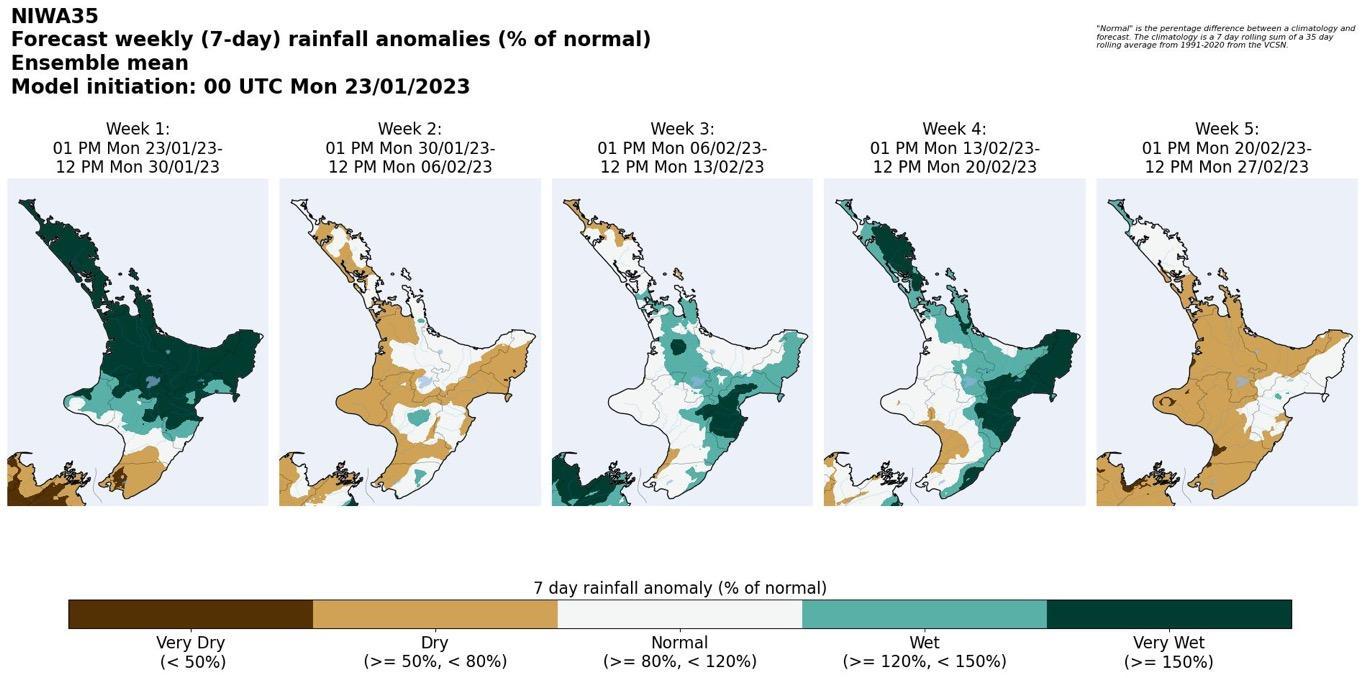
A heads up beyond what your weather app shows. Includes heavy rain and abnormal dryness, unusual temperatures and wind strength - supports shorter term decision-making and planning.
Days
Detailed information about when and where certain weather will occur. Information on severity and intensity is brought into focus.
Minutes to hours
Alerts based on current weather and custom thresholds or "nowcasts" – forecasts guided by live observations.
PAST CLIIMATE
Historic
Past observations and climate reanalysis. When combined with operational business data, the influence of weather and climate can be discerned.
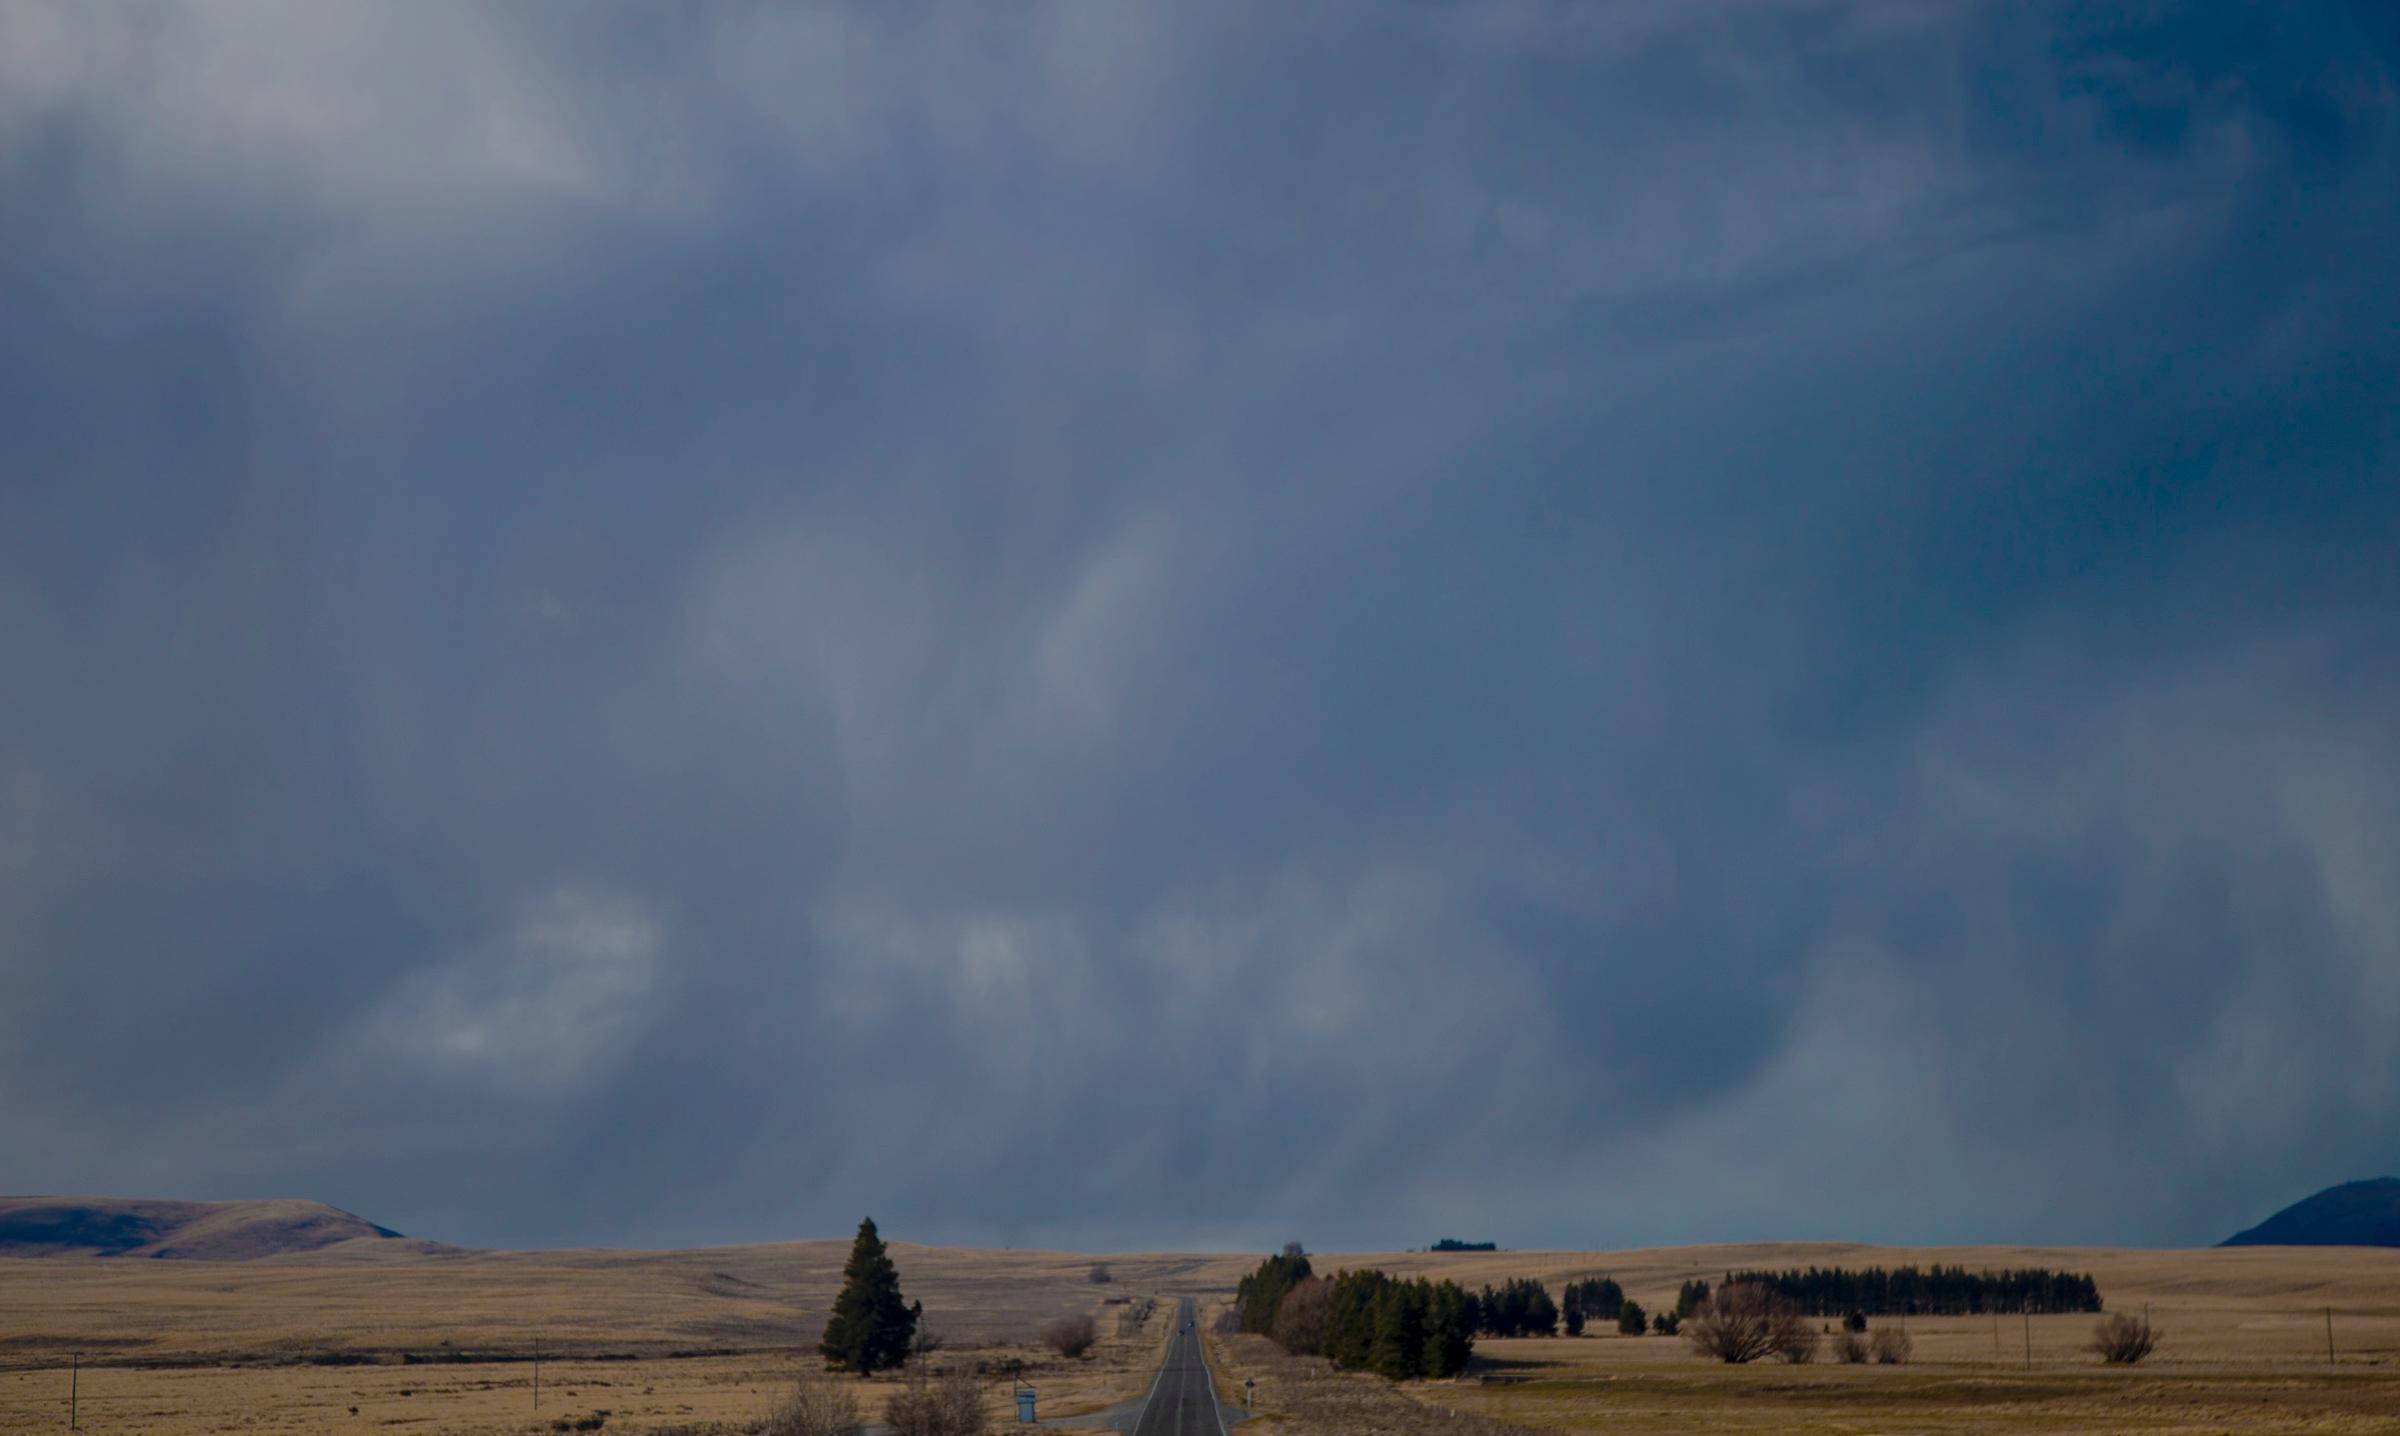
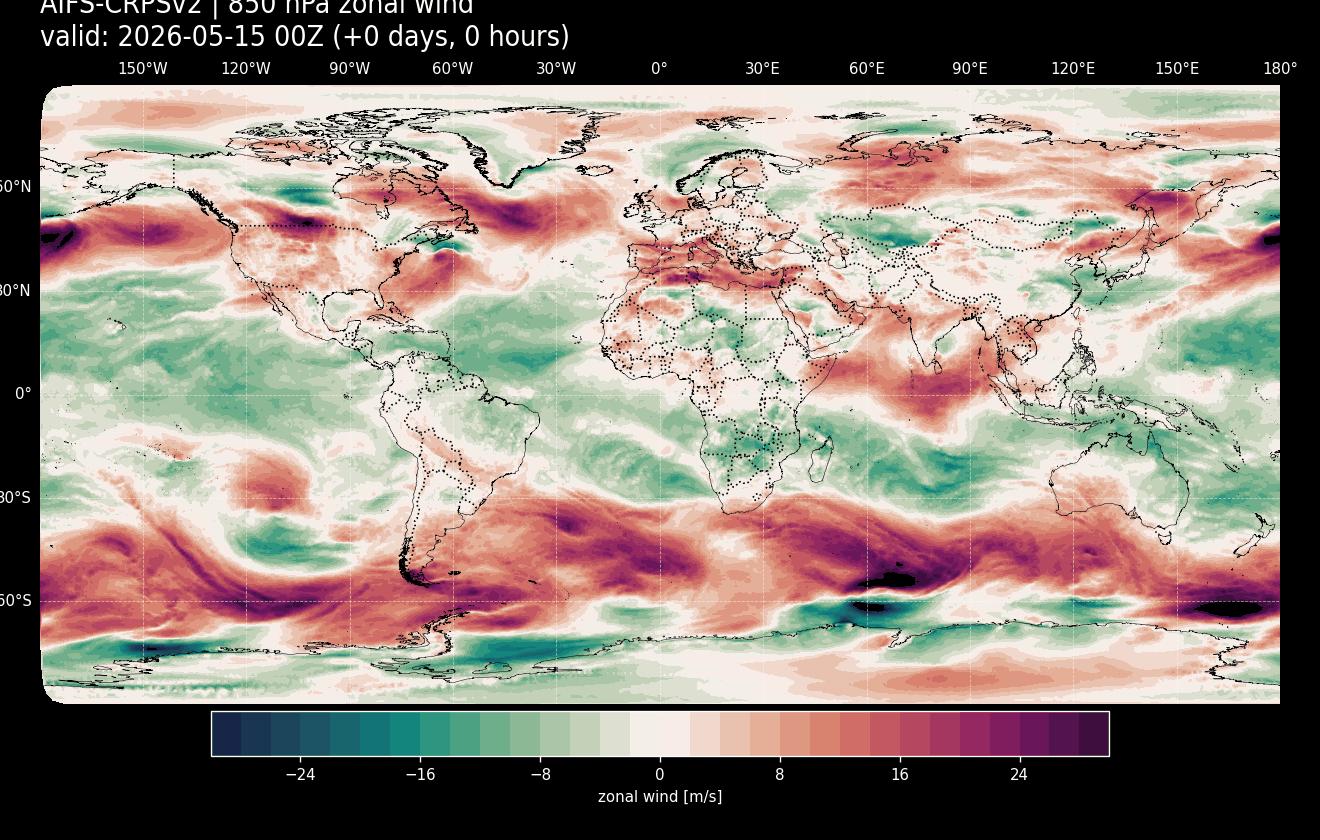
CLIMATE CHANGE
SEASONAL SUB-SEASONAL WEATHER NOW
PAST CLIIMATE
Decades
Long term planning decisions. Often associated with large assets, investment and land use.
Months
Medium term planning out to ~18 months, accounting for climate variability including El Niño/La Niña. Insight into the “flavour” of the climate e.g. prevailing wind flows, rainfall, and temperature patterns.
Weeks
A heads up beyond what your weather app shows. Includes heavy rain and abnormal dryness, unusual temperatures and wind strength - supports shorter term decision-making and planning.
Days
Detailed information about when and where certain weather will occur. Information on severity and intensity is brought into focus.
Minutes to hours
Alerts based on current weather and custom thresholds or "nowcasts" – forecasts guided by live observations.
Historic
Past observations and climate reanalysis. When combined with operational business data, the influence of weather and climate can be discerned.
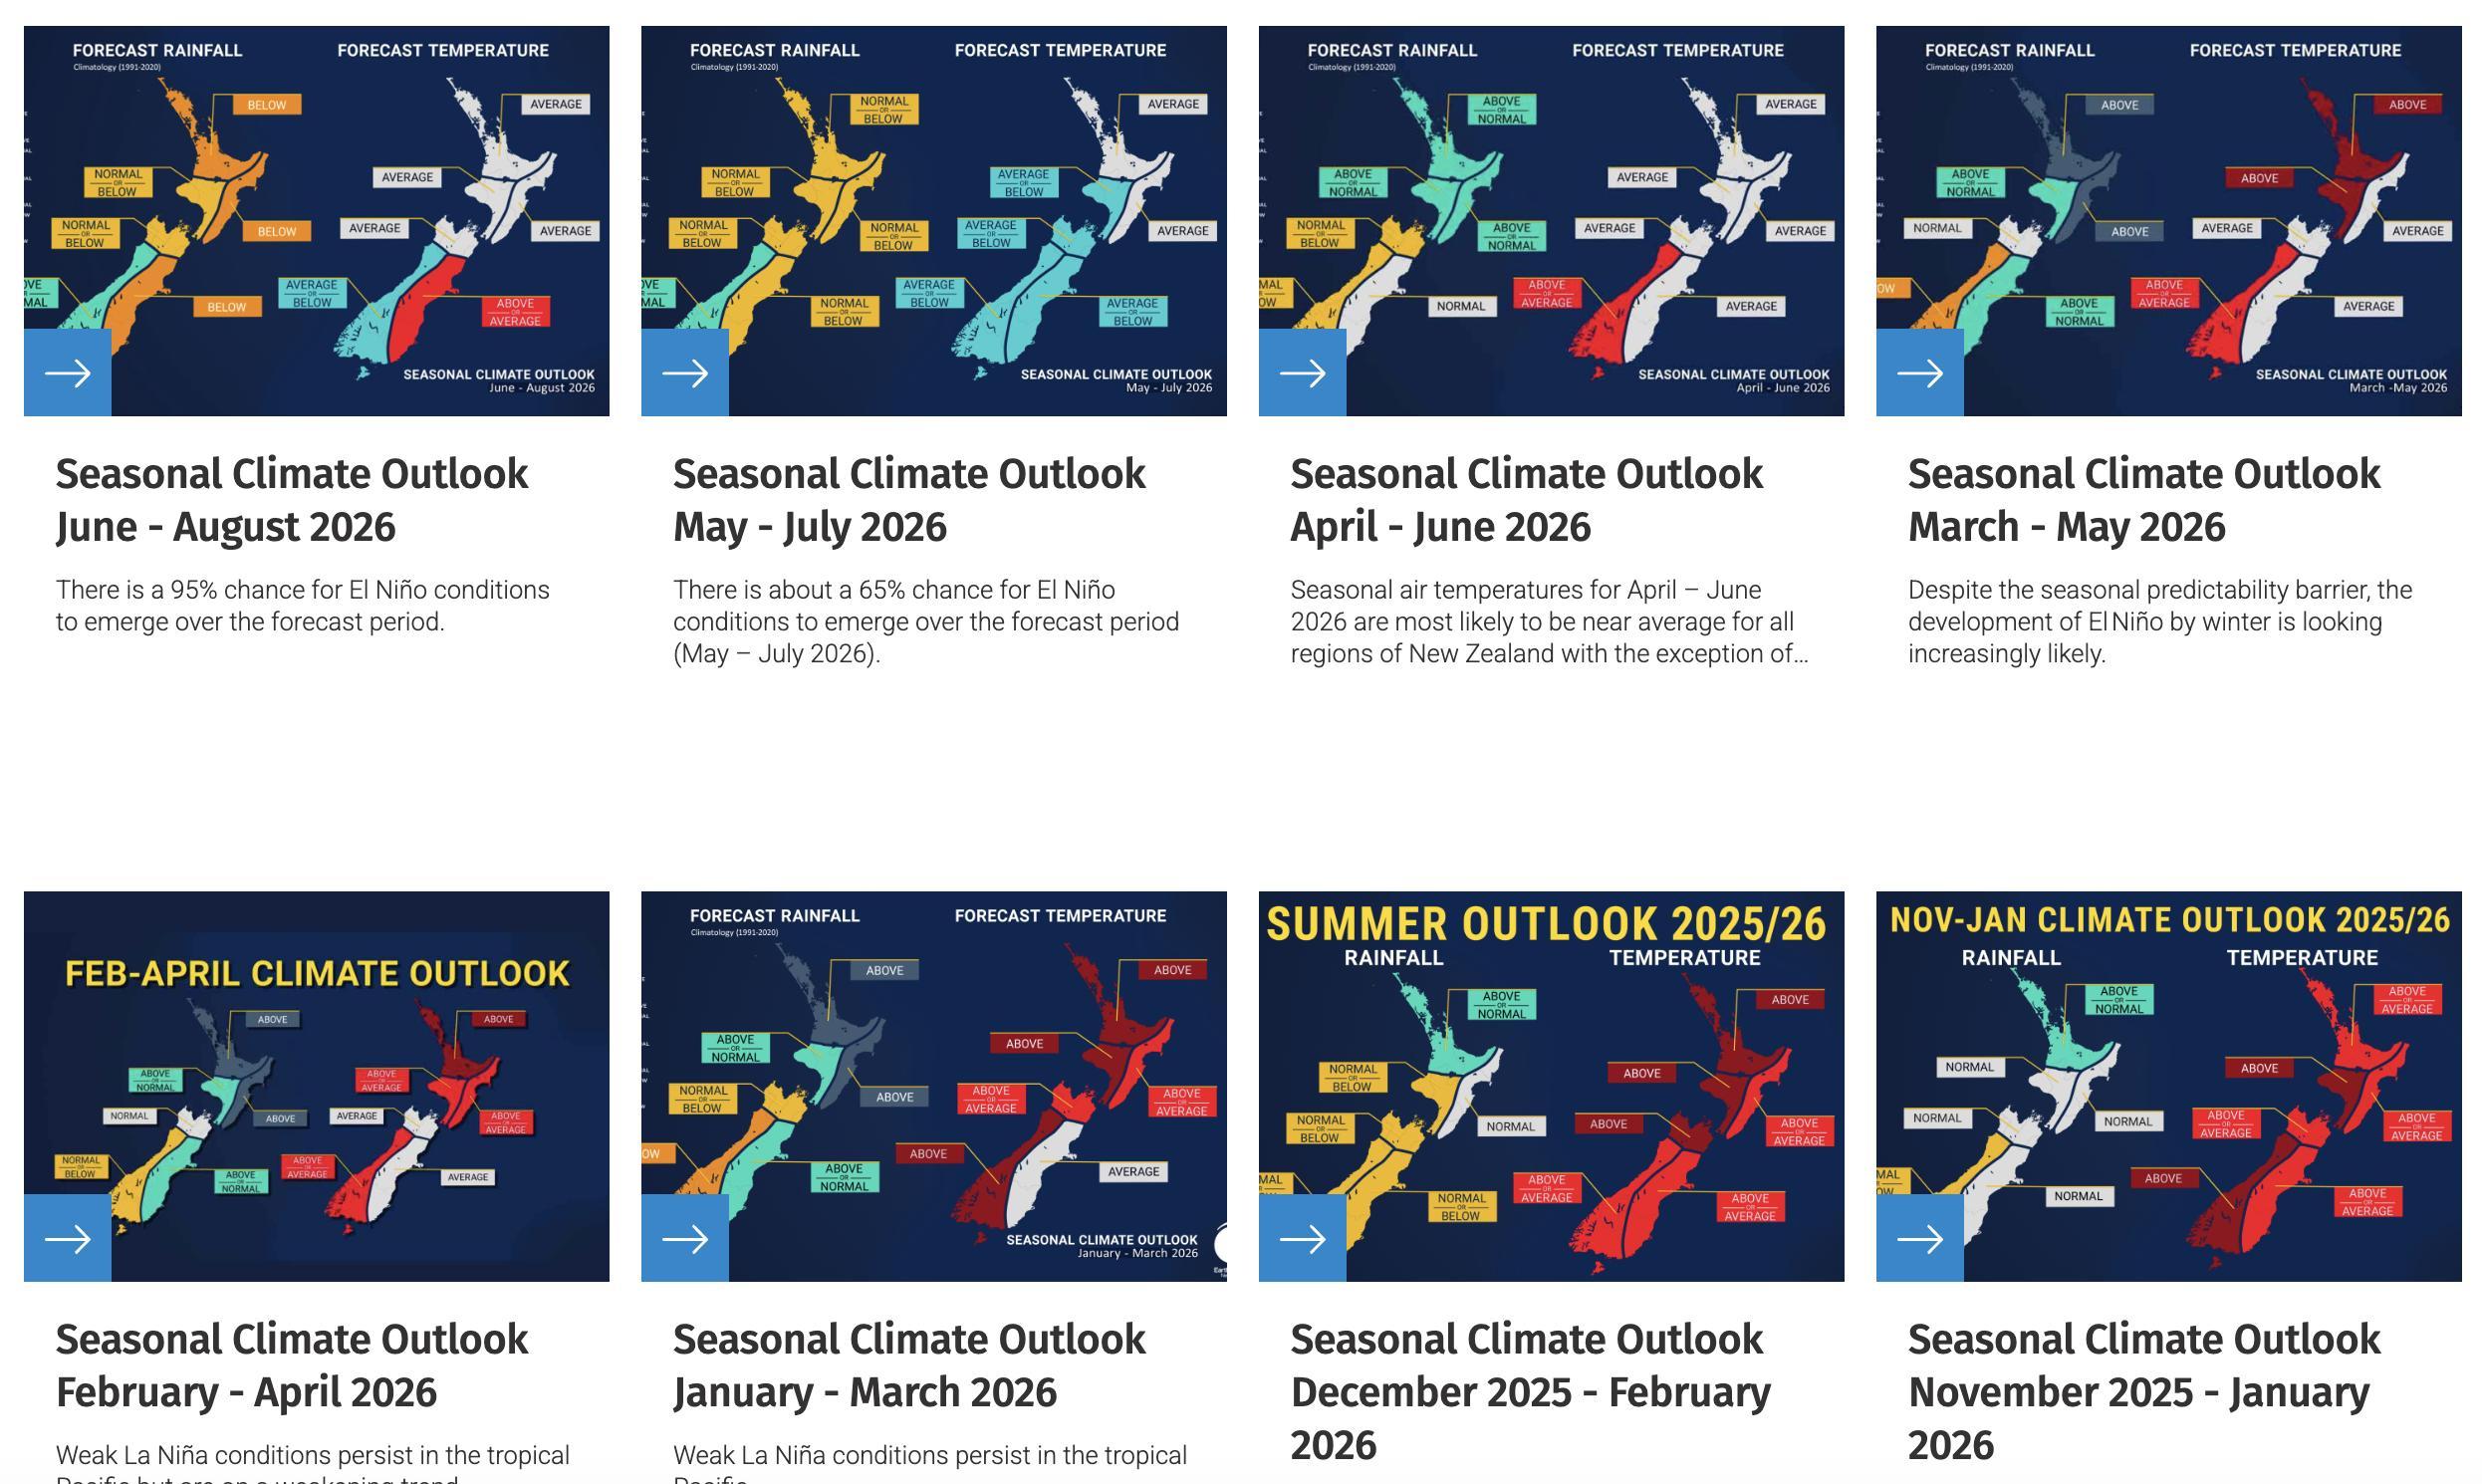
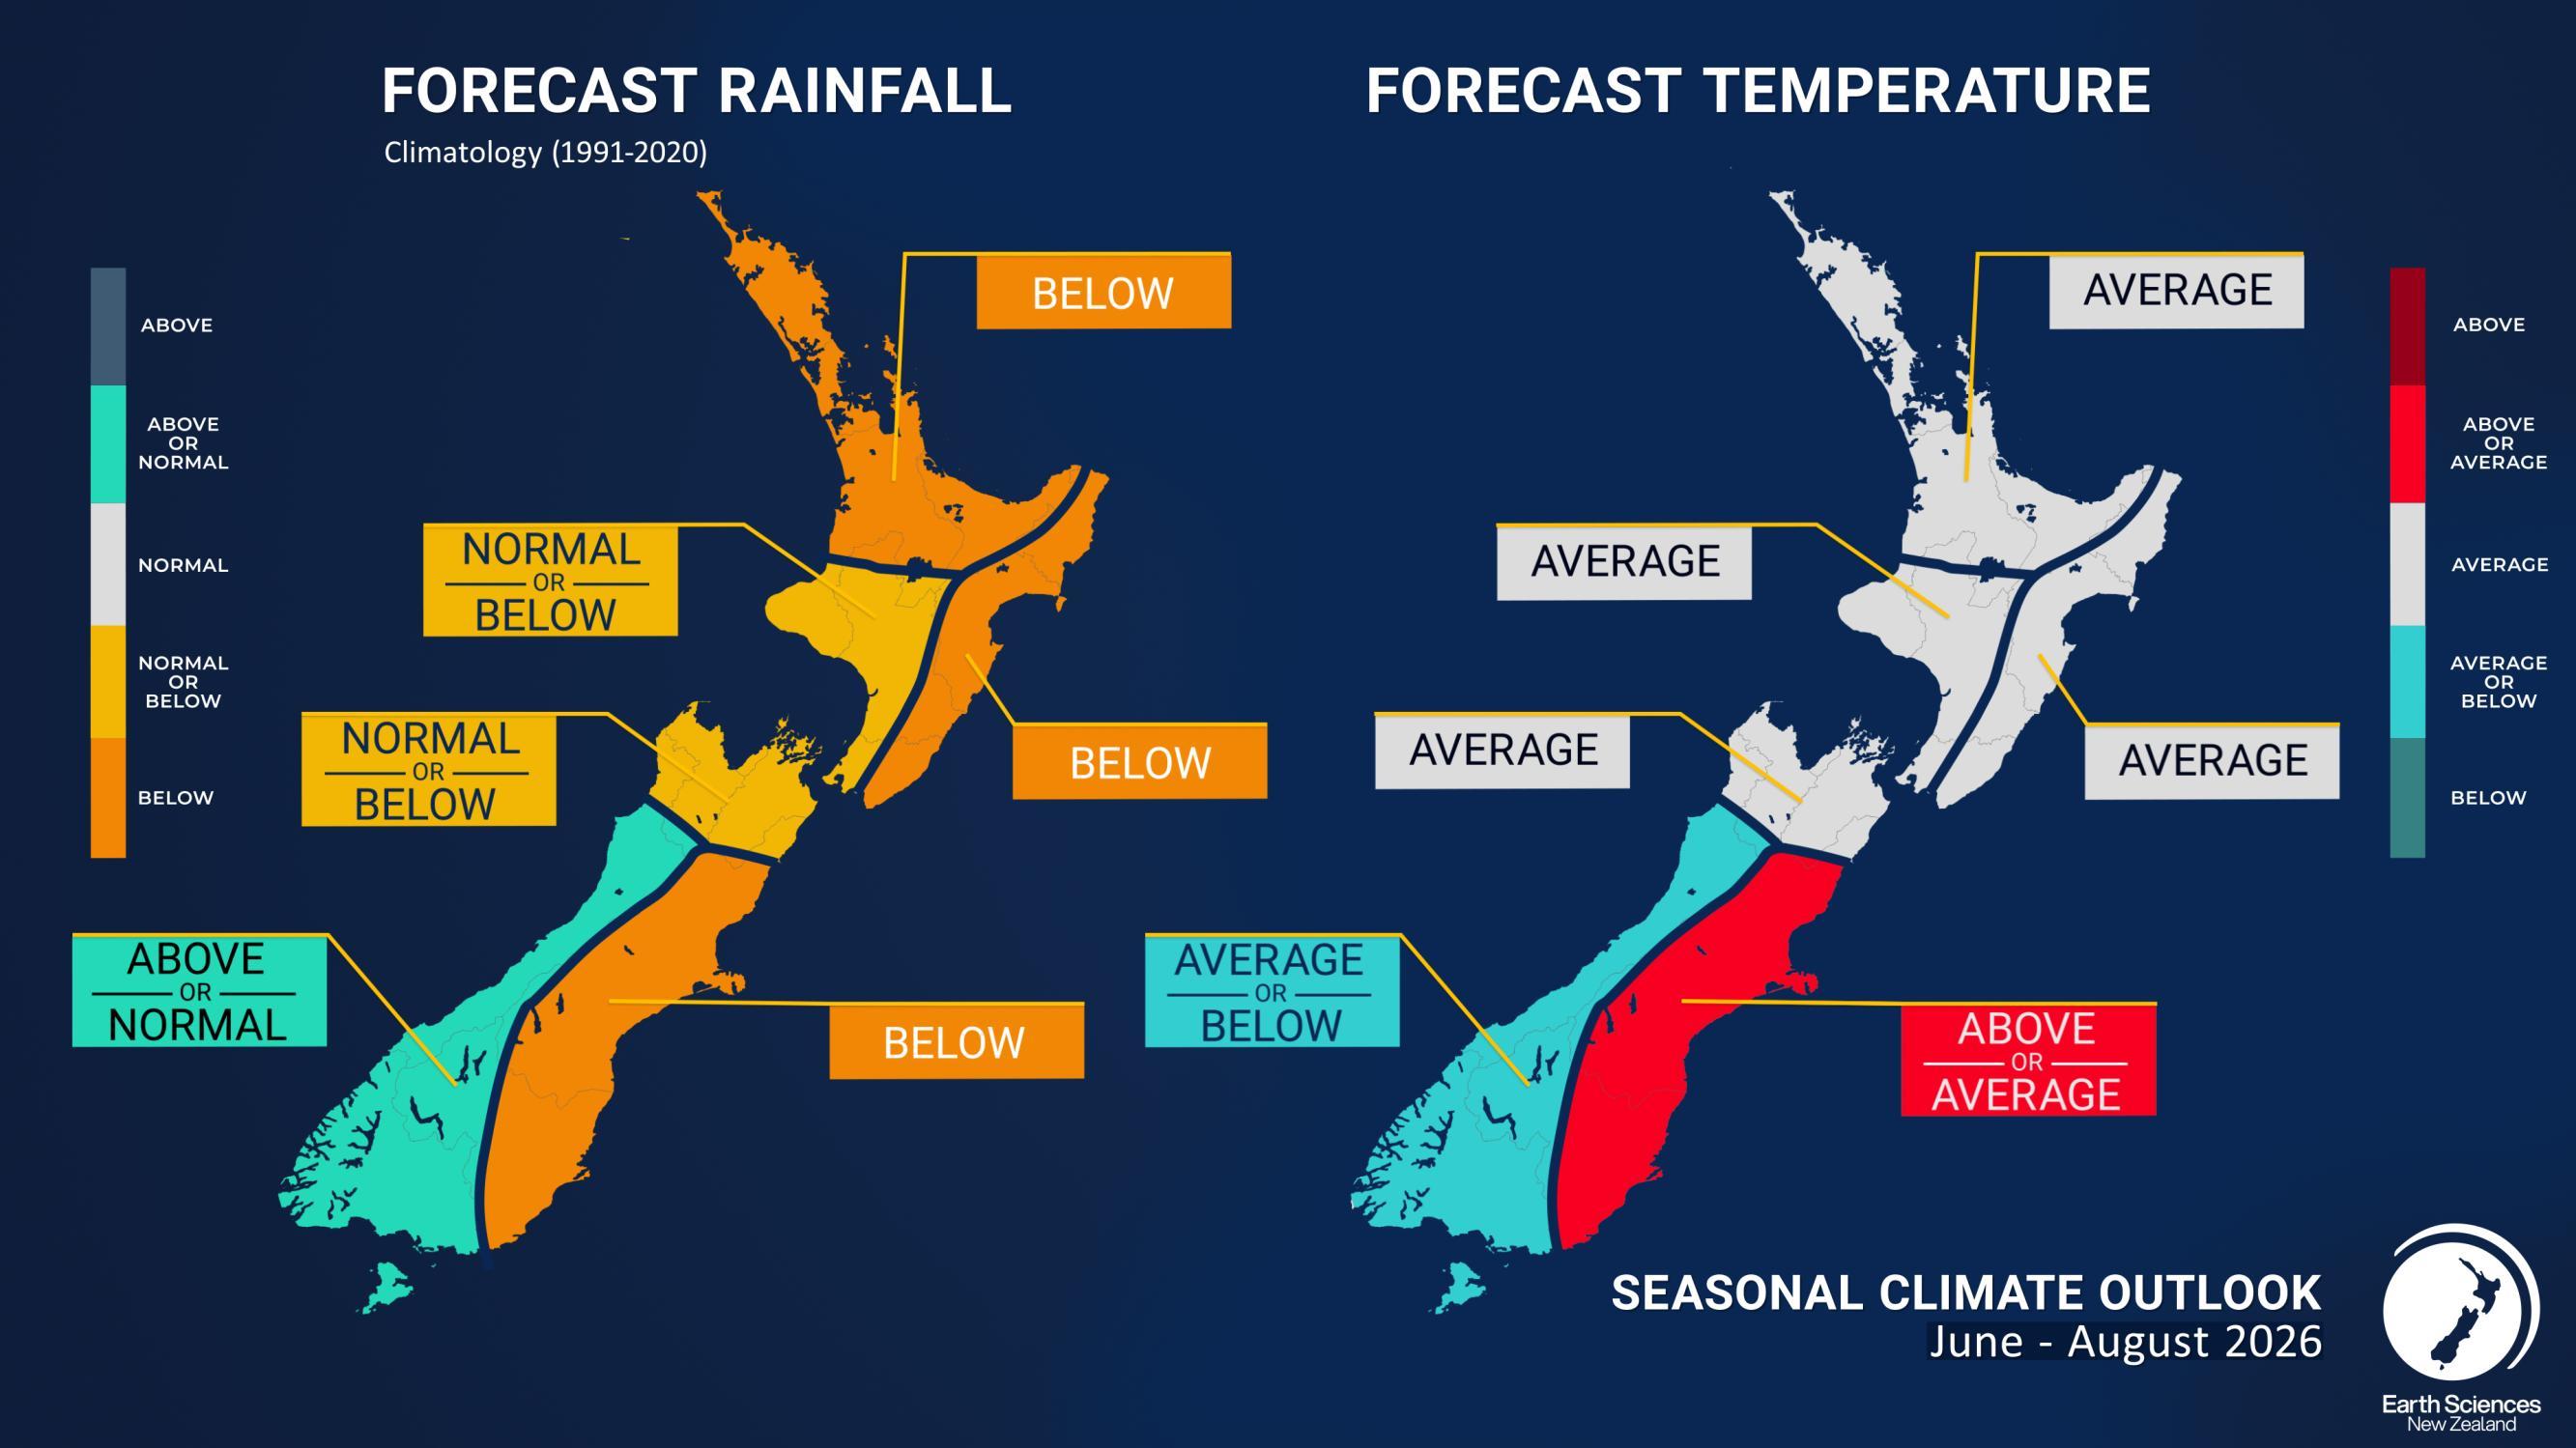
• Earth Sciences NZ Seasonal Climate Outlook
https://niwa.co.nz/climate-andweather/seasonal-climate-outlookupdated monthly at the end/start of month
• NIWA35 Subseasonal model
https://shiny.niwa.co.nz/droughtforecast/ - updated daily
• Ben Noll on Twitter
https://x.com/BenNollWeather
of Otago


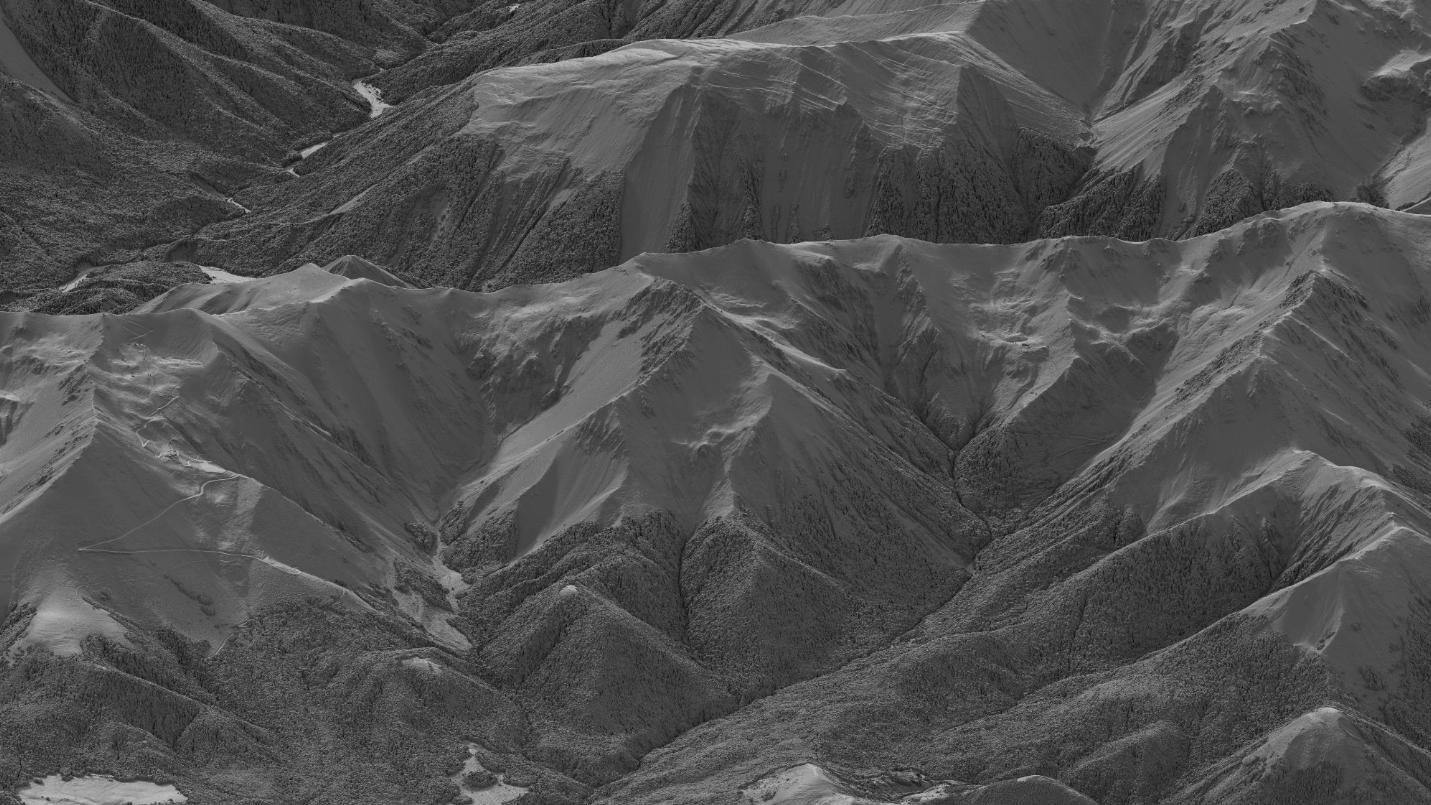
• The alpine regions are generally the last to get investment in mapping
• They are also the hardest to map well (steep terrain complicates things)
• Regardless, we now have a range of detailed mapping products (data) available in NZ alpine regions.
• Apps and websites are increasingly using the data, which means you are too.
Let’s chat about what it all means.
• Tools are really powerful
• But hard to know what we are looking at sometimes

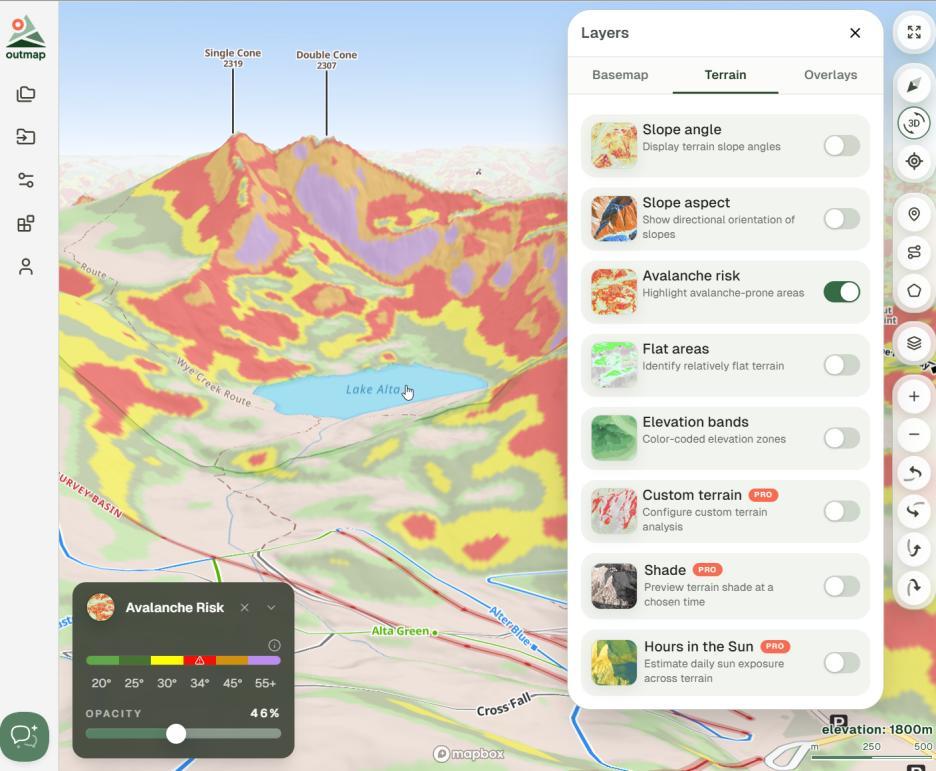
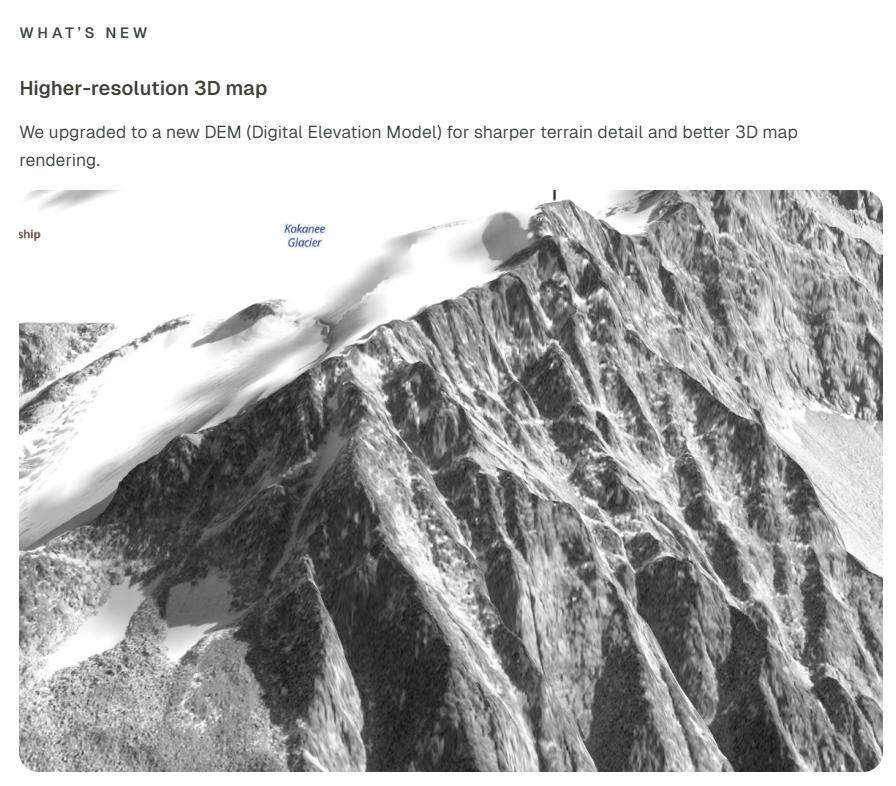
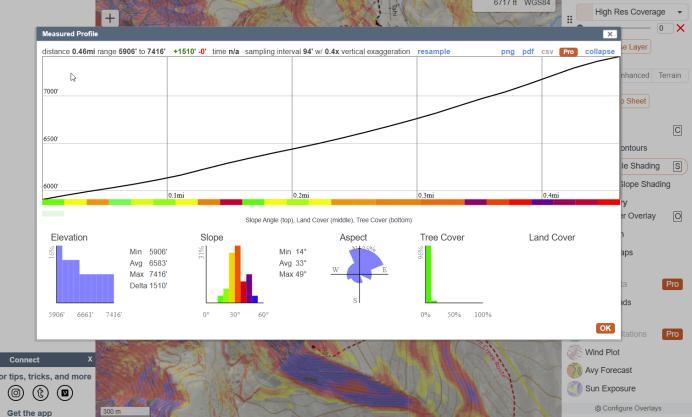

• For example, our research involves applying the latest geospatial tools to understanding snow avalanche hazards.
• To improve our understanding of the hazard we need to get a handle on digital terrain representation. It makes our research more useful to you.
• I think about this a lot, but it’s important for less nerdy mountain people to dwell on this too.


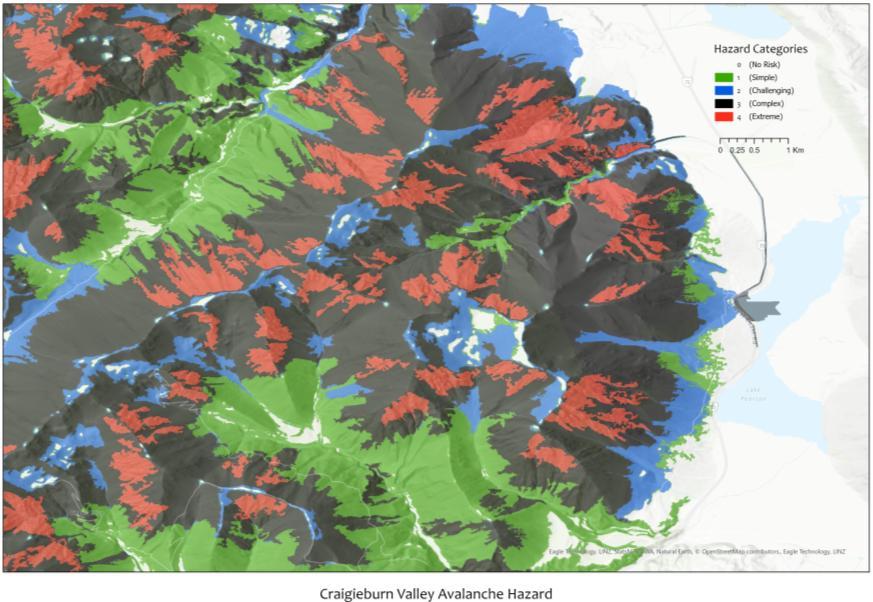
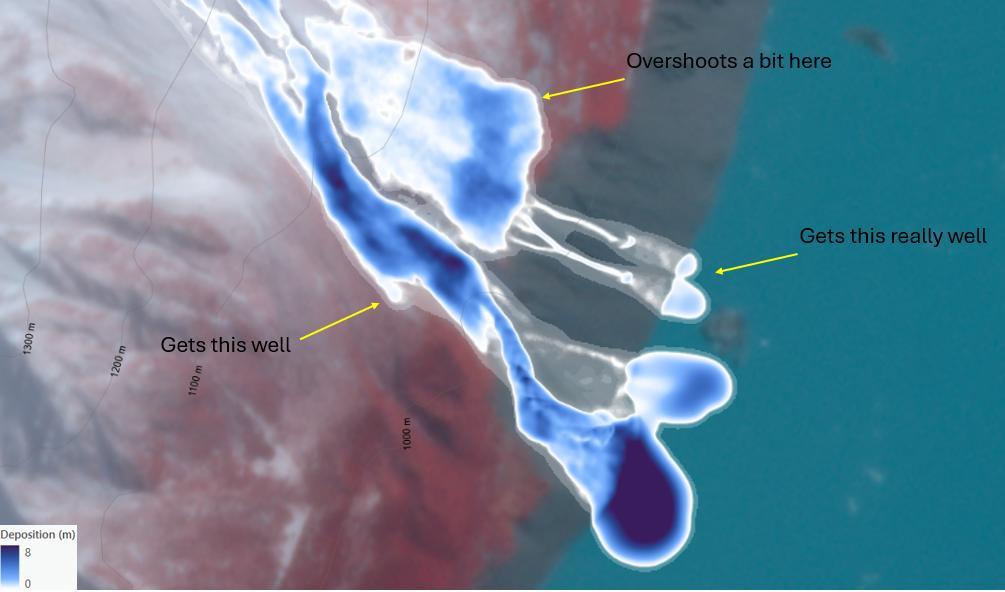
• Modern topographic data are much more detailed than in the past
• The large investment to map large areas of NZ is happening right now
• You (rate payers/ tax payers) paid for the data, now freely available
• While more detailed topographic representations are a good thing, we do need to be careful how to interpret the data








1. Resolution matters (how much detail is there—just like with weather models and forecasts)


2. When the data were captured matters (landscapes change; summer vs winter mapping)




3. What you will use the data for matters (route planning from home vs. terrain selection in the backcountry. Communicate this to clients/customers/friends/colleagues/people on the street!)





4. This is a rapidly evolving industry (EO data are ubiquitous but not all are created equally)


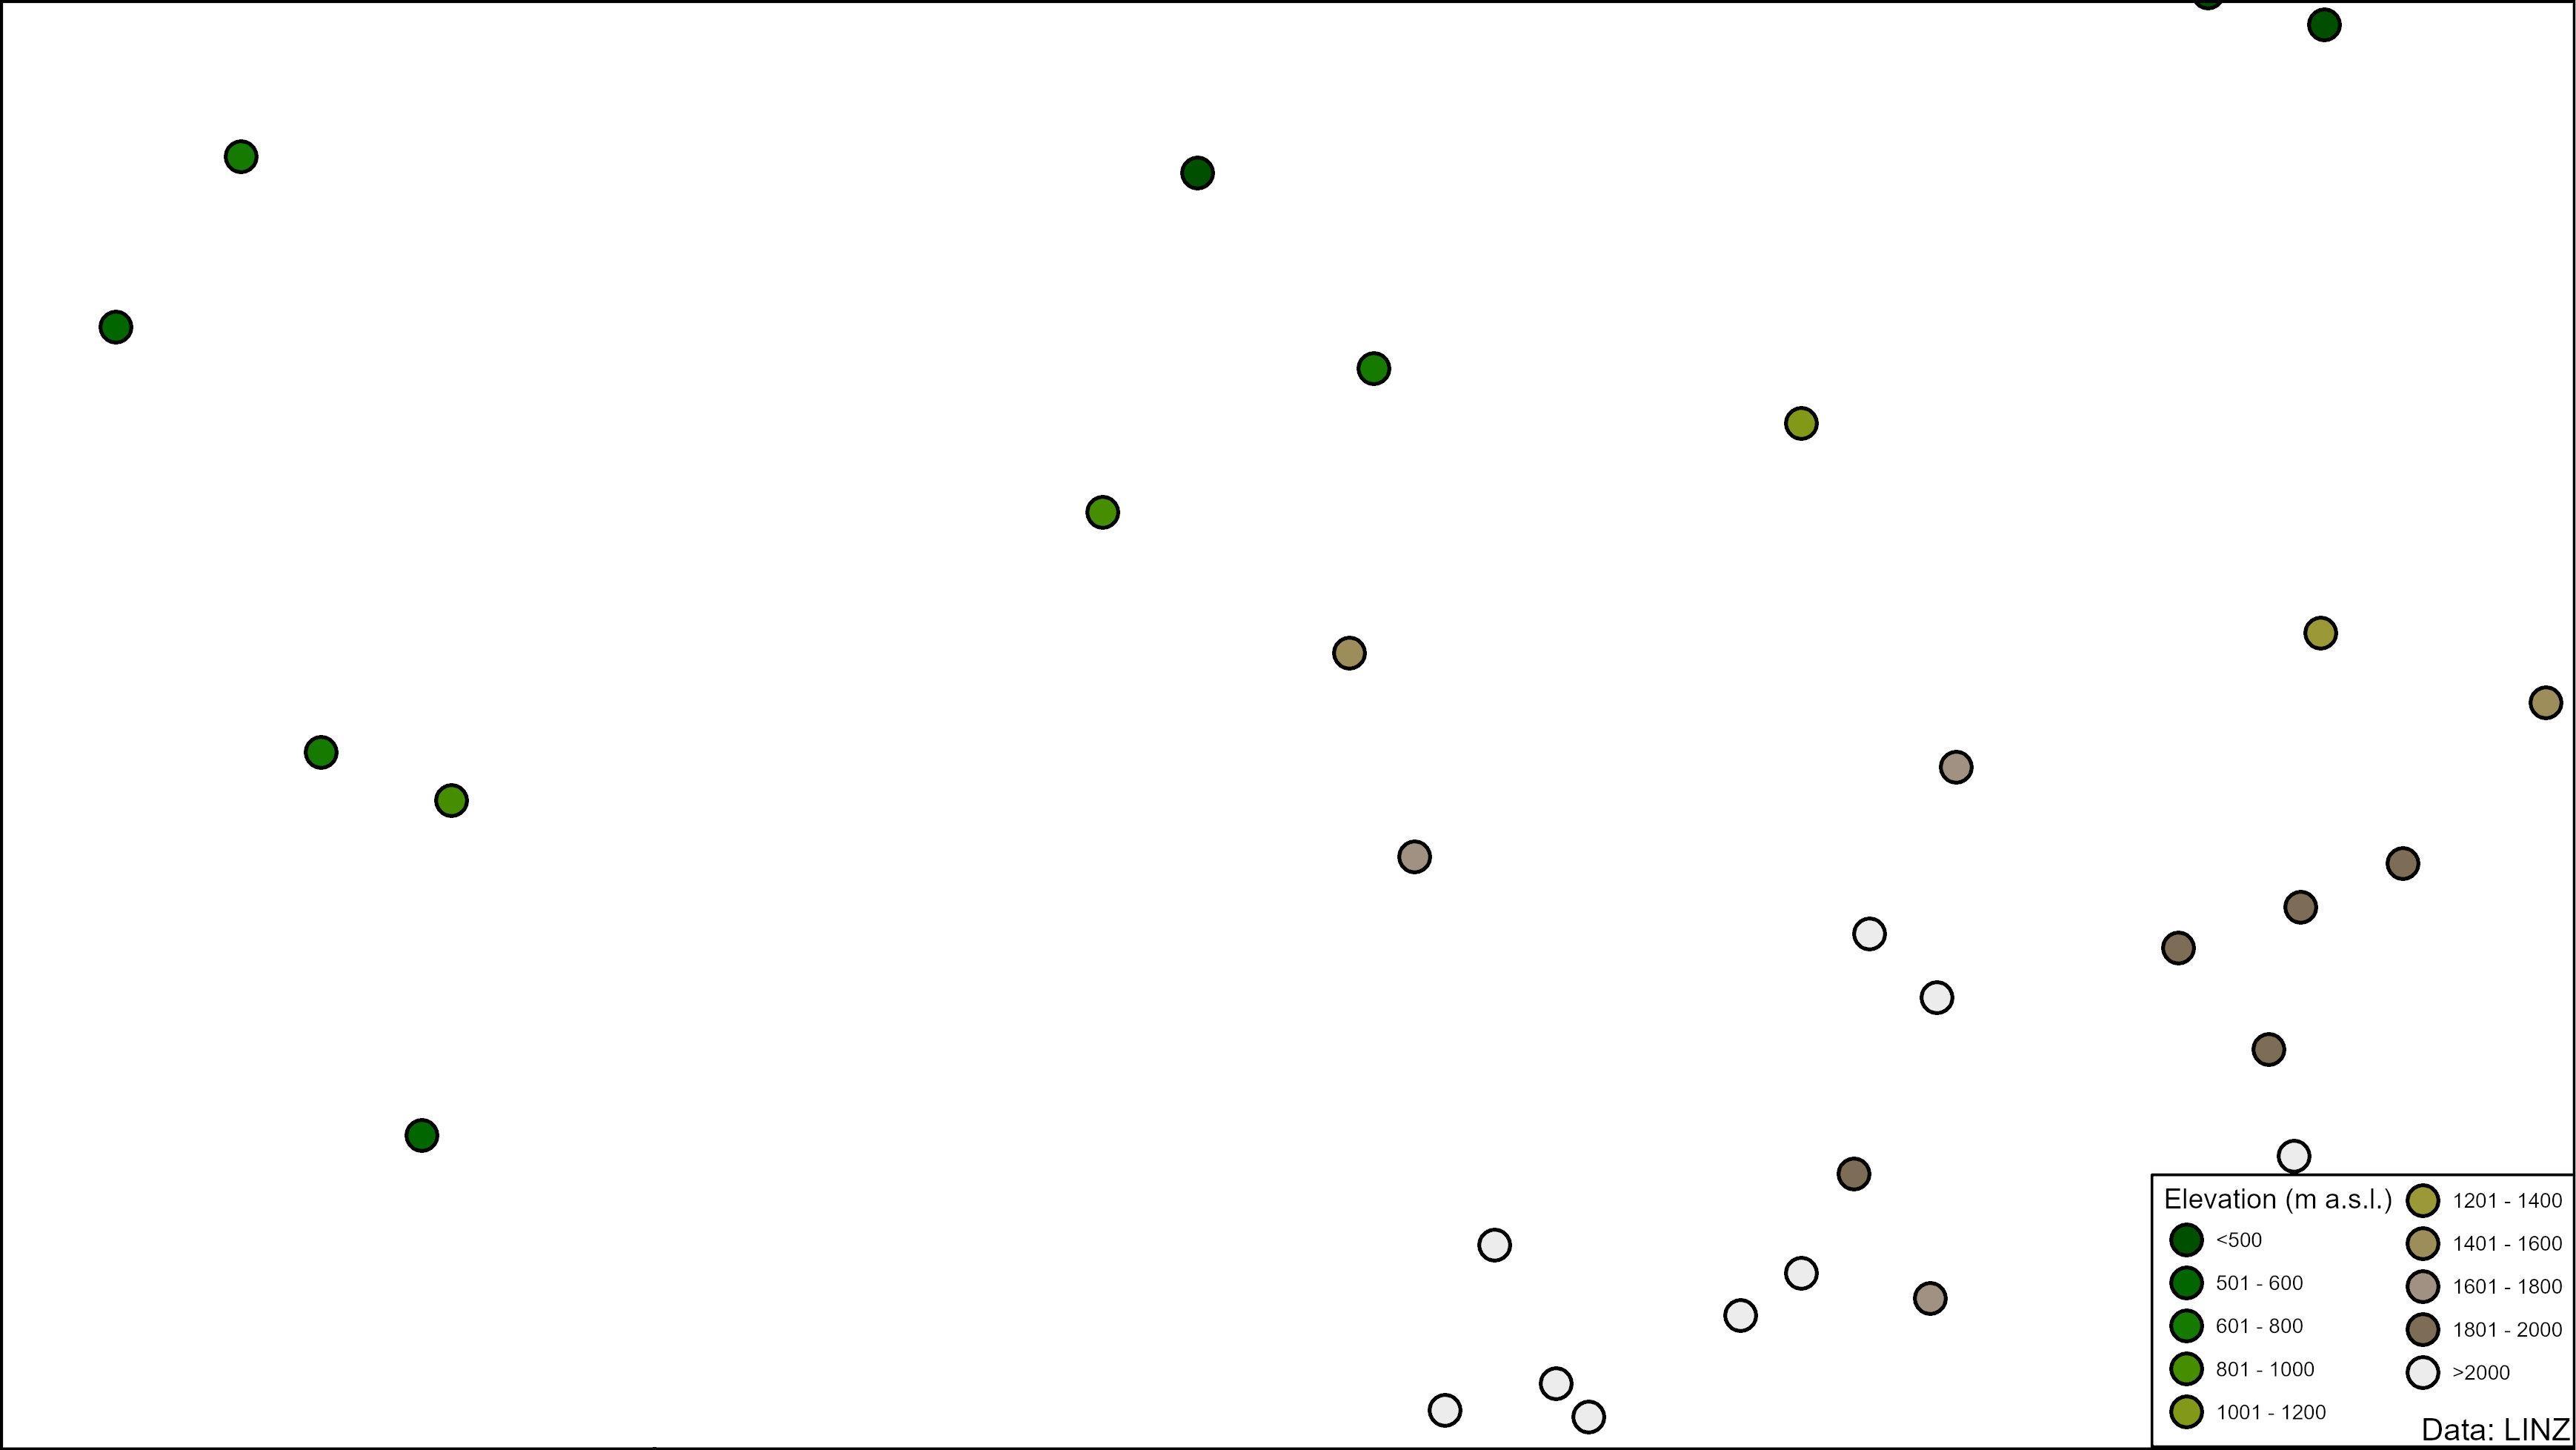
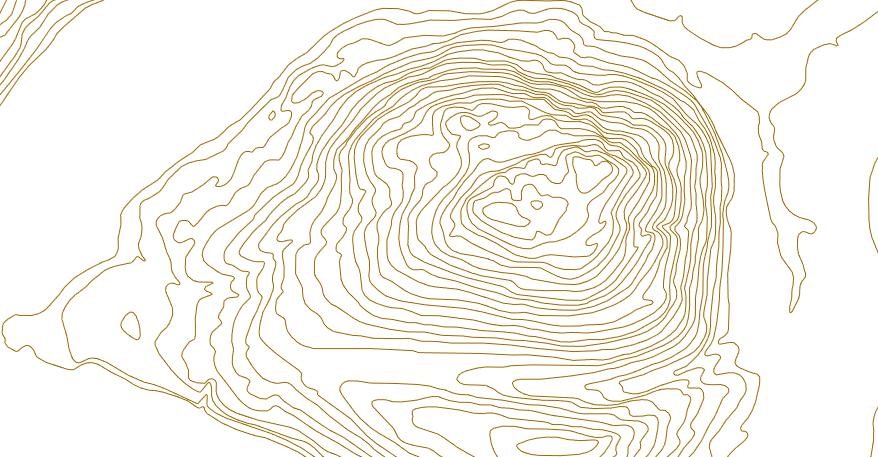
History lesson: The first representations of terrain were surveyed height points
Two free high-fives if you recognise this geography
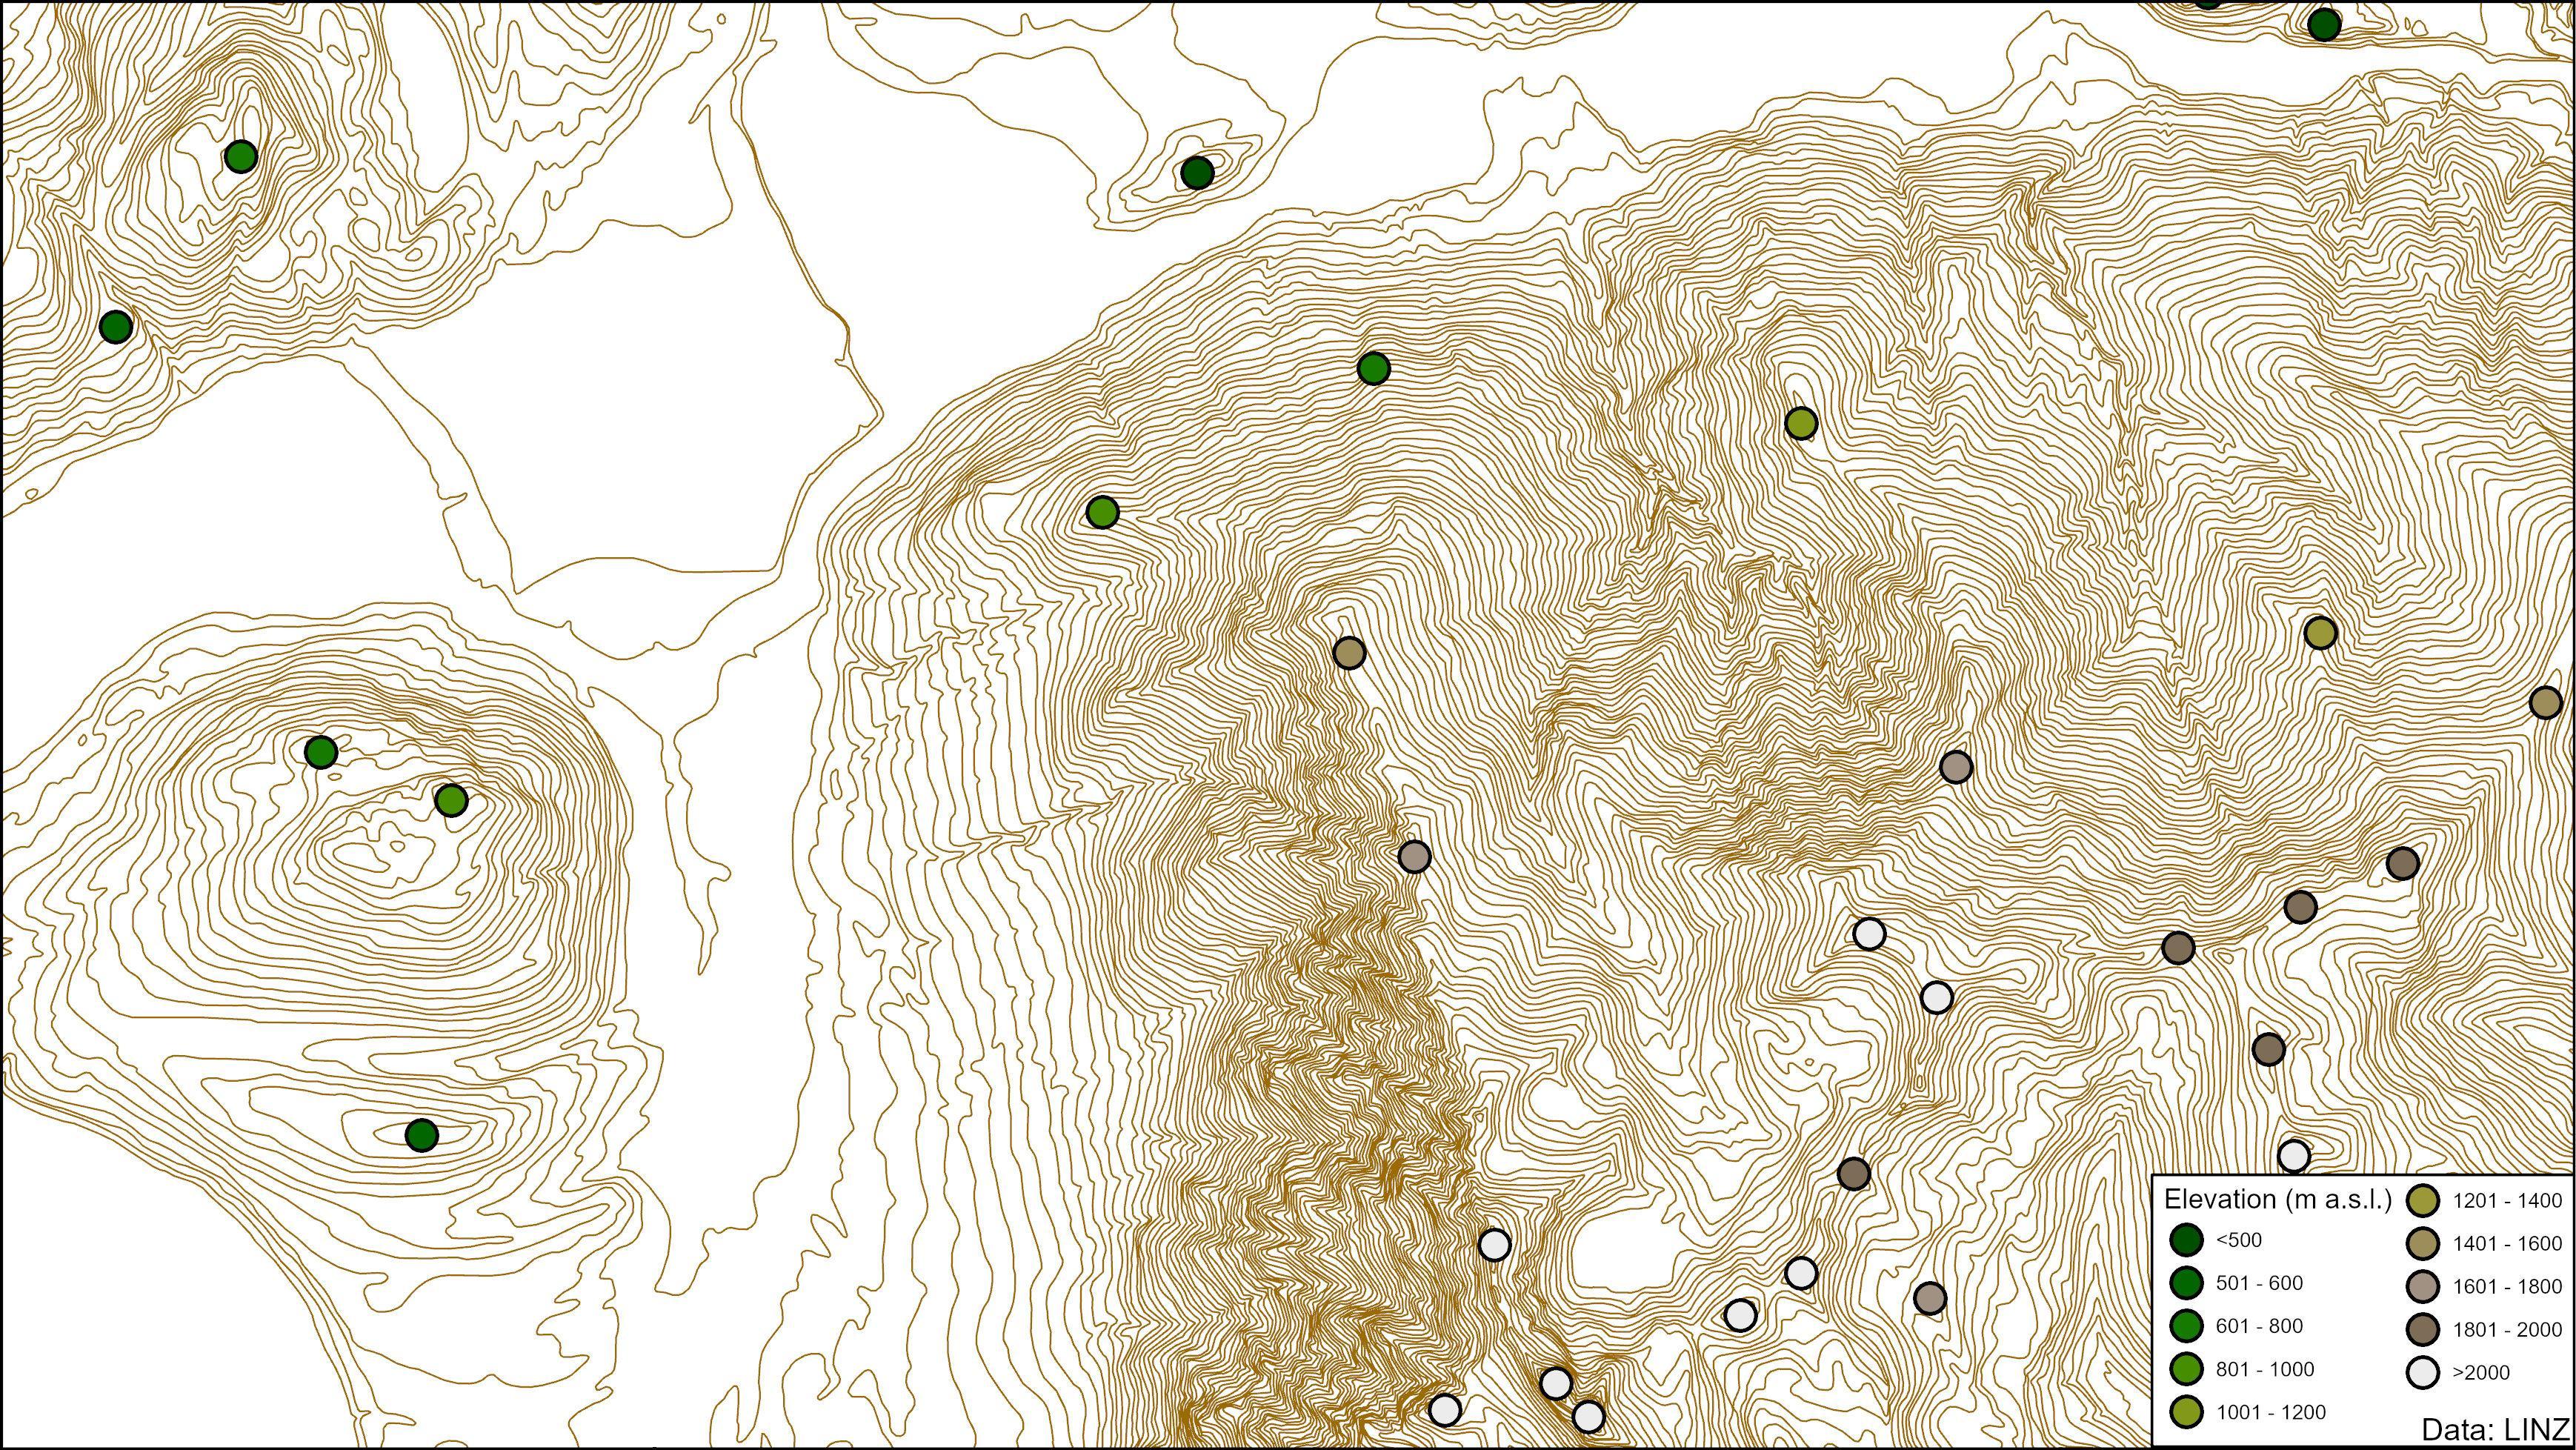

One free high five if you recognise this geography





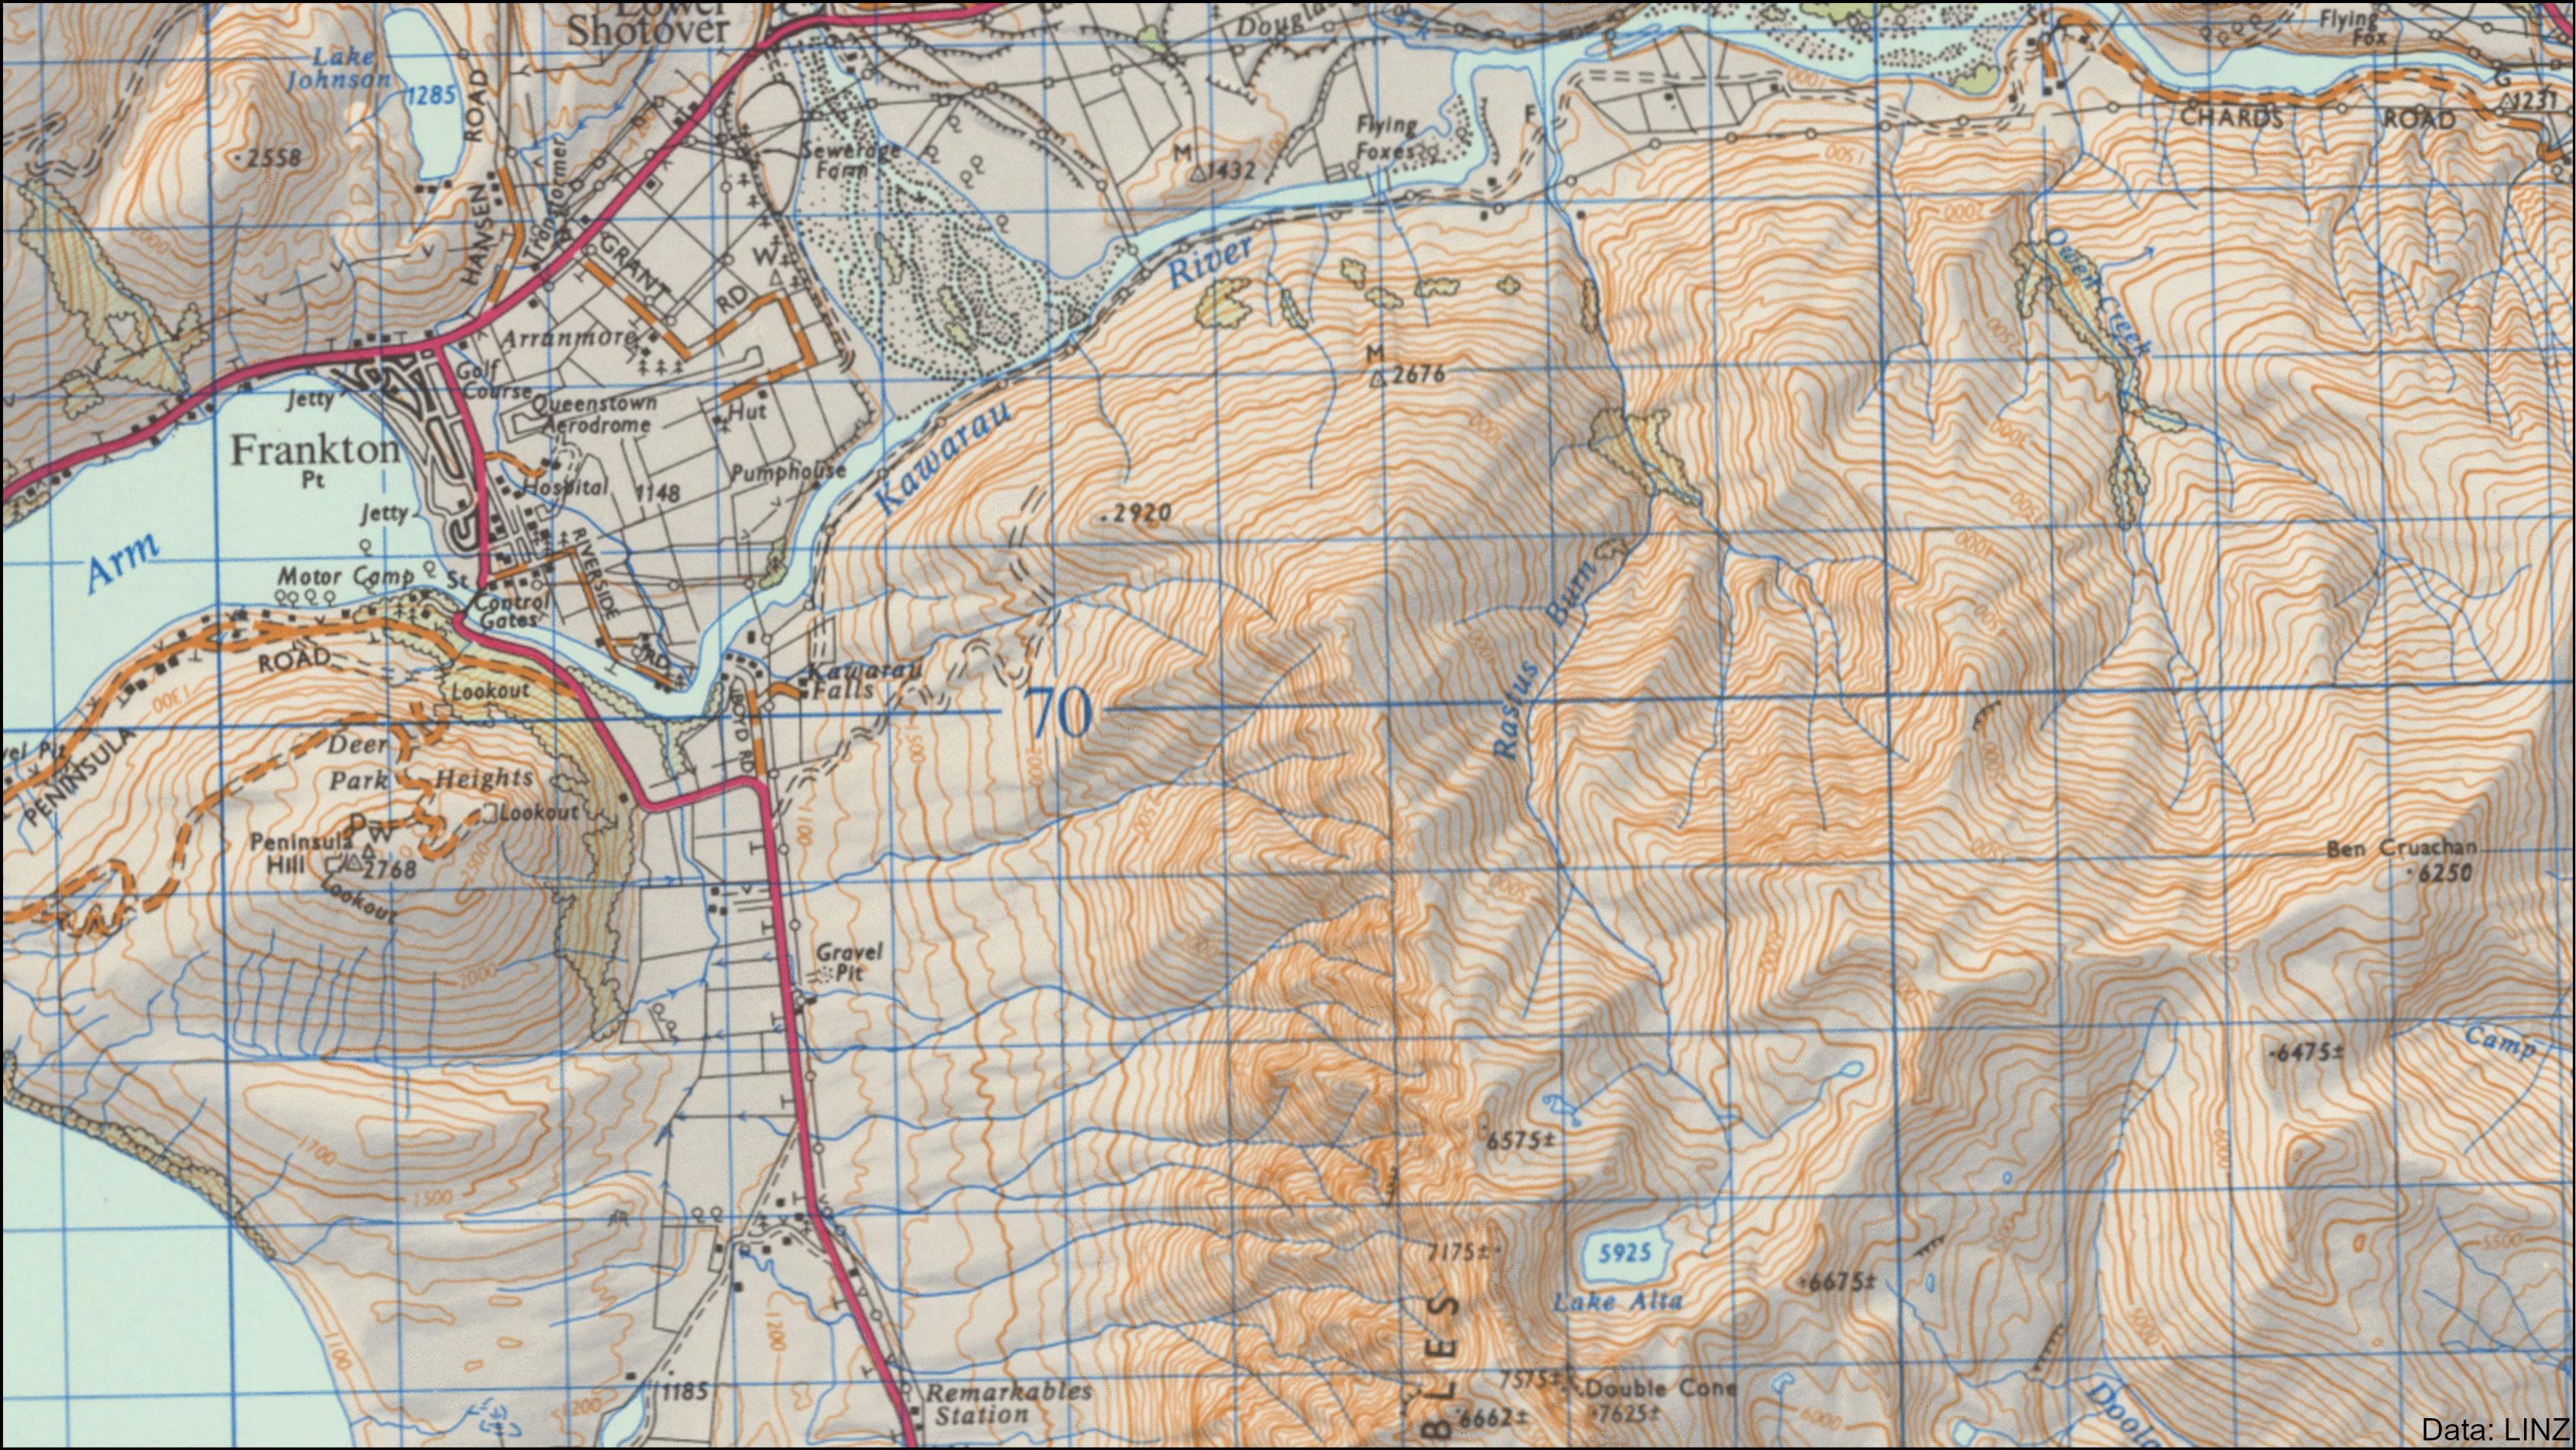
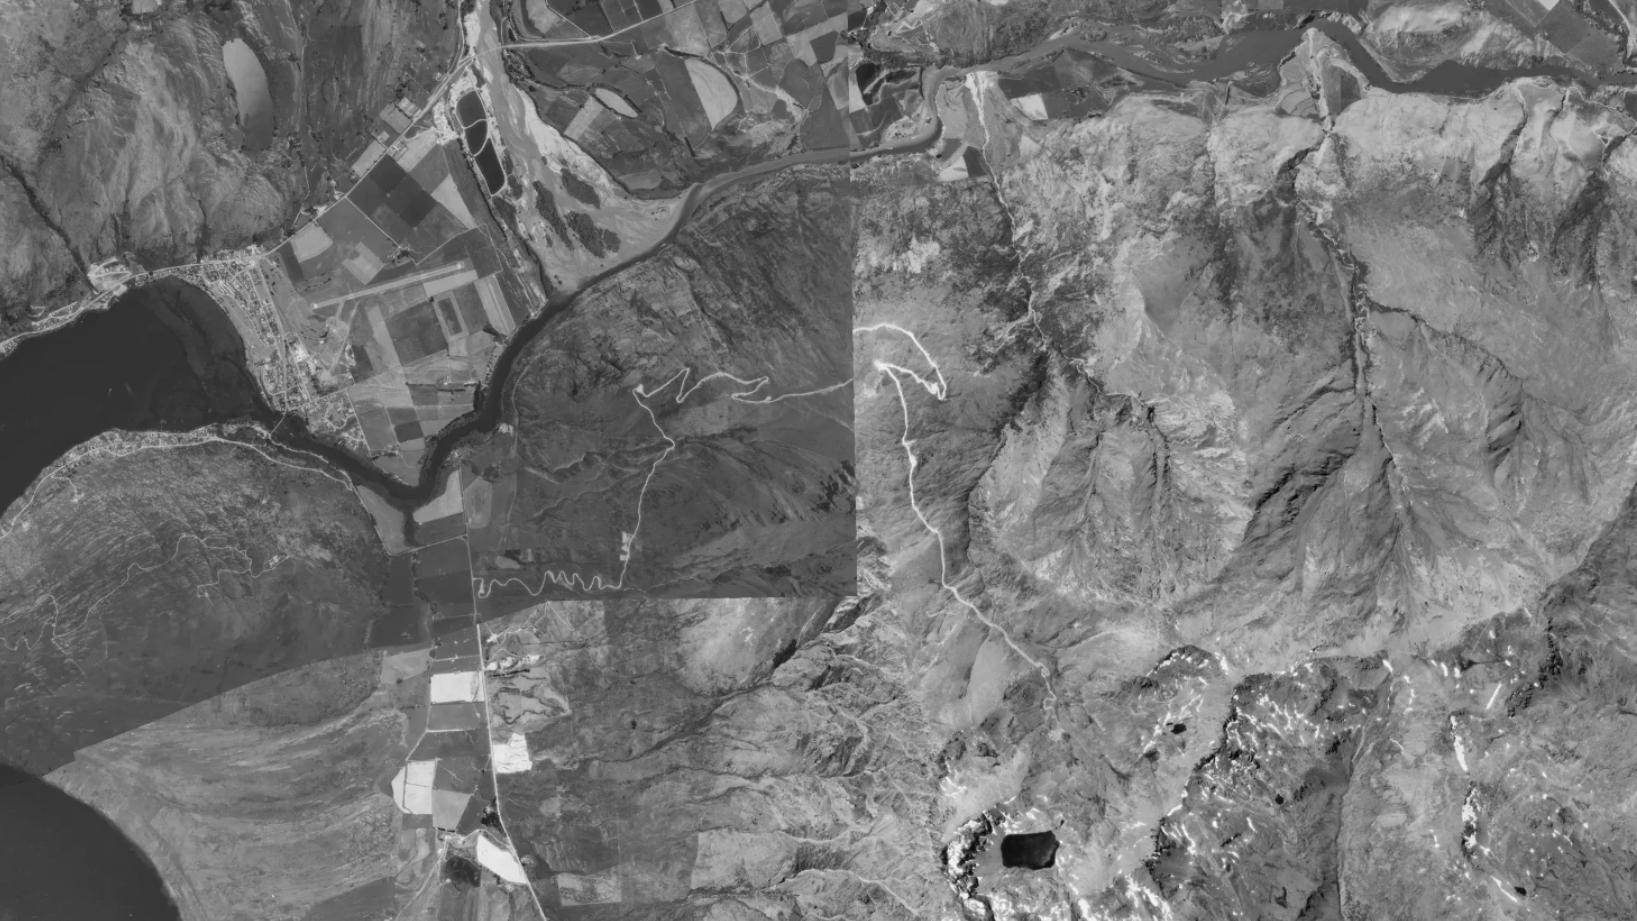
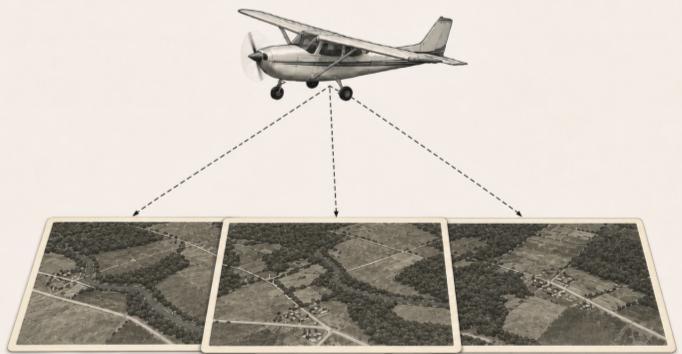
Then 1980s aerial photos with national coverage…

… Led to development of NZTopo 1:50,000 we use today



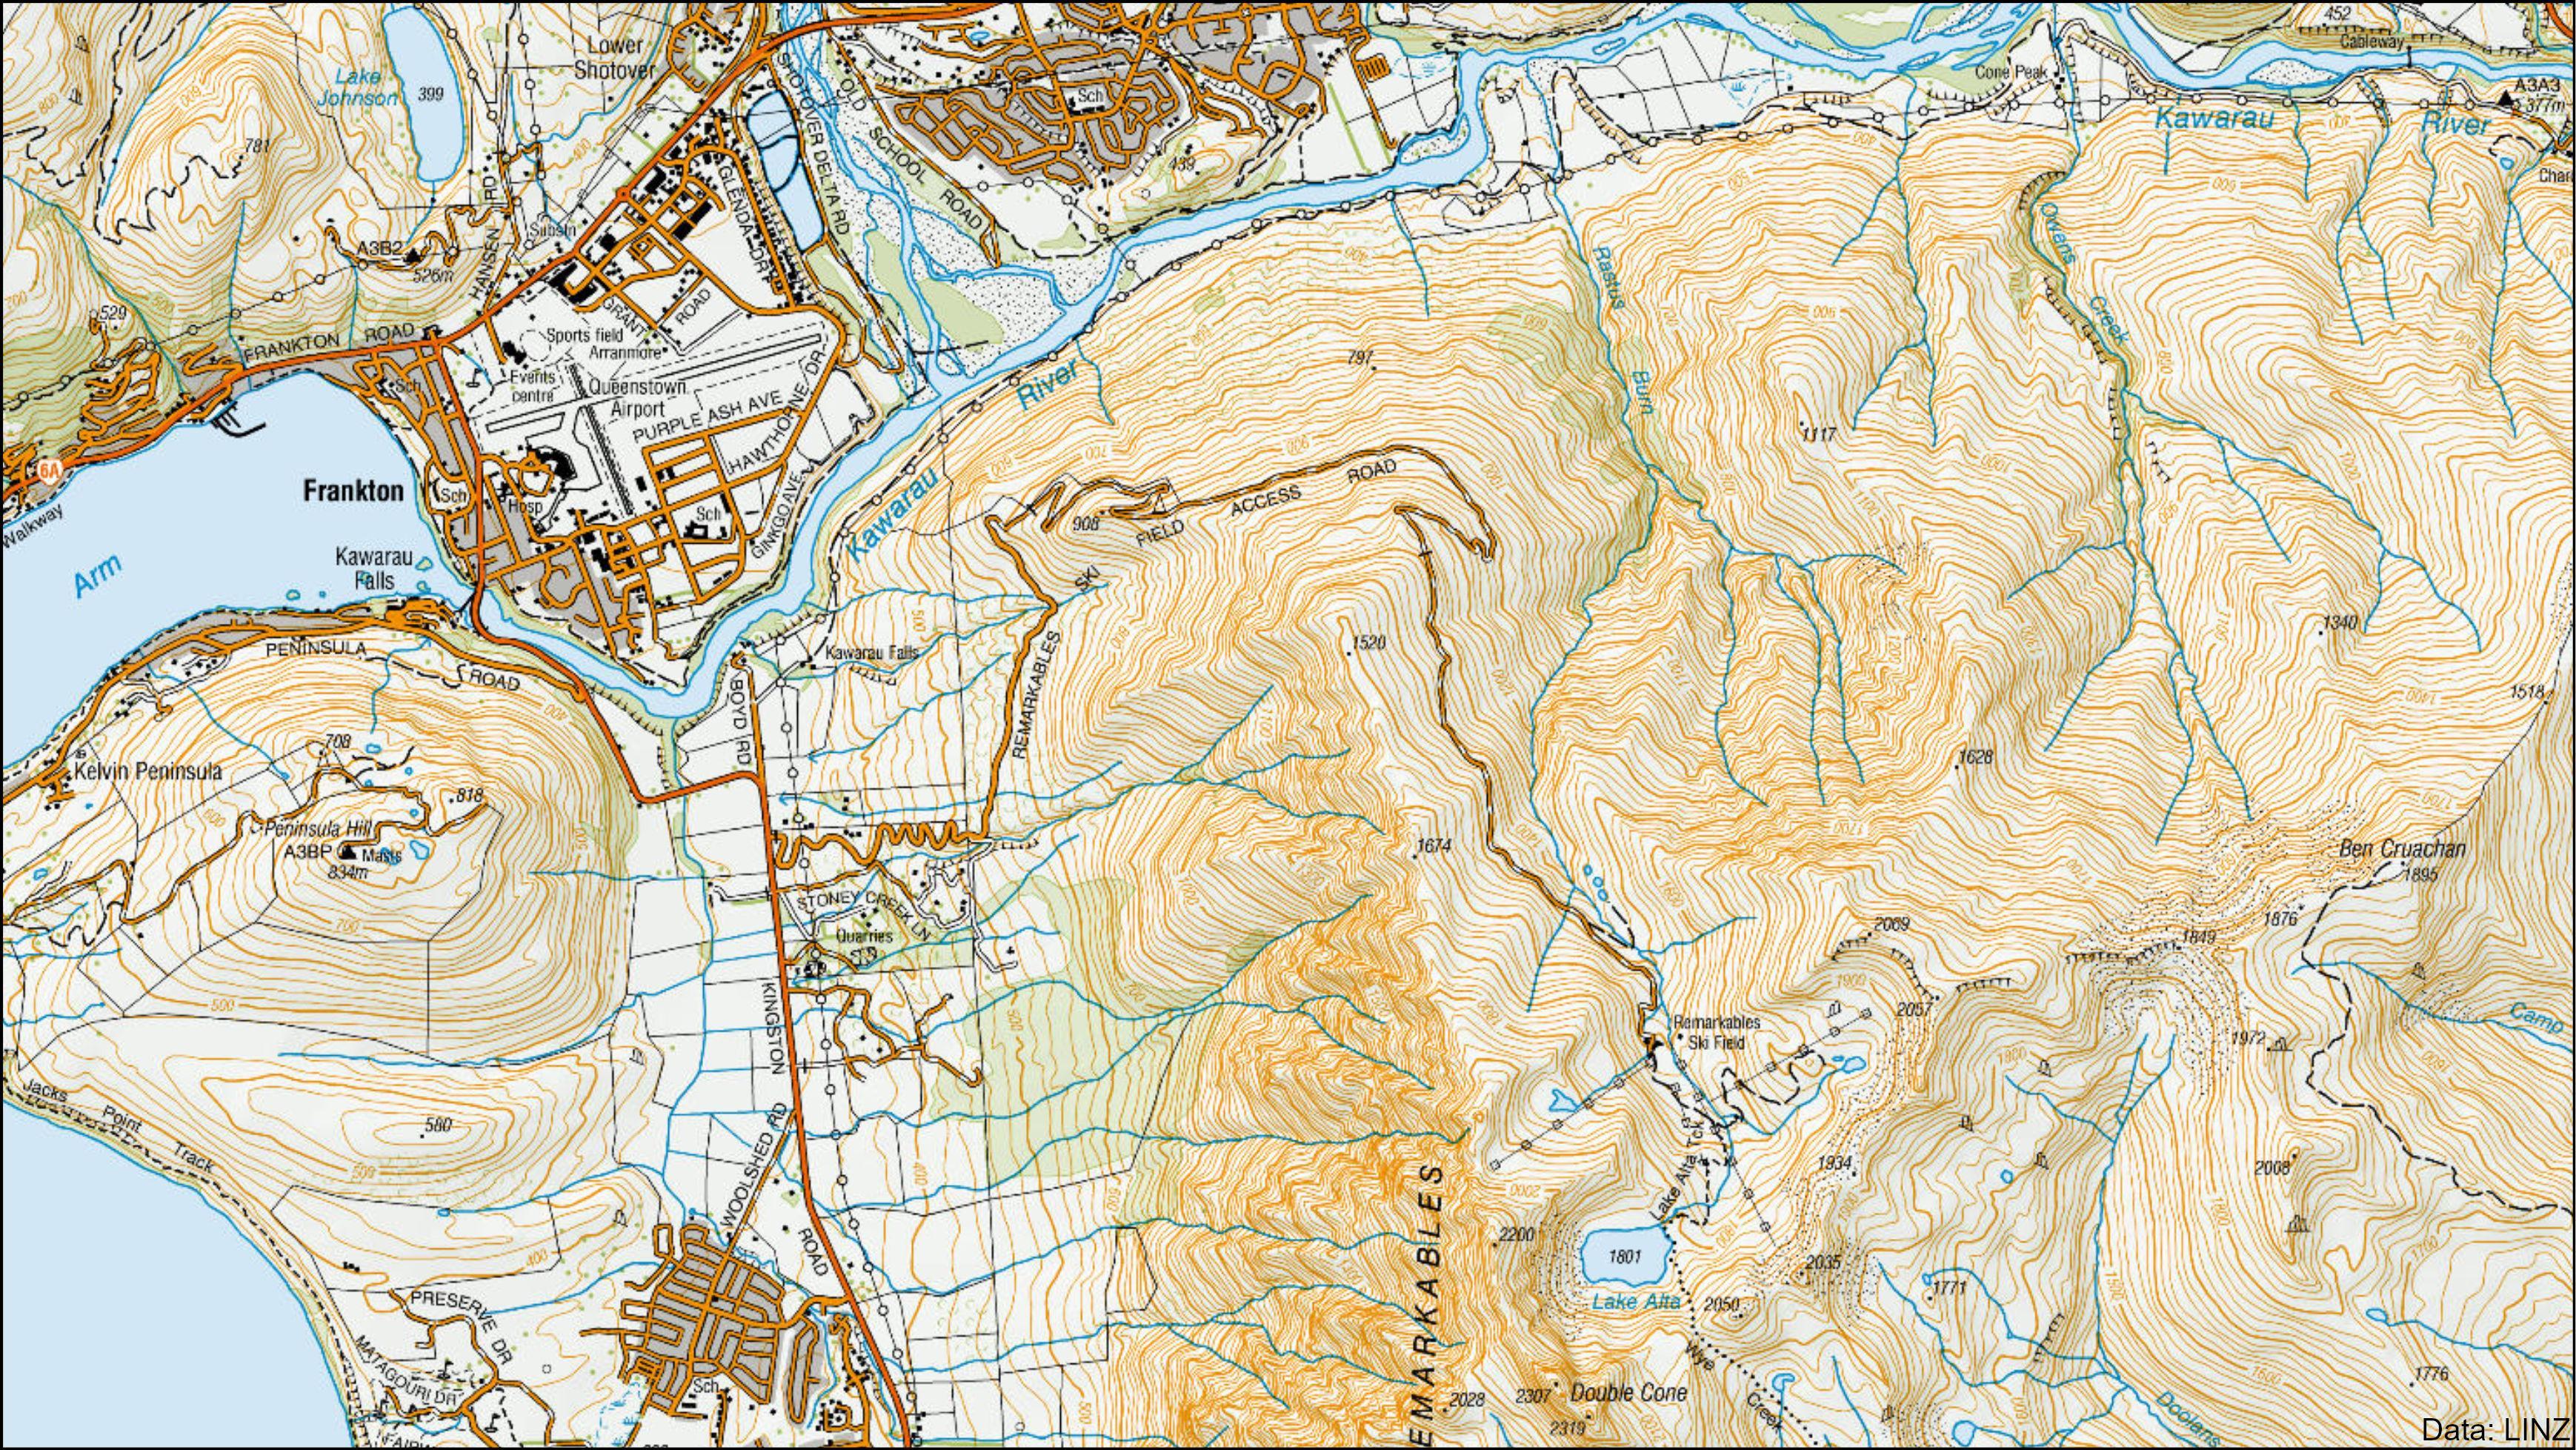
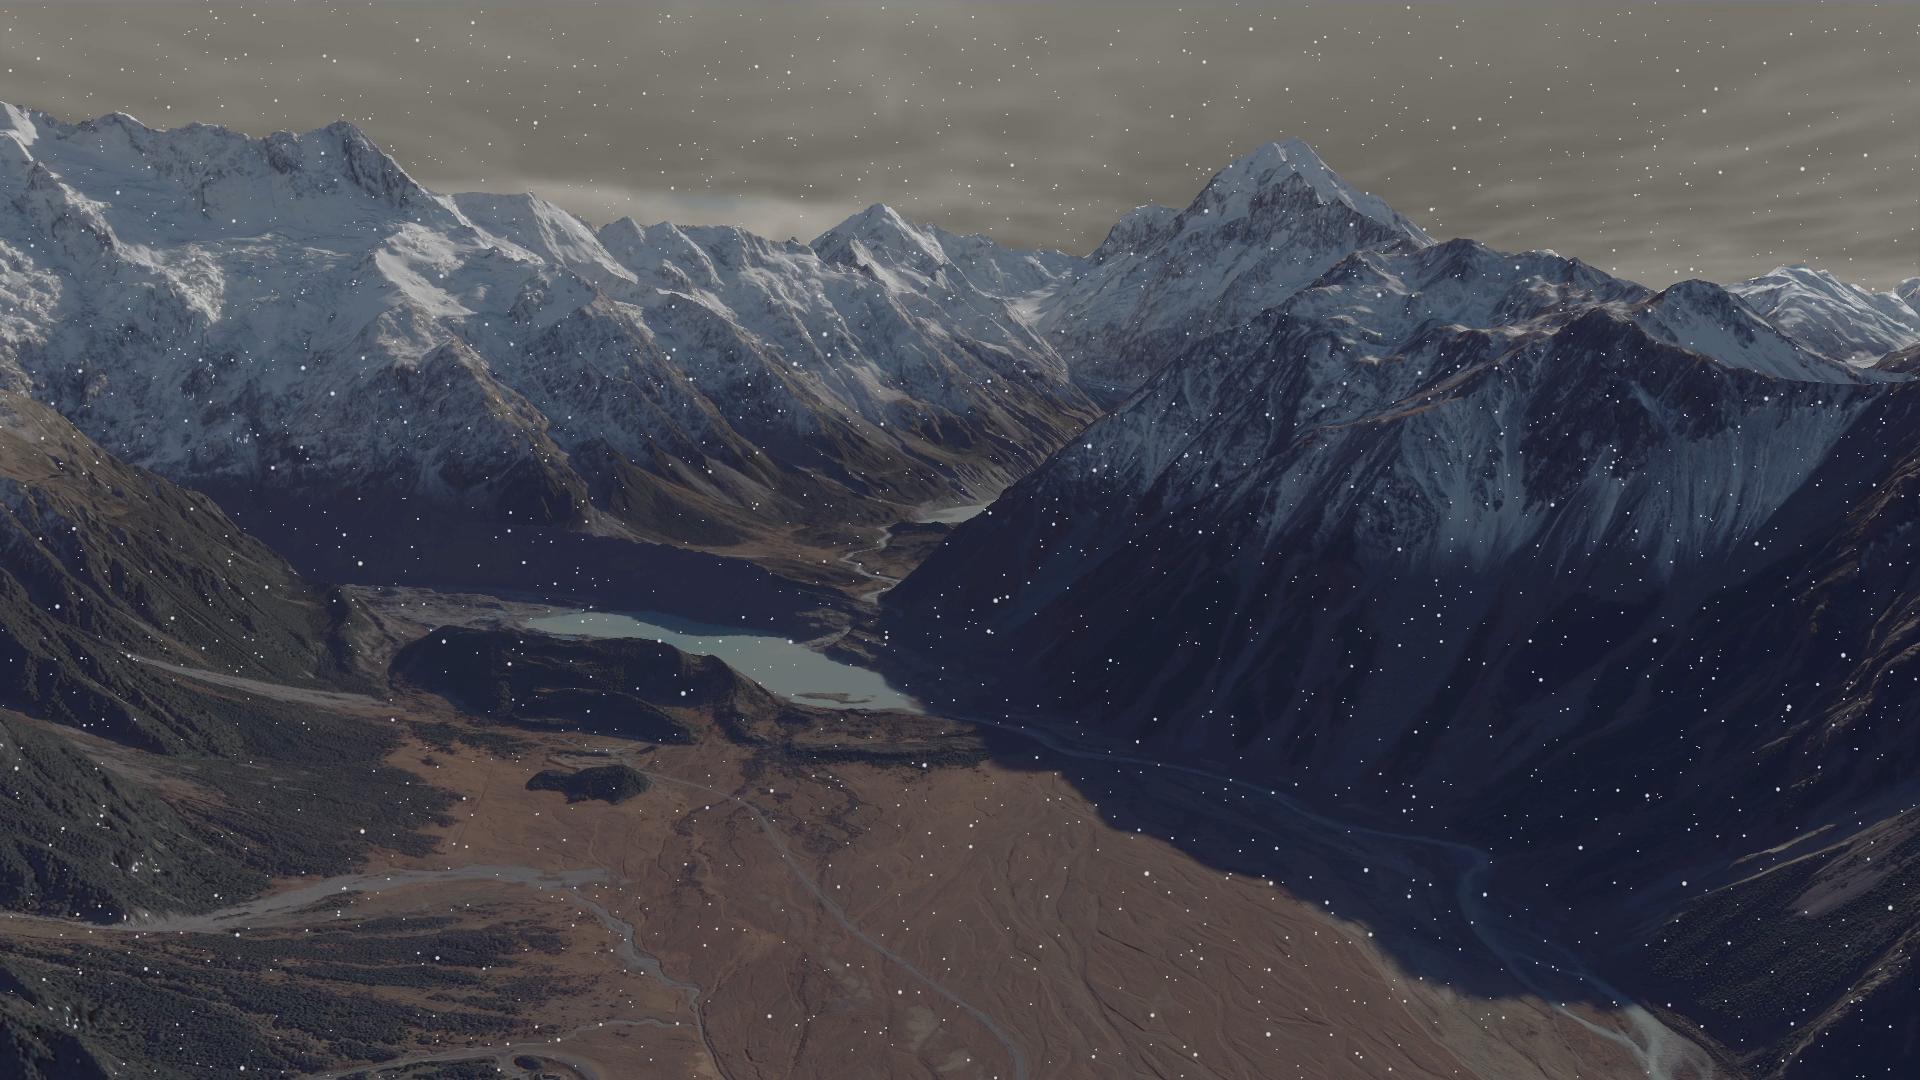
Then, the arrival of global DEM from SRTM in 2000. Here a 30m pixel size

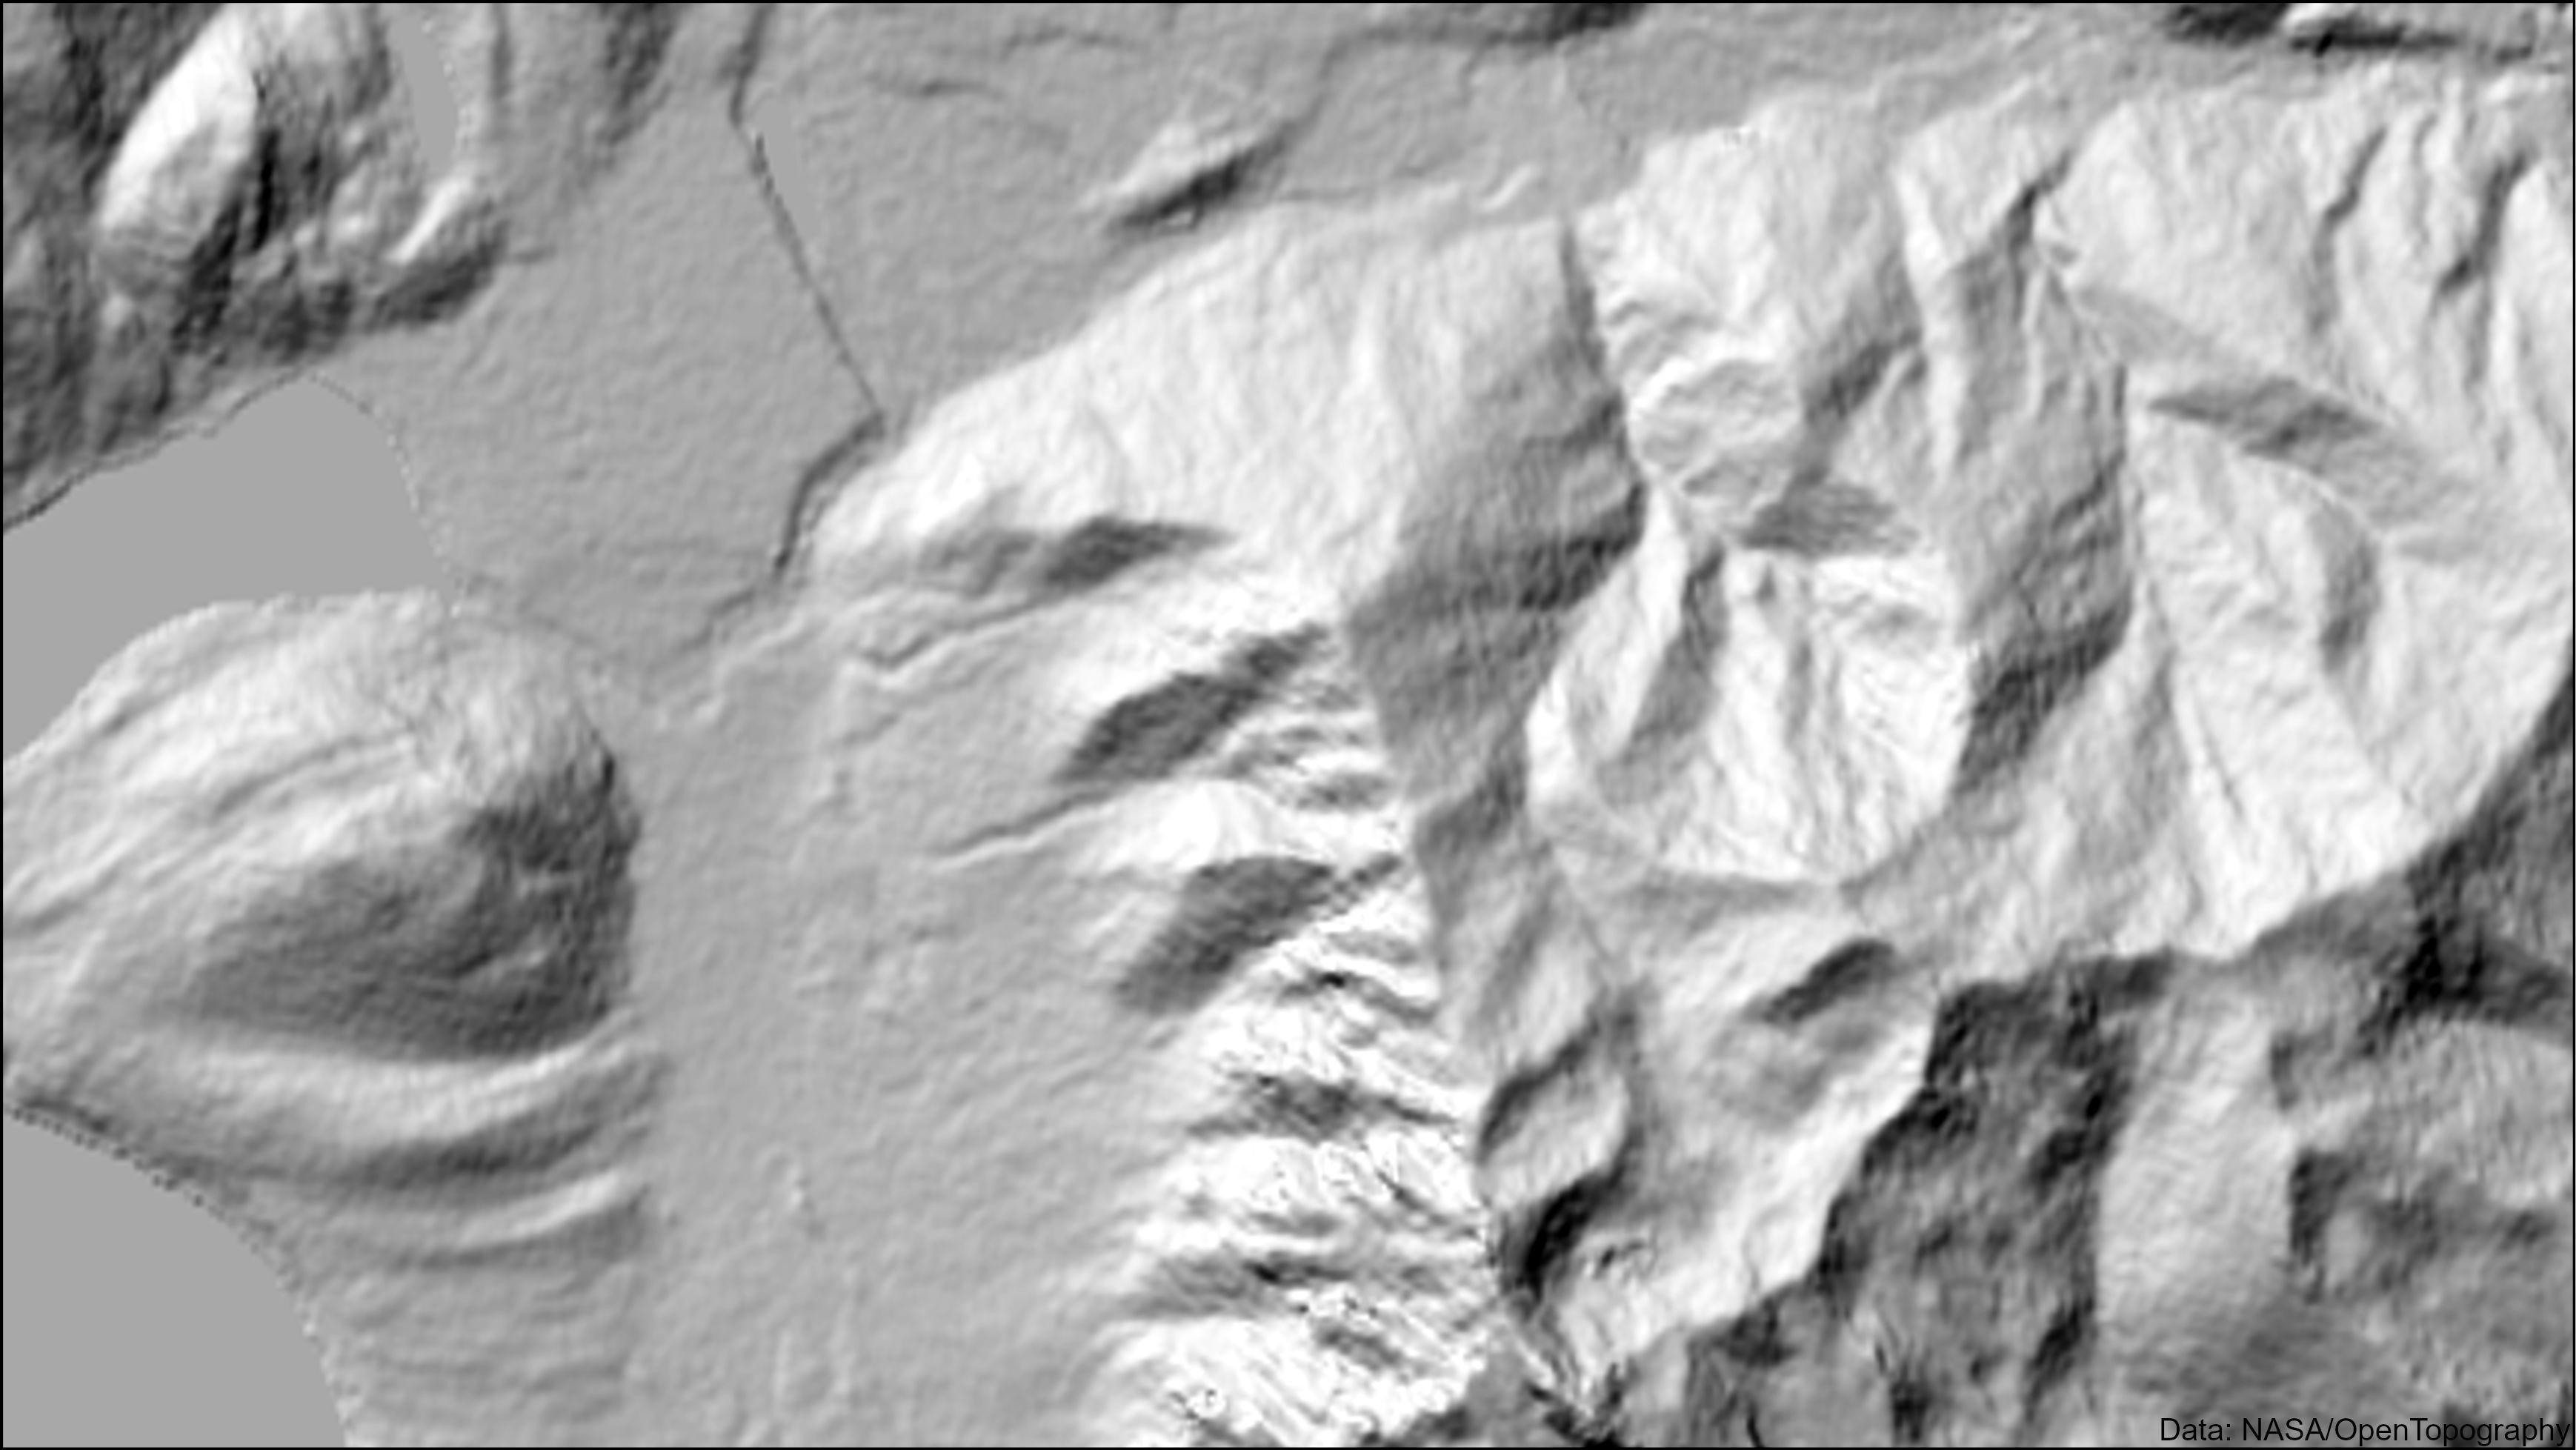
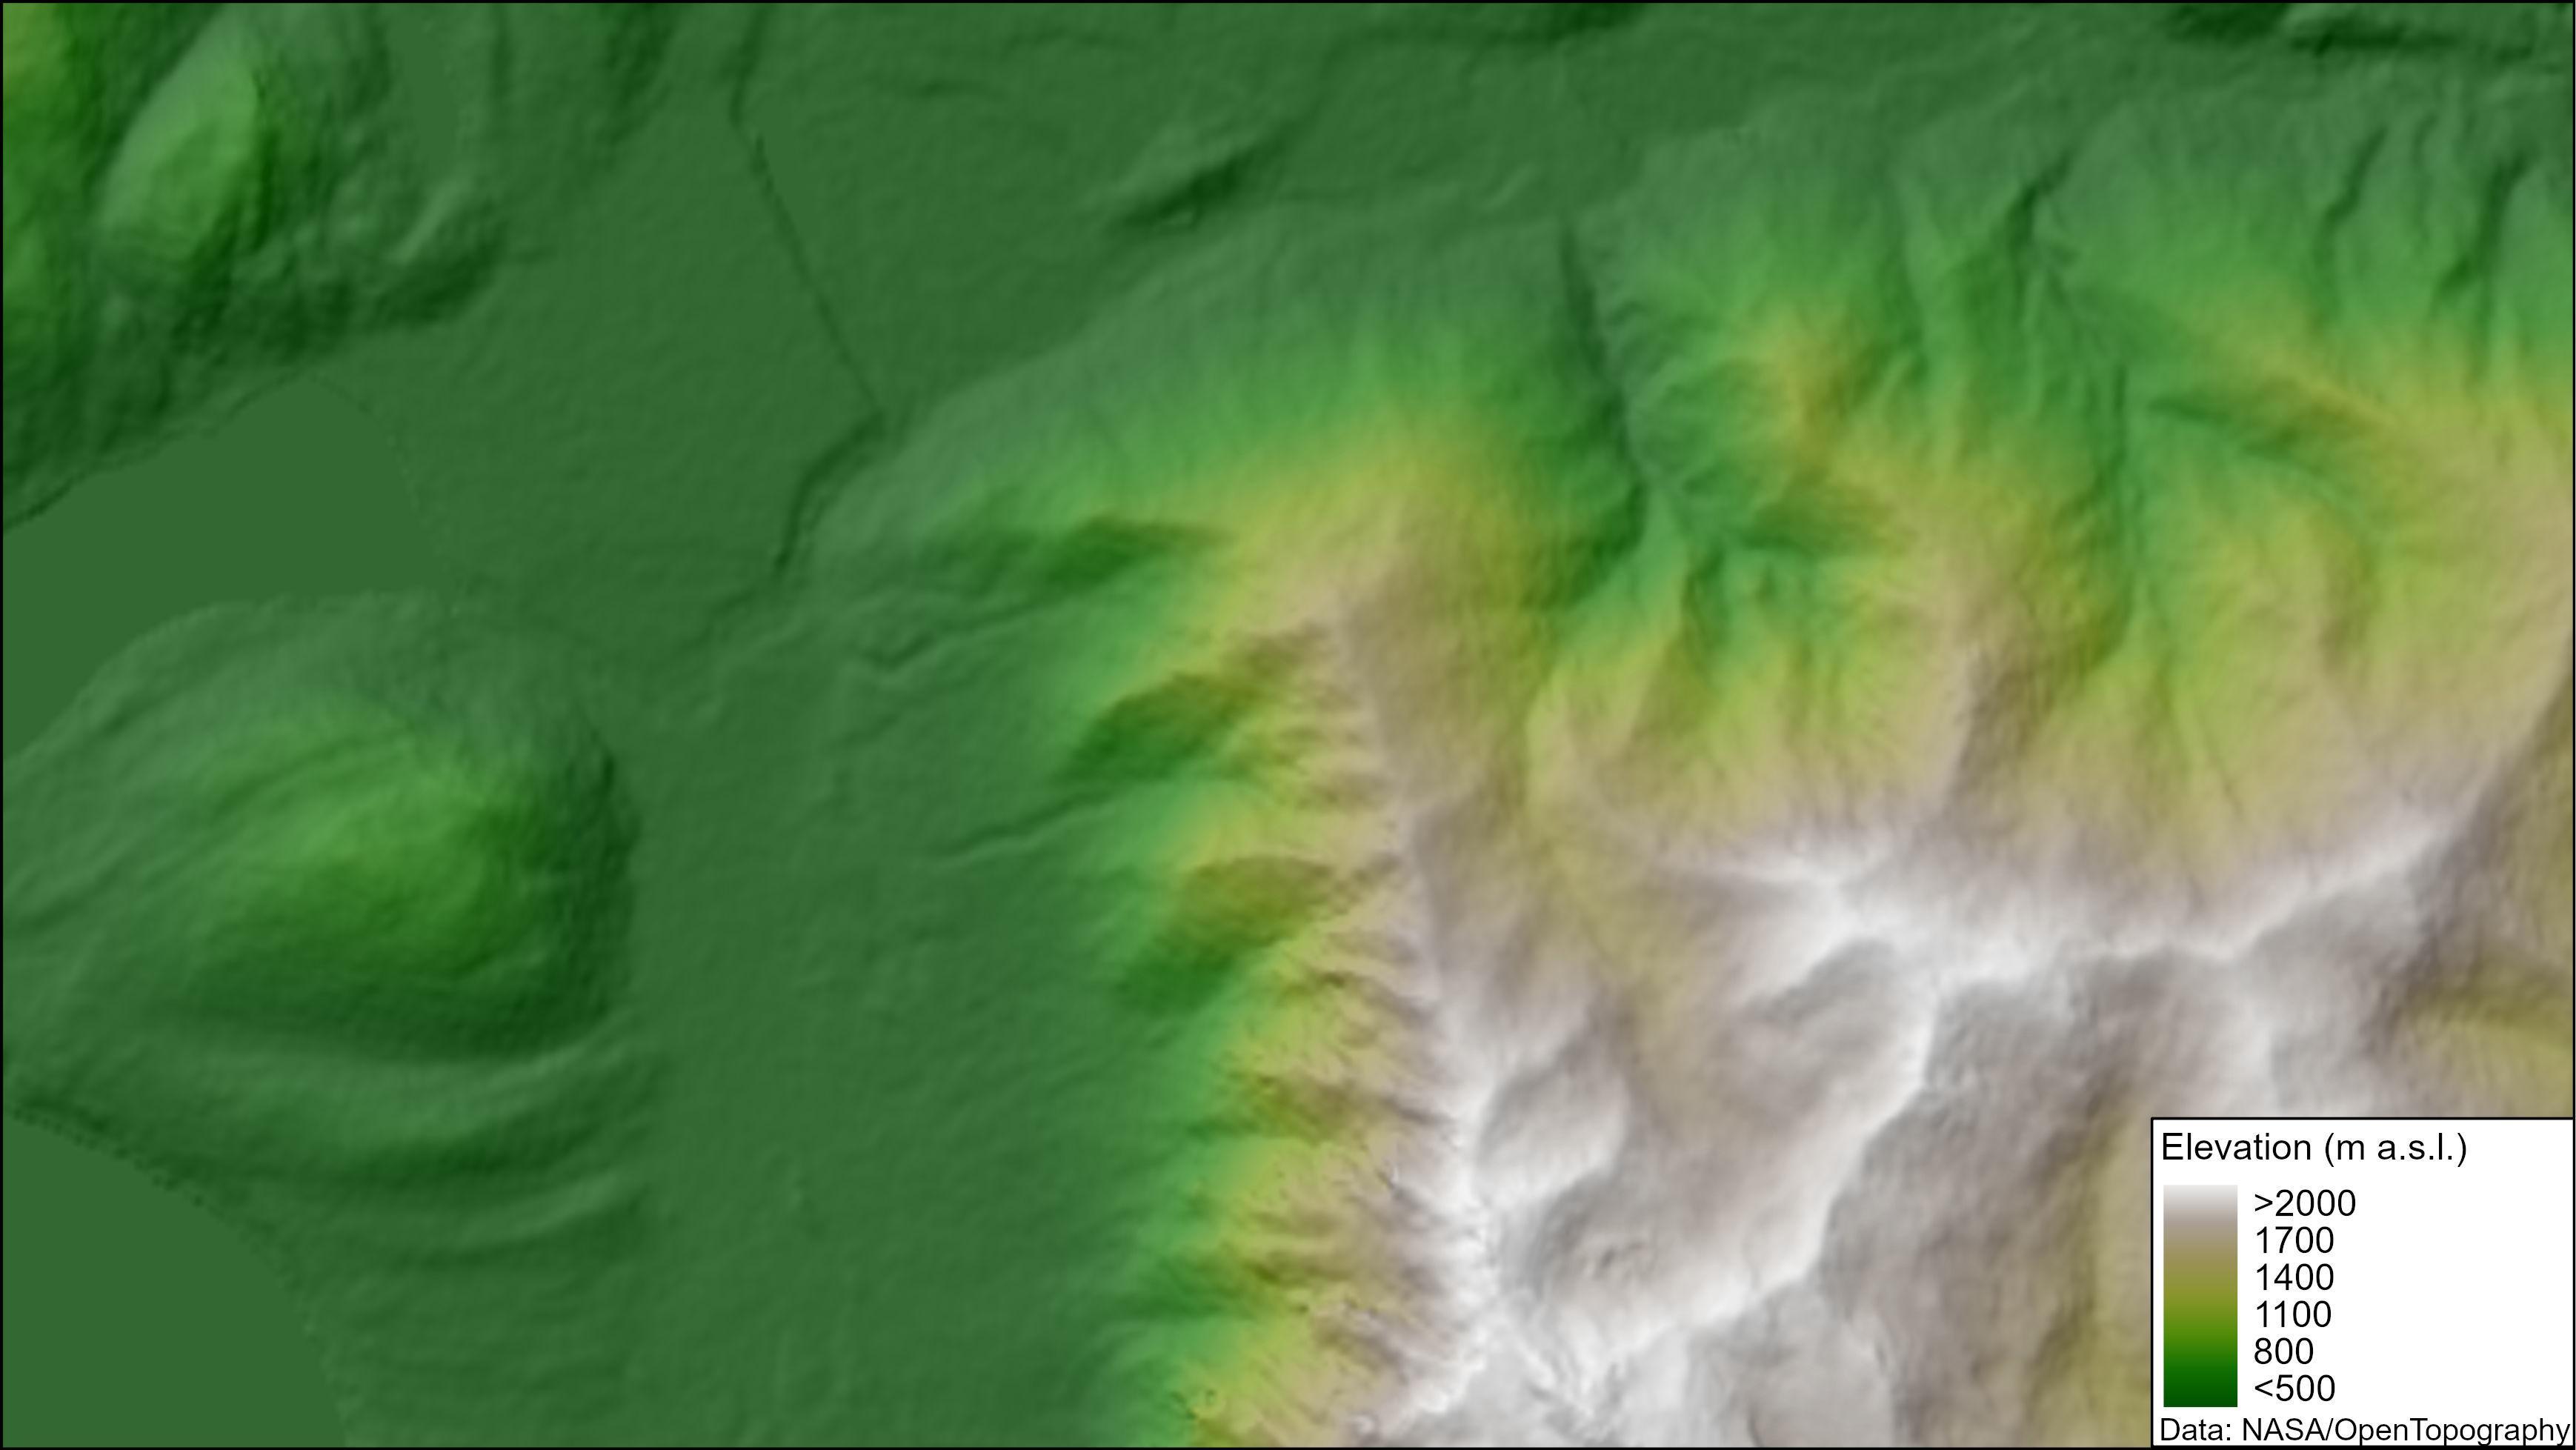
We can display elevation values everywhere instead of only where we have contours or height points…

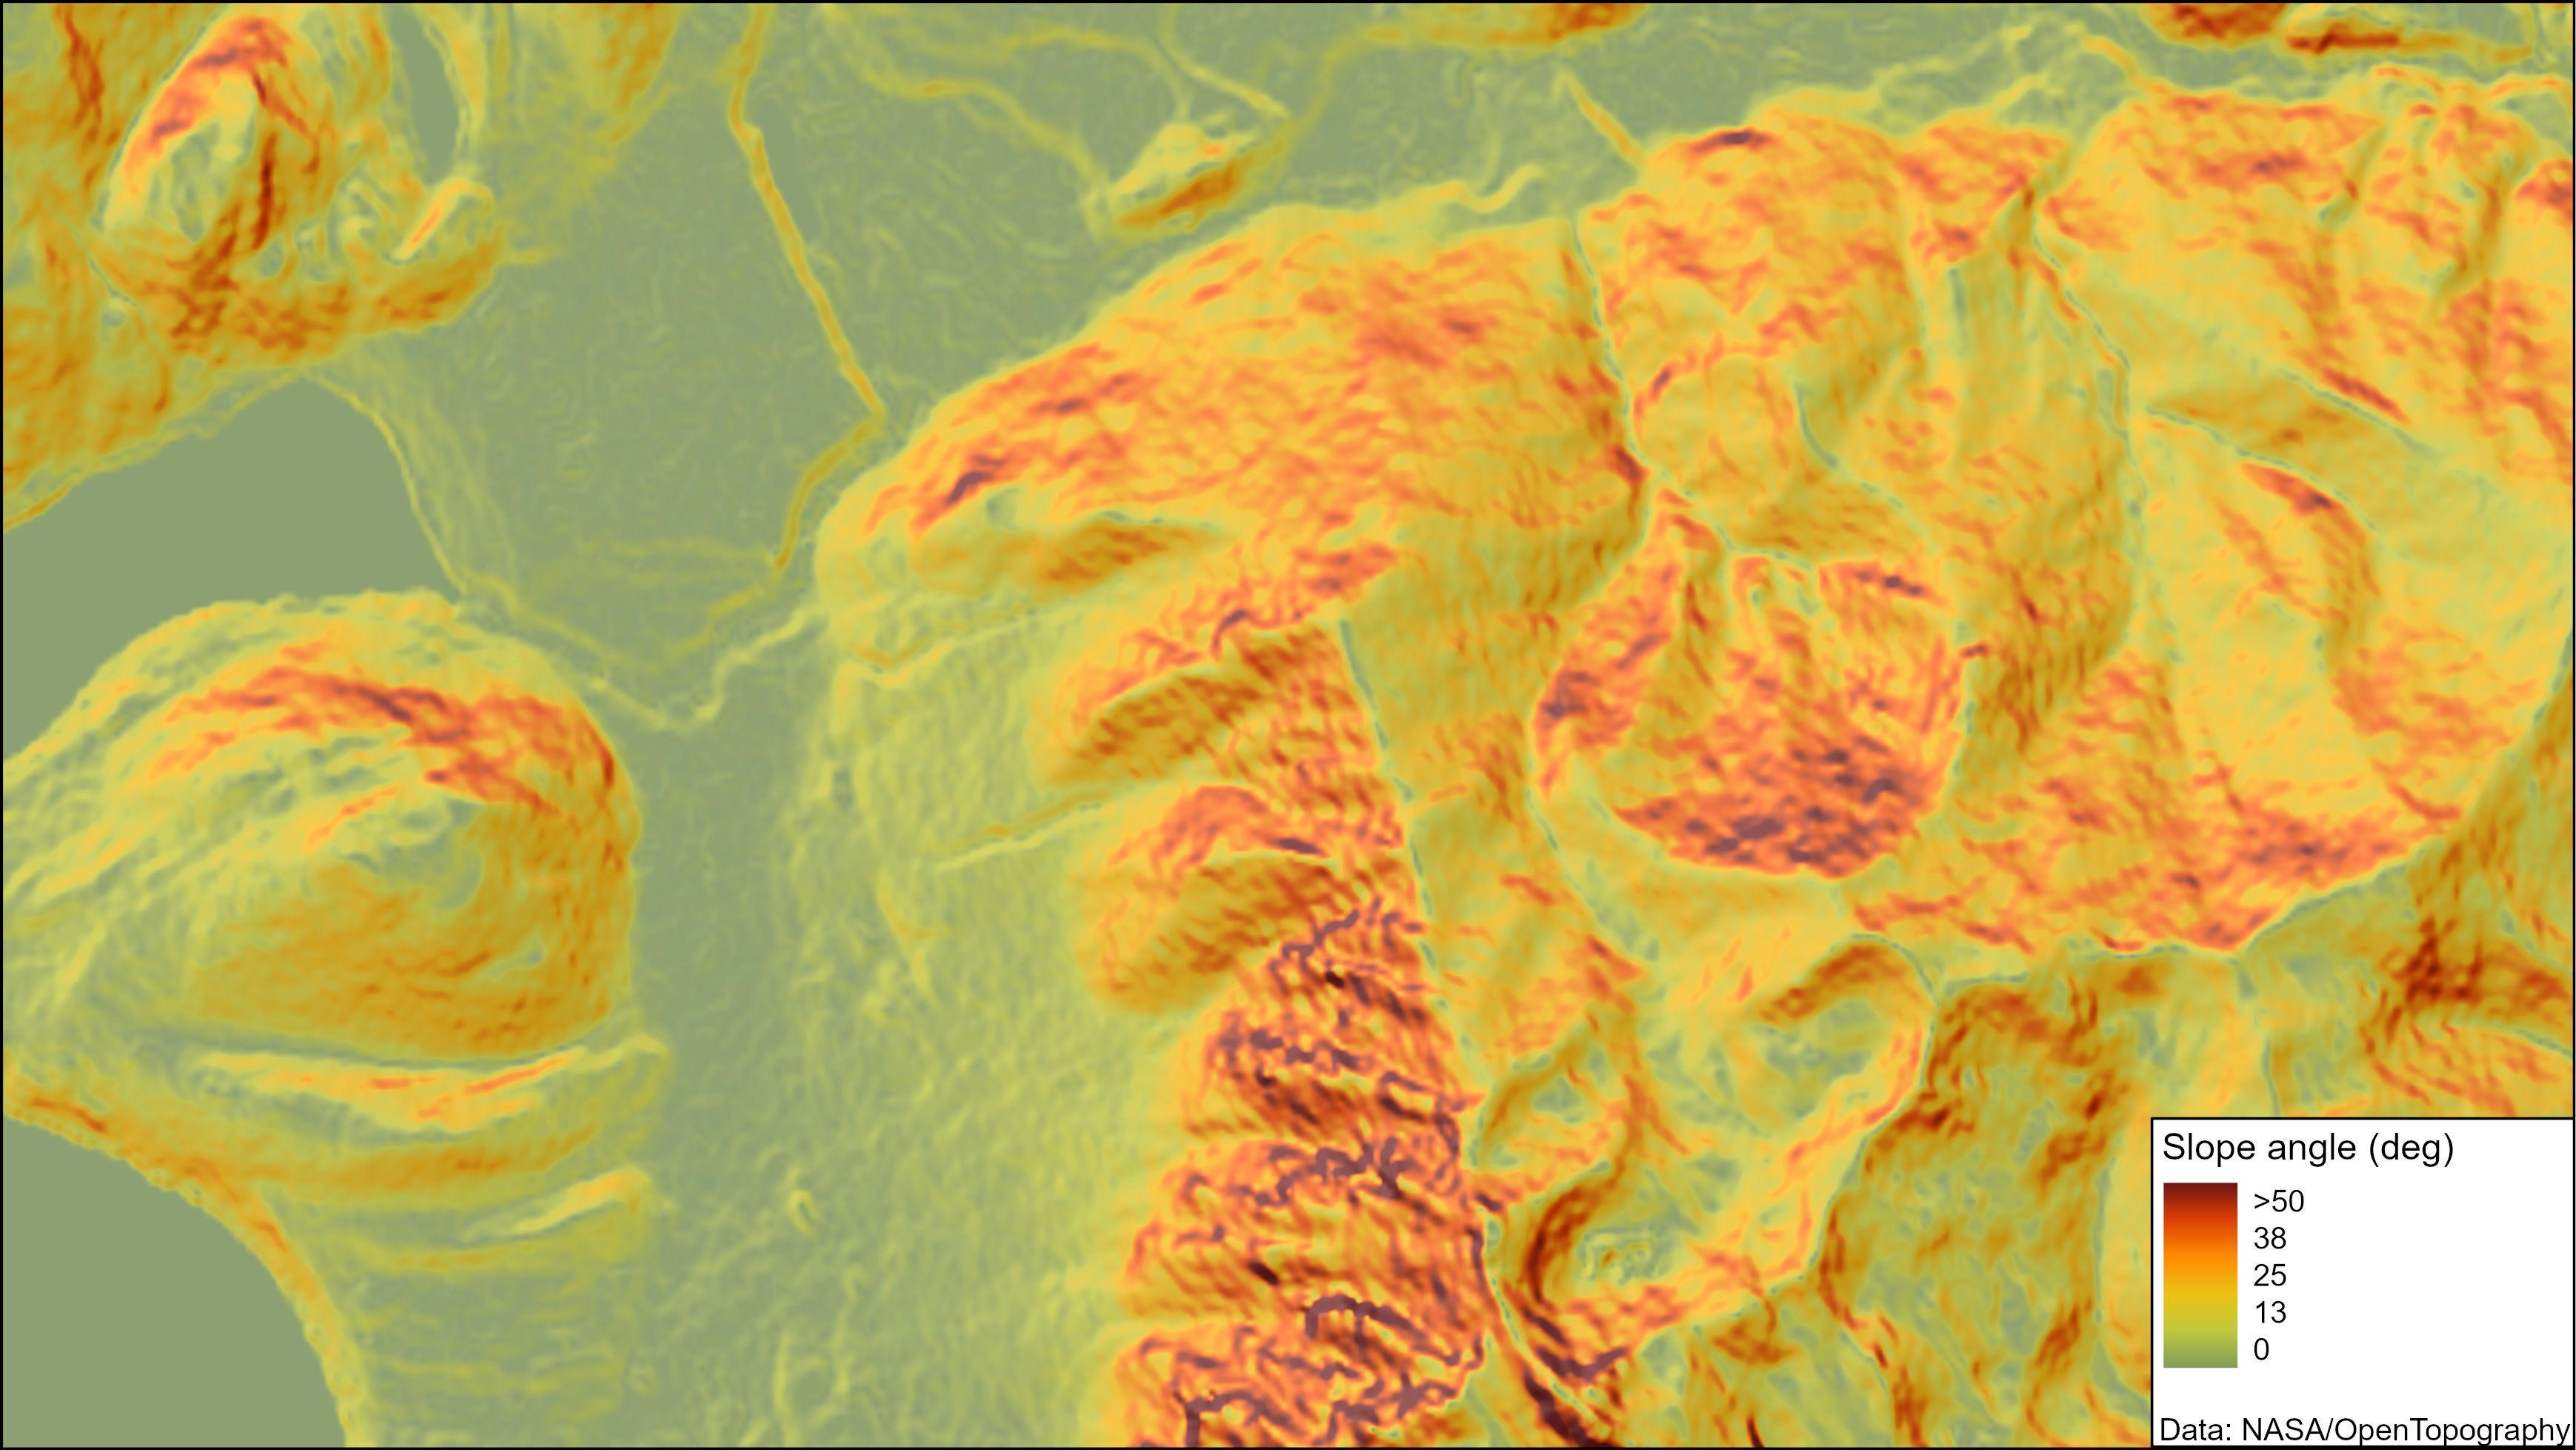
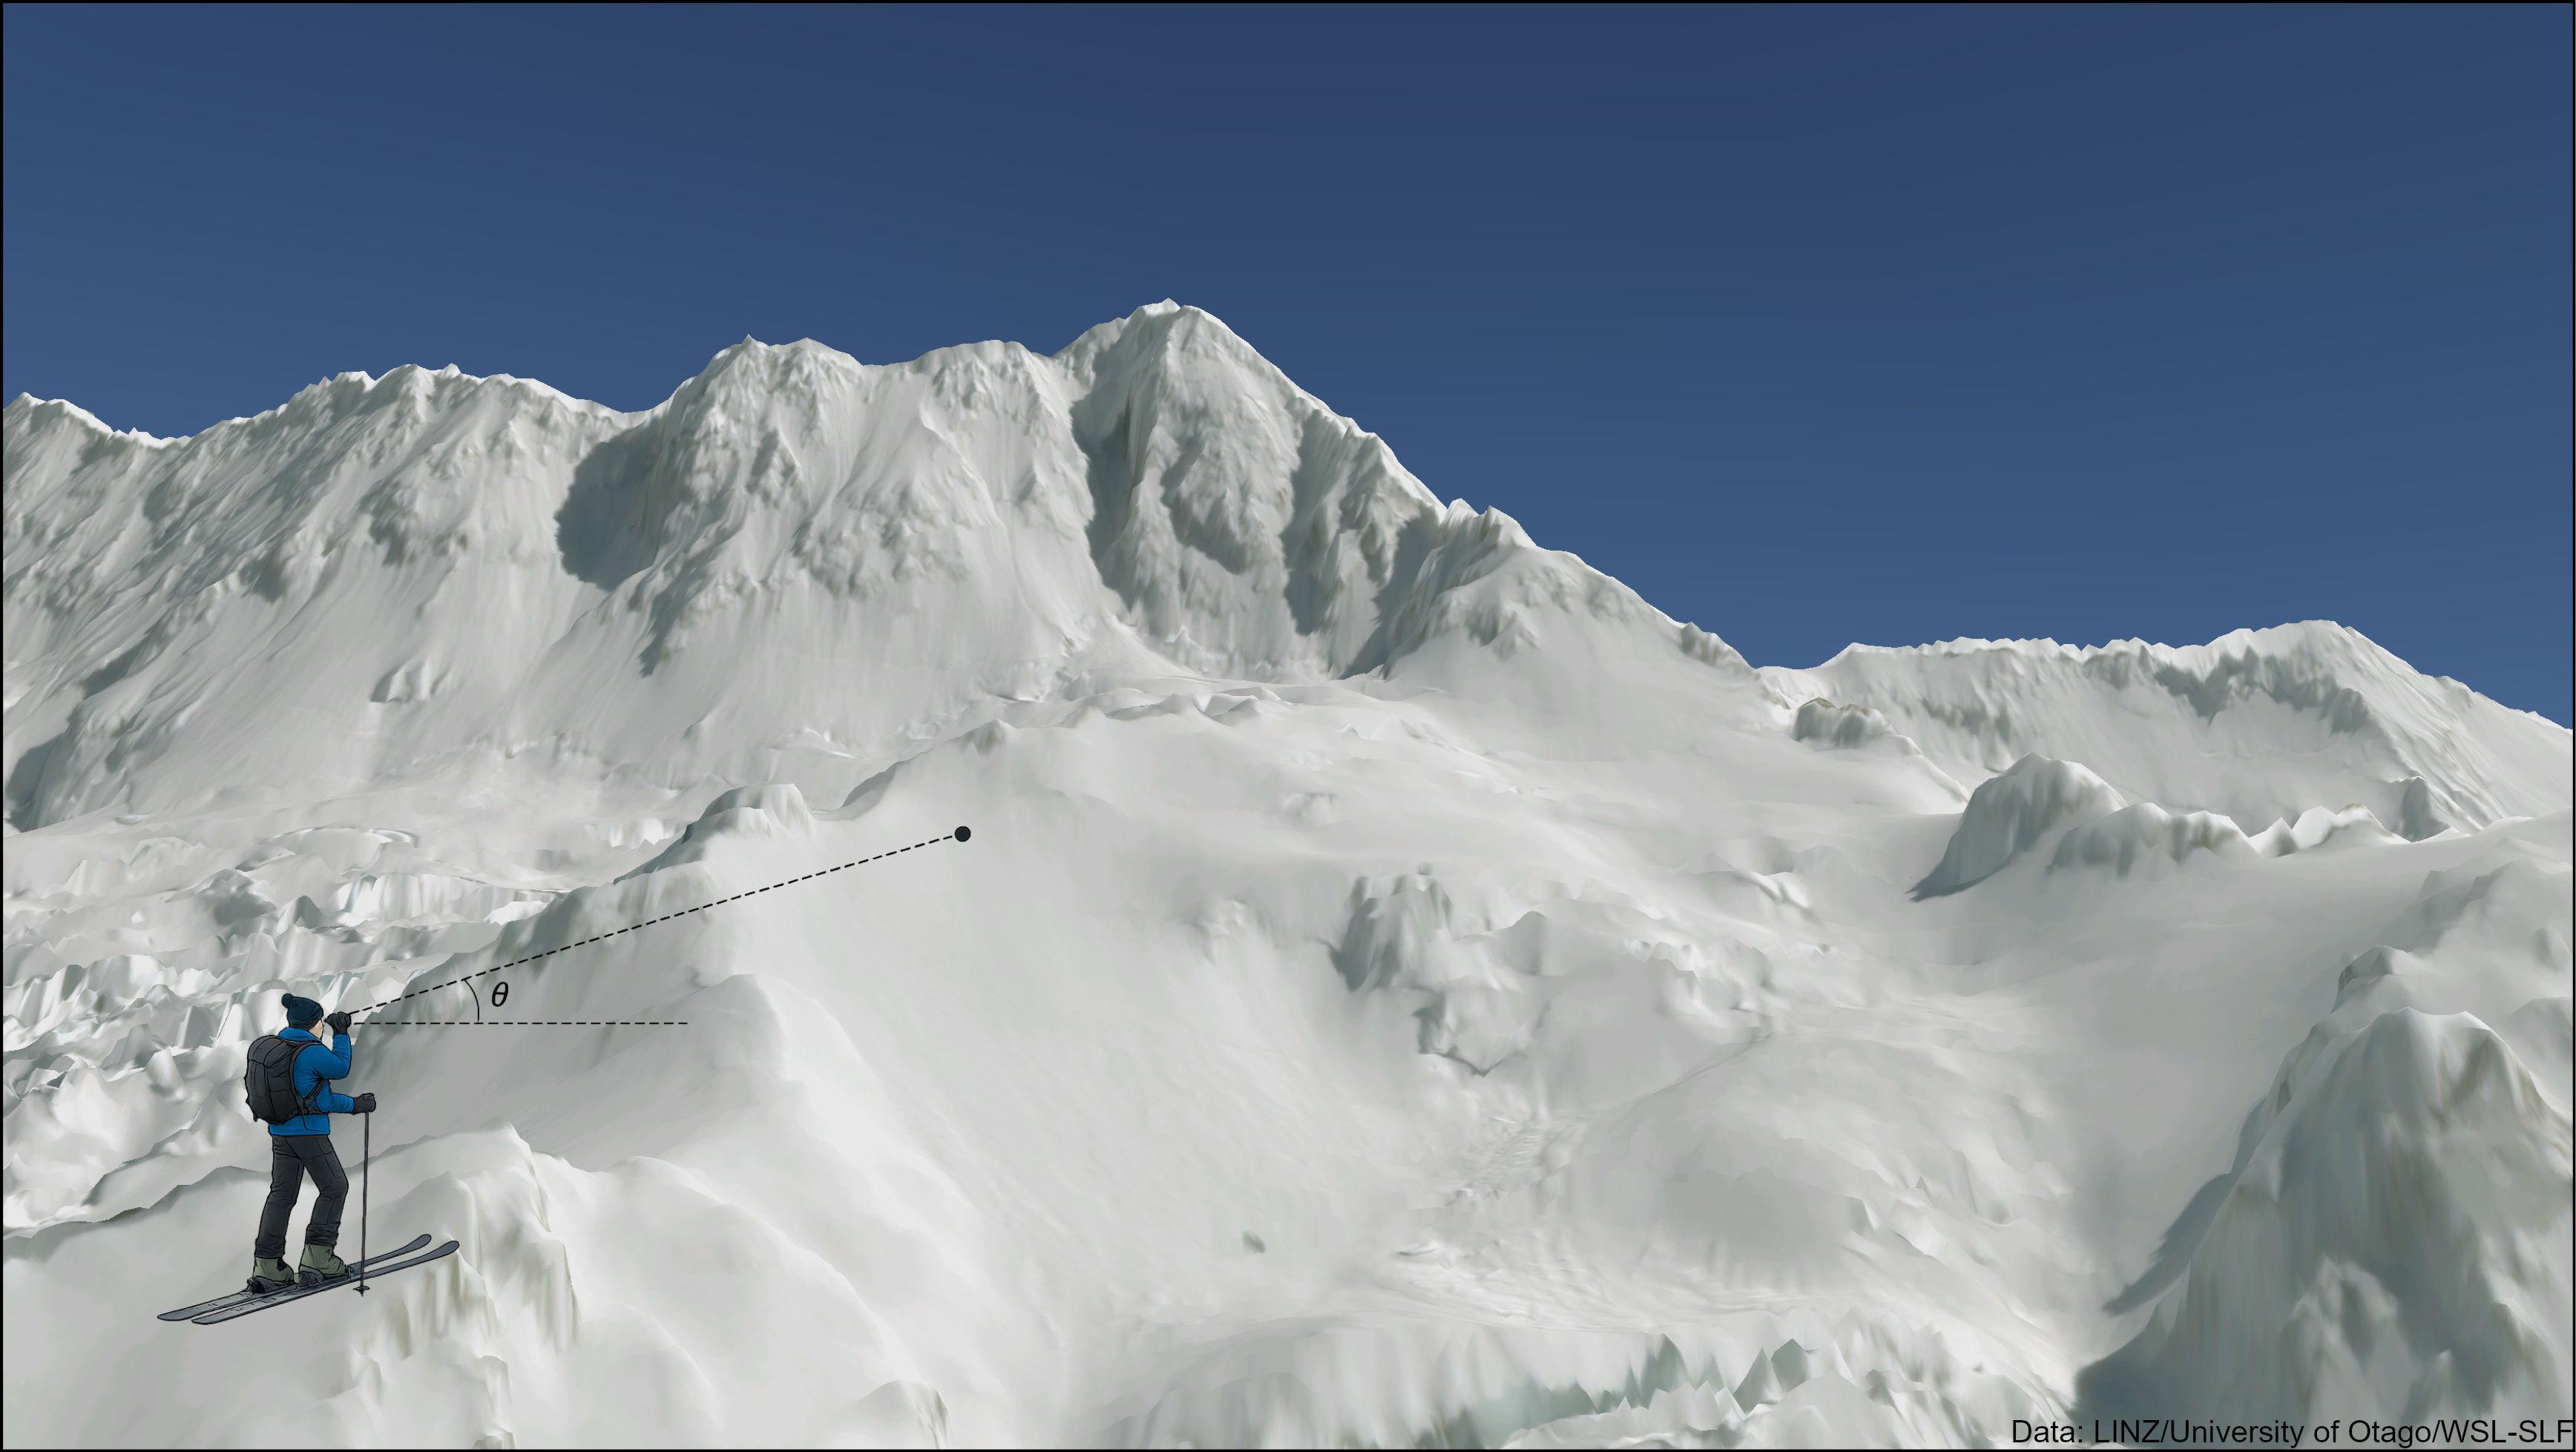
Which means we can present steepness of slope as a map

SRTM 30m pixel size again
Arrival of aerial lidar 1m pixel size here

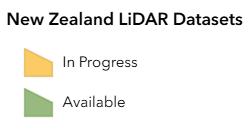
Unfortunately, coverage is incomplete
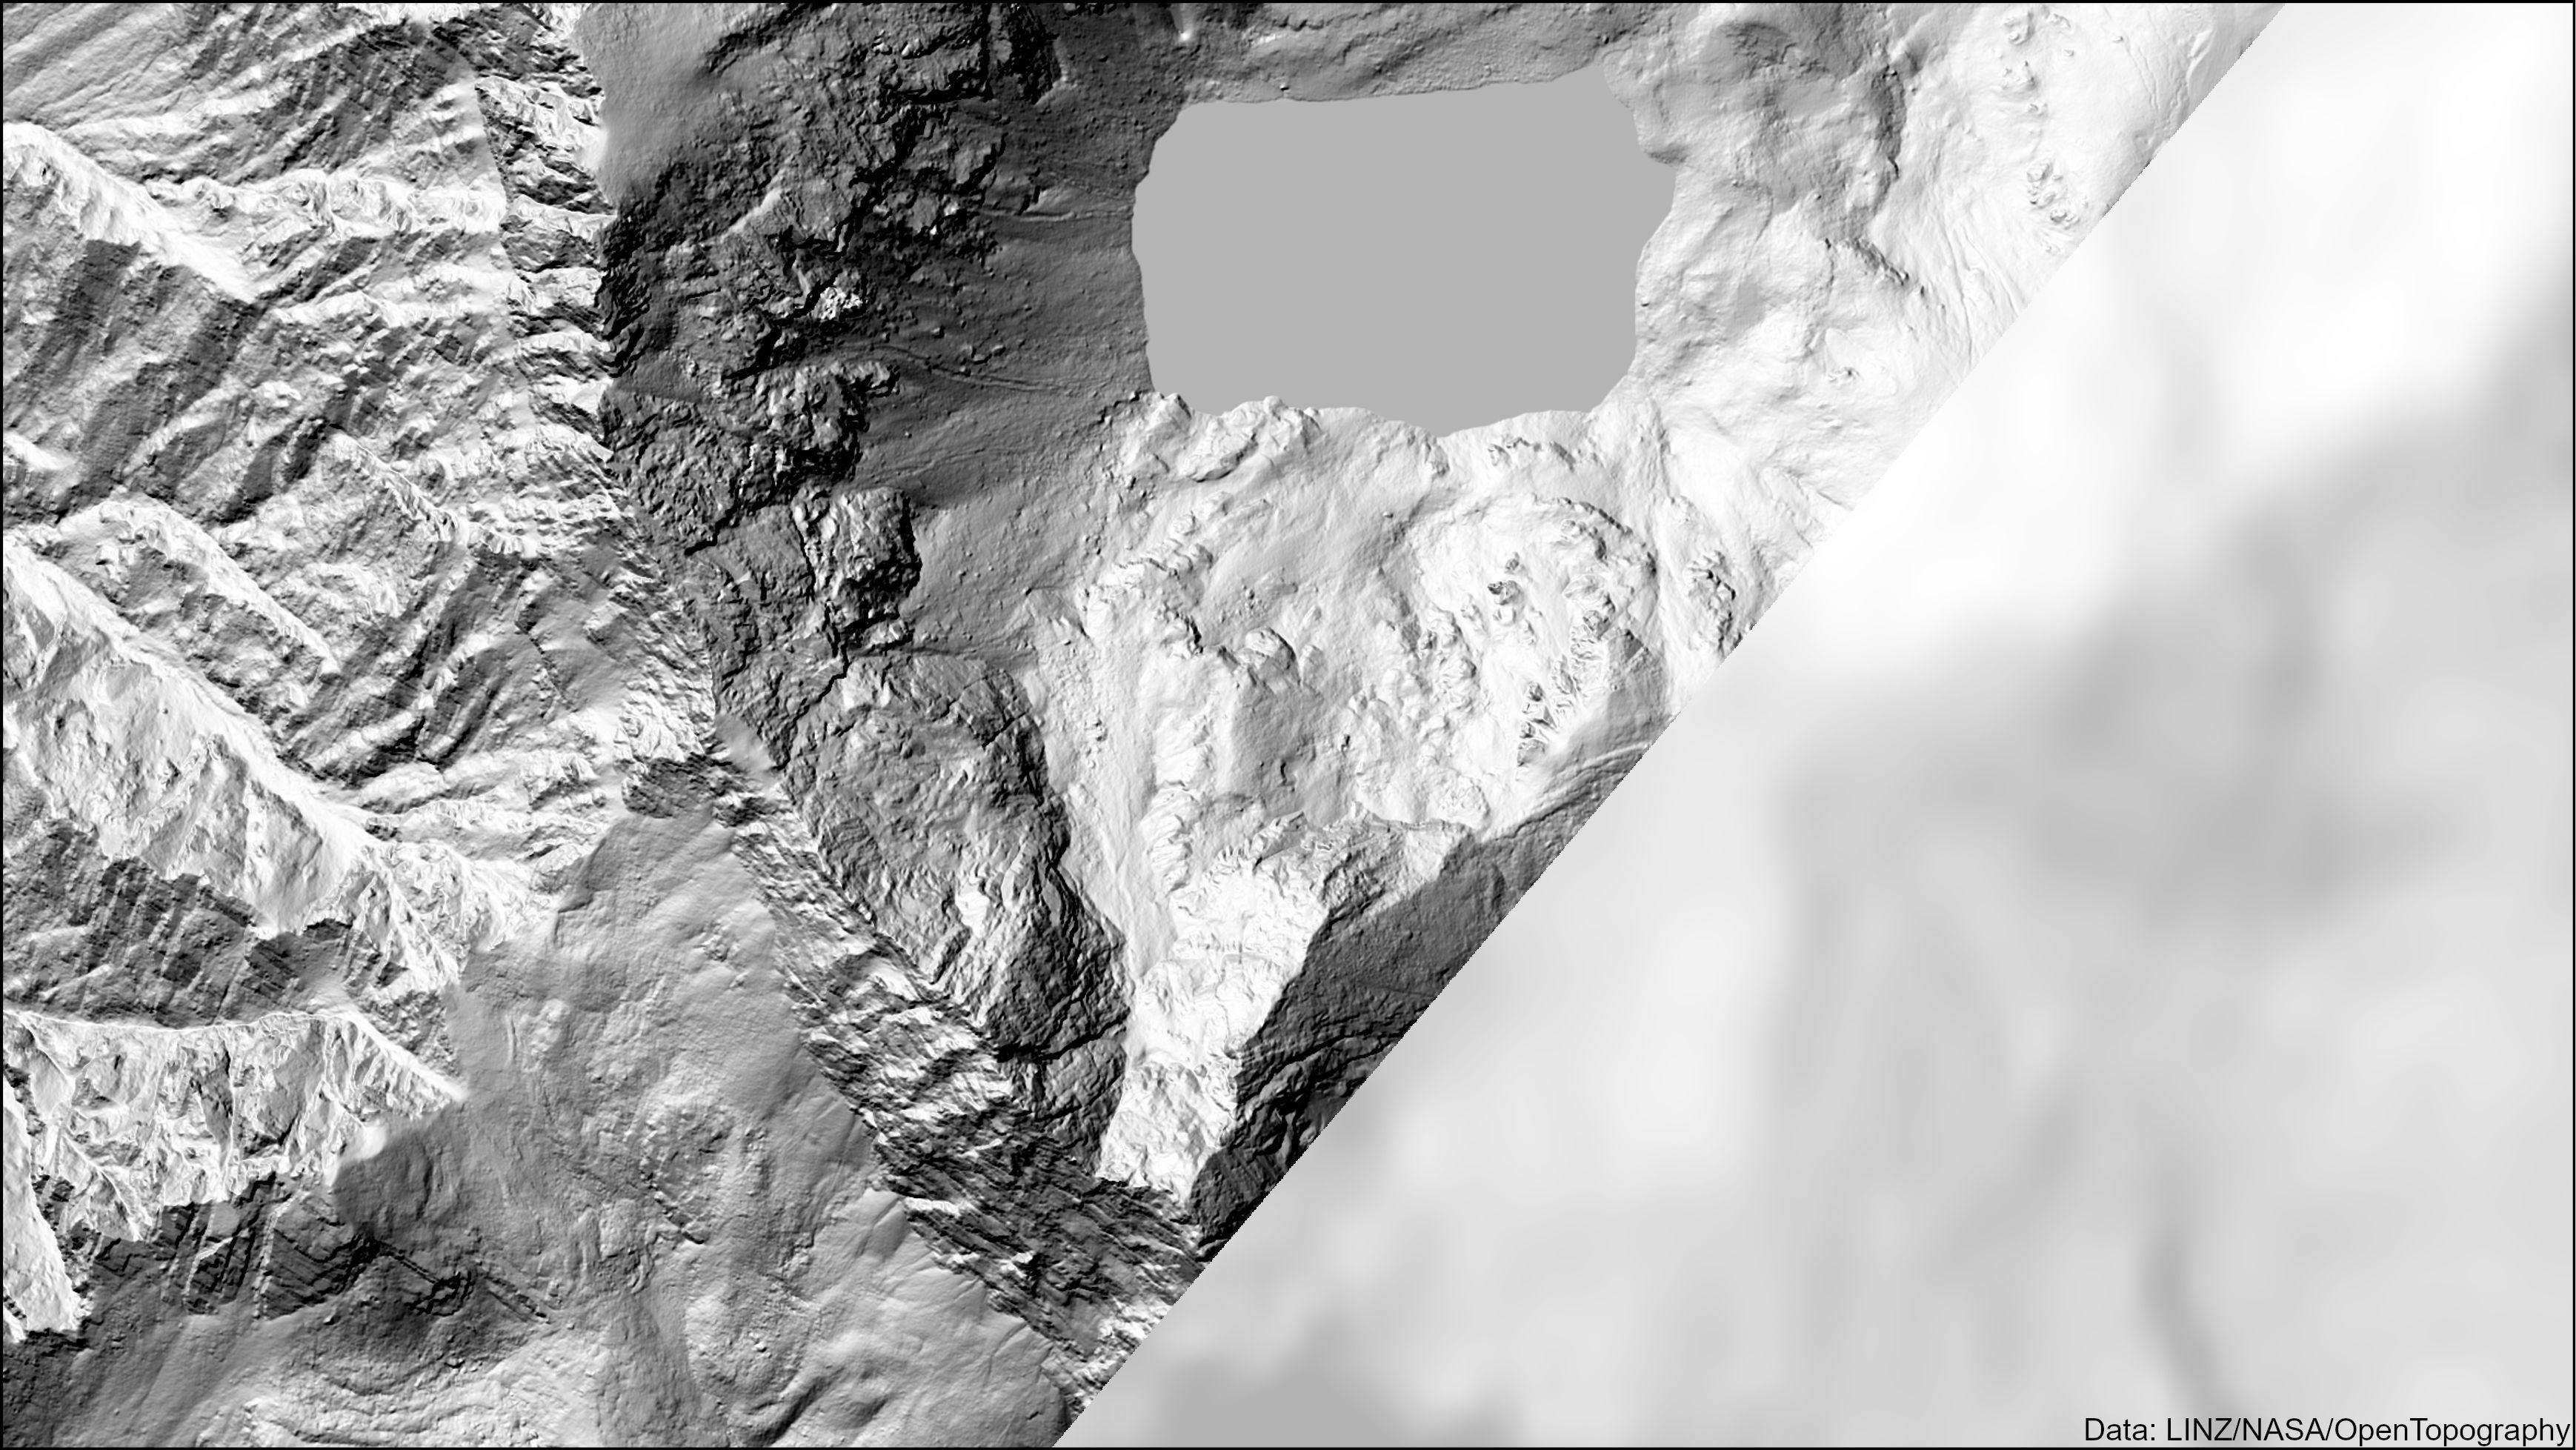
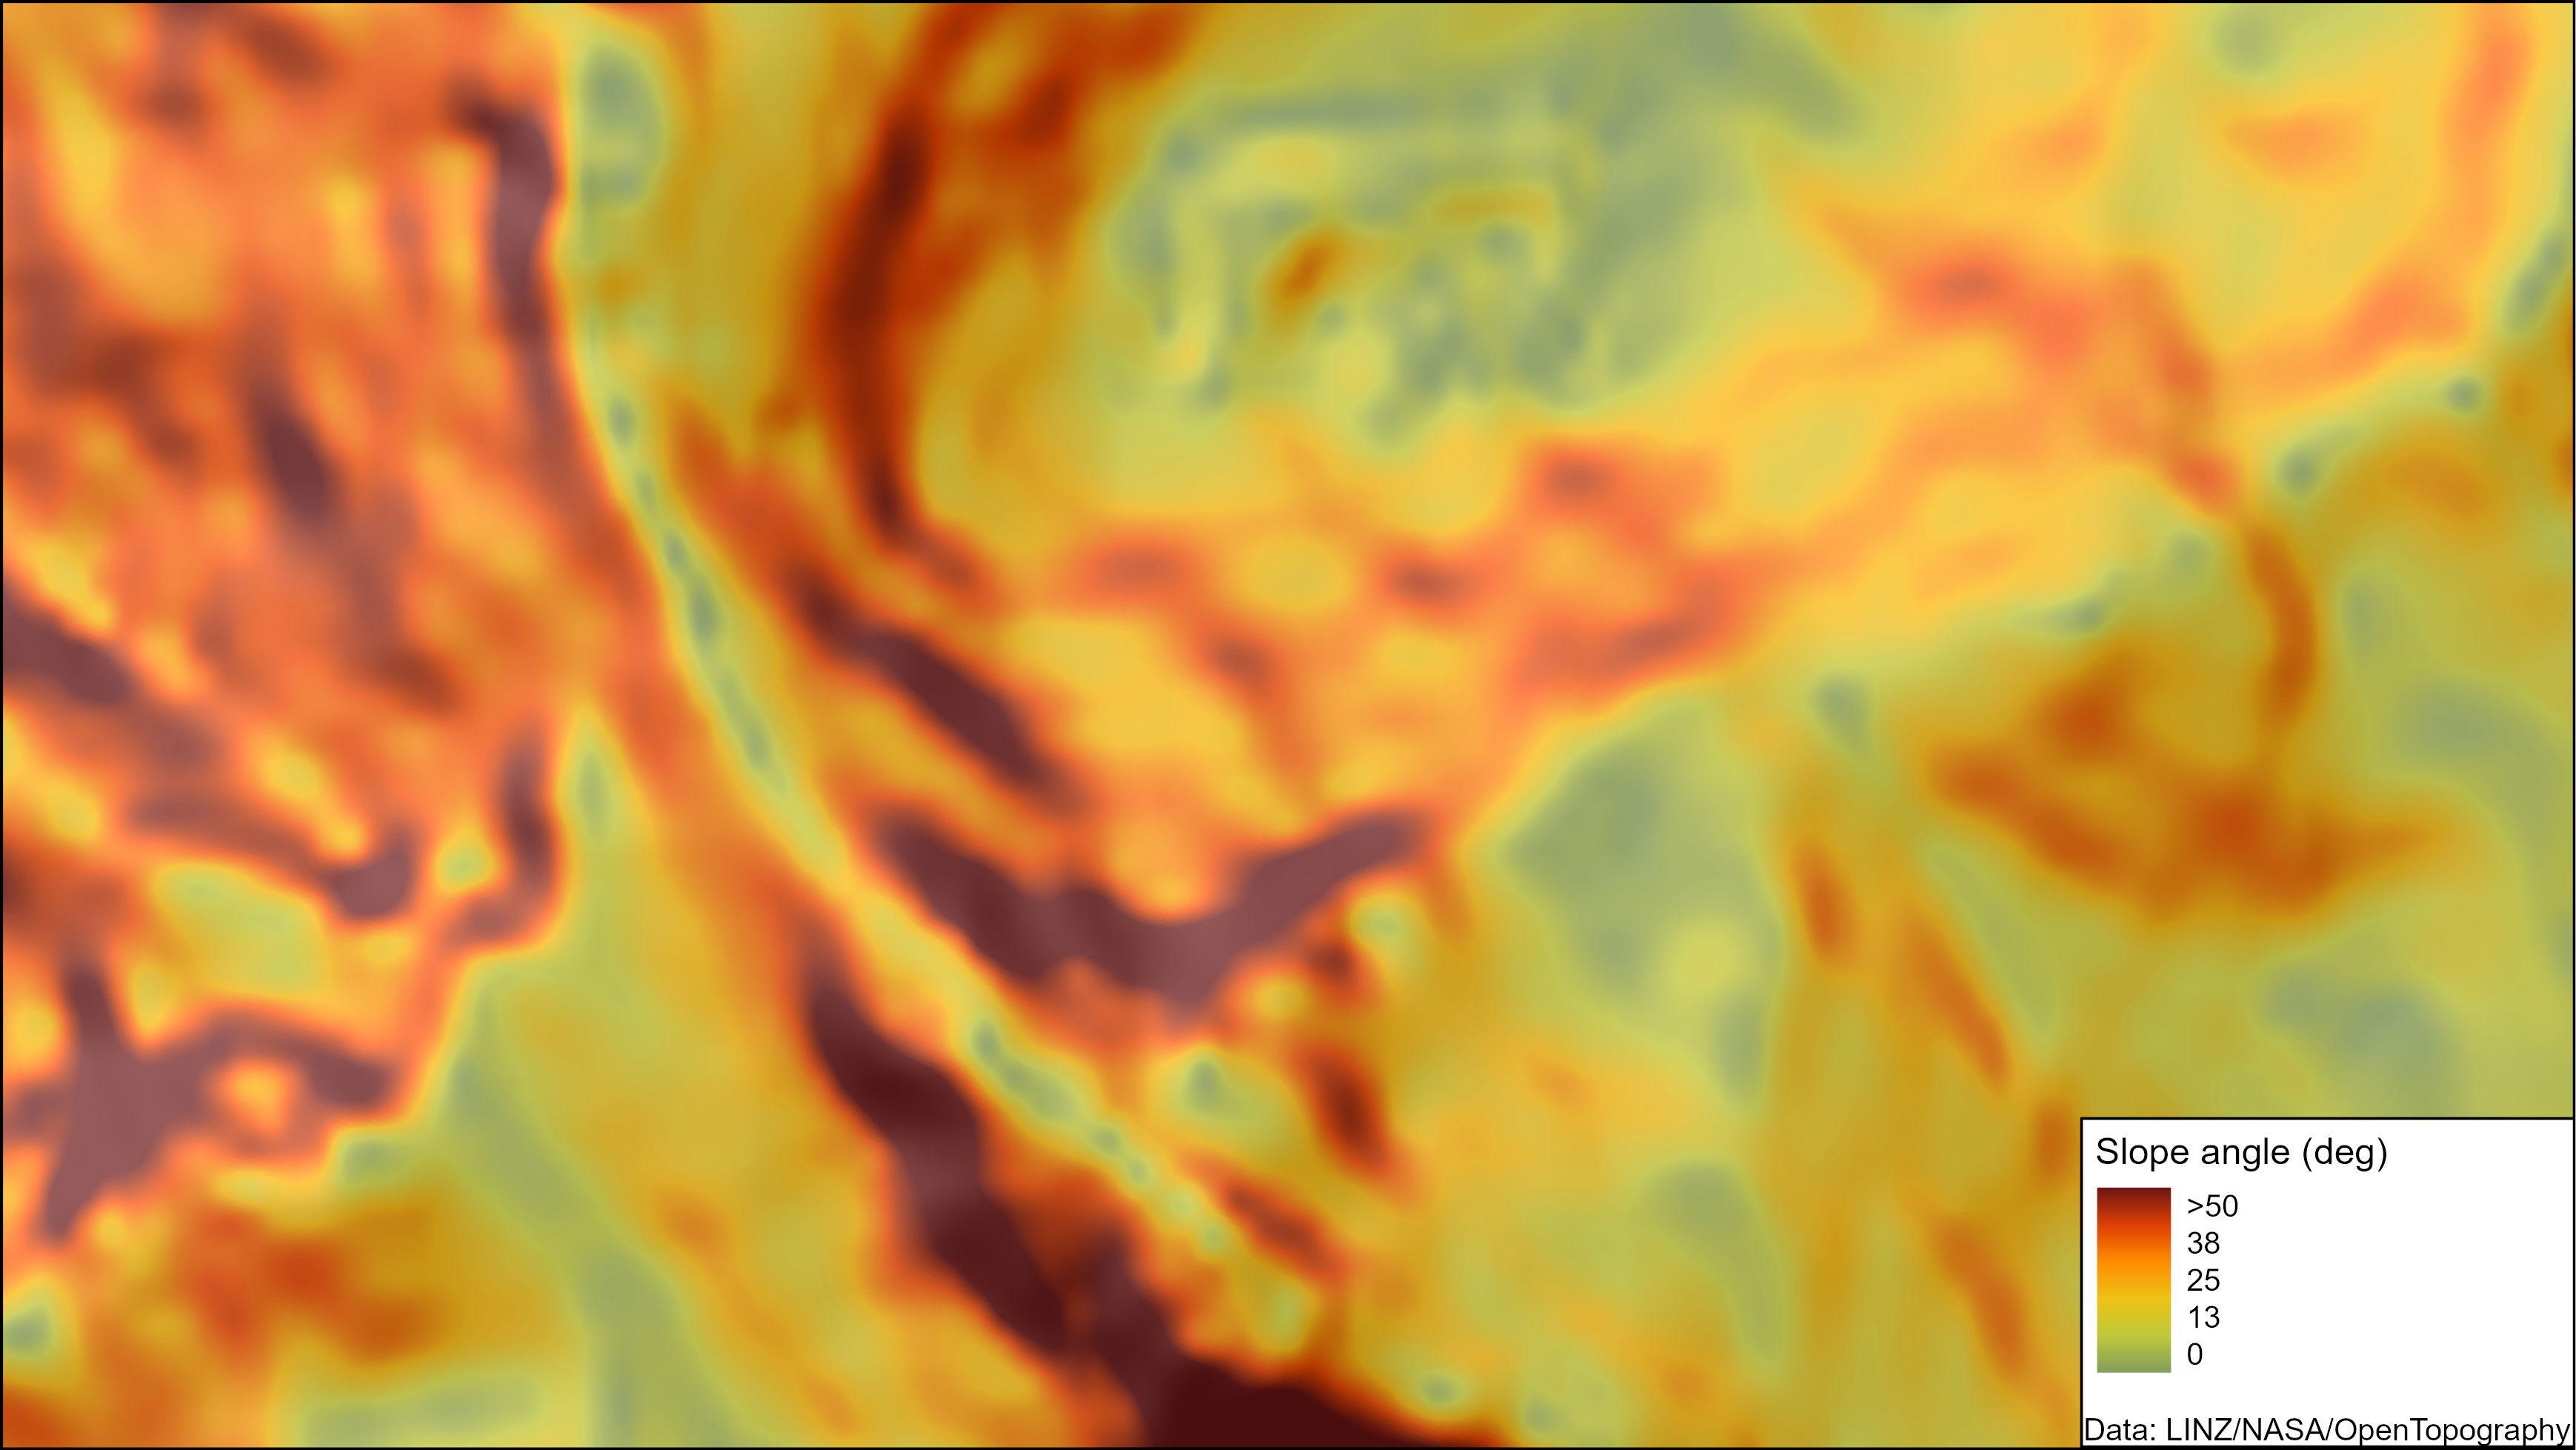
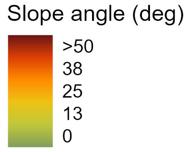
Let’s look at slope angle in more detail. 30m SRTM here.
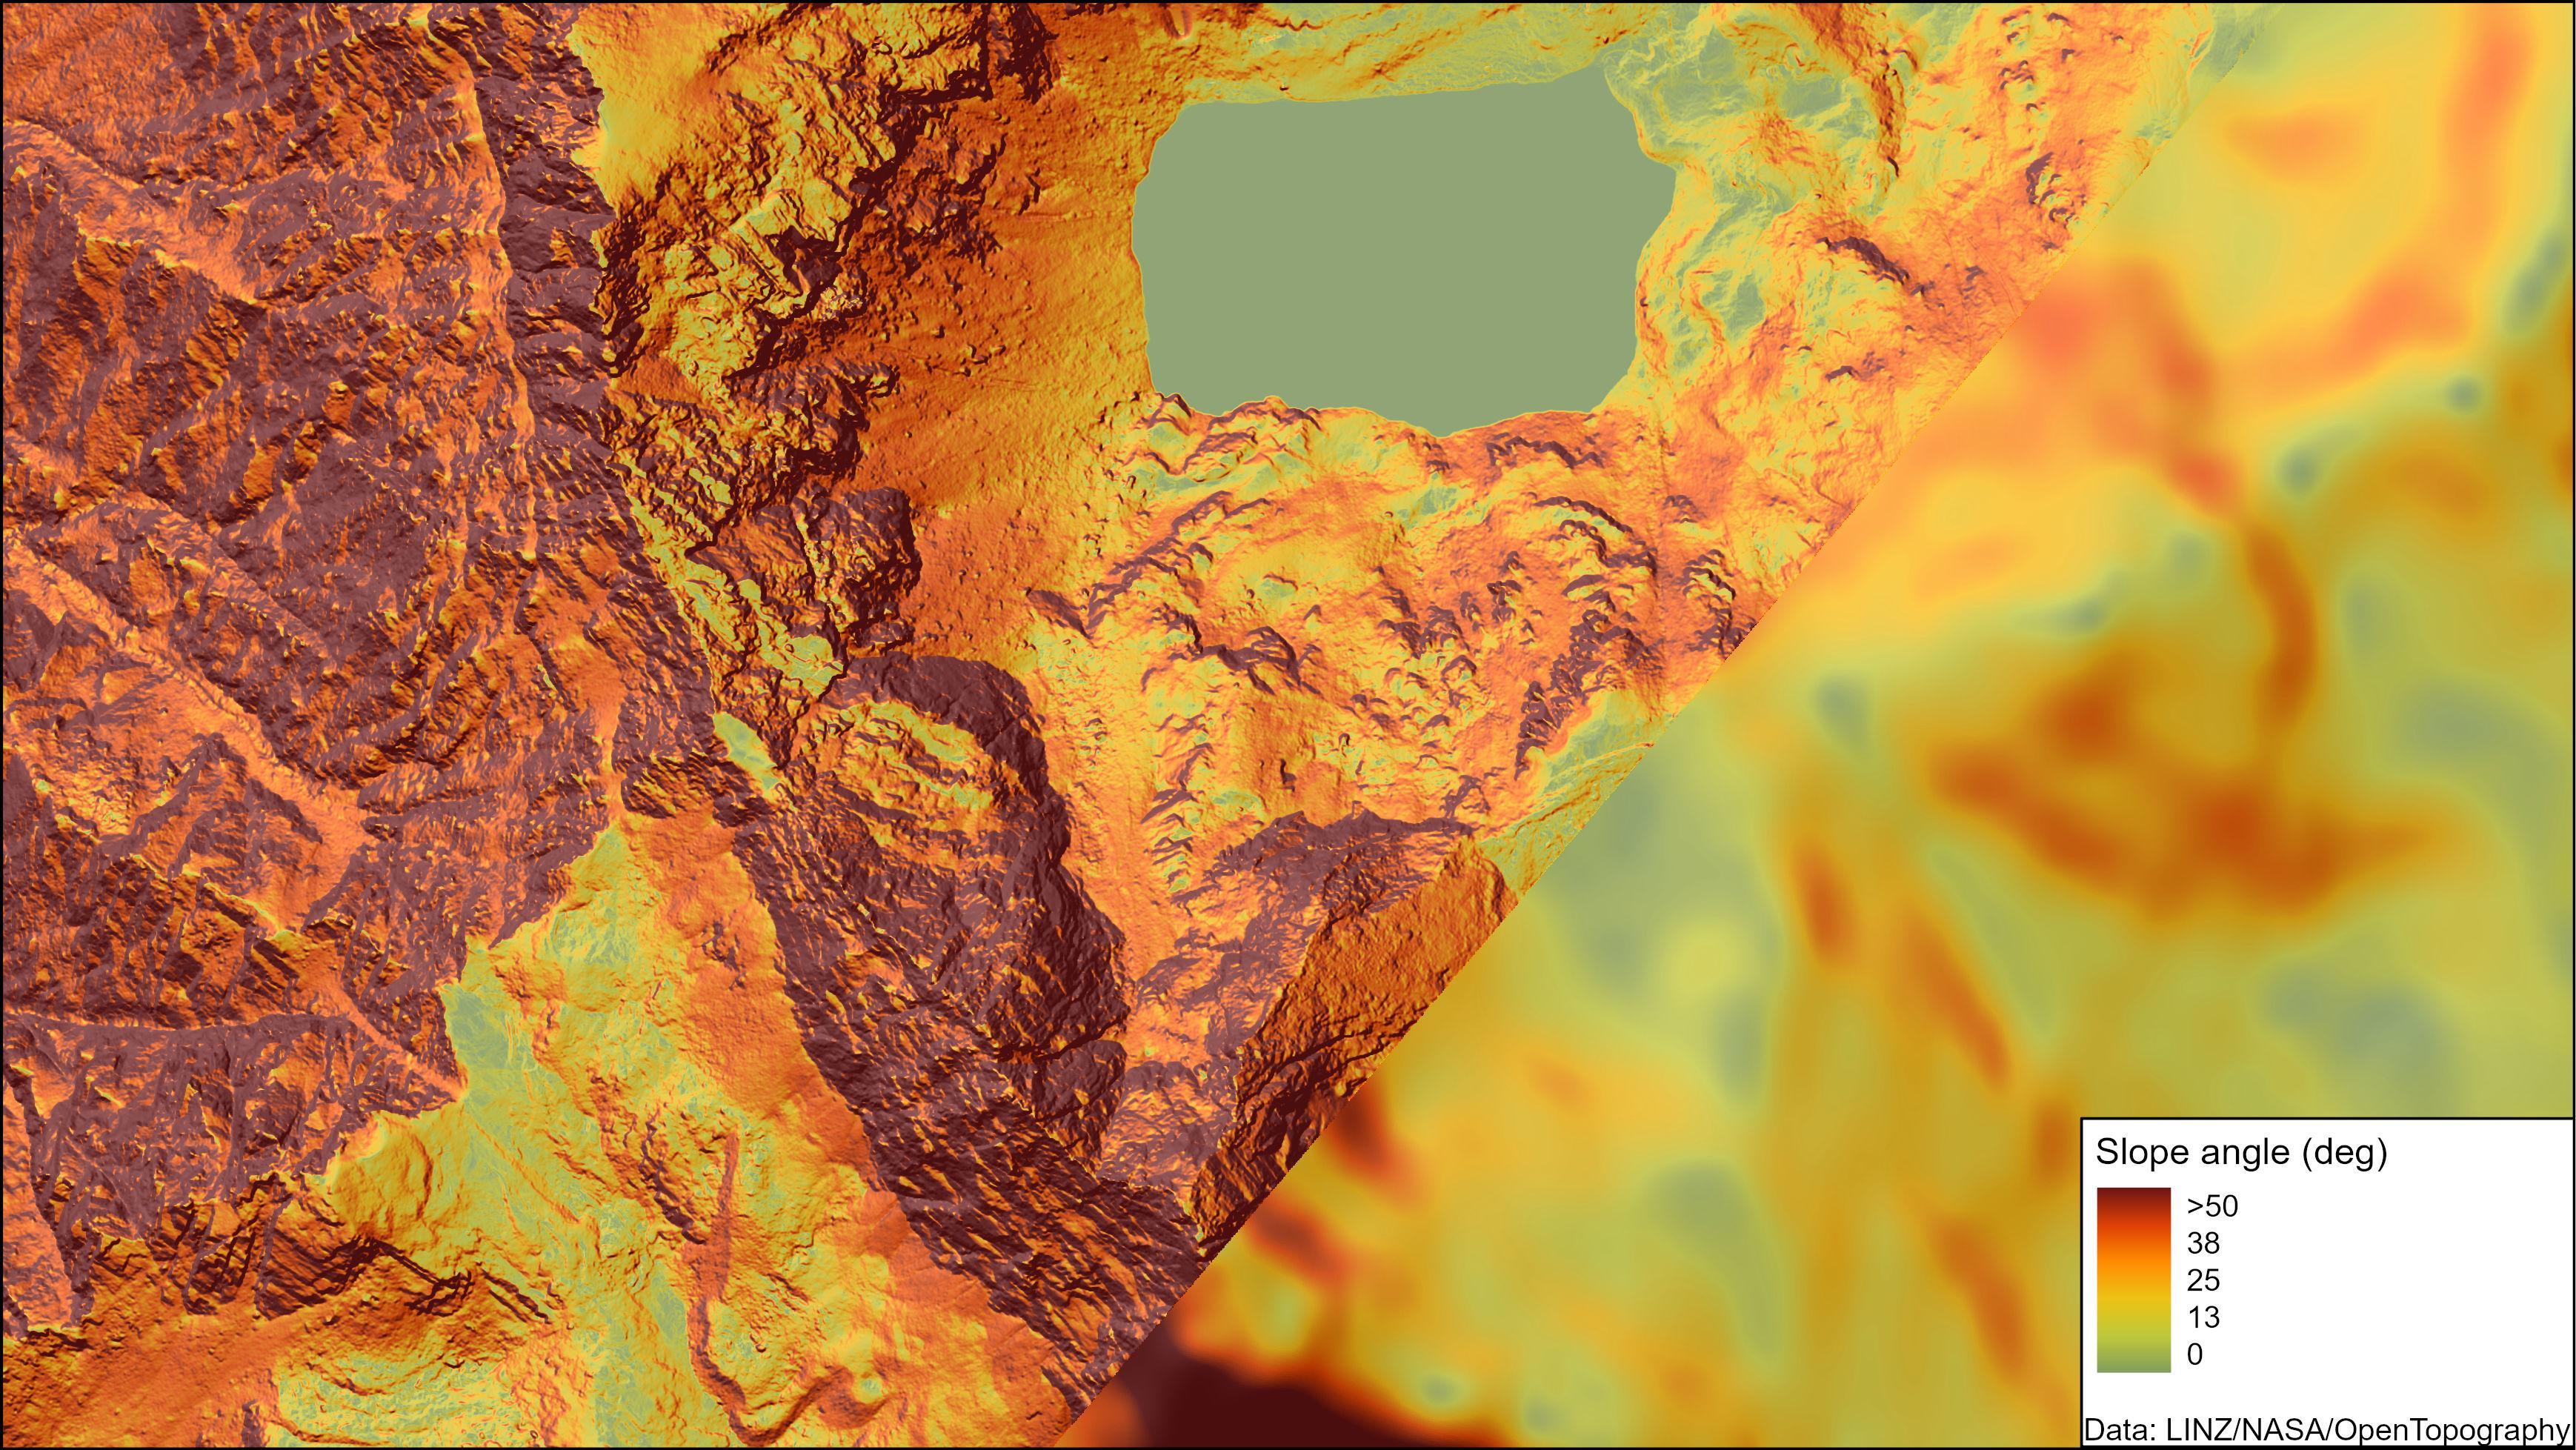
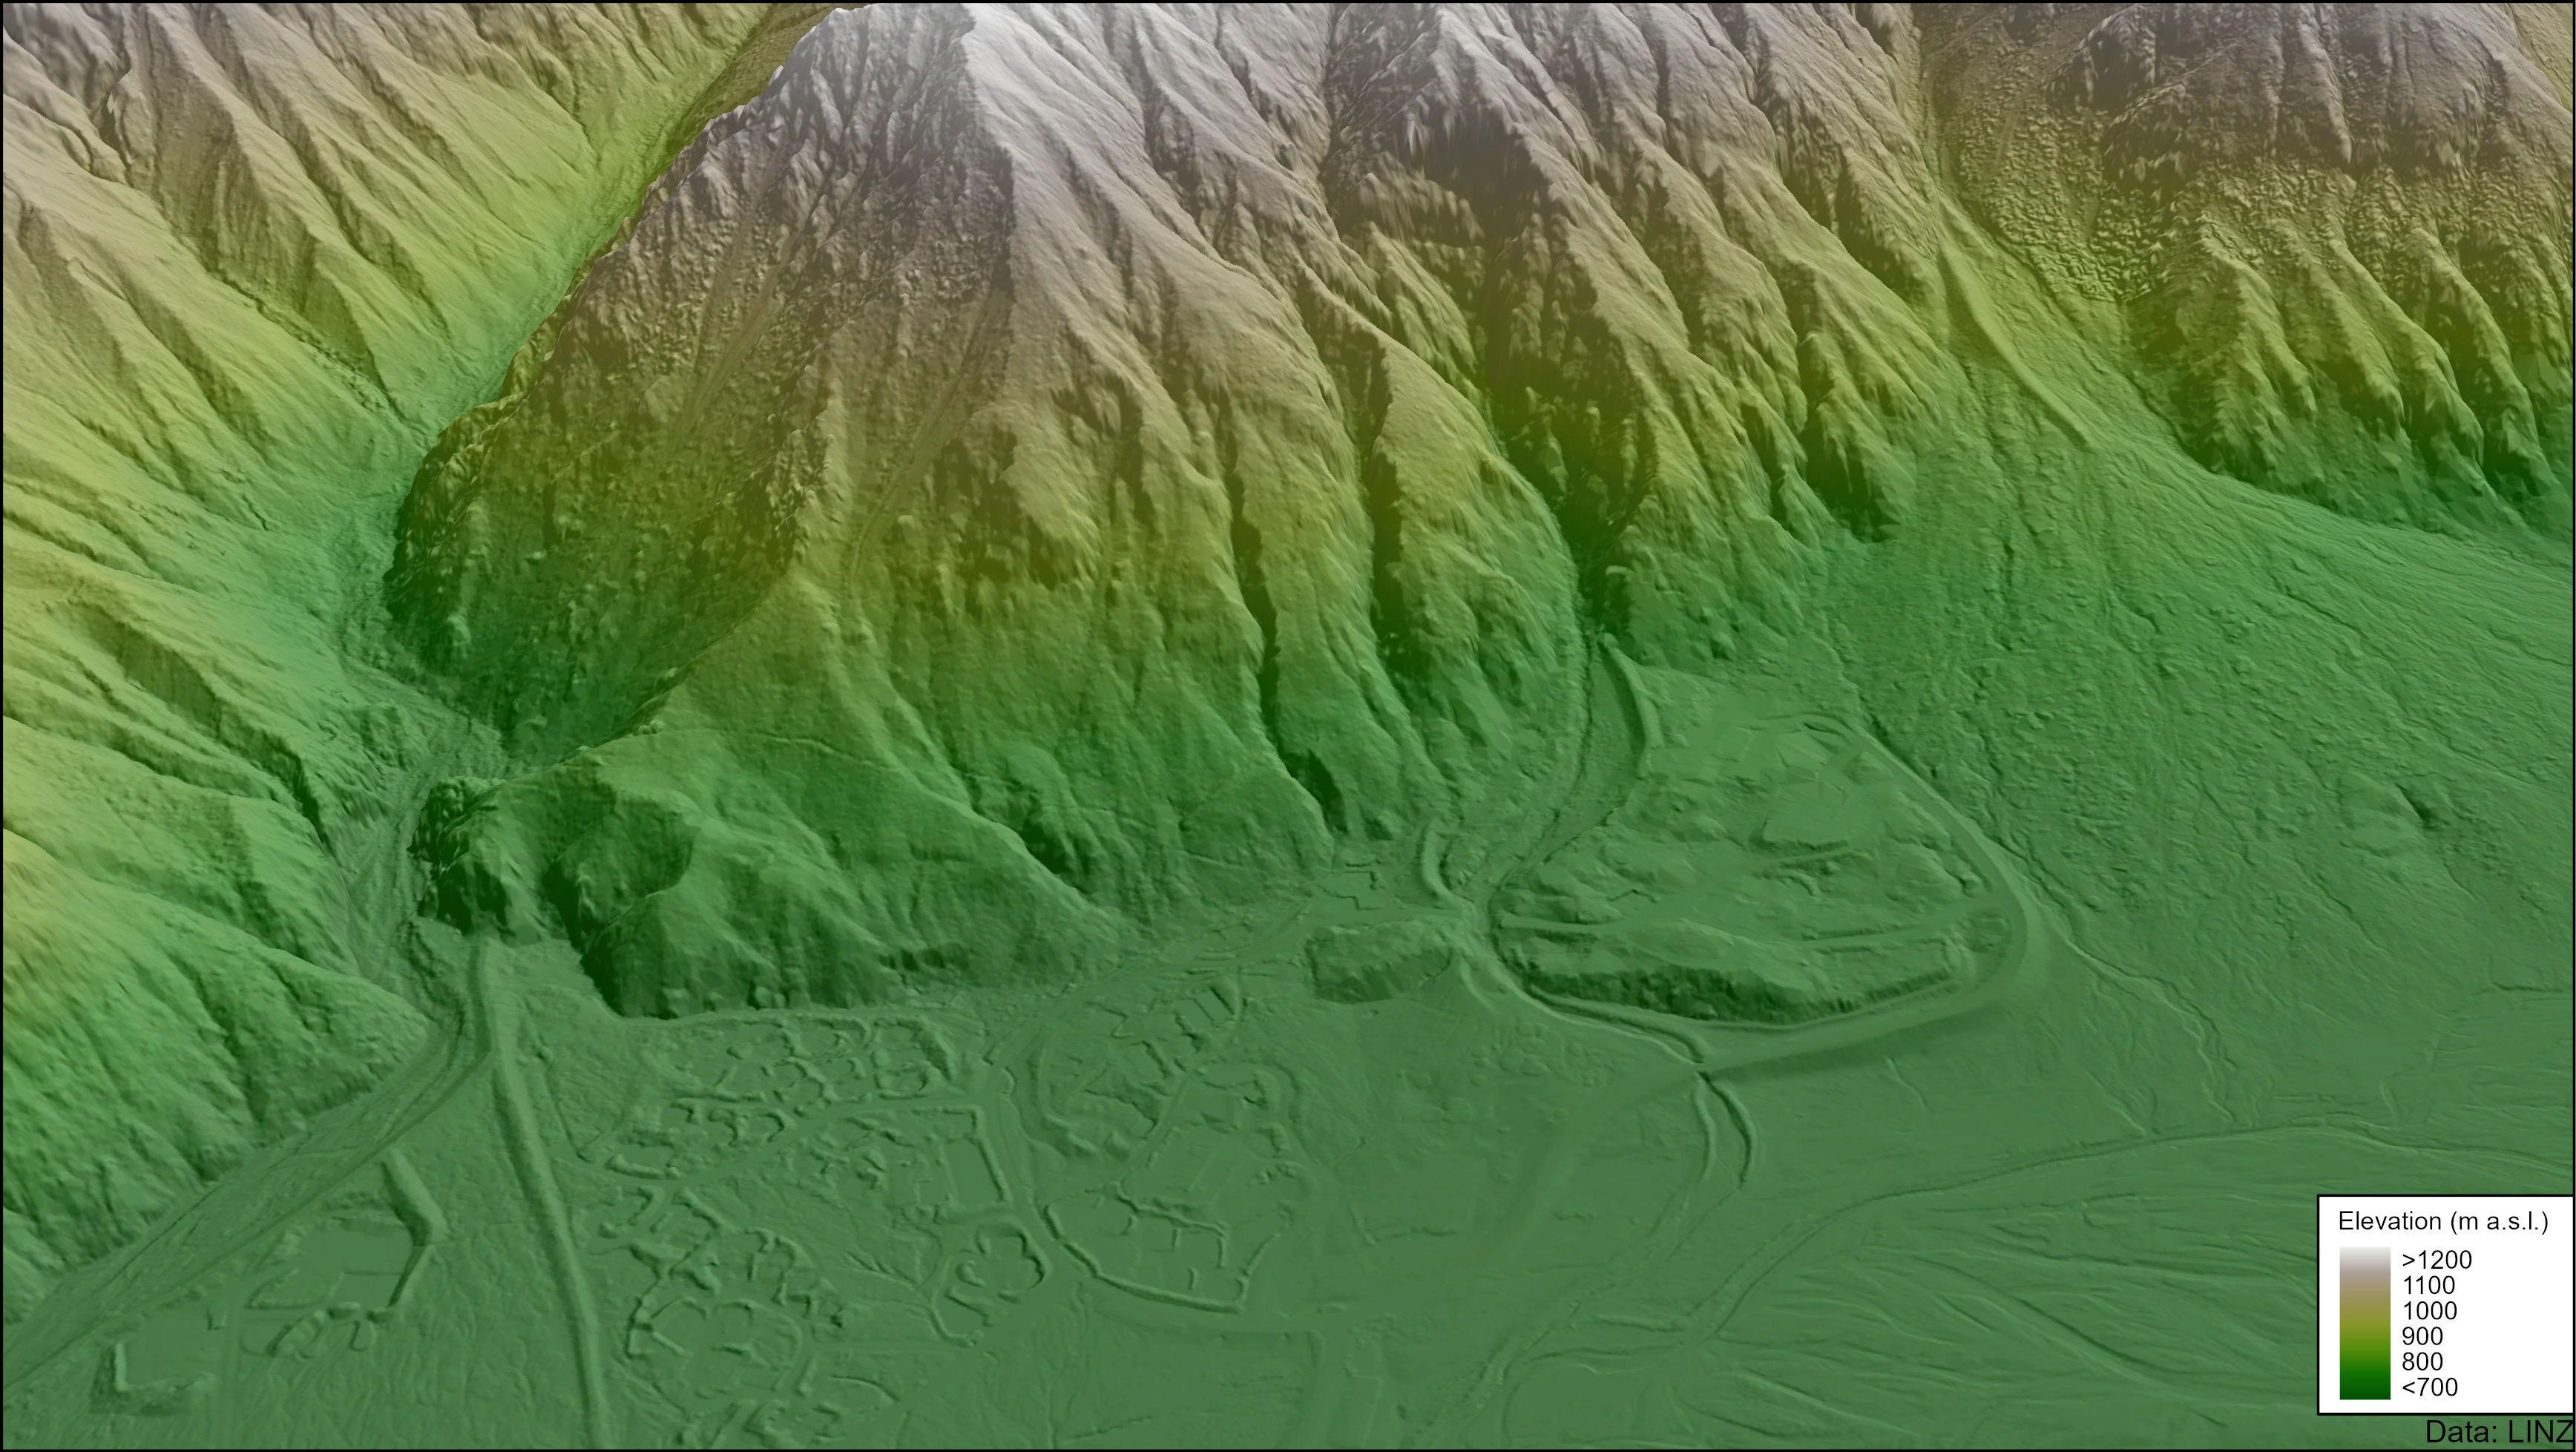
1m lidar here with same color ramp
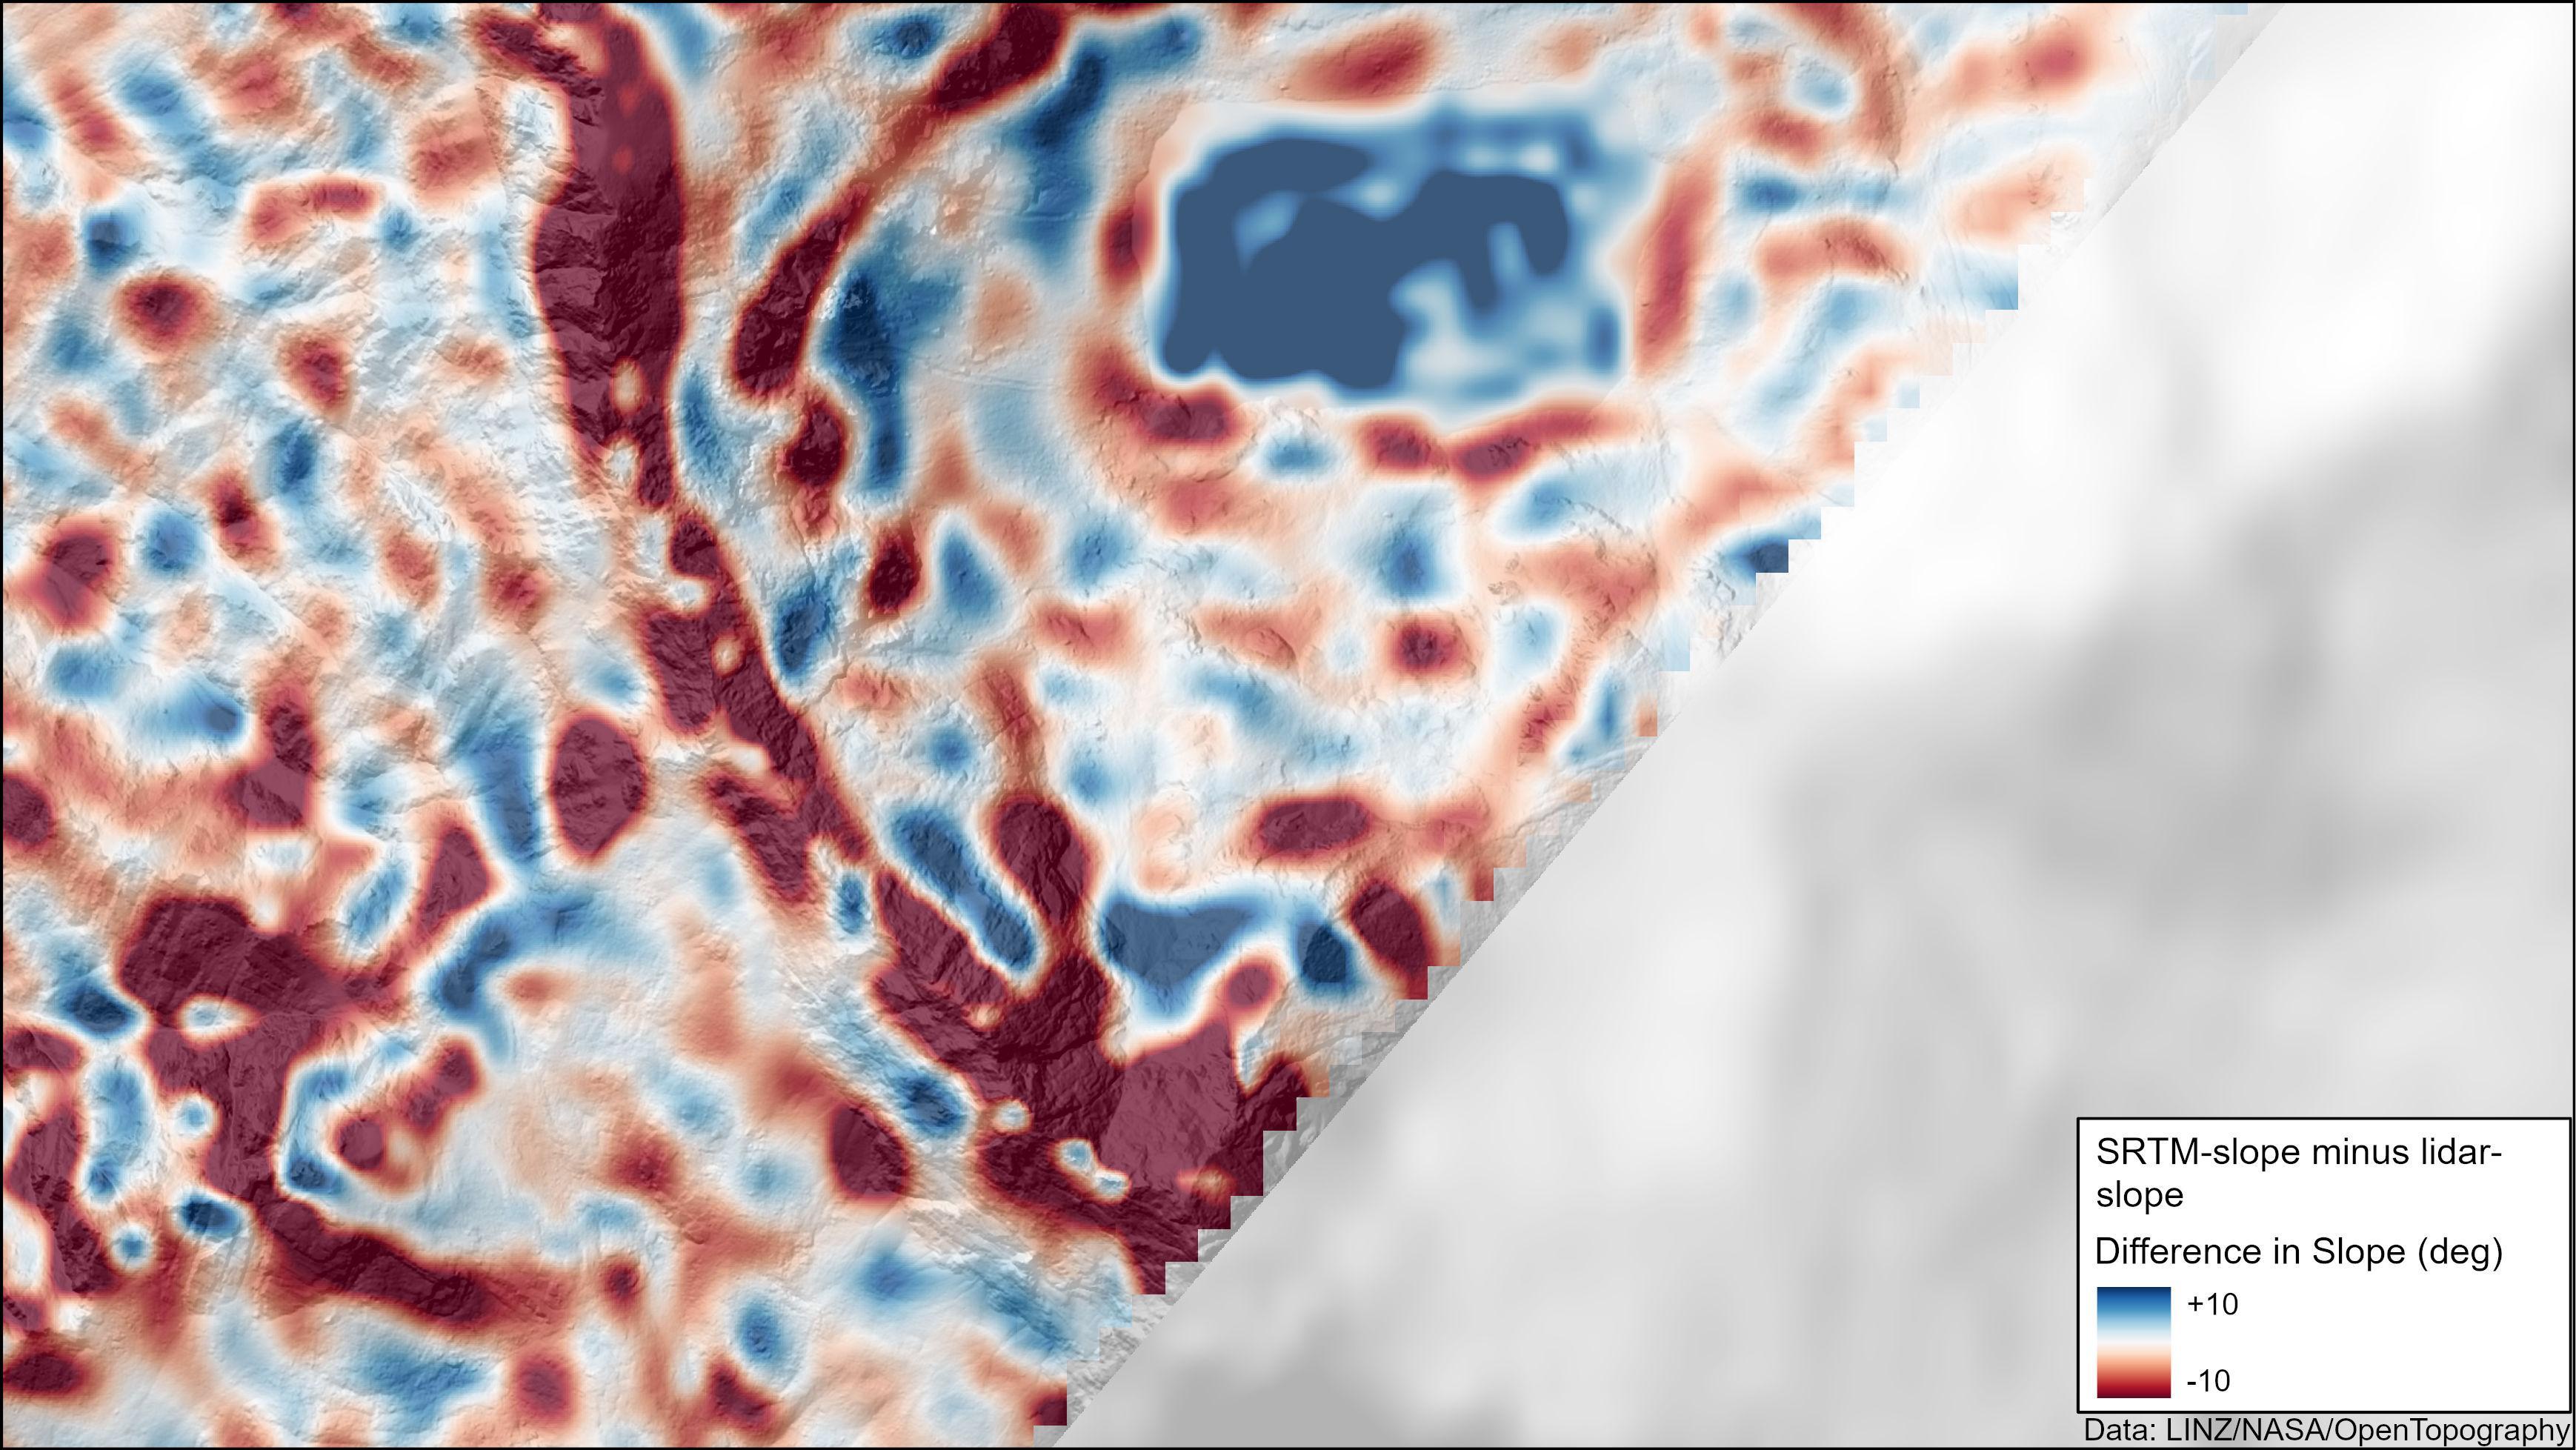
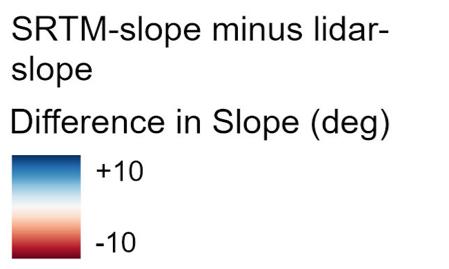
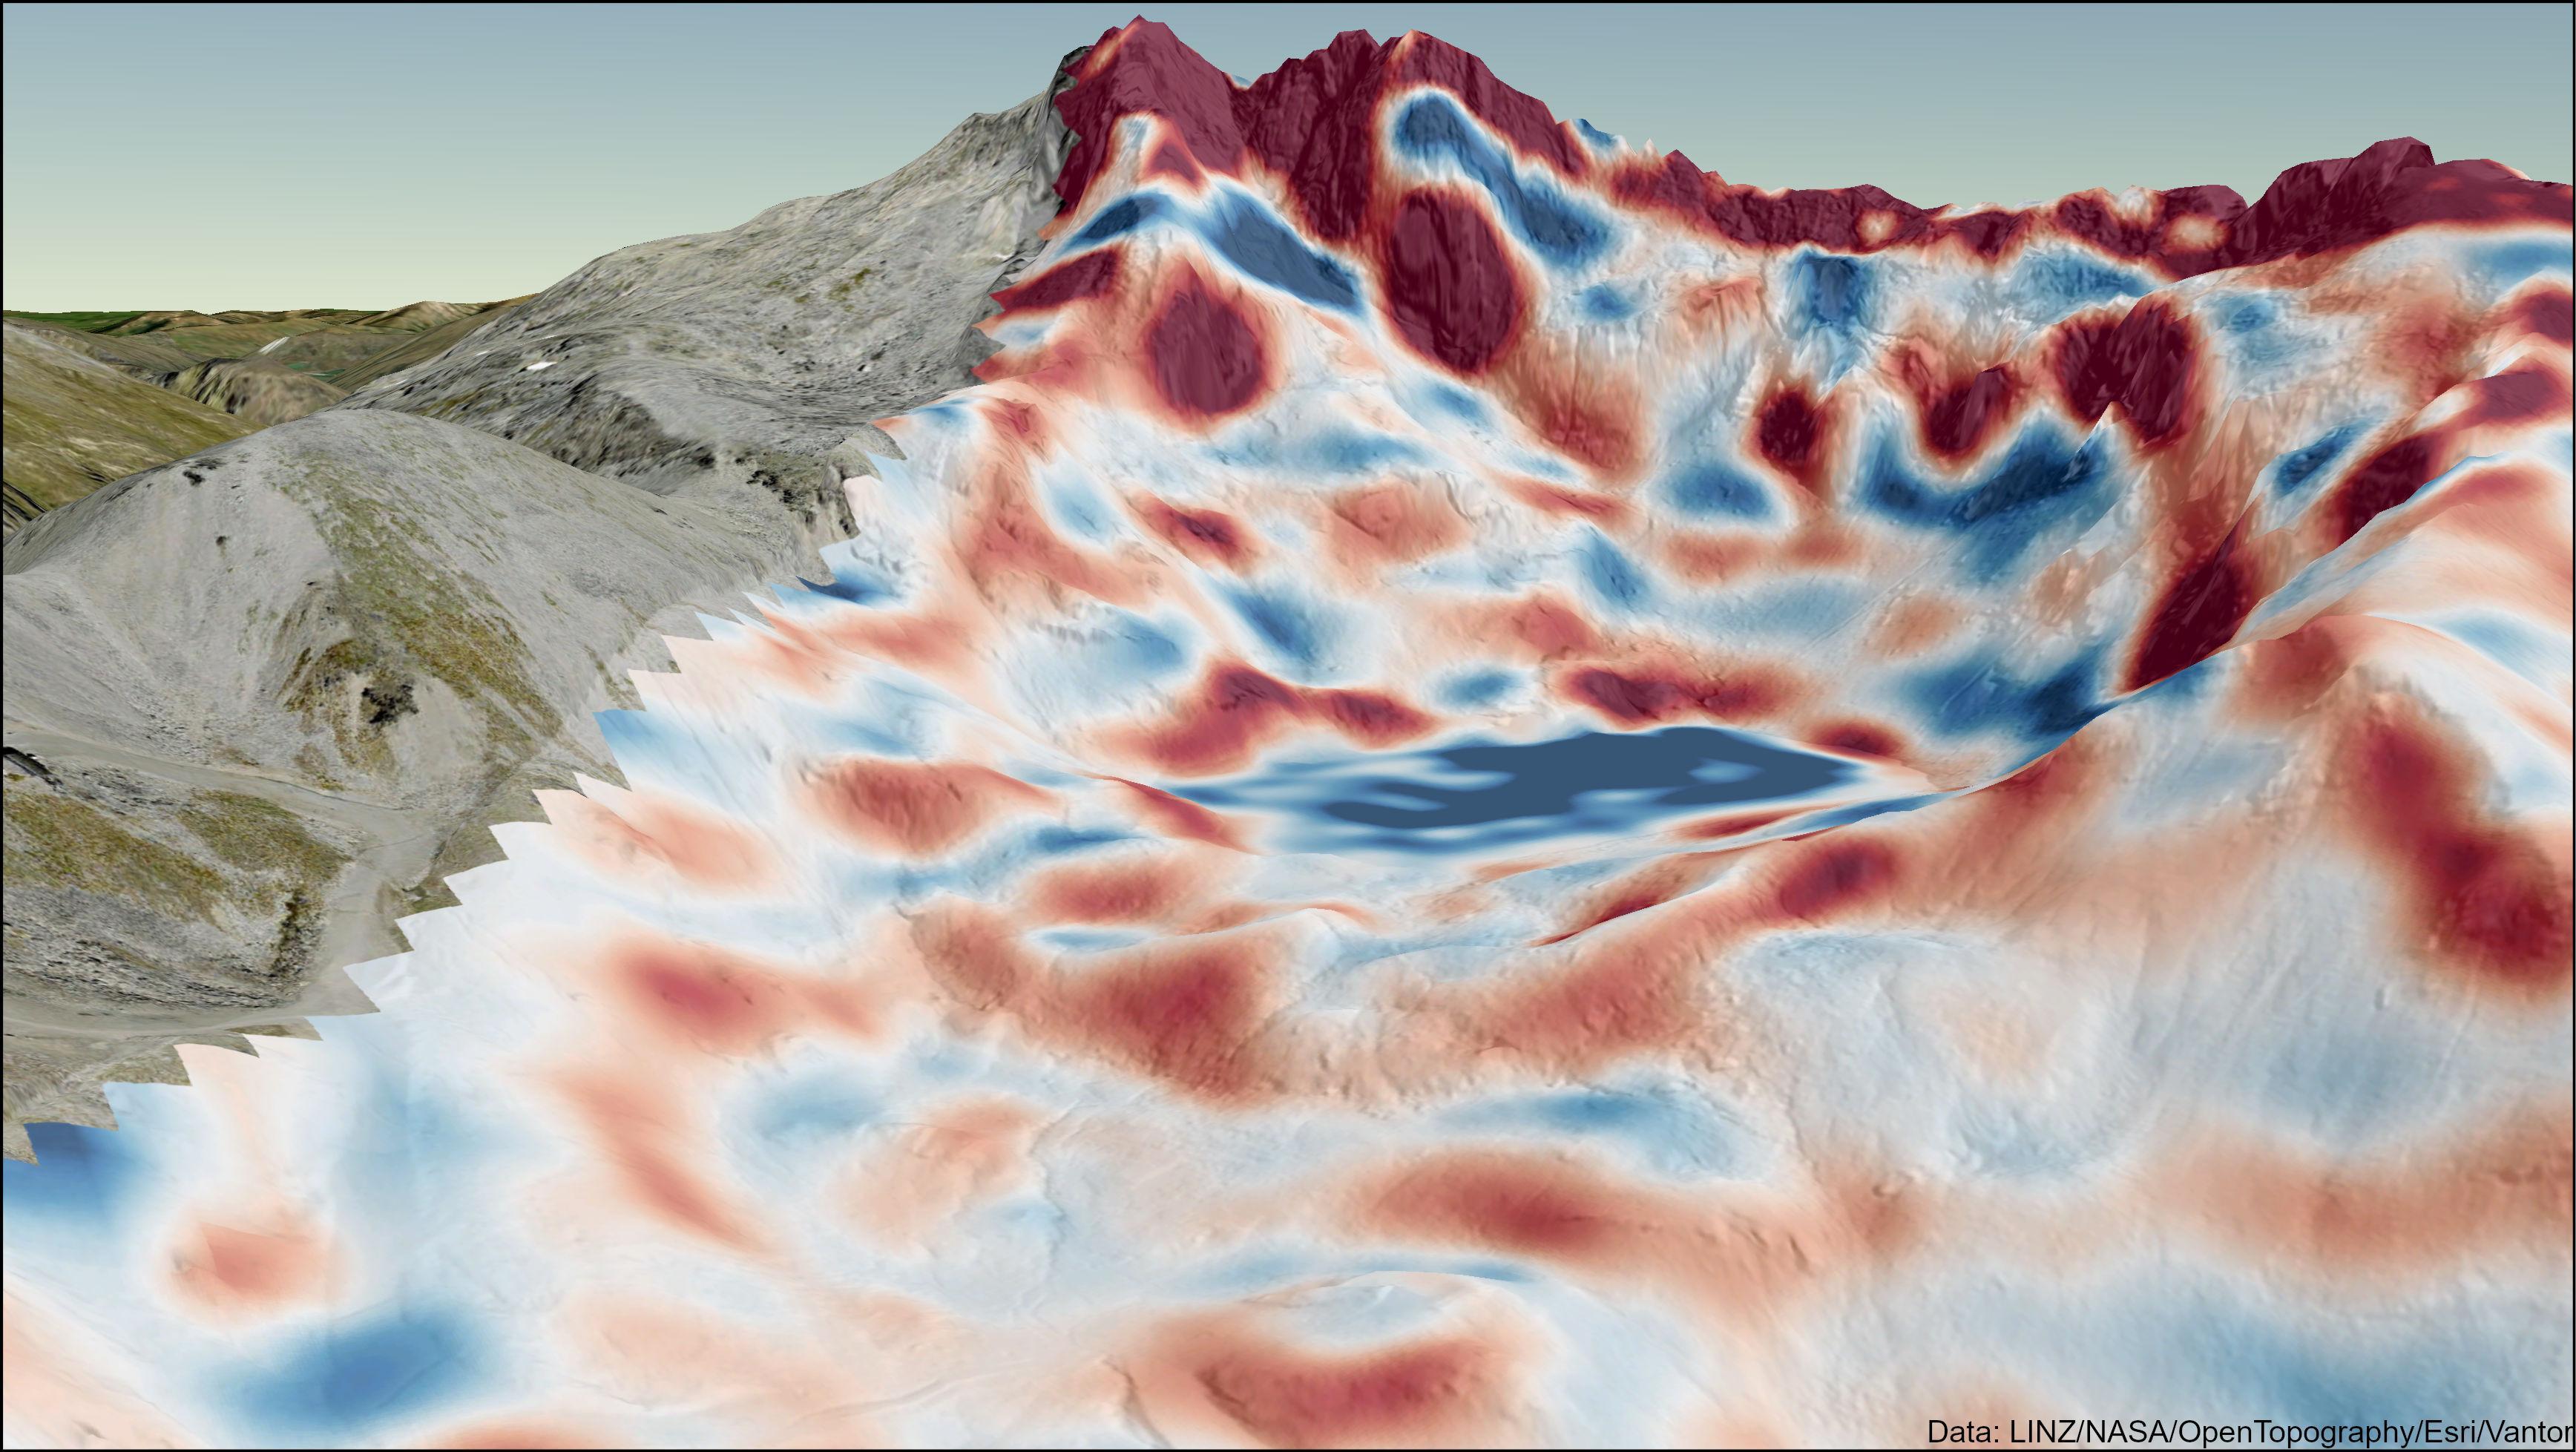
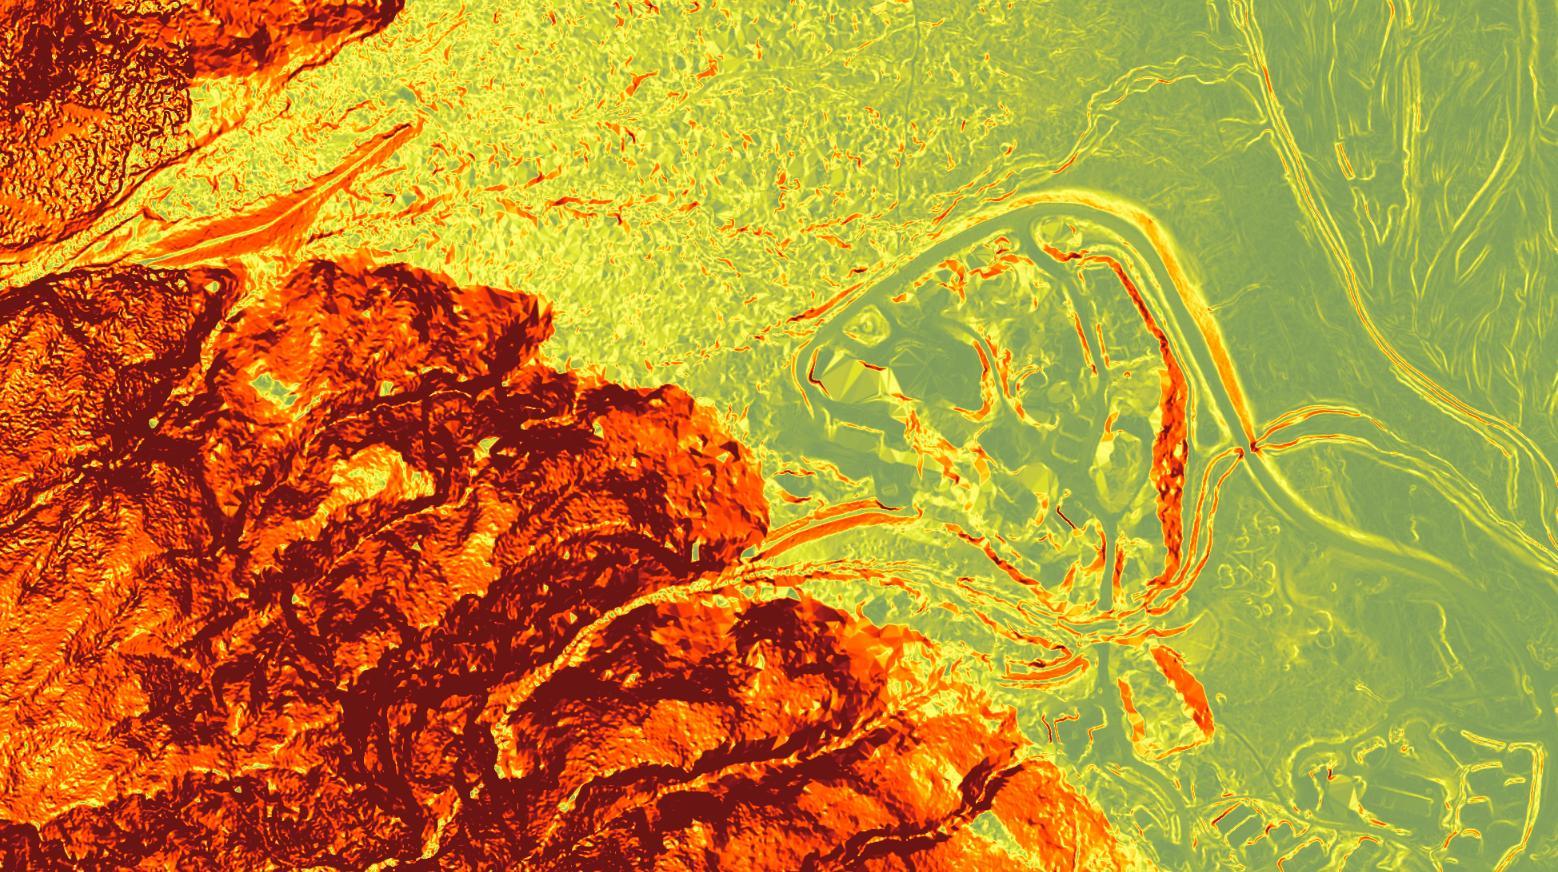
The difference in slope angle between SRTM and lidar. Red is where lidar shows as steeper than SRTM. Blue is where SRTM is steep than lidar


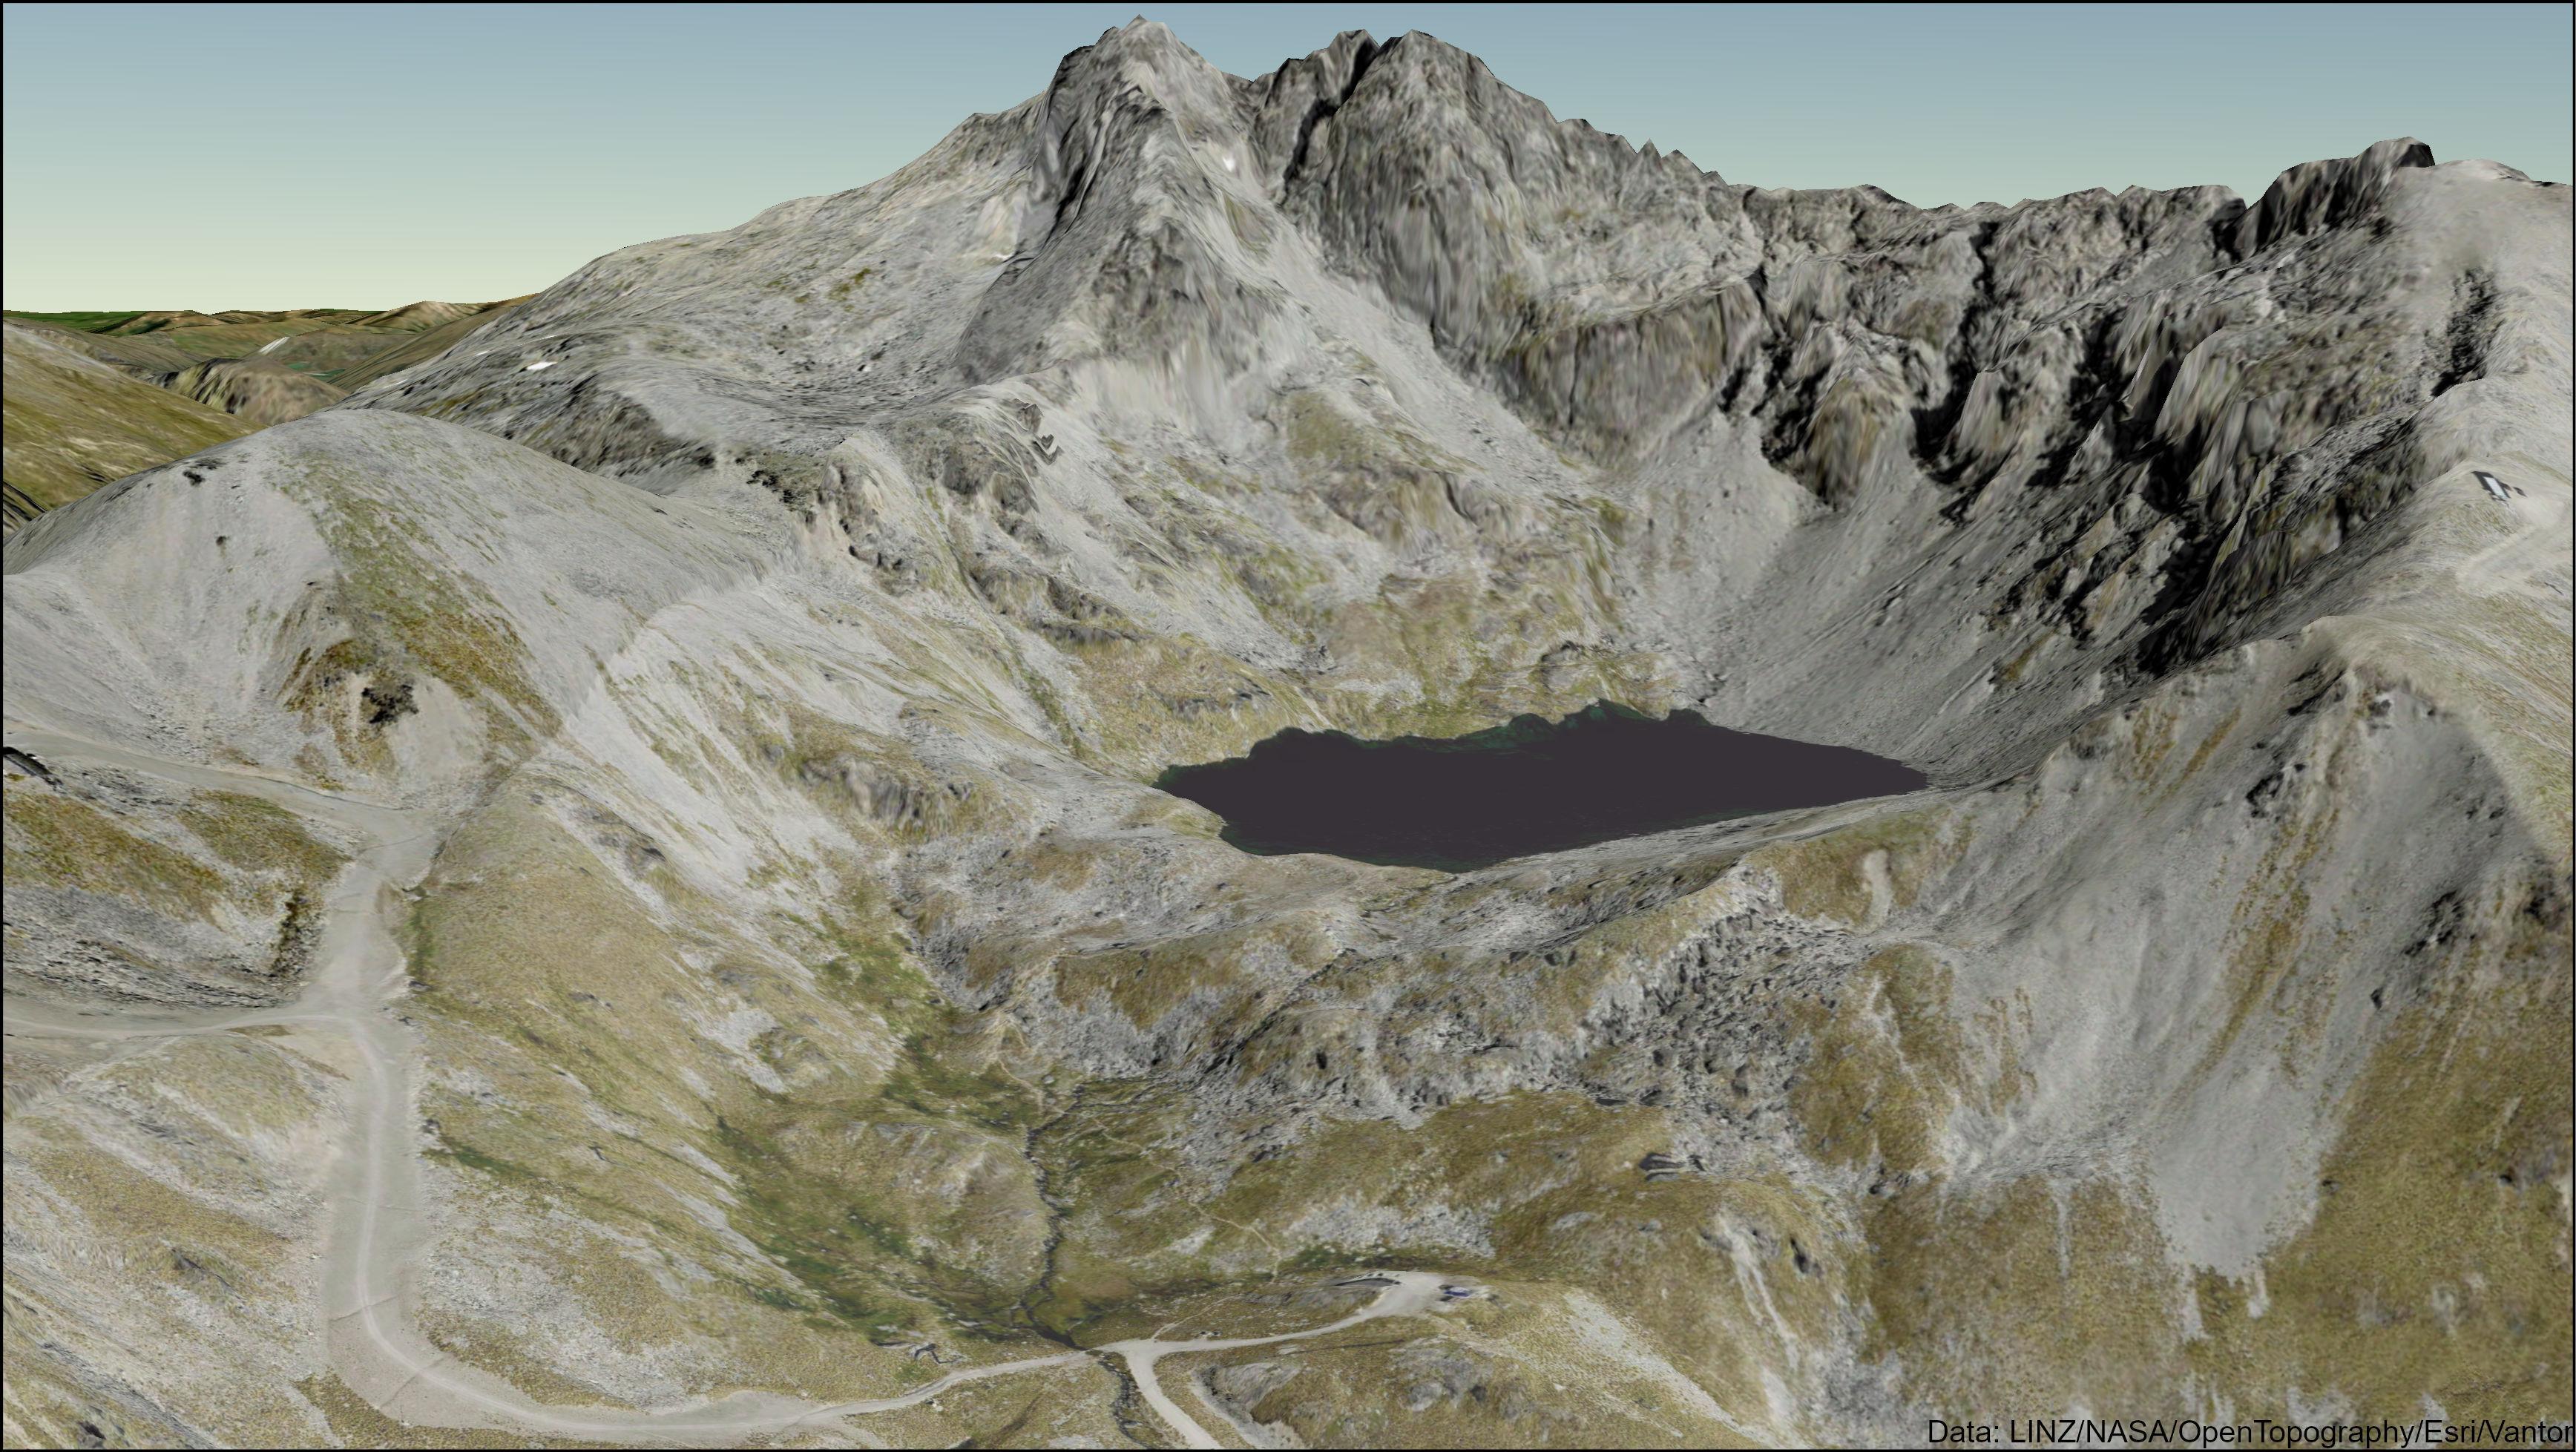
Many tools let us see data in D.








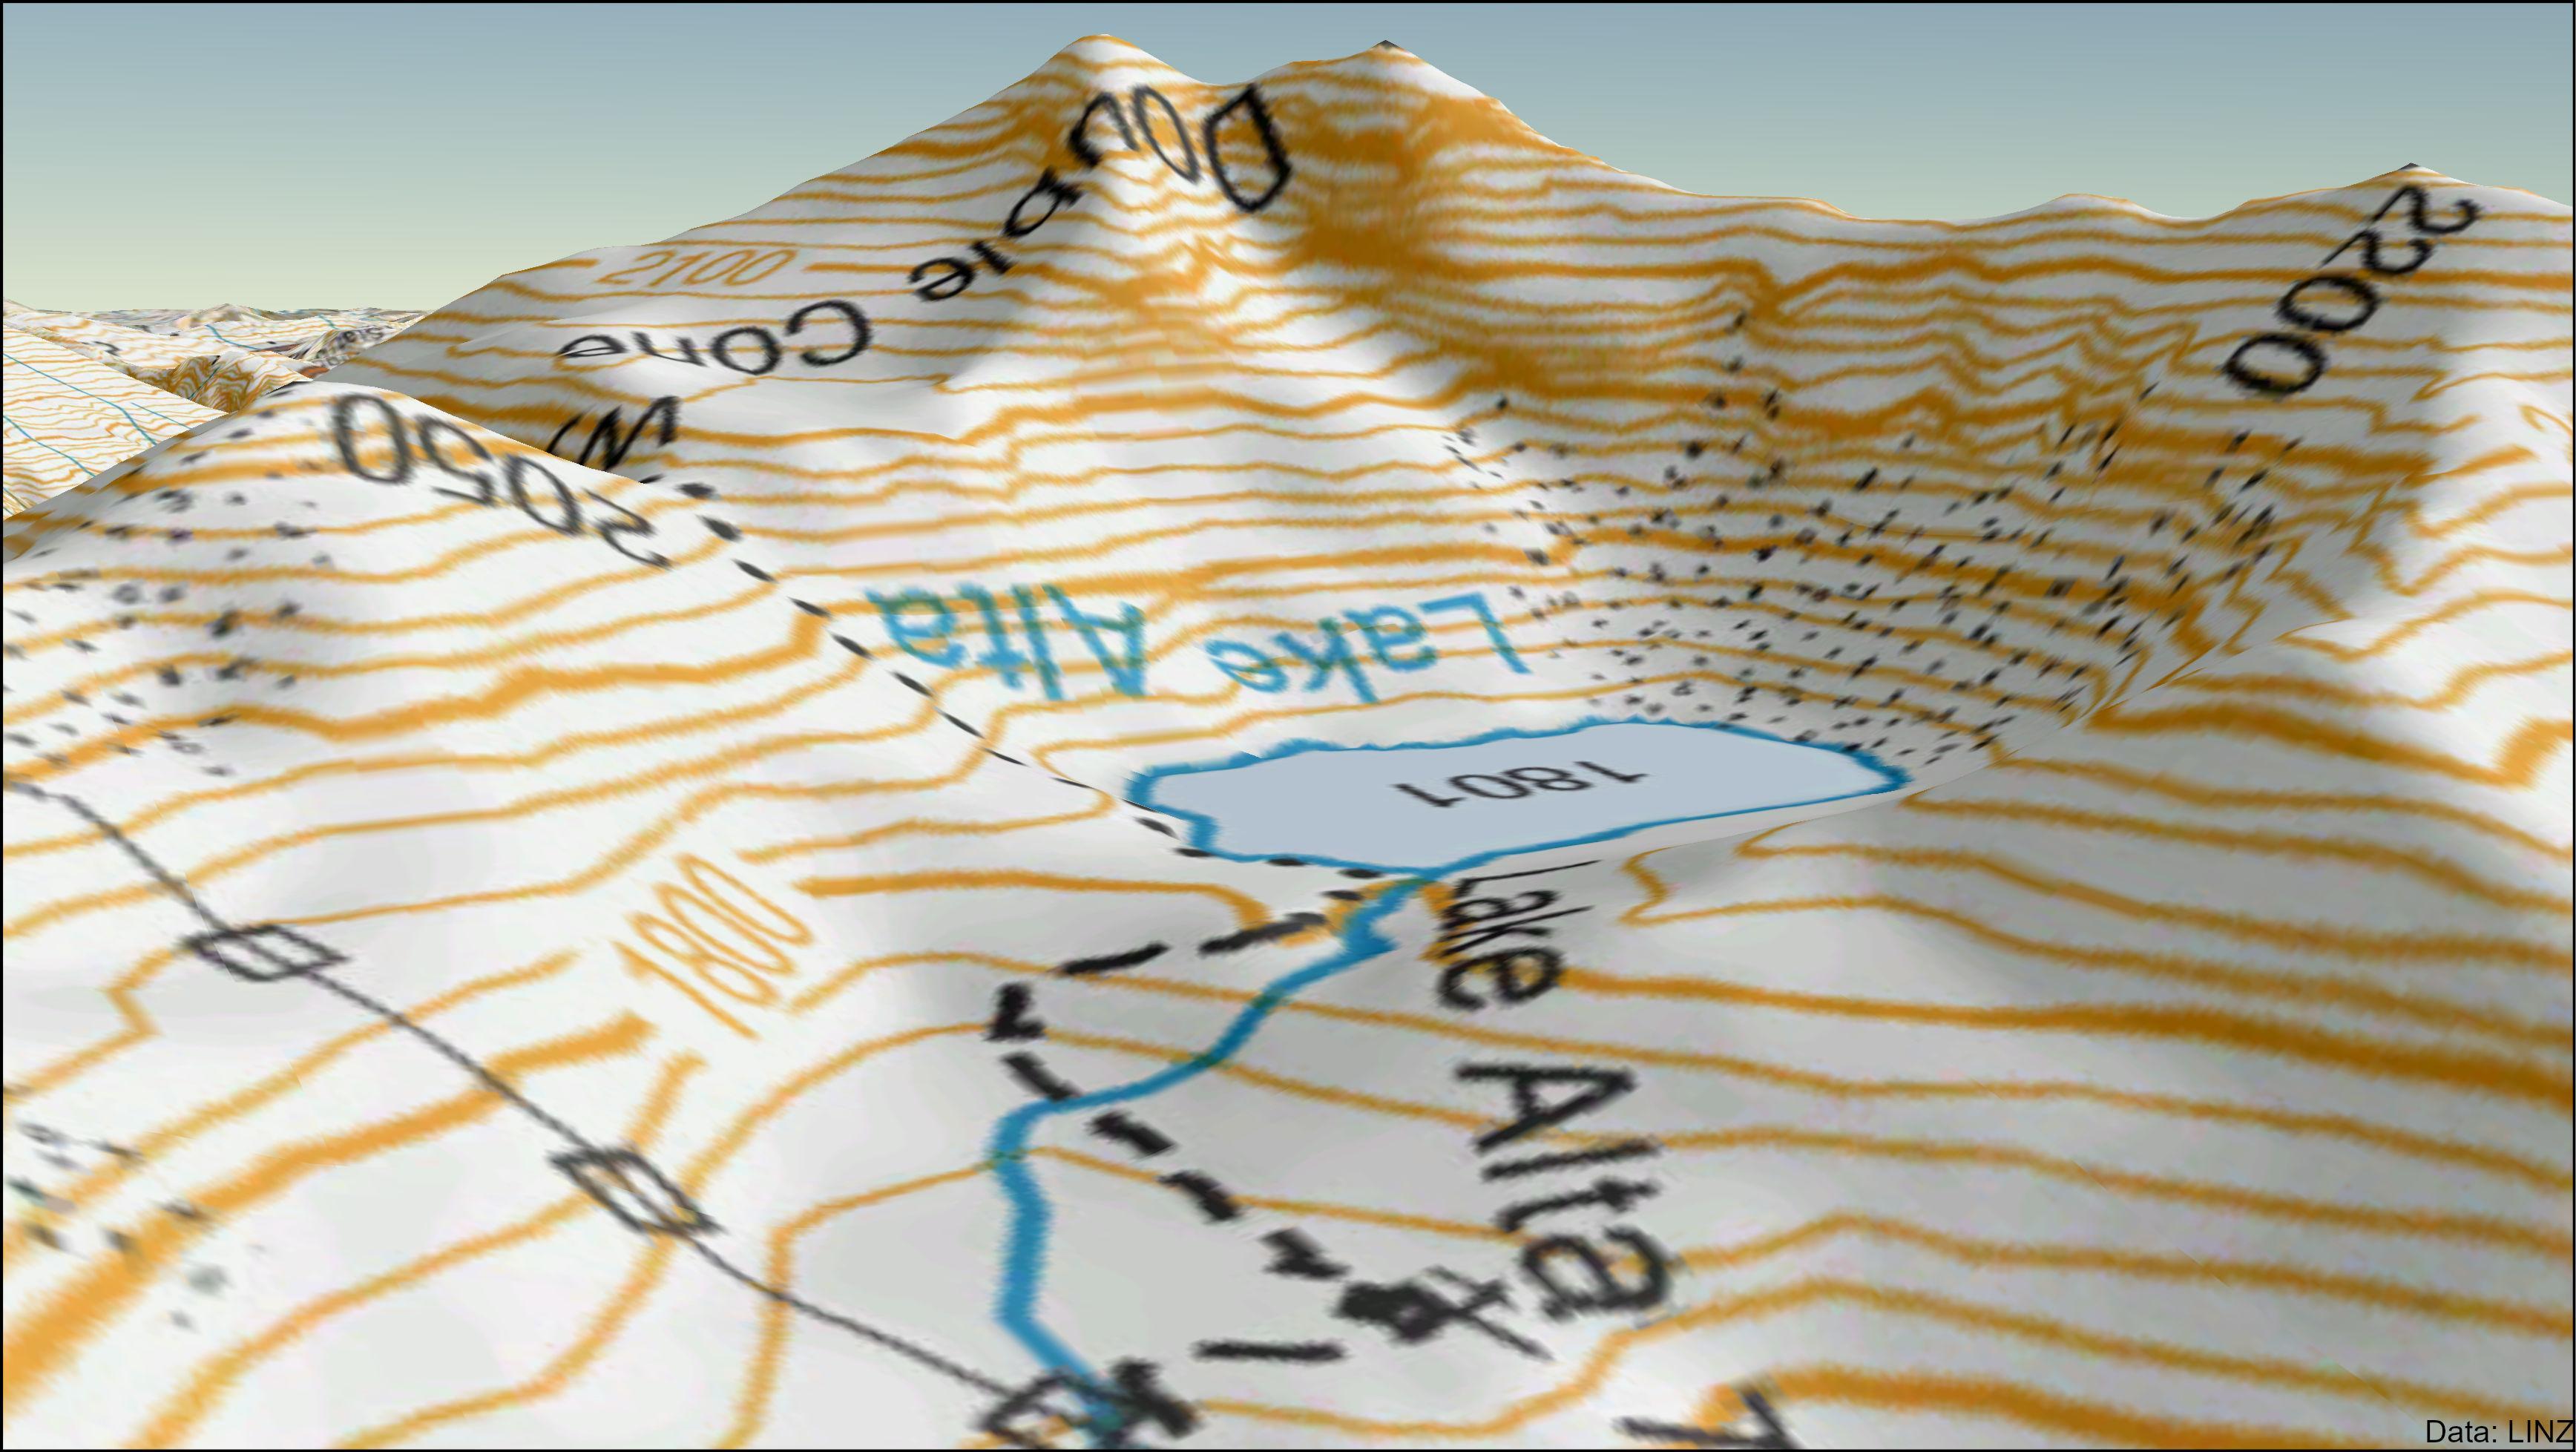
This is 15m DEM (Columbus et al. 2011) from the LINZ contours used to represent the terrain.



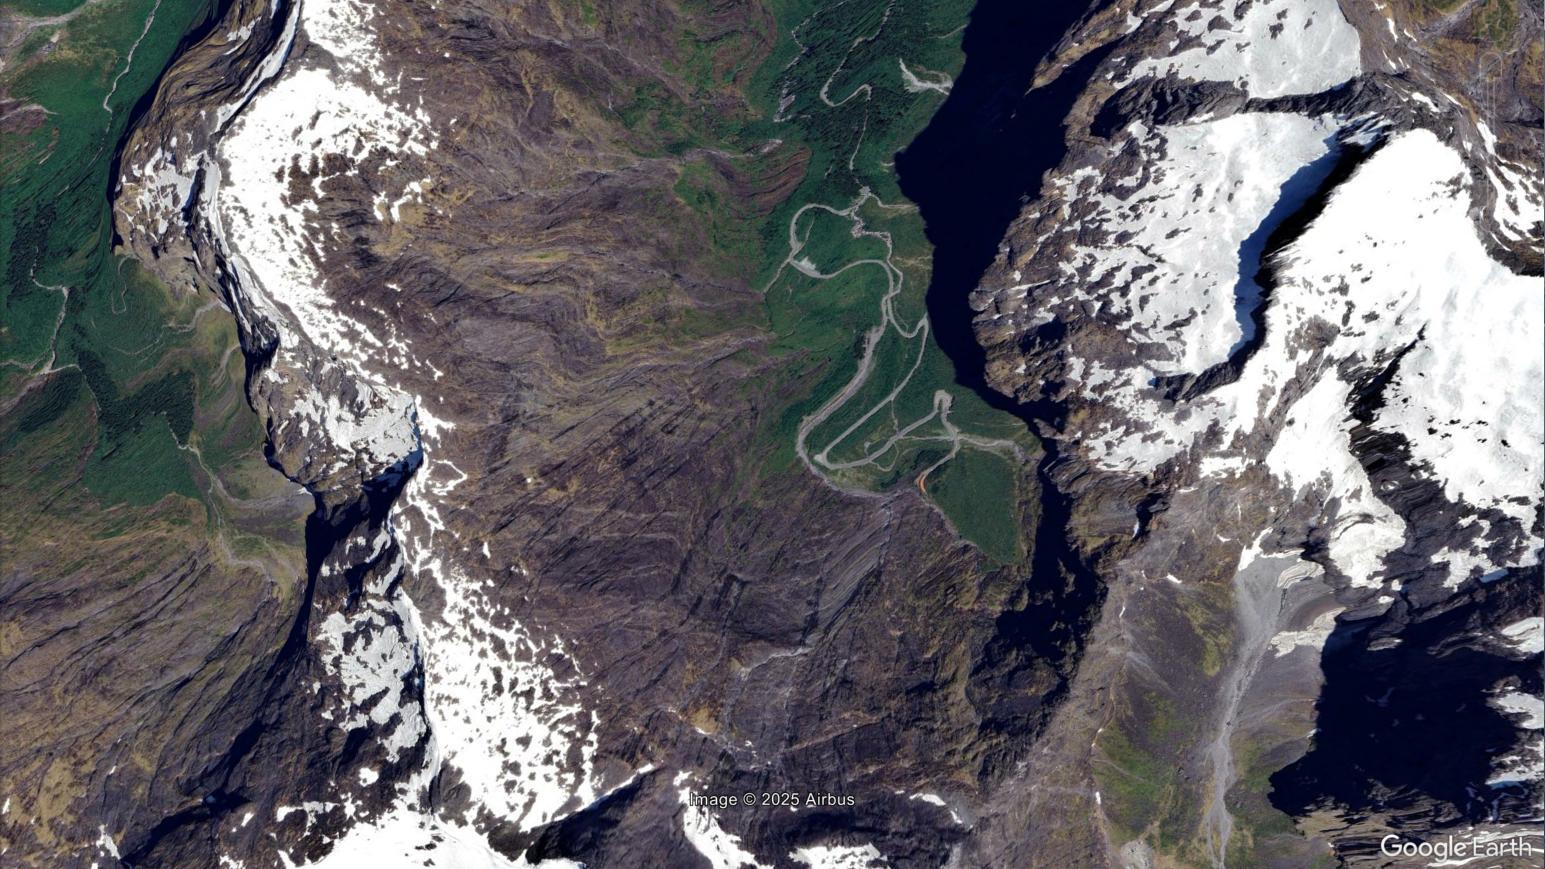
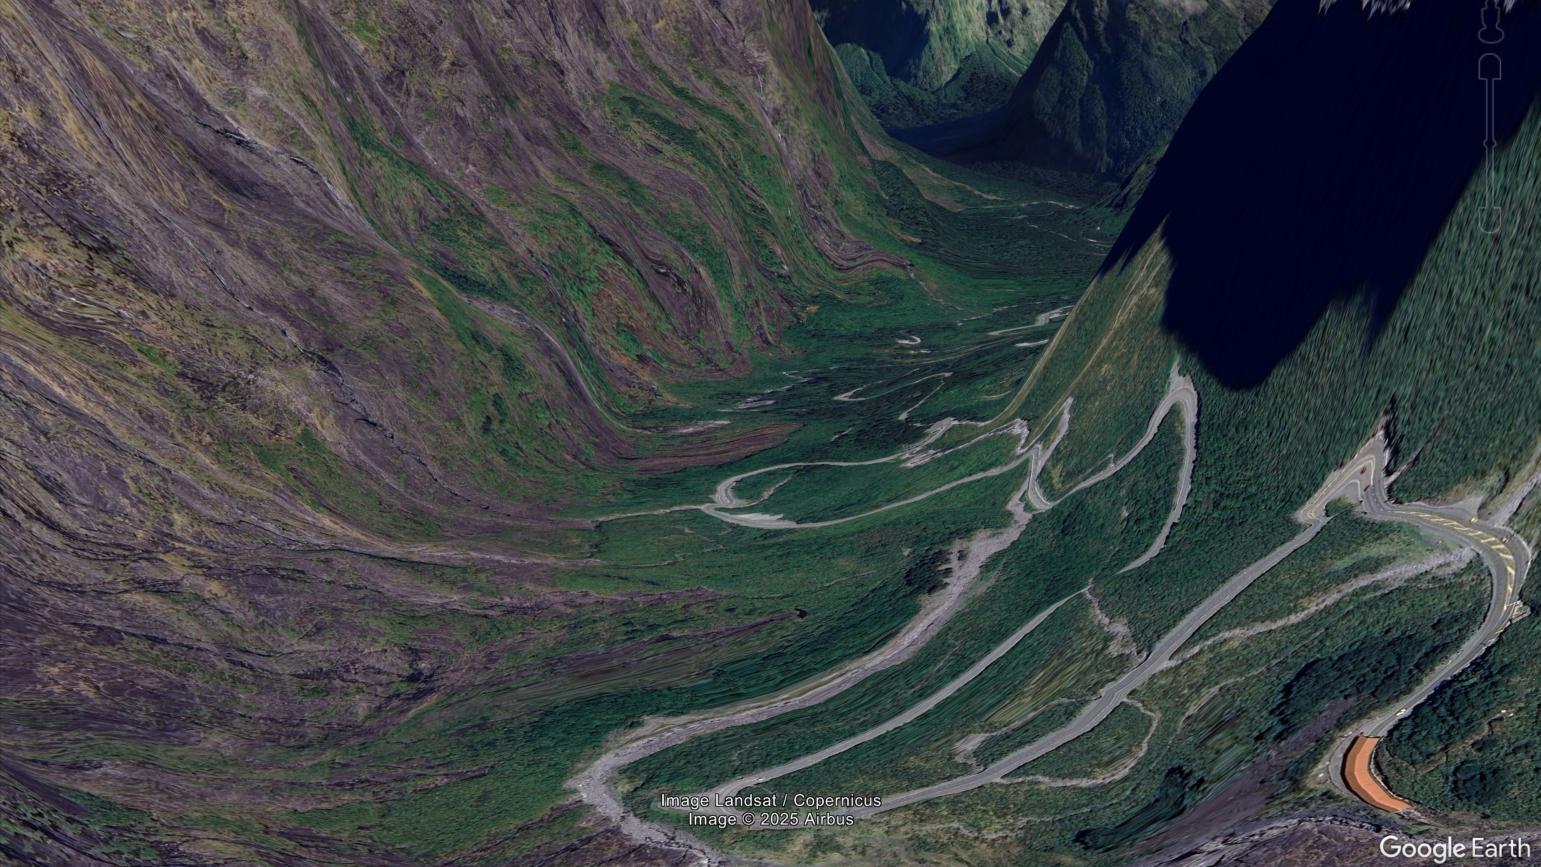
This is SRTM for terrain with modern aerial imagery (what you are used to seeing in Google Earth)

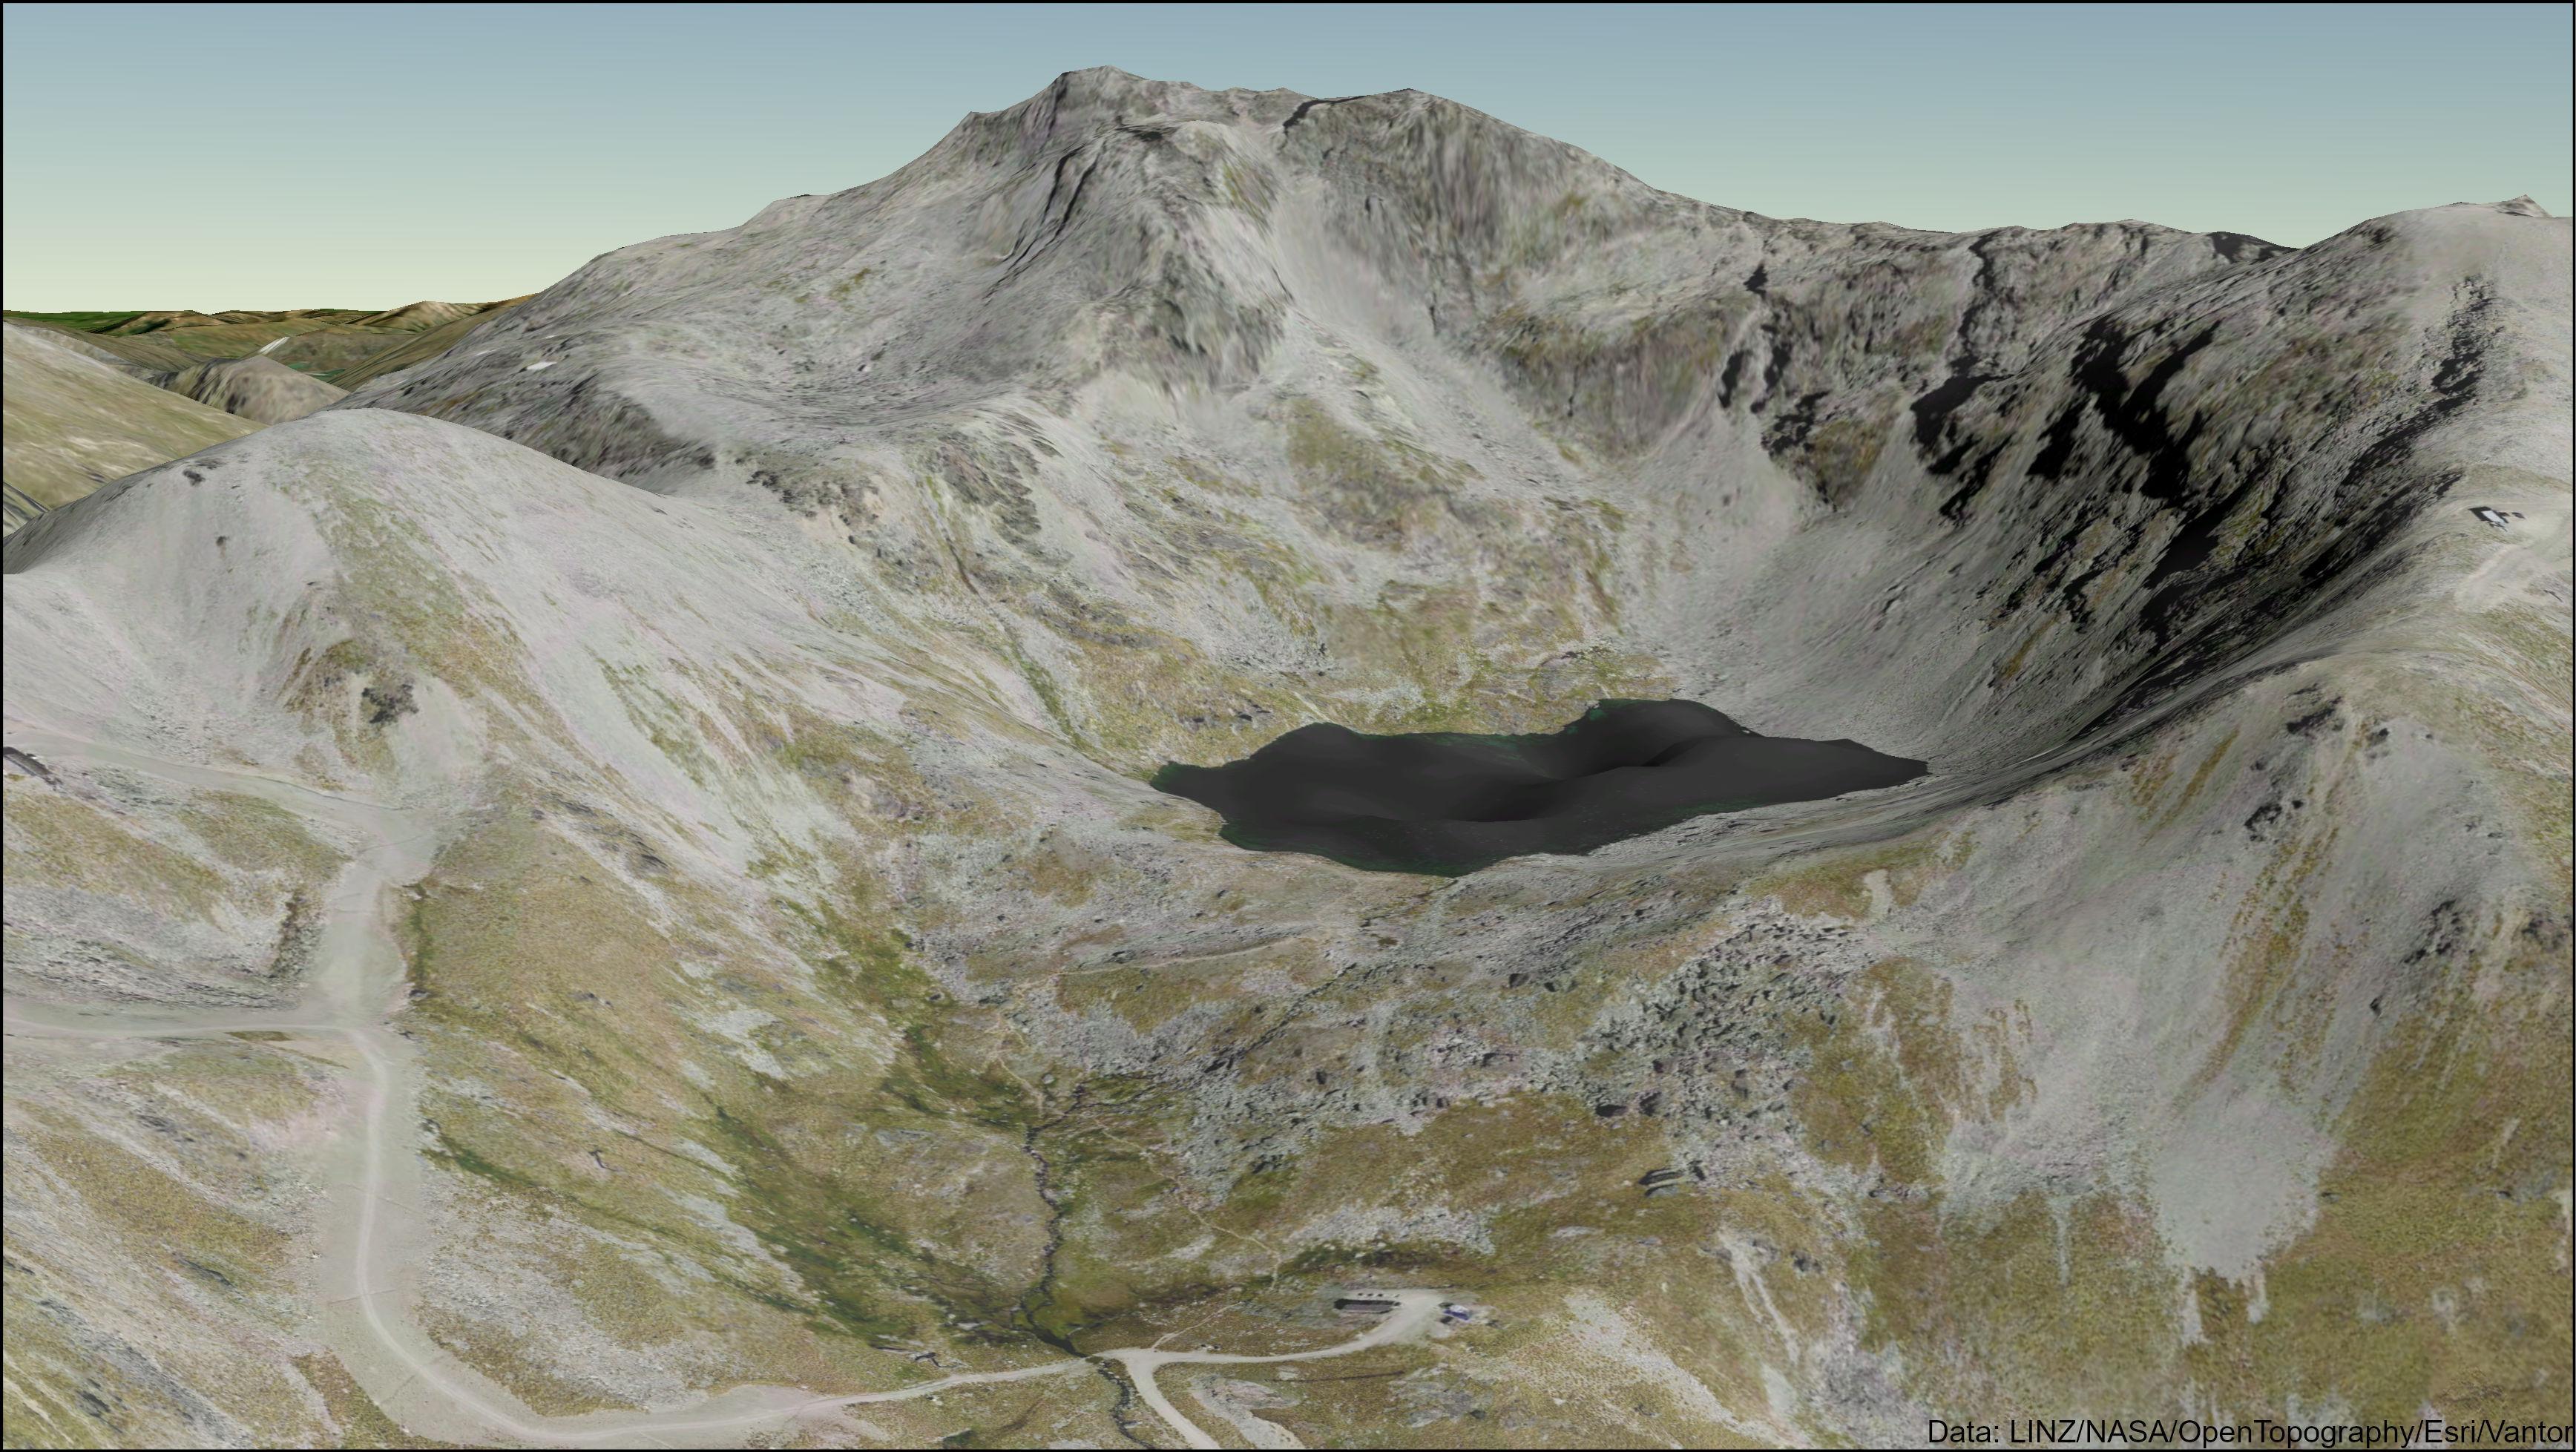

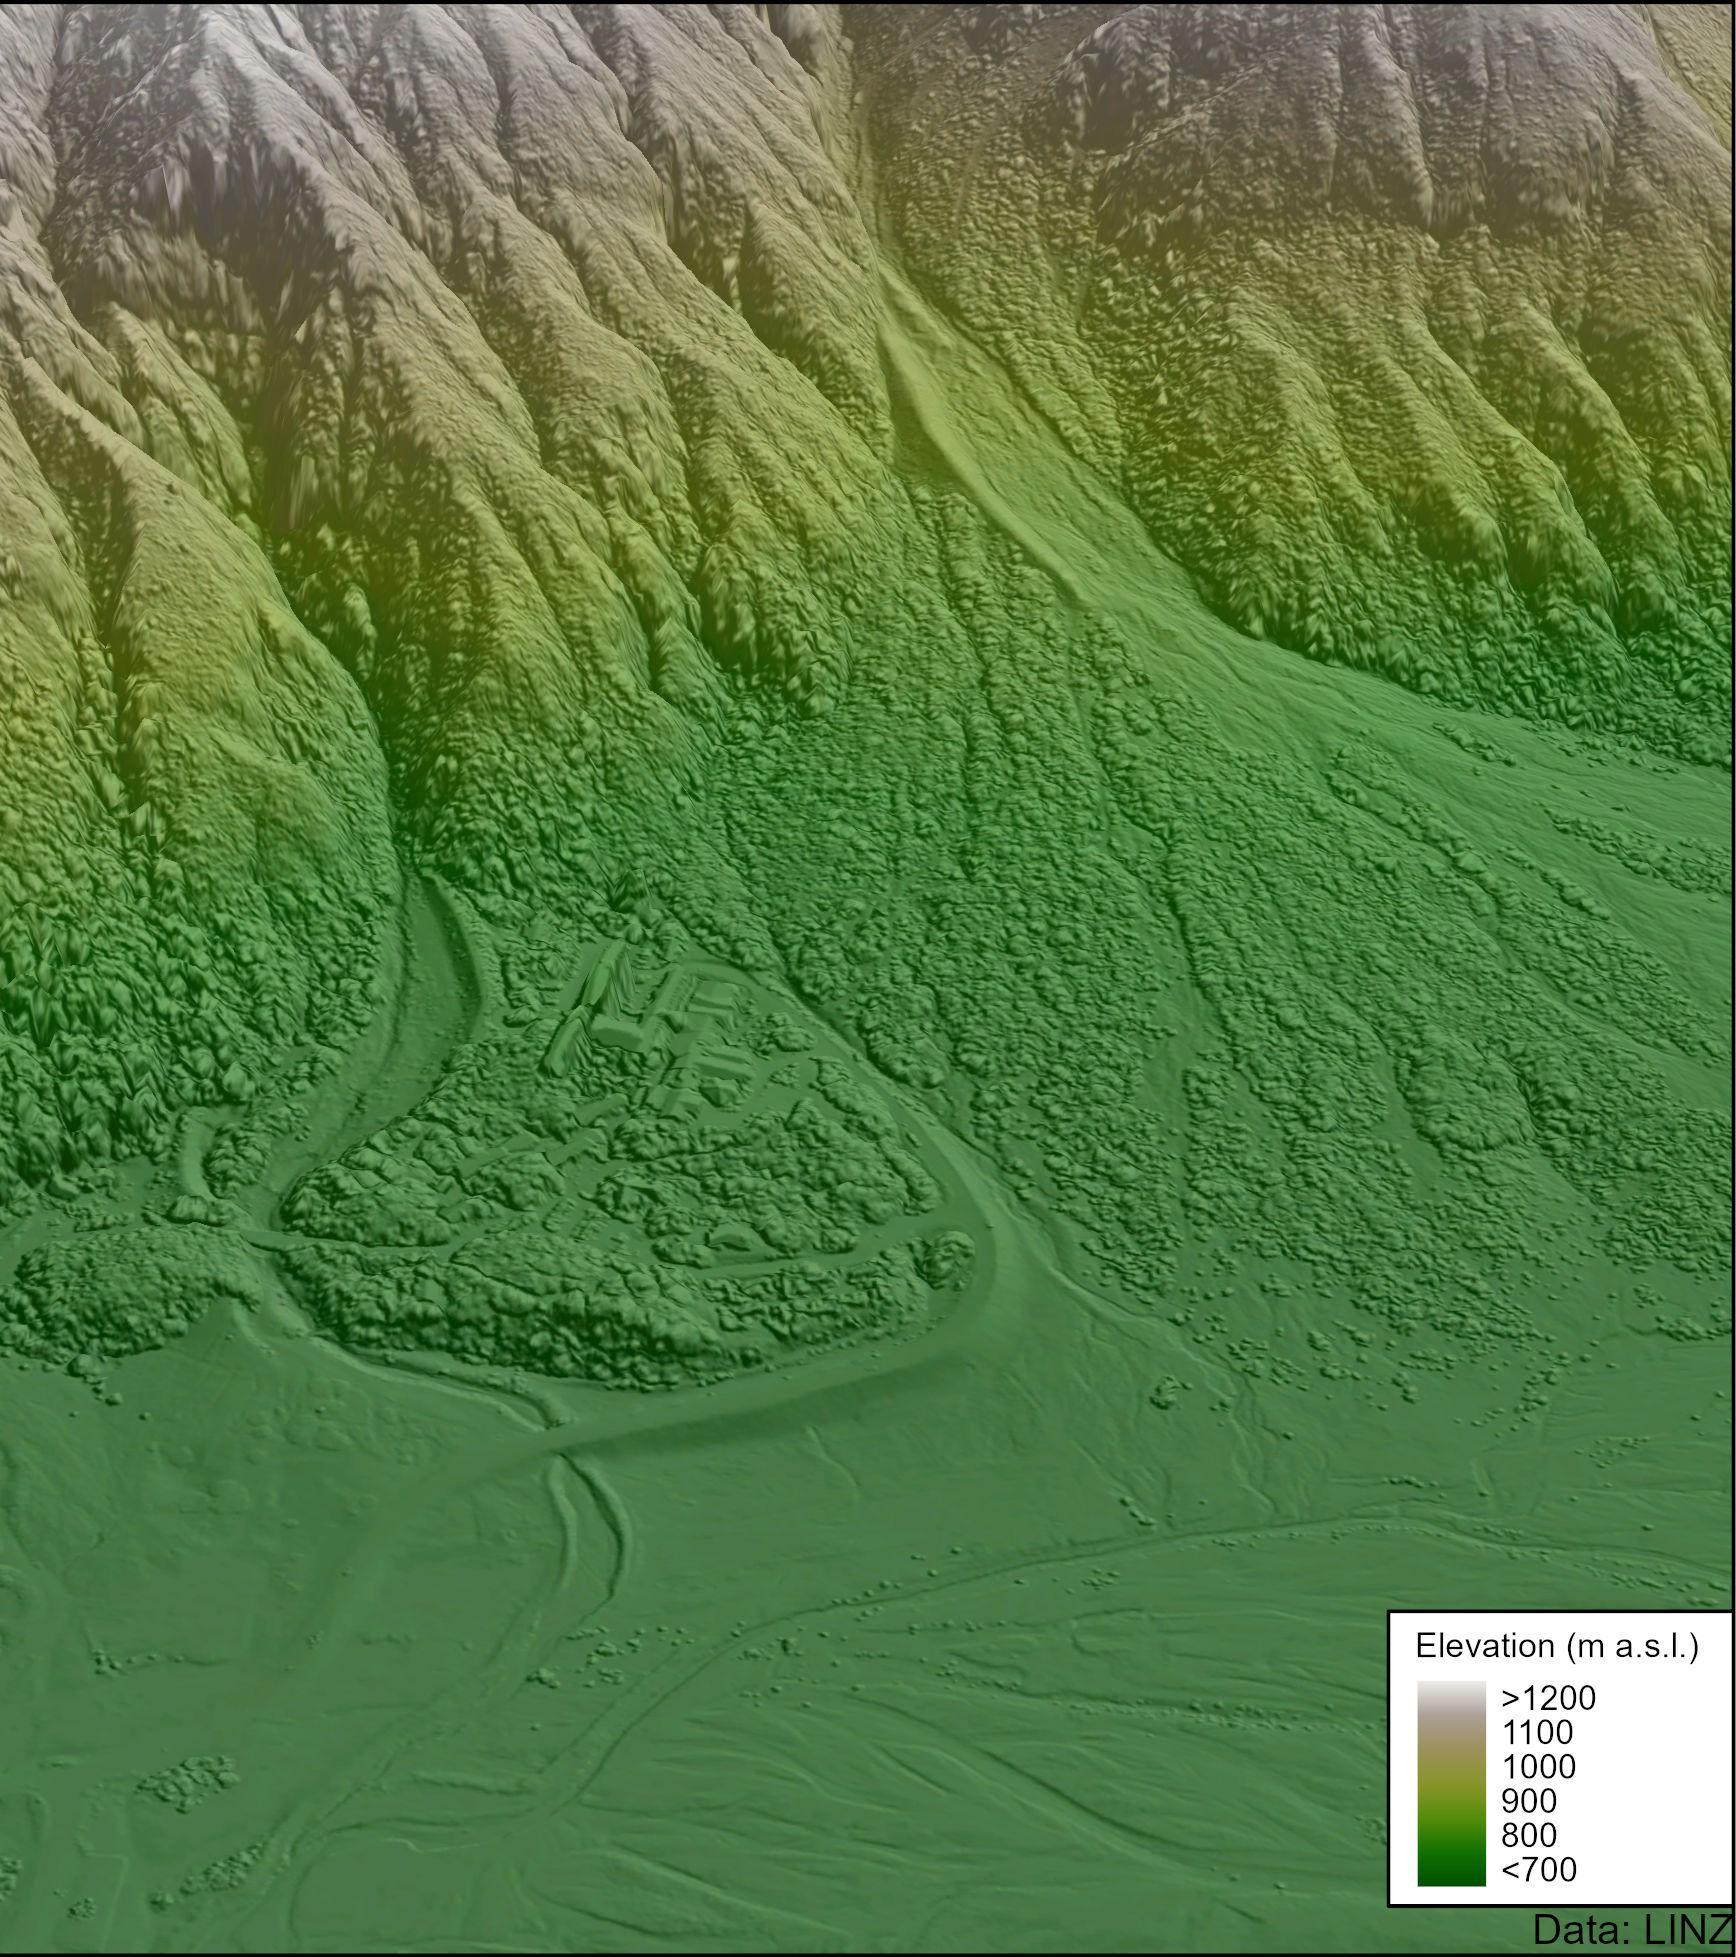
This is the 1m lidar for terrain, where coverage exists


This is 1m lidar for terrain with the difference in slope angle draped on top


SRTM changed the game and has remained with us for over 25 years.
Began as 90m resolution dataset. Newer products have since produced gap-filled 30m res. versions
https://www.jpl.nasa. gov/videos/mappingthe-world/

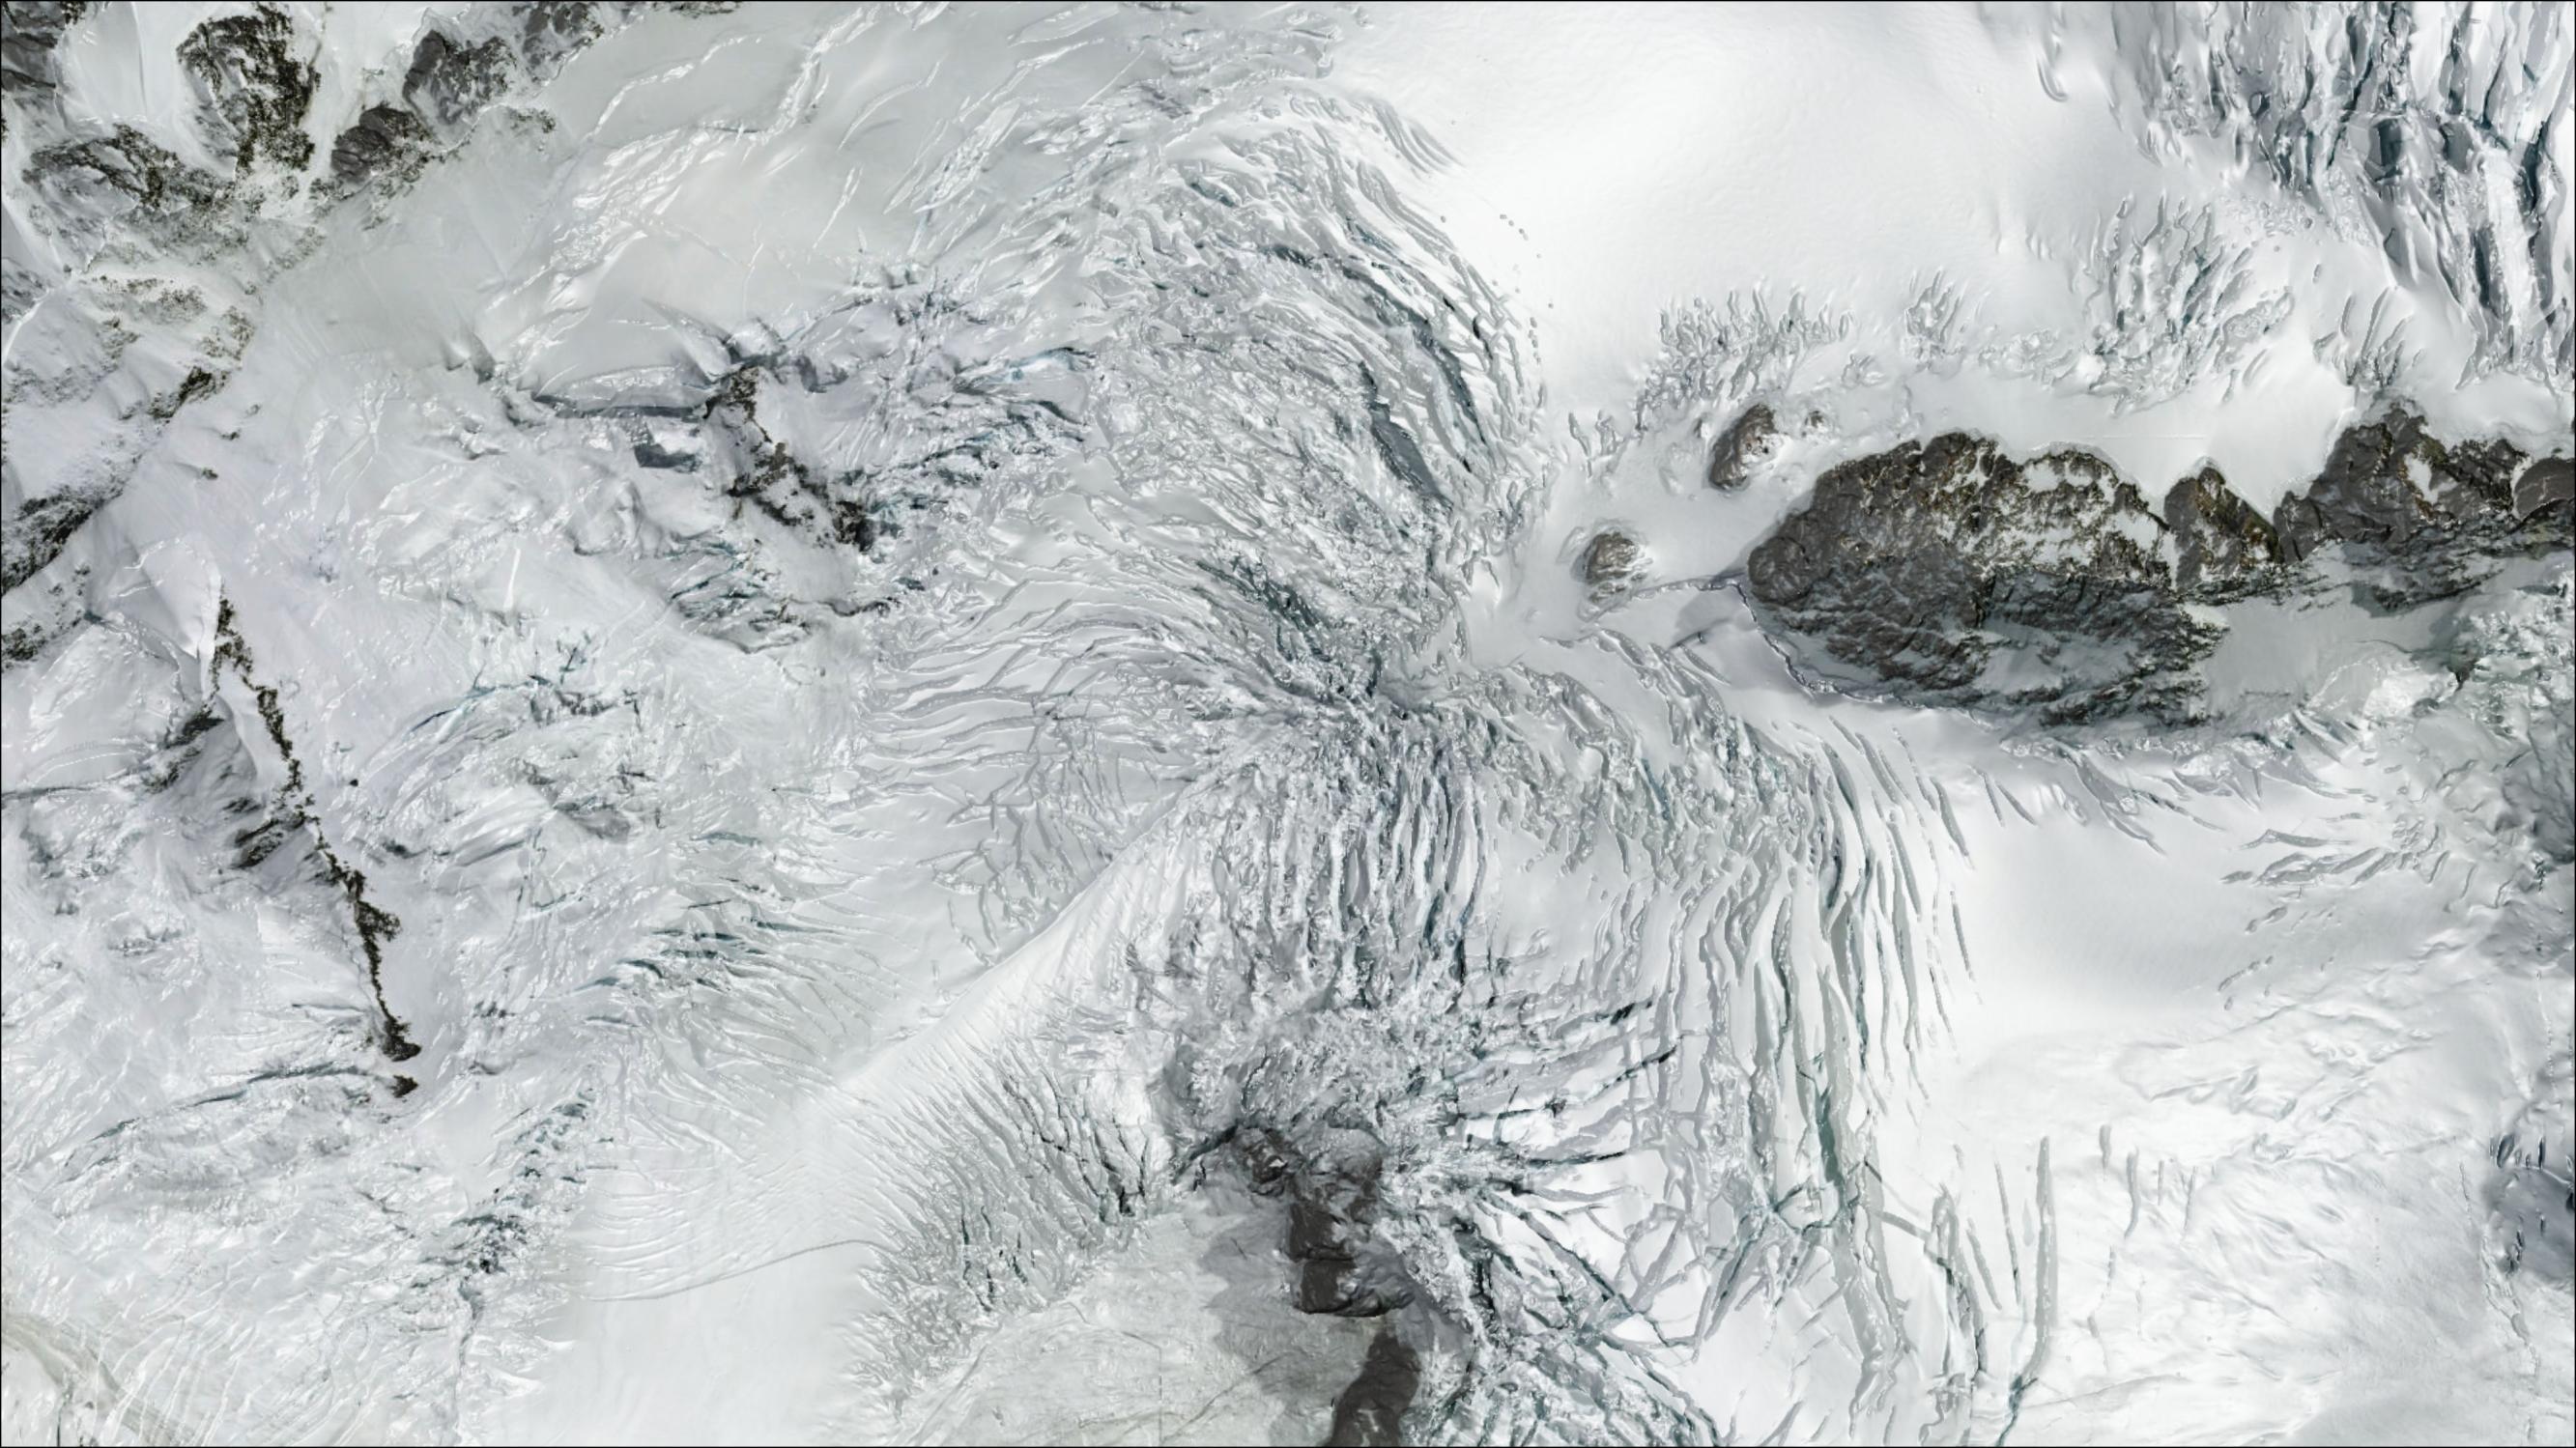
Measuring through clouds is a win in NZ, but Steep terrain complicates mapping
Global elevation
• Resolution/detail
• Coarser (best is about 8m), typically 30m; not all equal
• Age
• Older for the most part; some composites
• Accuracy
• Lower, unassessed locally
• Availability
• Widely and in many tools and stable
Local elevation
• Resolution/detail
• Finer (best is usually 1m) and standard in NZ
• Age
• Mostly within last 10 years
• Accuracy
• Higher, assessed locally
• Availability
• Patchy, only available in some tools but increasingly available


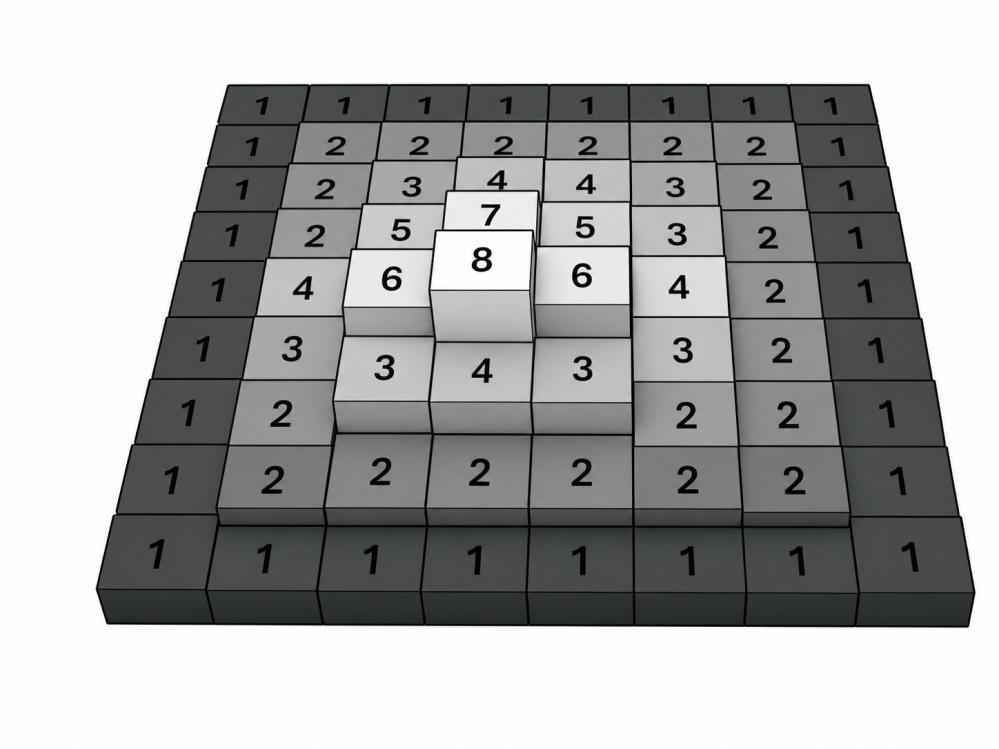

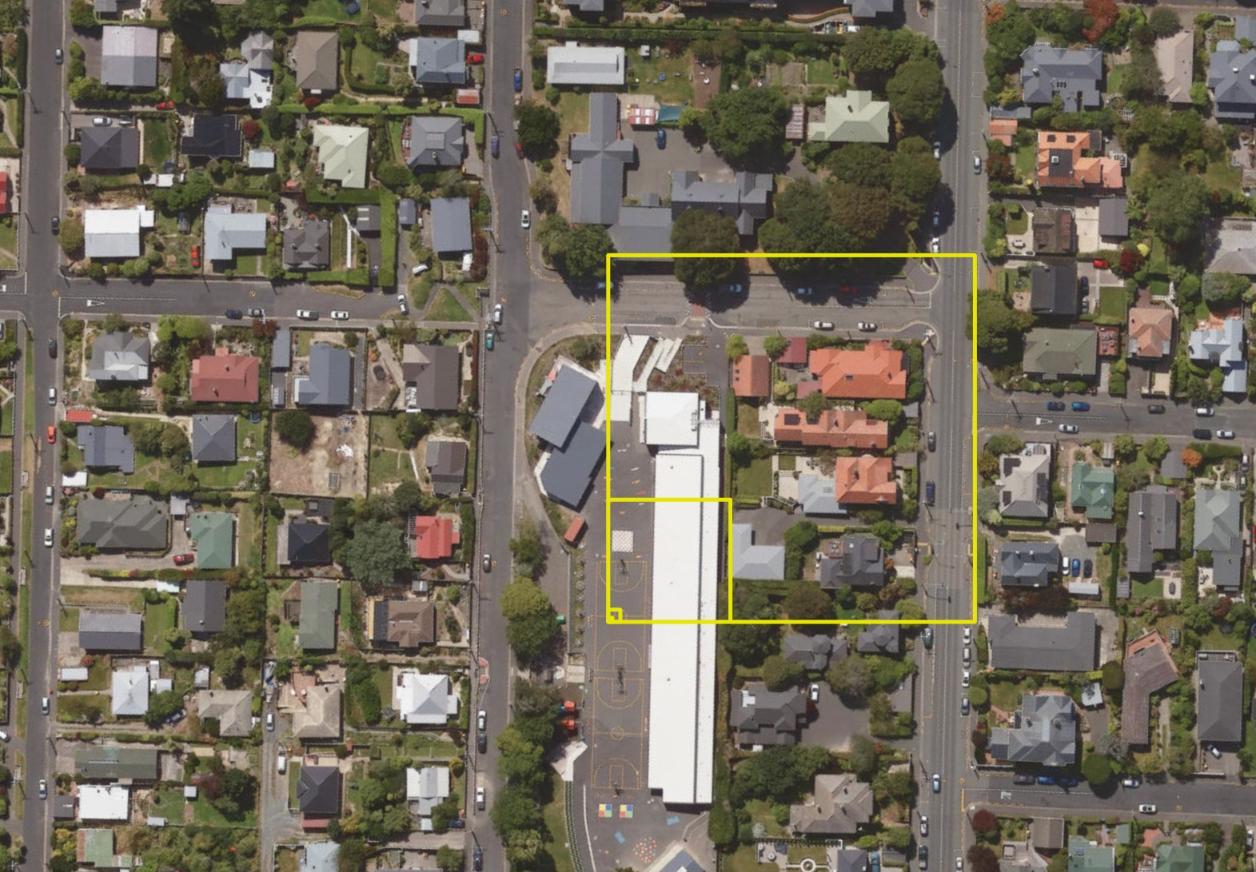
Area used to calculate slope angle
SRTM: 8,100 m2 (90x90m)
1m lidar: 9 m2 (3x3m)
resolution/ 8,100 m2 window

• LINZ 20m contours
• Captured in 1980s with aerial photogrammetry, small updates
• SRTM
• Captured Feb 11-22, 2000
• Established basis of Google Earth
• LINZ 1m lidar
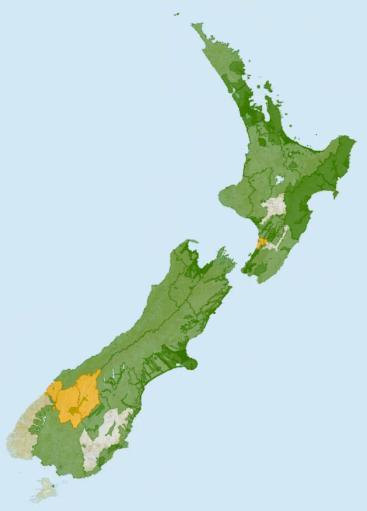
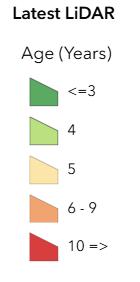
• Captured 20132026
• Standardised
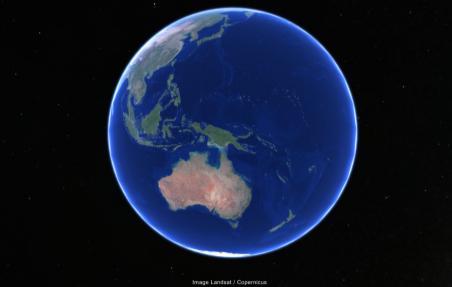
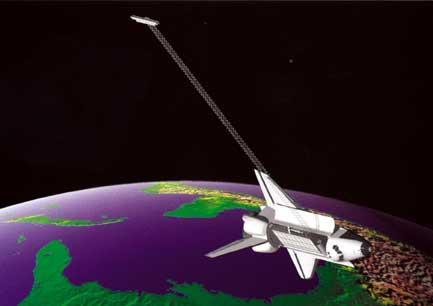
• Other EO data
• Captured 1990s-ongoing (e.g. Matariki)

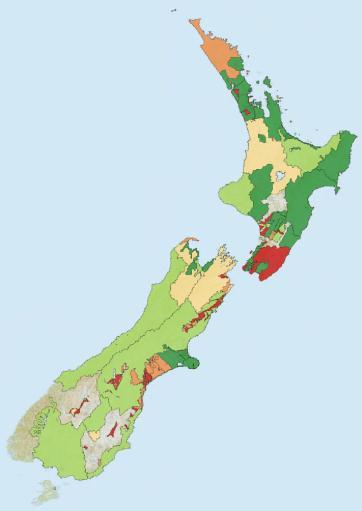
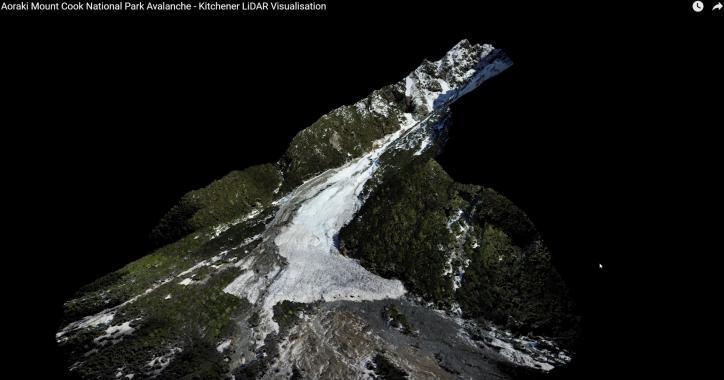
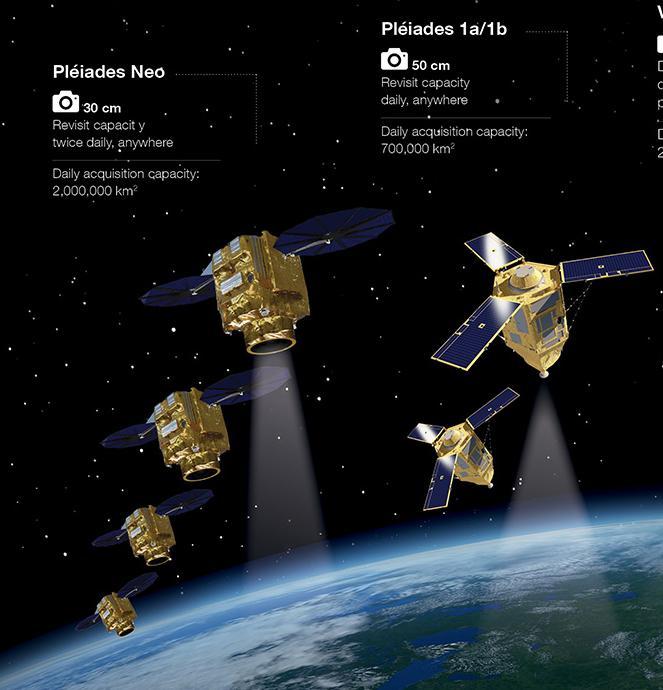

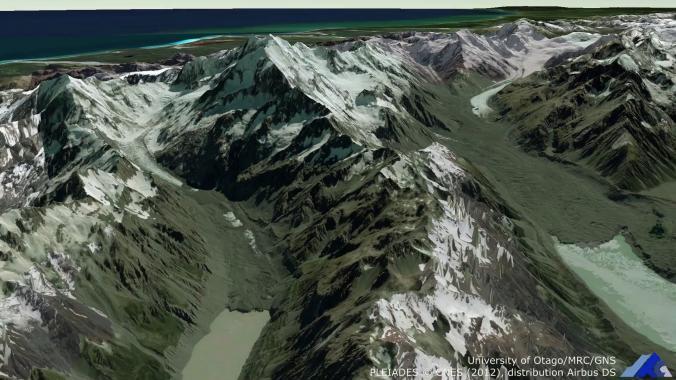
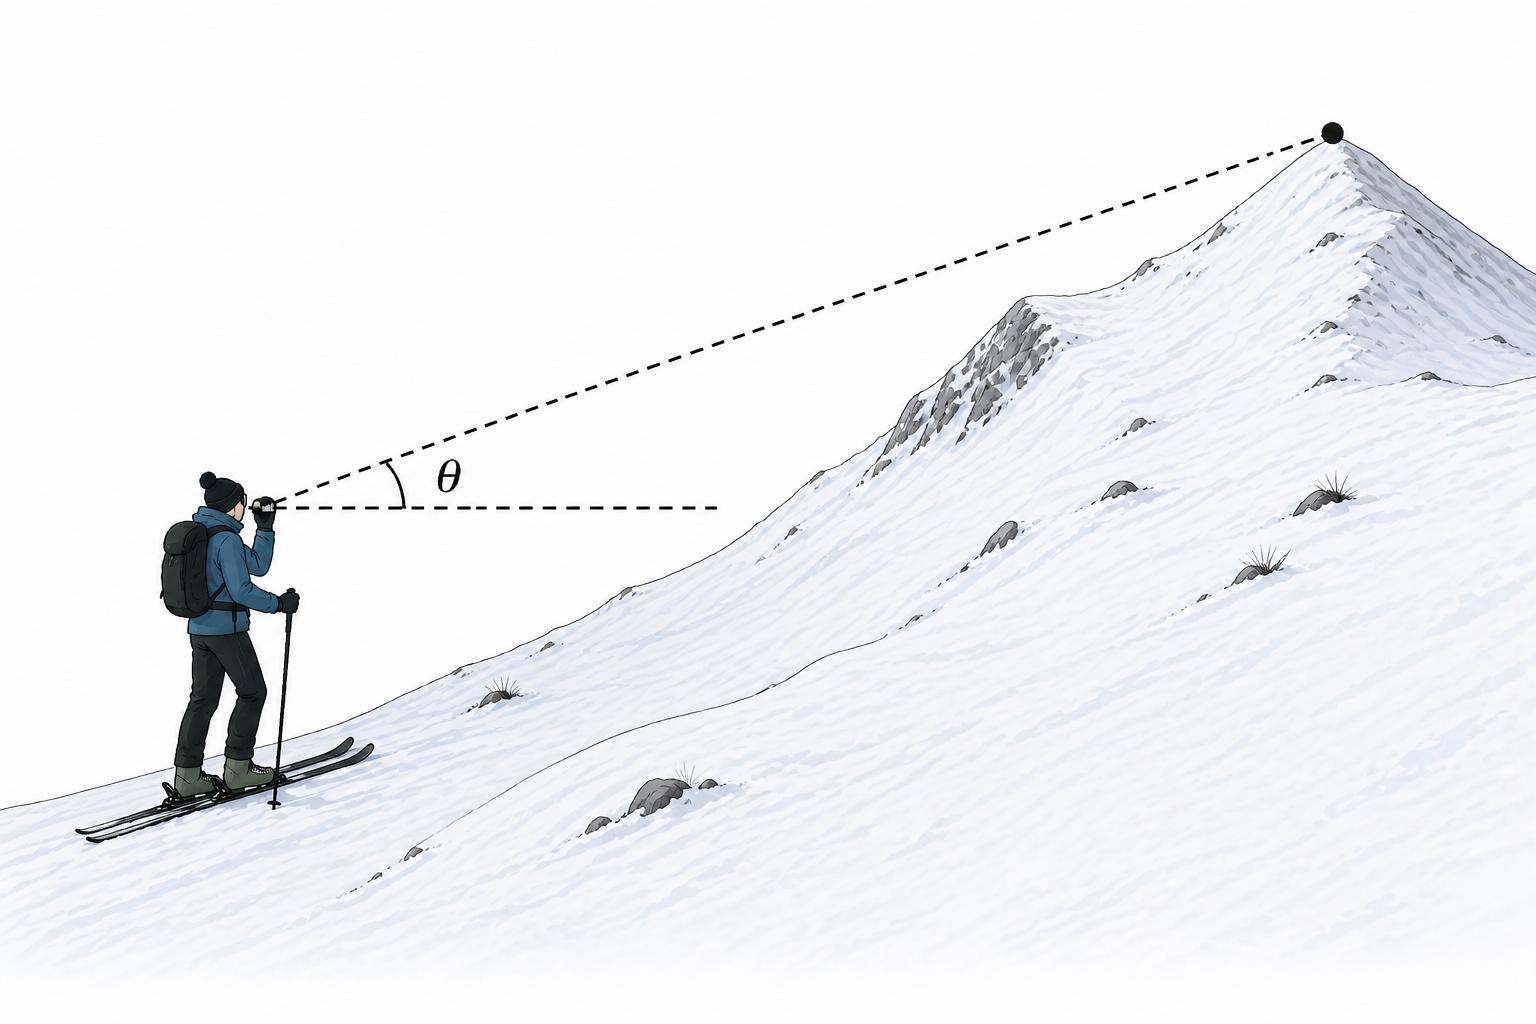
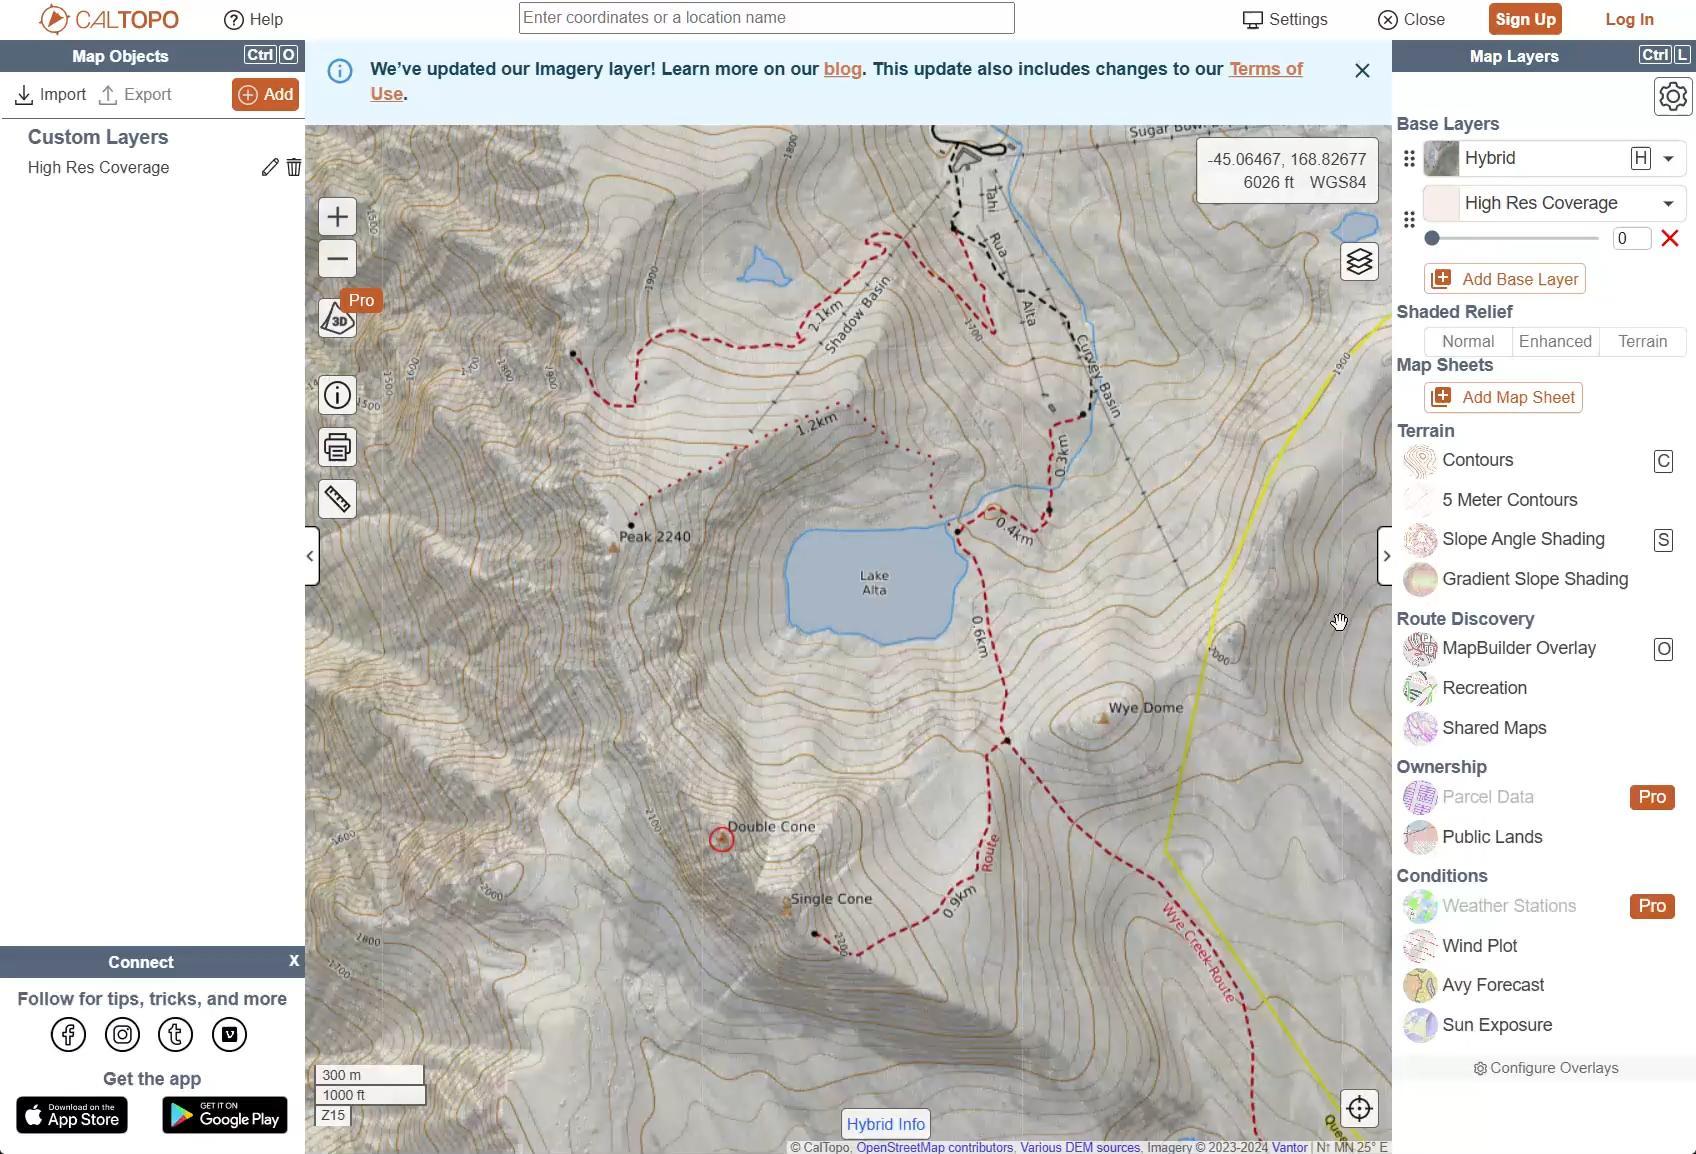
3. What you will use the data for matters
Field measurements are imprecise; a conversation starter | Trip planning with various data sources makes sense.
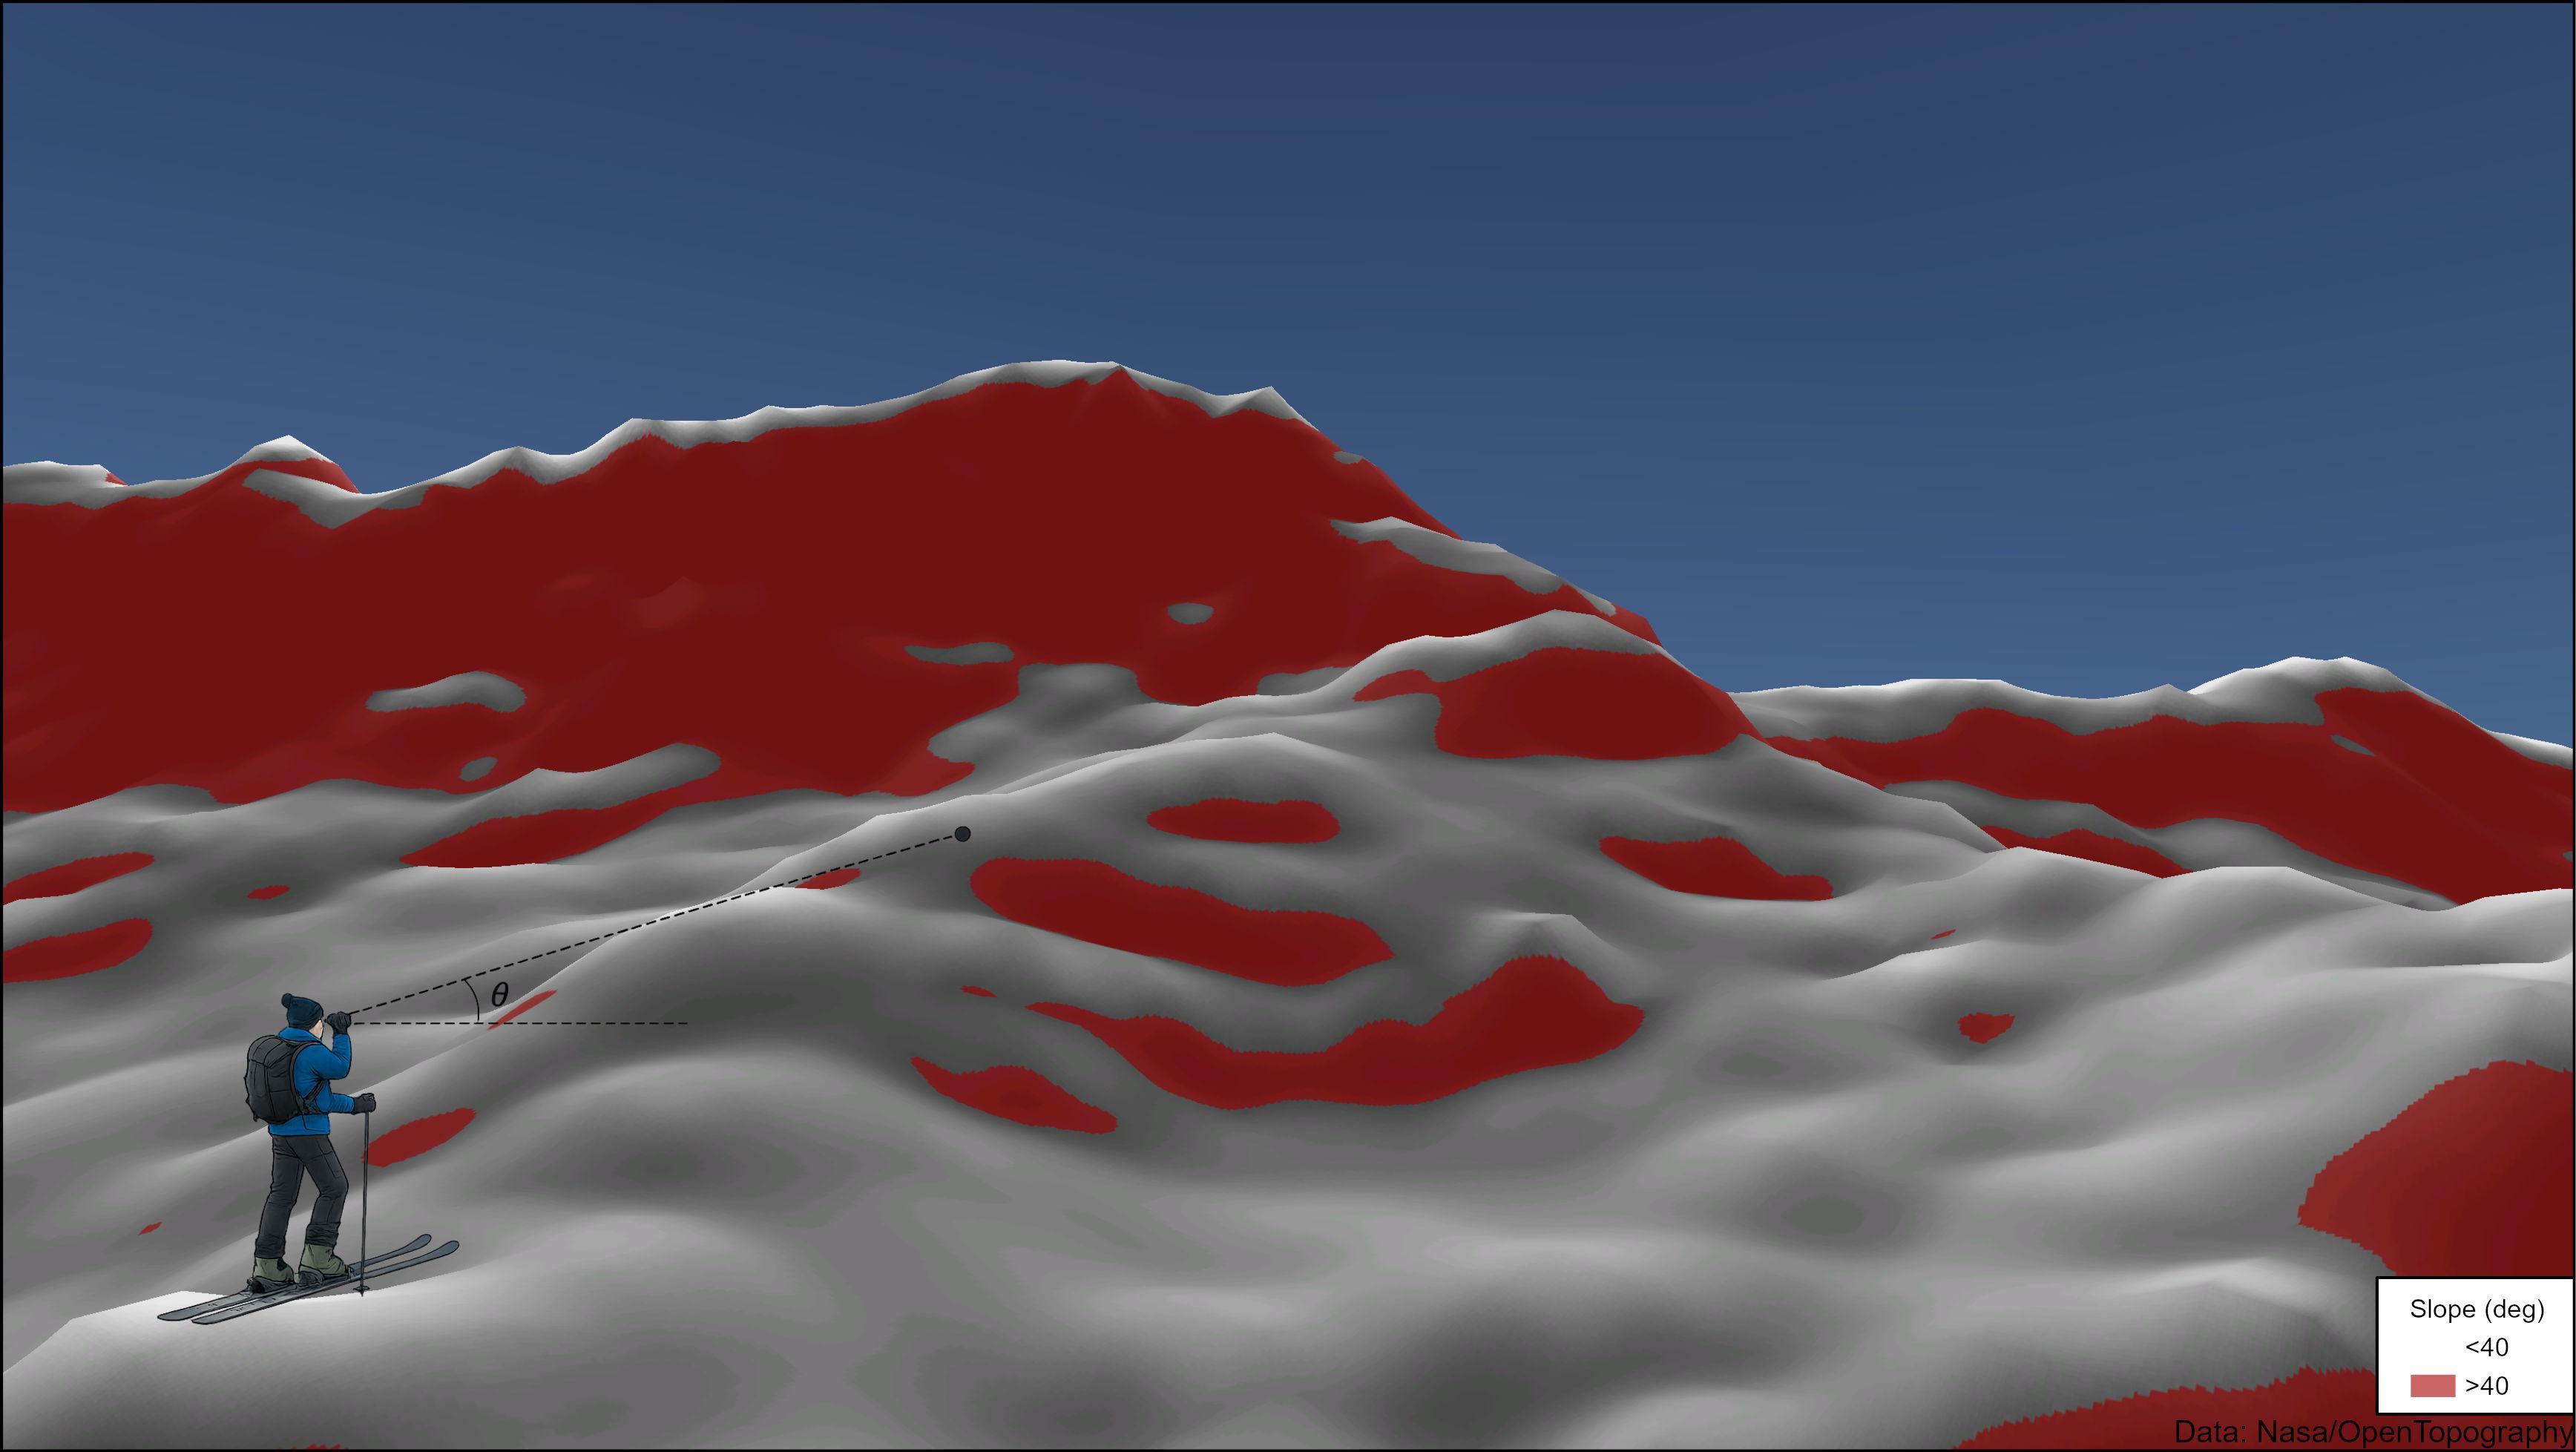
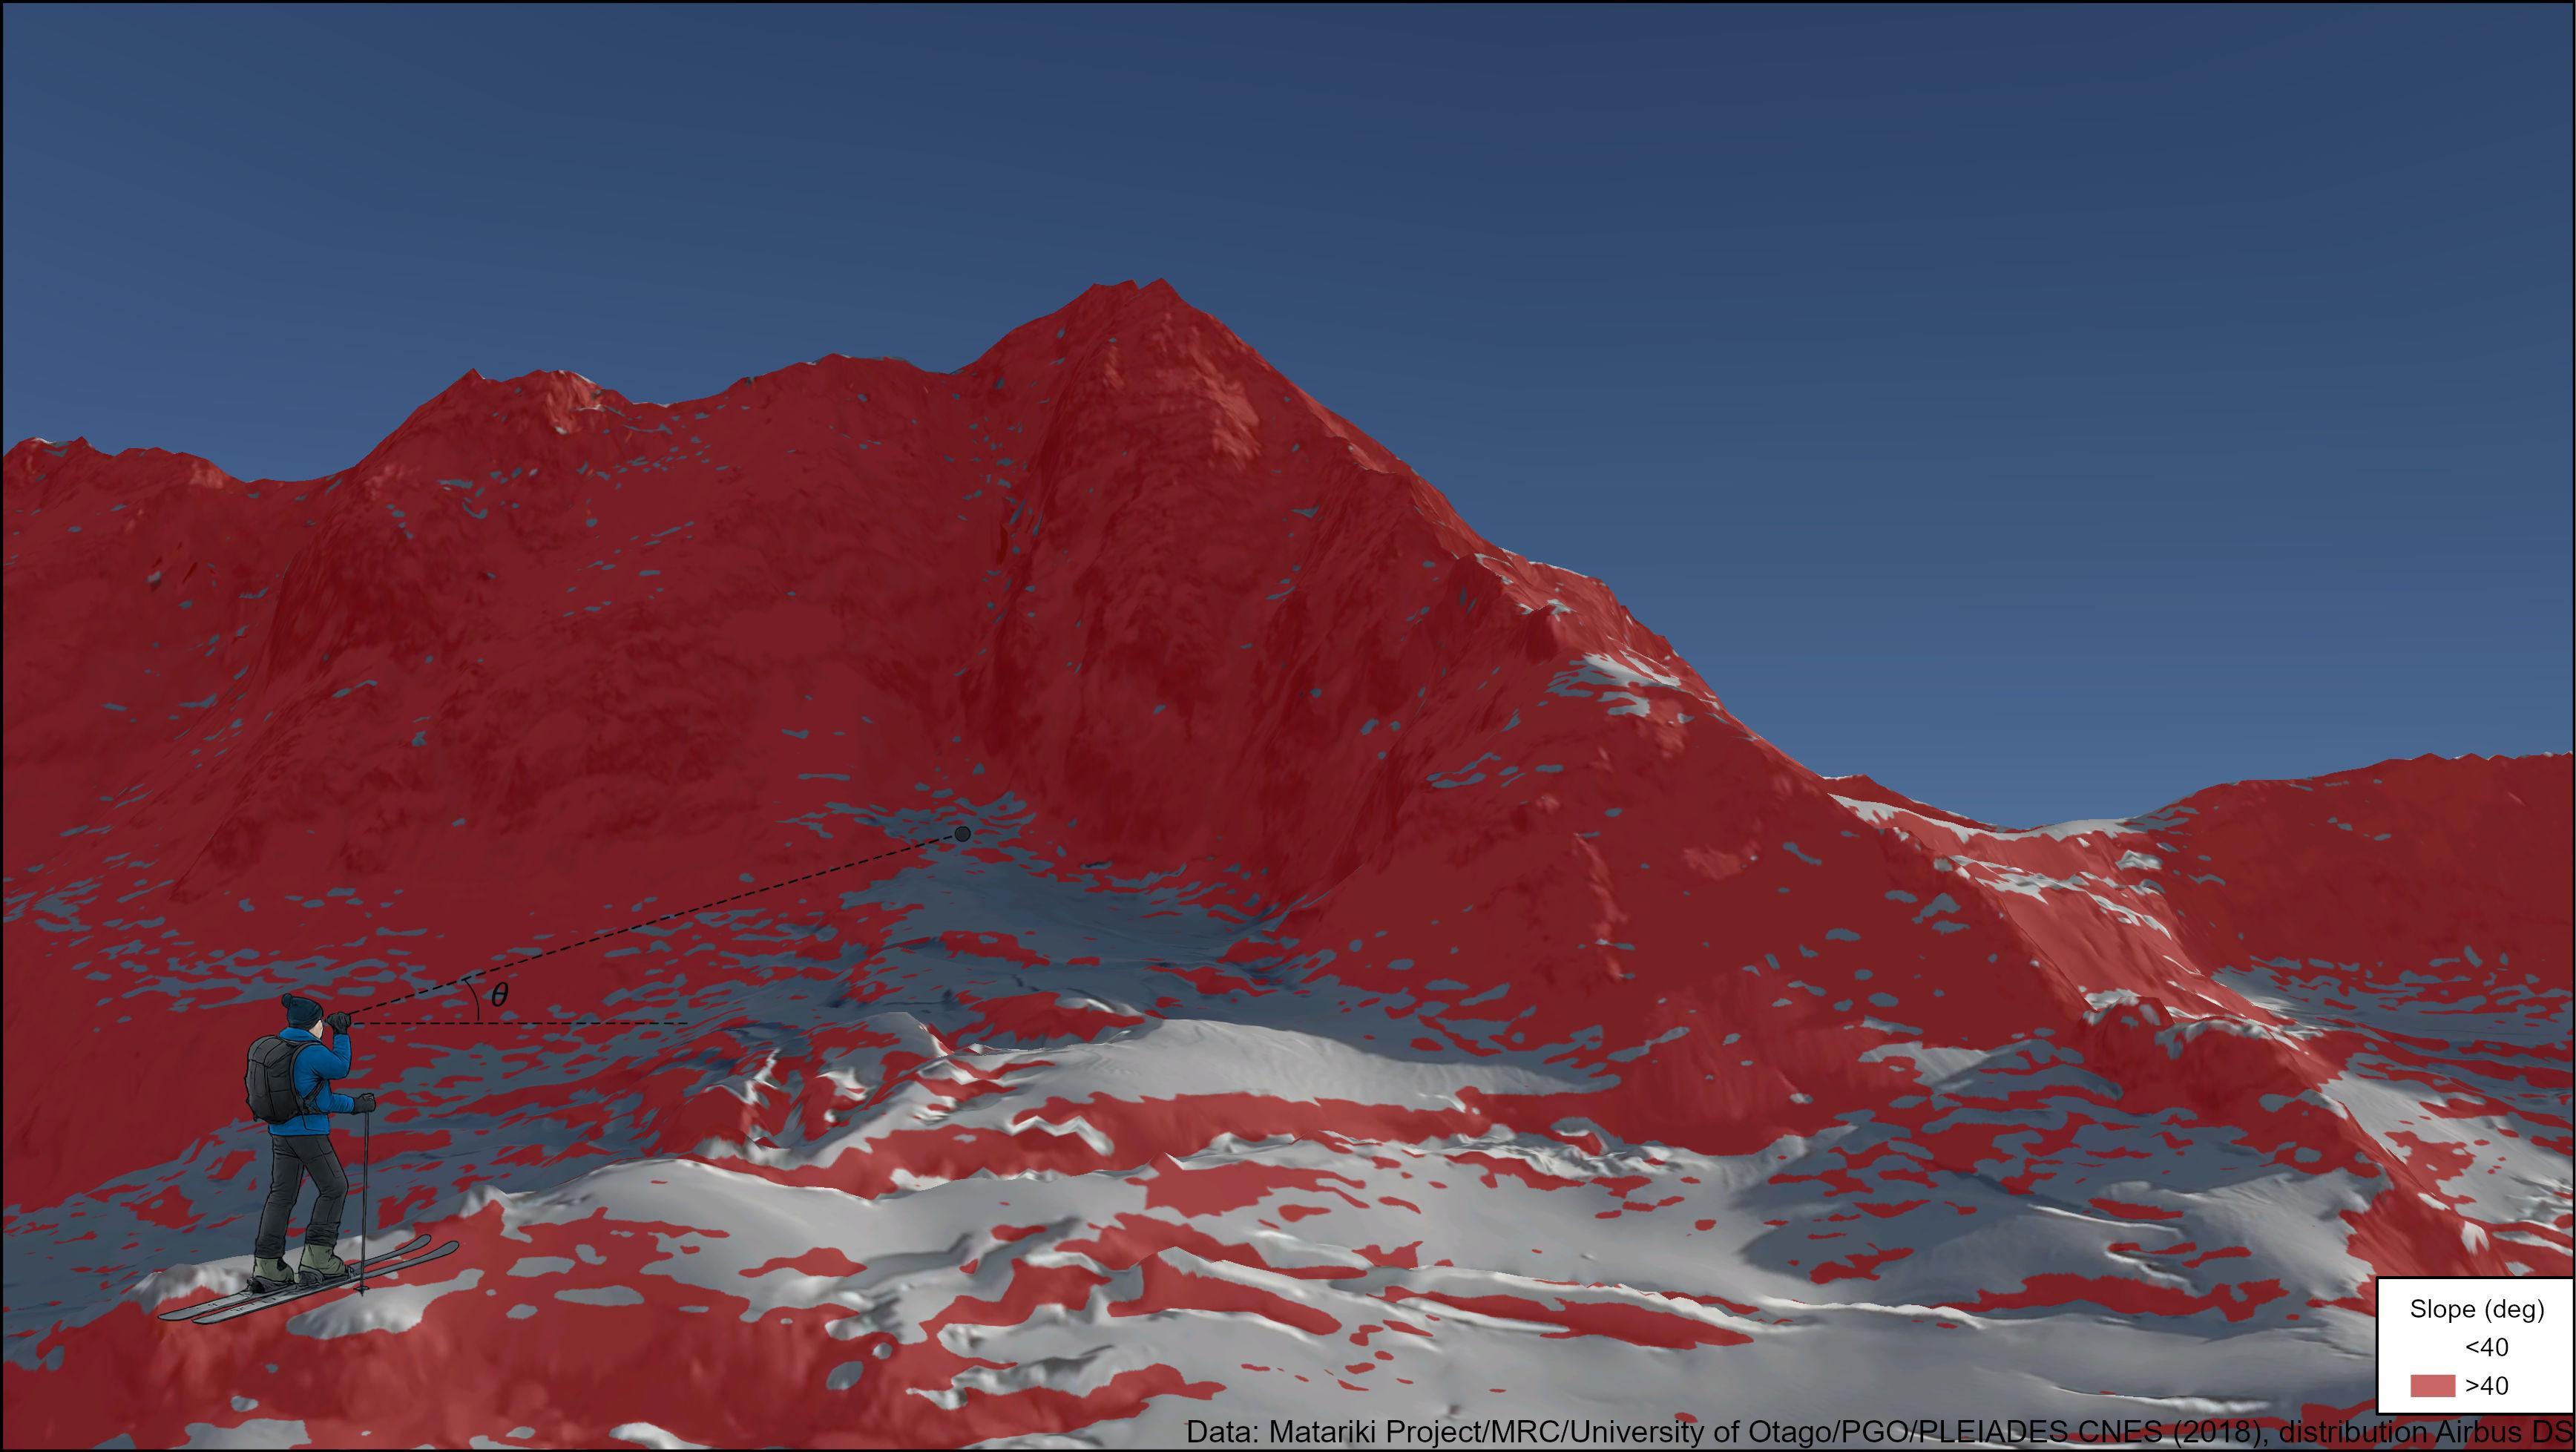
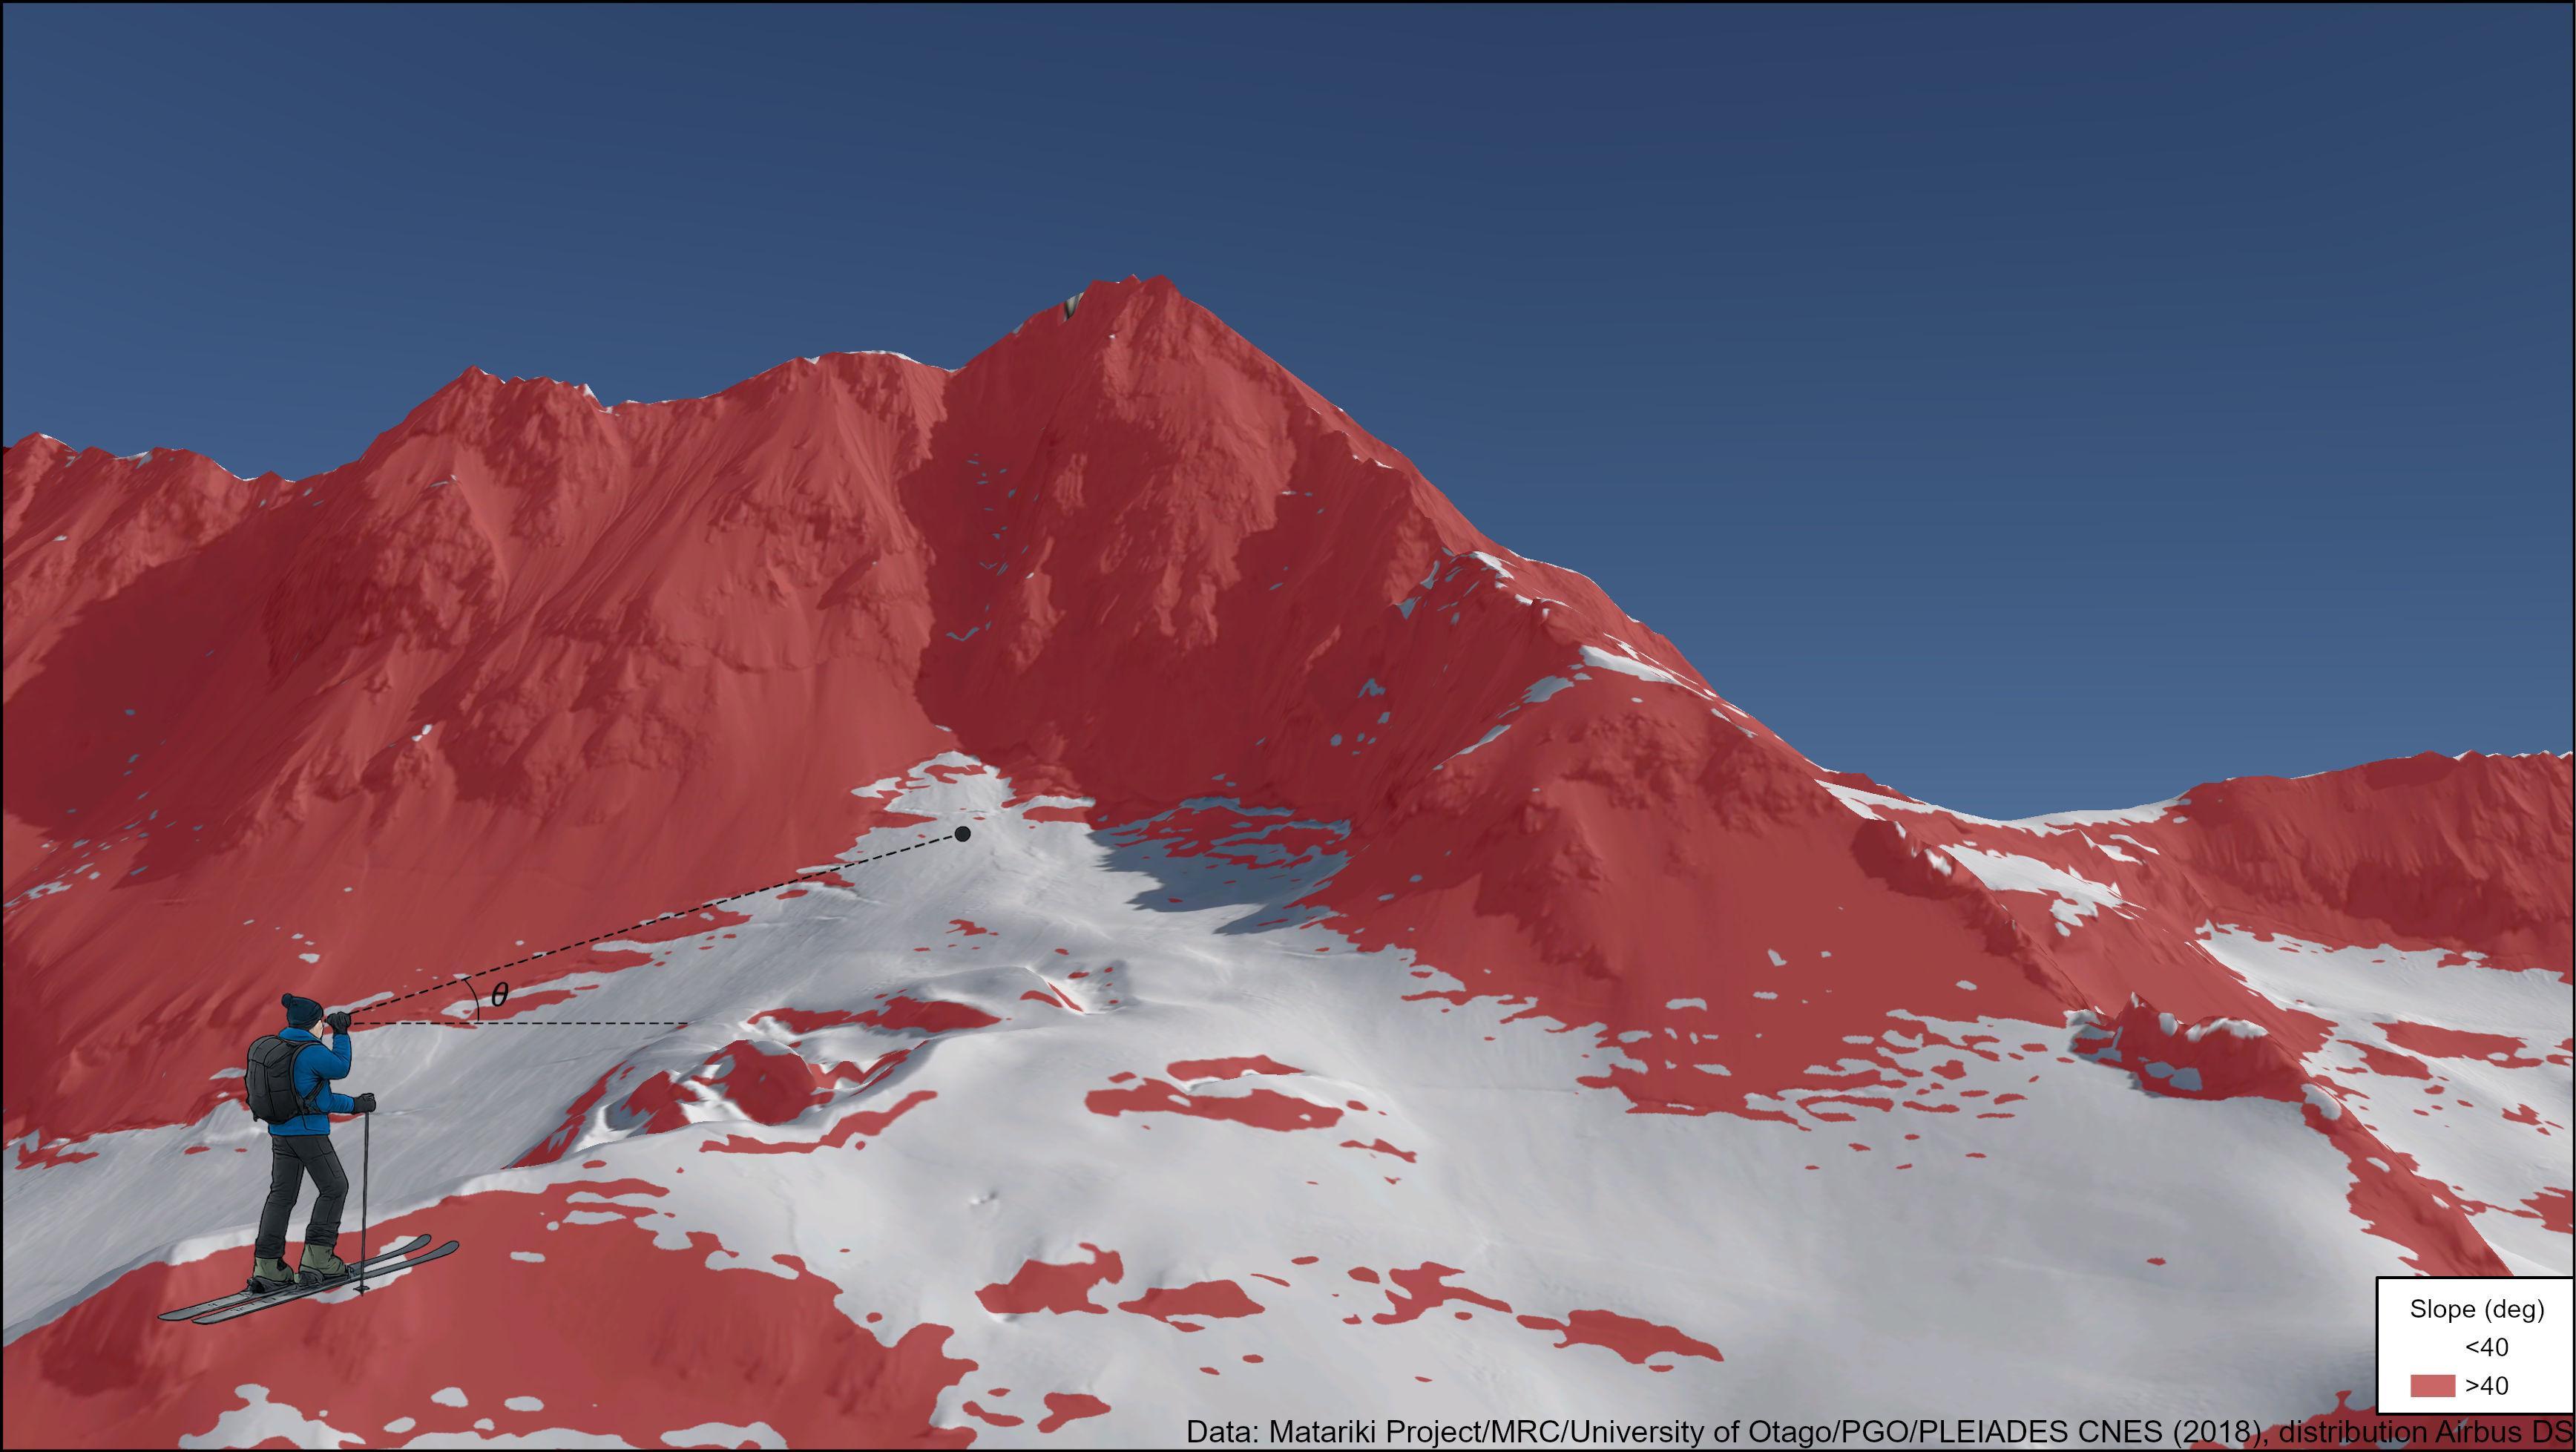
It is hard to ‘unsee’ the red color on the map.
Once a map layer is provided decision making may change
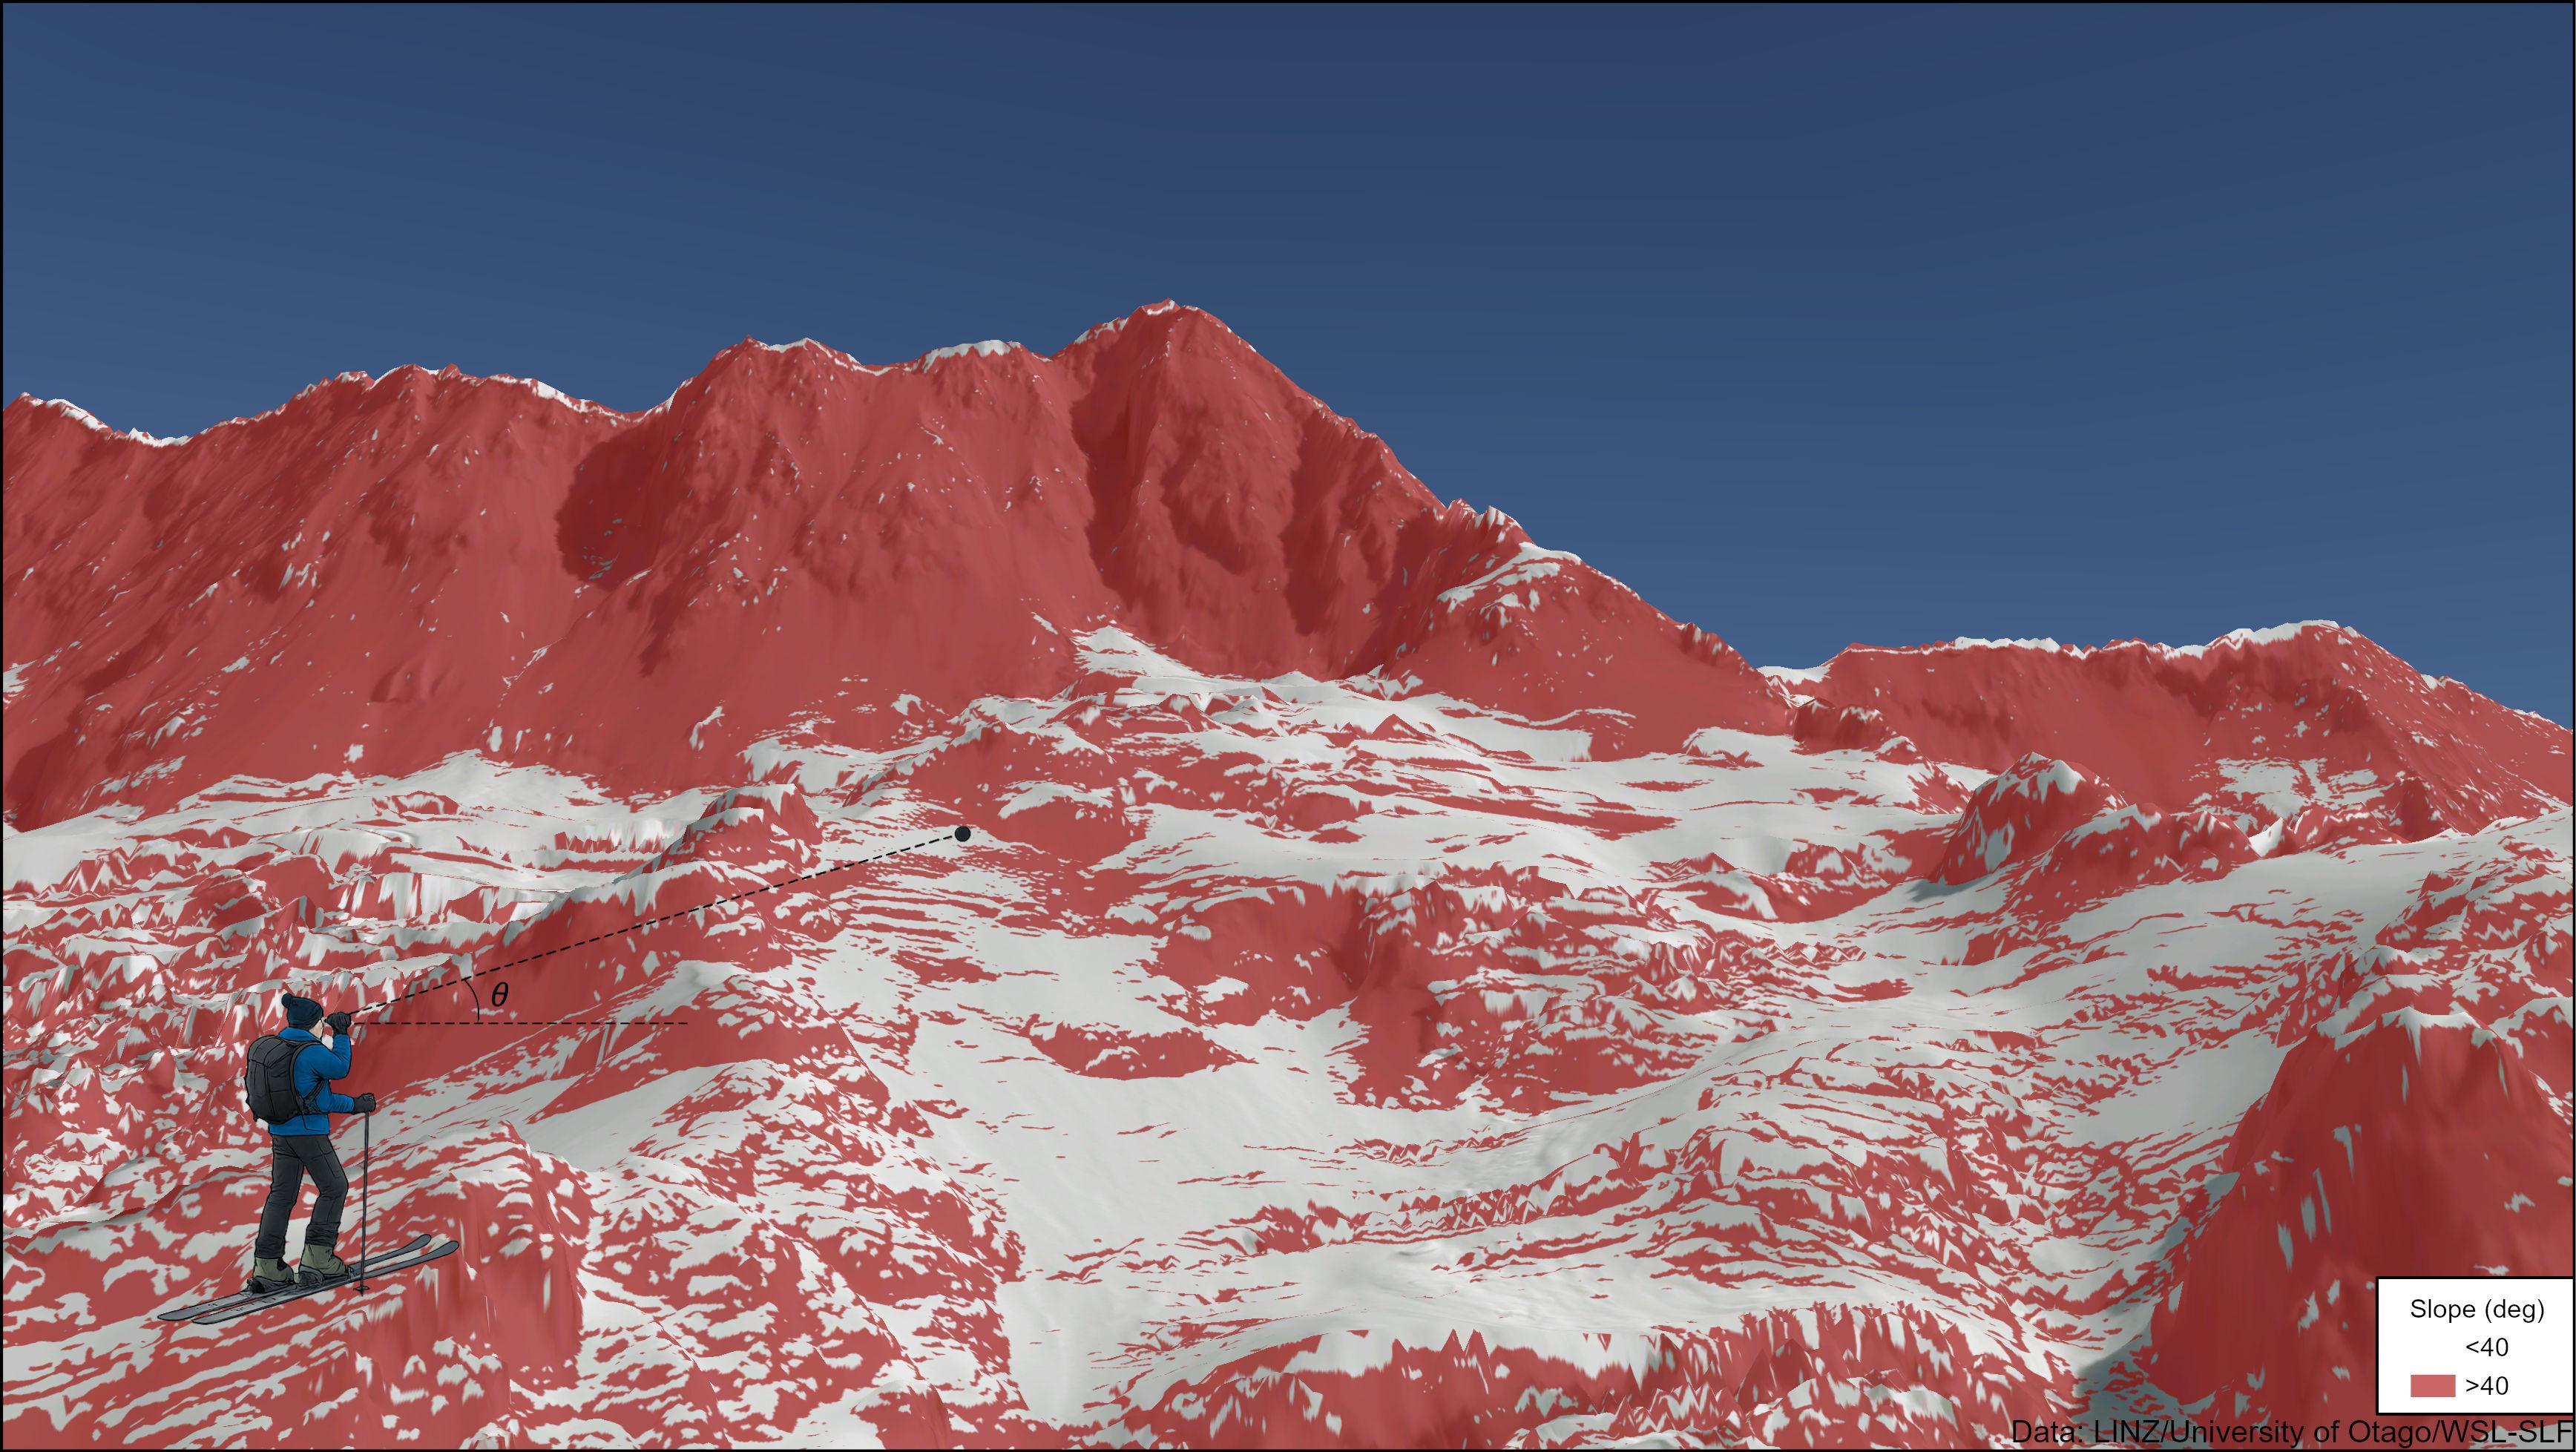
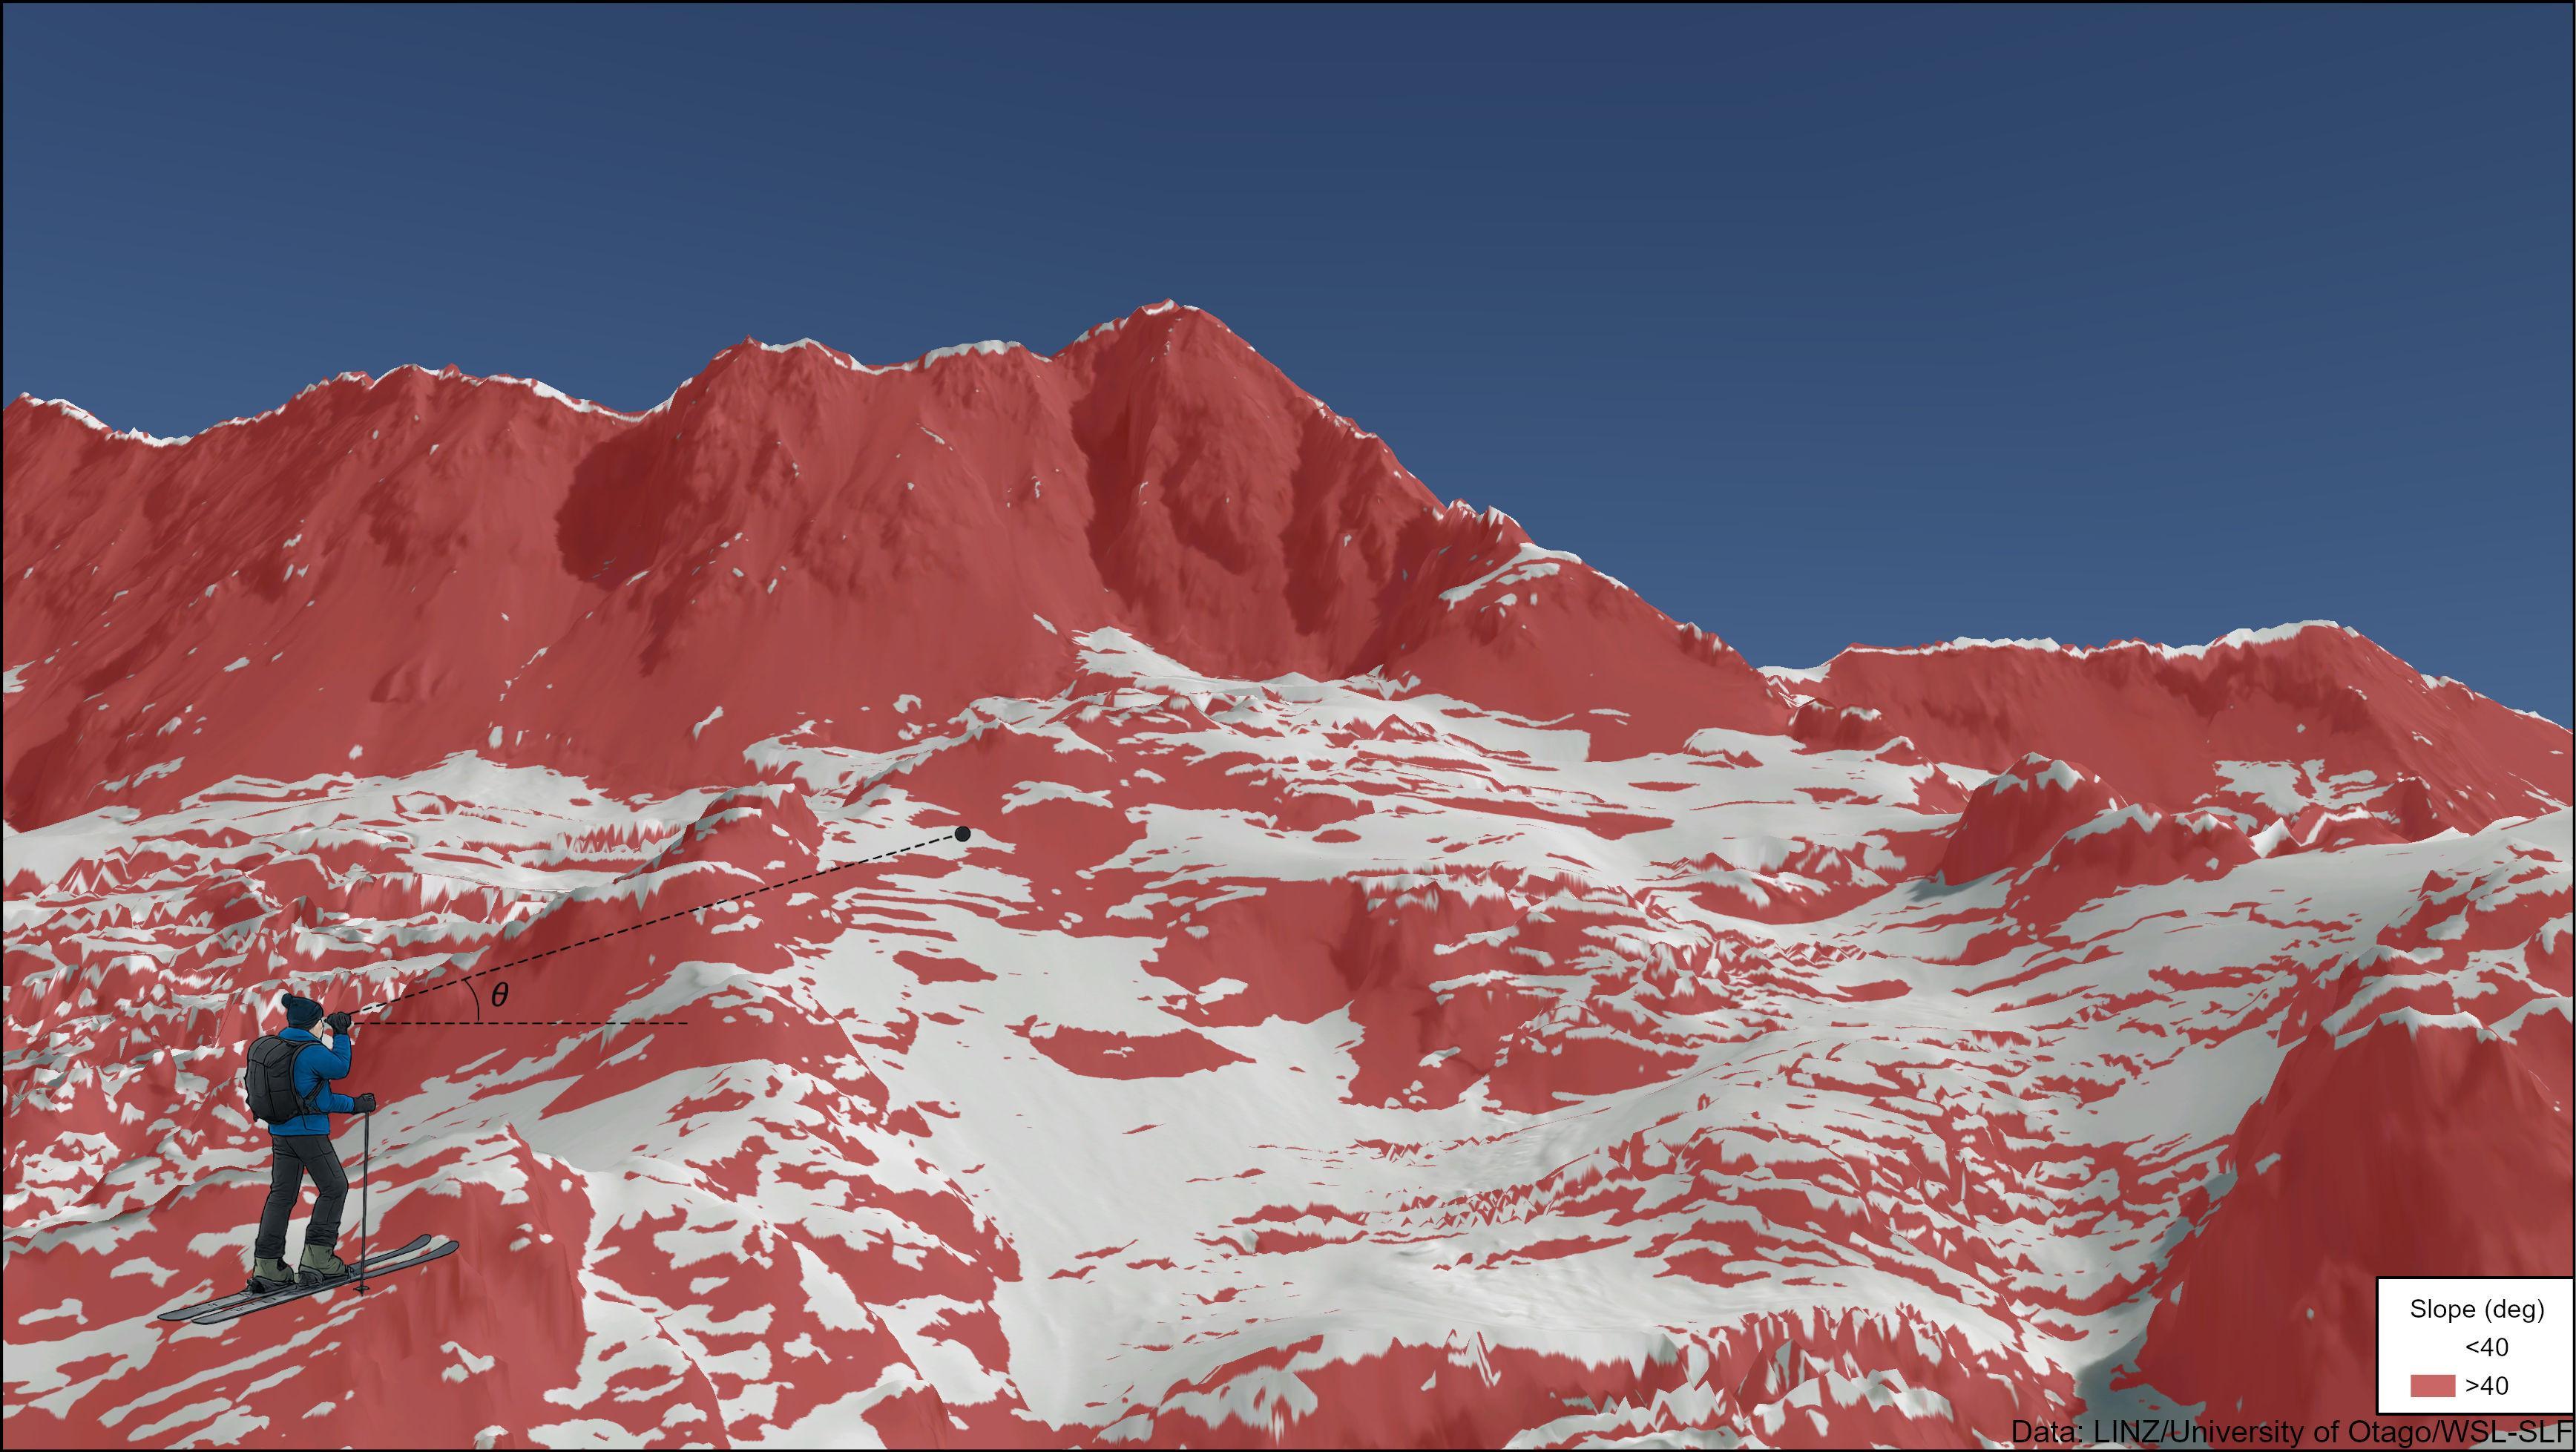
Once a map is provided decision making may change This 1m map of slope angle is over-resolved.
This 5m map of slope angle is better.
Even with the same sensor/mapping technology can generate different maps
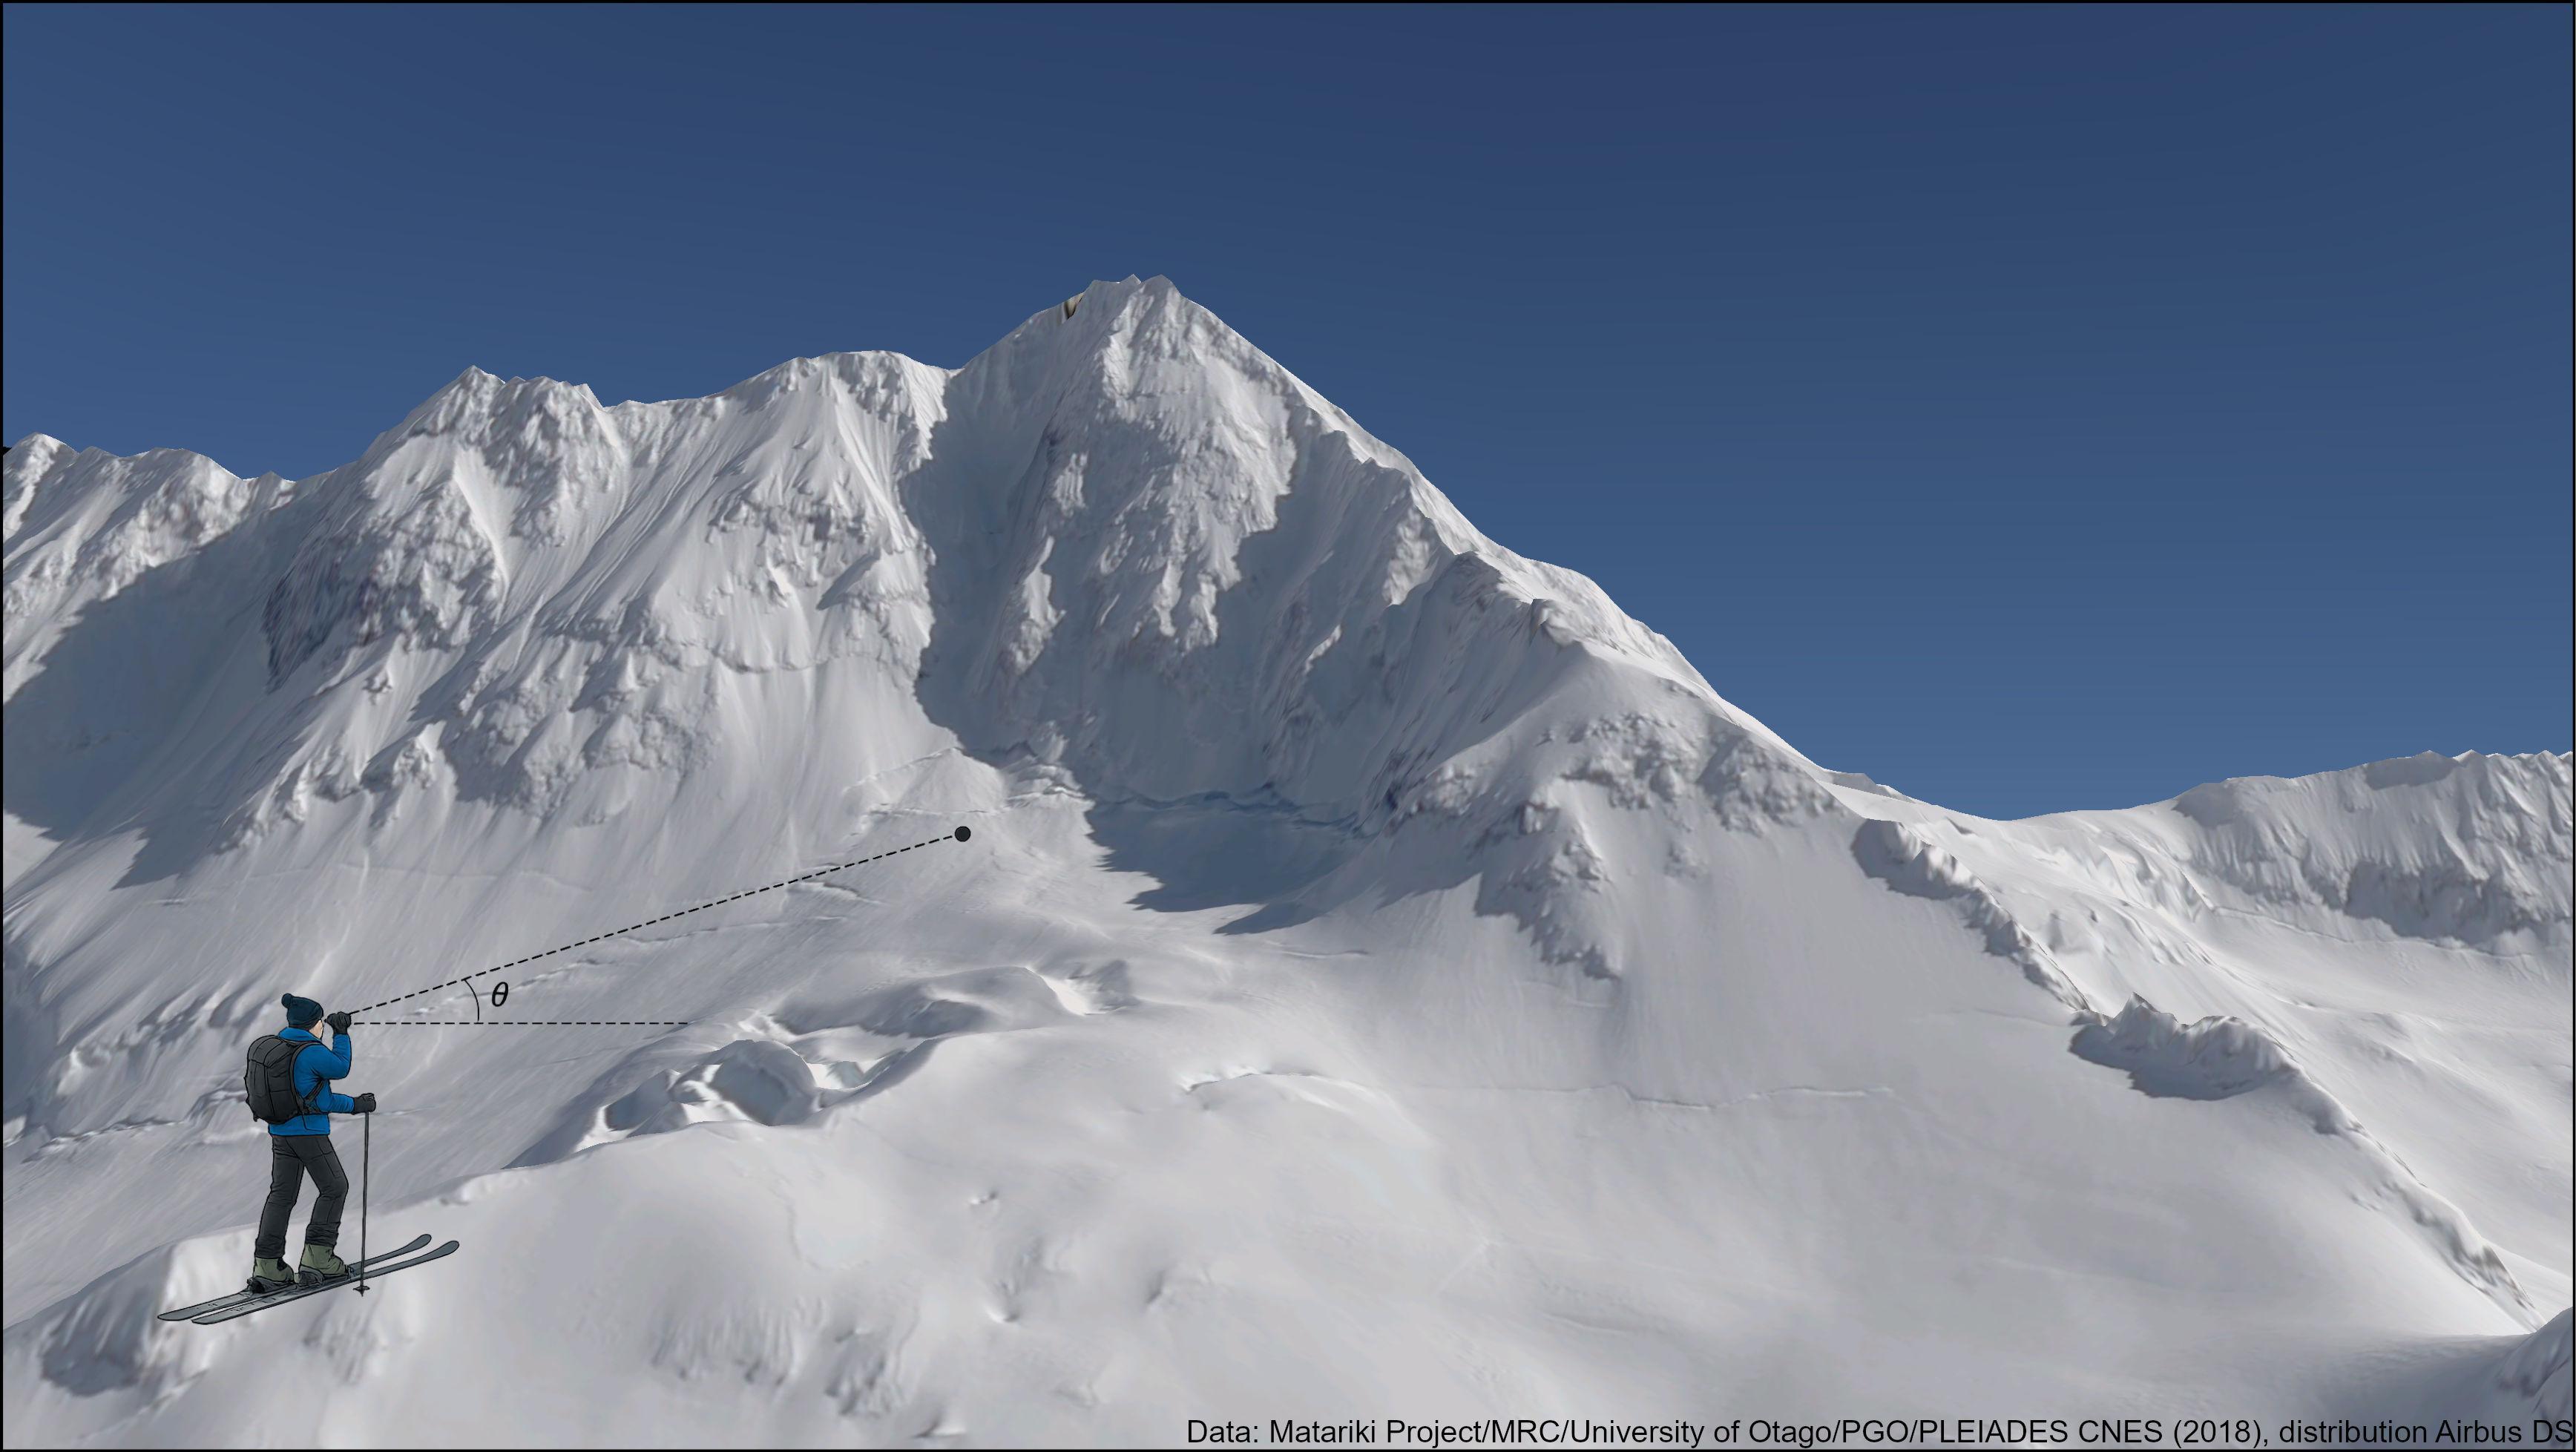
Here is an early winter version of the terrain
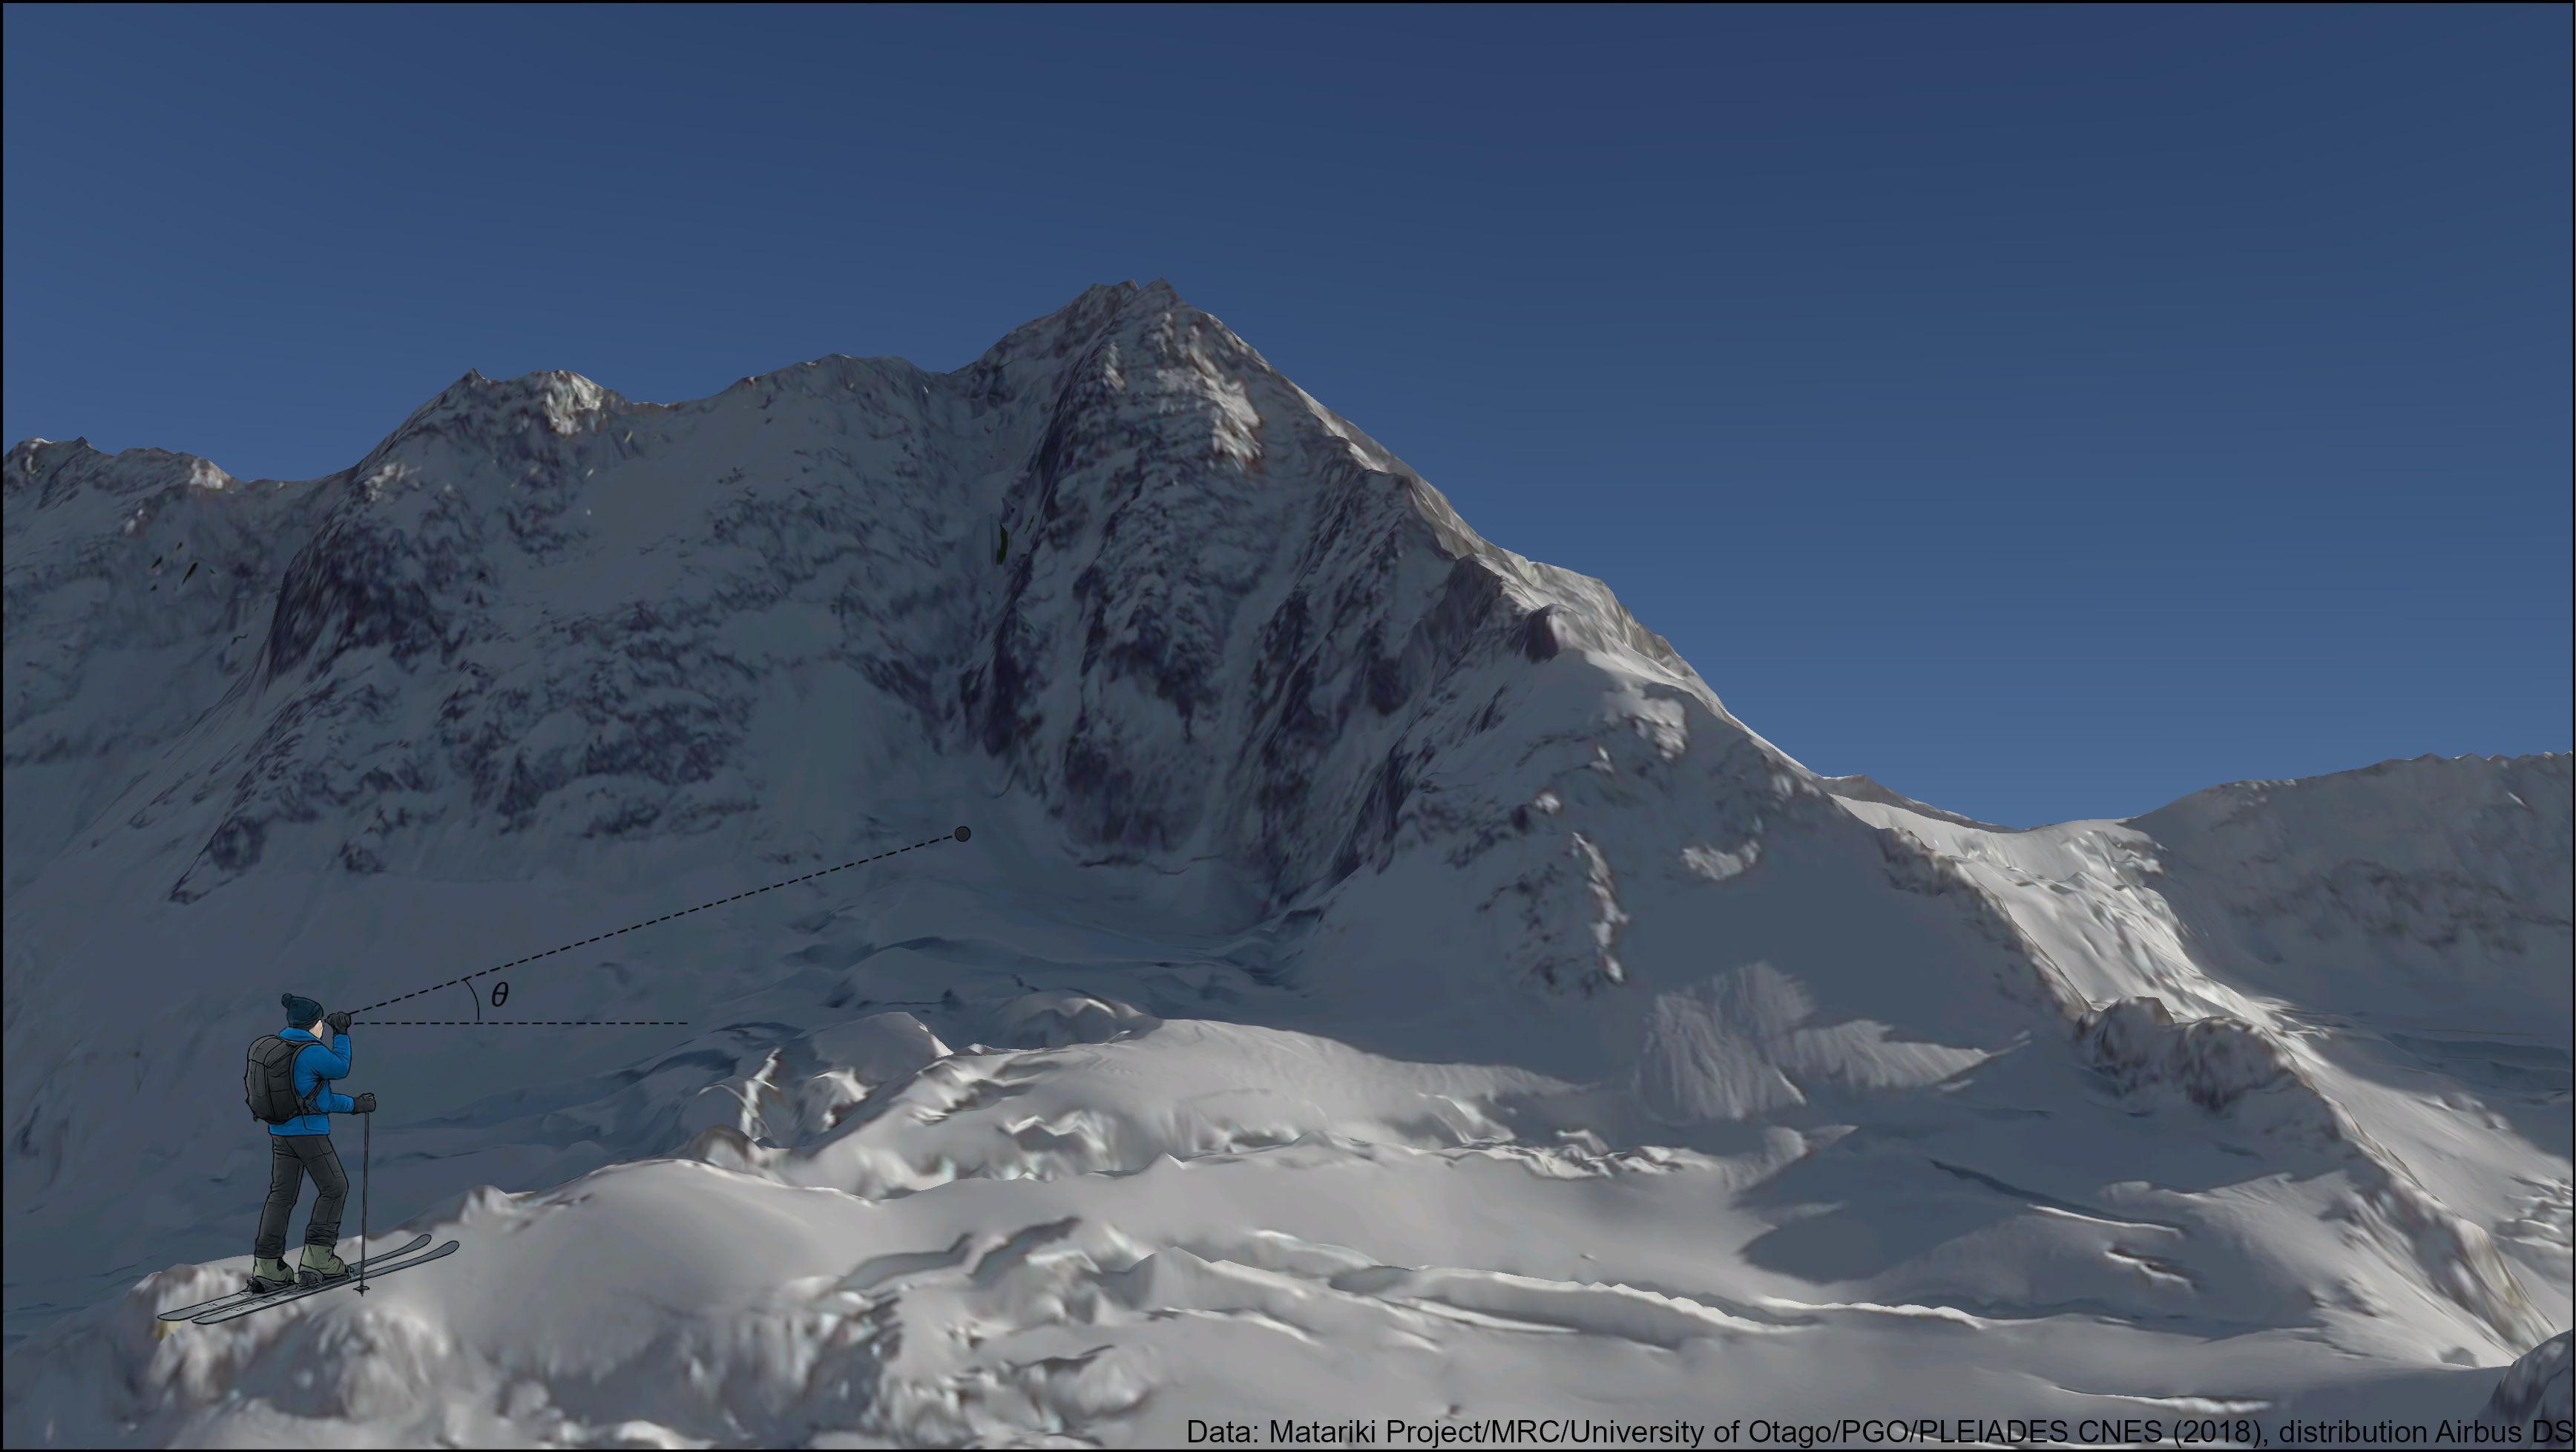
And here is a late winter version of
4. This is a rapidly-evolving industry. Watch this space
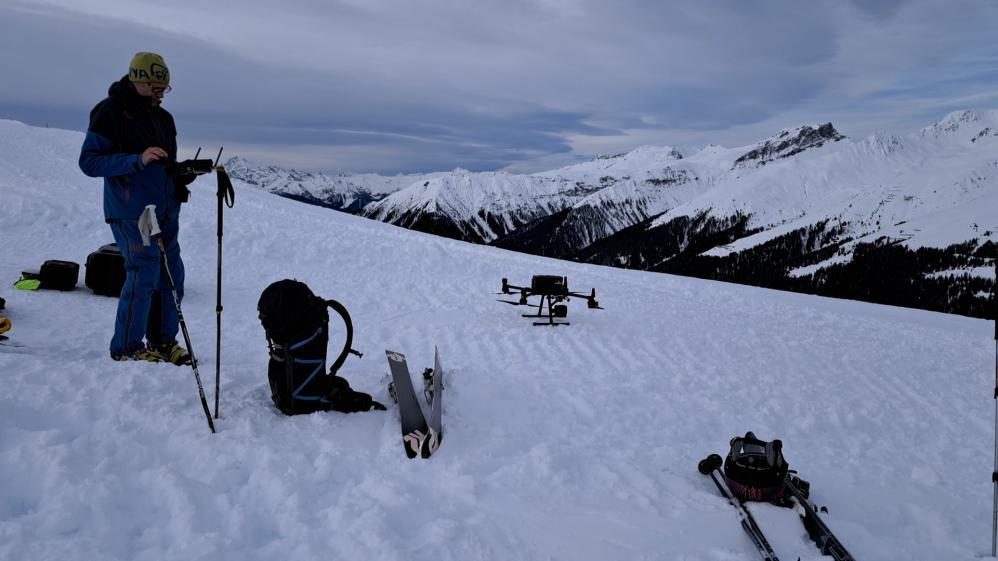
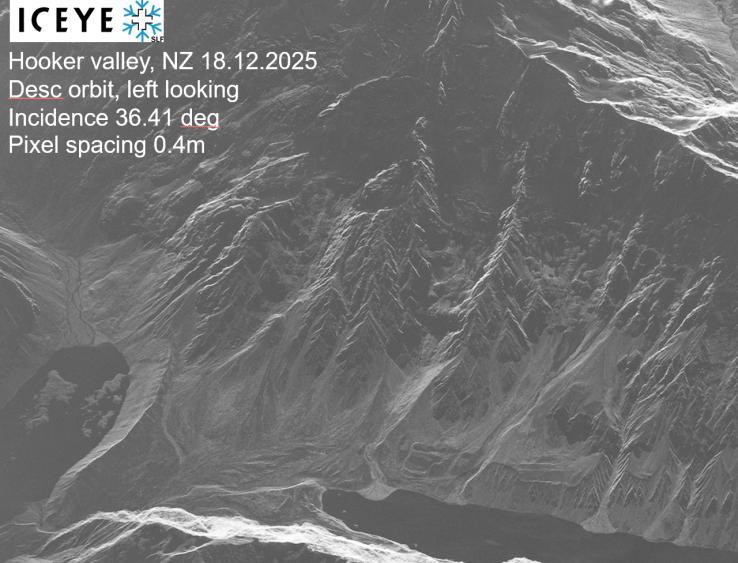
Lots and lots of new data
It can be hard to keep track of it and make sense of it (or know if you can trust it).
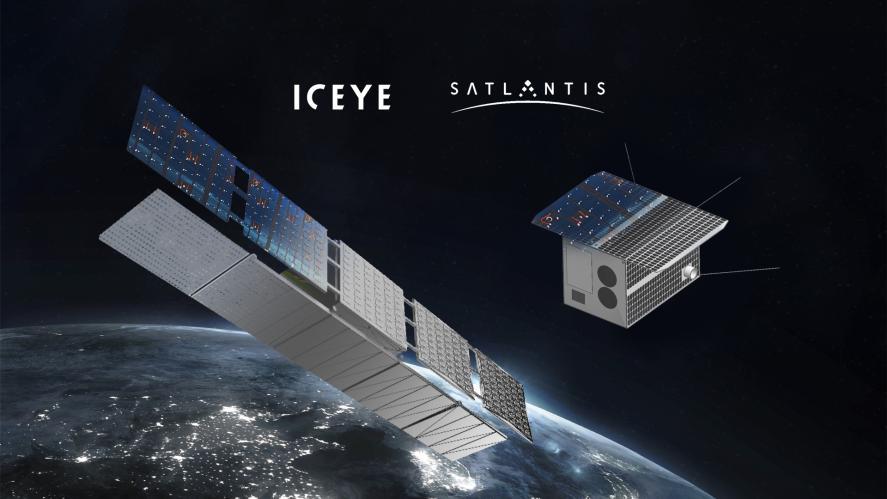
https://www.satlantis.com/iceye-and-satlantis-propose-new-tandem4eoconstellation-combining-radar-and-optical-imaging-for-europe/
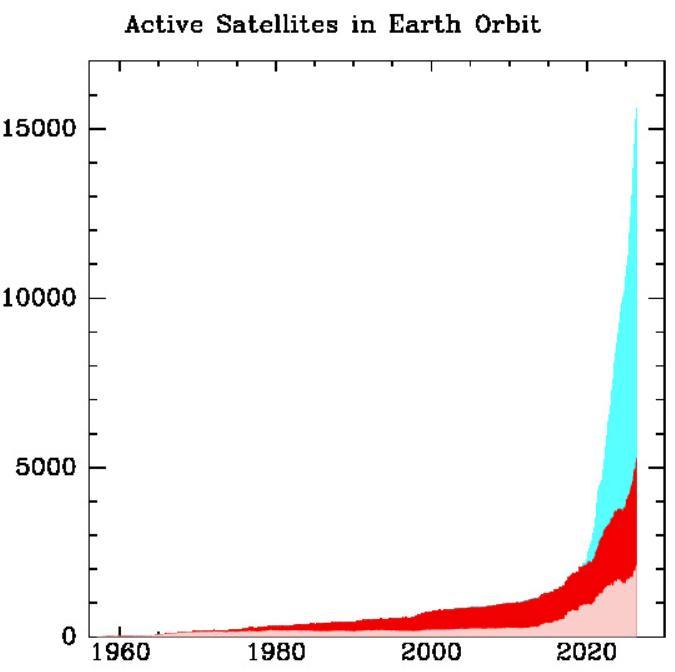
https://planet4589.org/space/stats/active.html

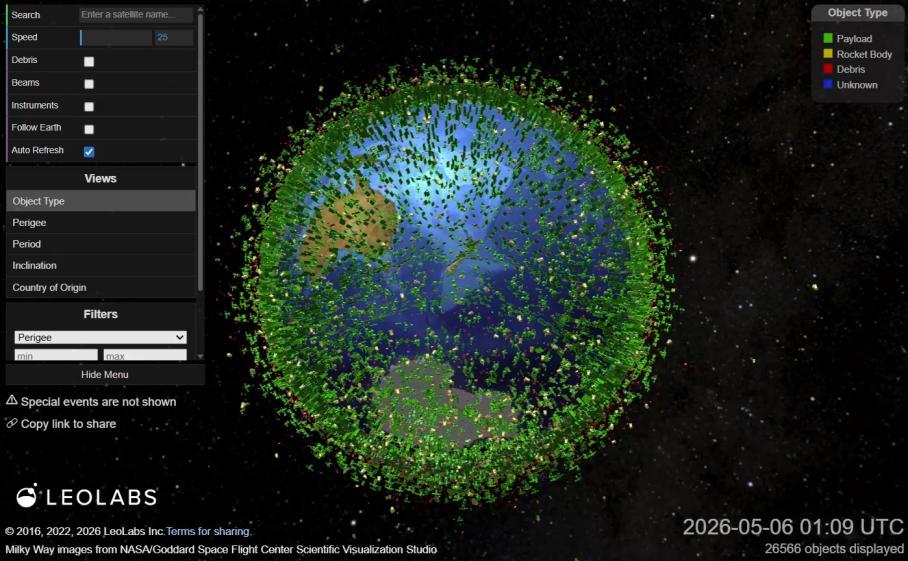
Putting it all together

• Check the elevation data source for your app/tool of choice
• Don’t use the tools to make turn-by-turn decisions
• Trip planning should continue to leverage the best available data
• Think about how what you see on the screen relates to reality
• Authoritative LINZ maps in 2D and 3D: https://basemaps.linz.govt.nz/
• CALTOPO with link to webmap showing elevation coverage: https://blog.caltopo.com/2024/02/02/lets-hear-it-for-more-lidar/
• Explore yourself. LINZ tutorials on using lidar data with free QGIS: https://experience.arcgis.com/experience/45262b6f24ab463d856191a 9728ab0f6/page/Open-Source-Guides
• Get in touch if you have specific questions—we are happy to help (aubrey.miller@otago.ac.nz)

A summary of a recent study on scent migration in snow and what this means for avalanche rescue dogs – a presentation courtesy of Fabrice Huot.


MSc Thesis
"When I arrive at an avalanche scene, what conditions give my dog the best chance of finding the victim?"

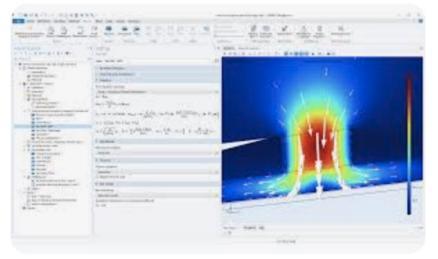
A buried person continuously emits scent (Volatile Organic Compounds) through skin and breath. Those molecules must travel upward through the snowpack to reach the surface. French researchers at Université Grenoble Alpes modelled this journey using a simulation (COMSOL).
This is the first quantitative model of scent transport in snow for avalanche SAR.
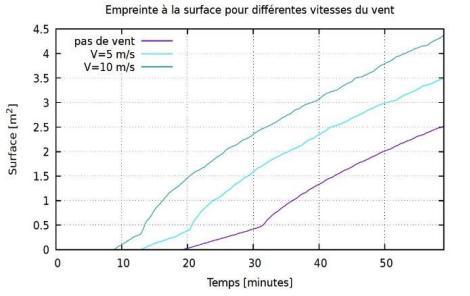
Wind creates pressure fluctuations that actively pump air (and scent) upward.
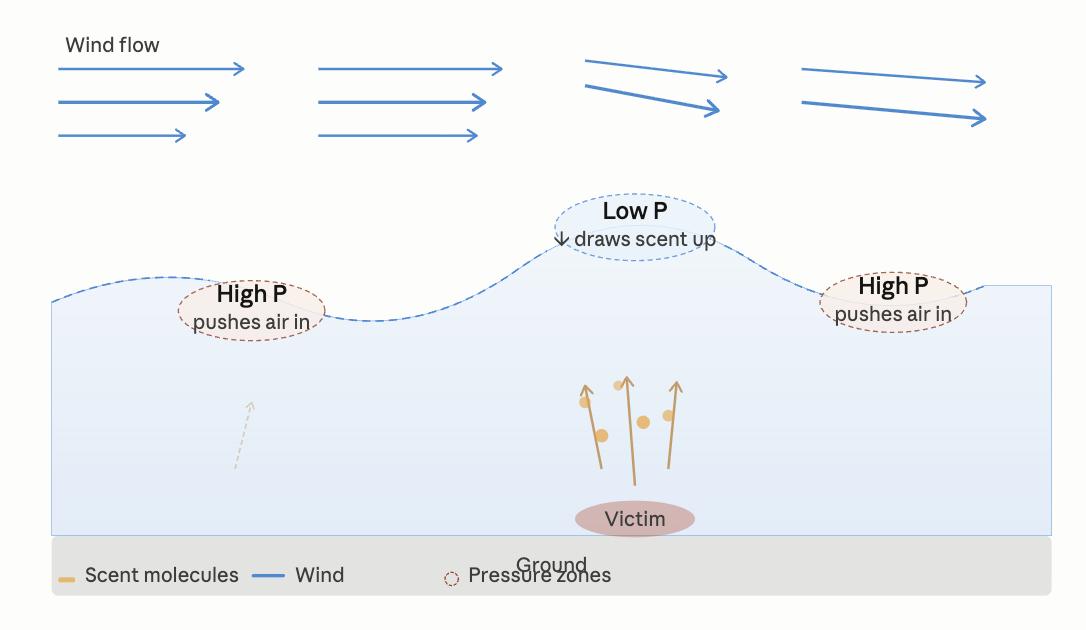


Wind pumping is the dominant factor — and it's the one we can read from the weather.
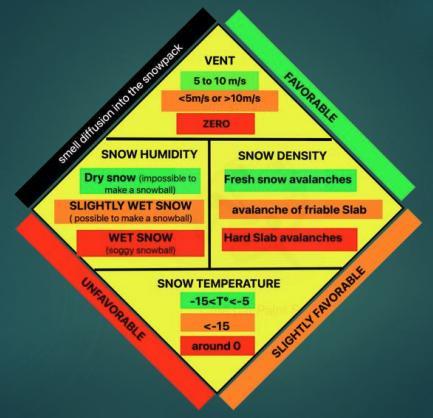

Wind actively helps
Wind pumping at 5–10 m/s reduces time to detection threshold significantly. More wind = faster scent at surface.
Wind matters more for deeper burials
For a shallow burials (< 0.4 m), wind makes less difference. For deep burials (≥ 1 m), wind becomes critical.
Wet snow is challenging
Water in pore spaces blocks air movement and changes the scent profile. Wet avalanche searches are harder –not a surprise…

Scent rises vertically
No significant lateral spread inside the snowpack. Scent moves up to the surface and is then distributed by airflow above the snow.

Are the conditions favourable for dog searching?
Dry snow, some wind, cold temps = good dog search conditions. Wet snow, calm wind = challenging conditions for dog teams.
How can we adapt our search plan?
In low-scent-transport conditions (wet snow, no wind) we can use tighter search strips — the scent footprint at the surface is small and slow-building.
Timing?
With deep burial and no wind, scent may not have reached the surface yet. Consider multiple dog teams spread over a longer period of time to ensure maximum chance of scent at surface.

Dr Malin Zachau , MBBS,DRCOG,DIMC,FAEEM
MountainSafety.info Mountain Emergency Medicine workgroup lead
International Society for Mountain Medicine ; Vice President

Kaitiaki Ora |Tactical Medicine New Zealand; Civilian committee member

Taskforce Kiwi Disaster Relief; Medical Director

Ground

Mission
Execution

Communication

Bevan Smith, MSC
Have you ever completed a formal avalanche skills training course?
No, and I have no plans to 35%
No, but I plan to 28%
Yes, in the last 5 years 18%
Yes, 6 to 10 years ago 5%
Yes, 11 or more years ago 14%

In the last two years, which of the following winter activities have you participated in?
Backcountry skiing / splitboarding
Backcountry skiing / splitboarding - Yes 12% plan to 2% don't plan to 2%
Snowshoeing - Yes 3% plan to 1% don't plan to 1%
Mountaineering / alpine climbing - Yes 11% plan to 5% don't plan to 3%
Alpine hunting - plan to (33%)
completed 2%
Winter tramping - plan to (30%)
completed (72%)
completed 35%
Backcountry skiing / splitboarding - plan to (14%)
completed (52%)
Snowshoeing - plan to (23%)
completed (58%)
Mountaineering / alpine climbing - plan to (27%)
Alpine hunting - plan to (16%)
Winter tramping - plan to (88%)
Backcountry skiing / splitboarding - plan to (13%)
Snowshoeing - plan to (7%)
Mountaineering / alpine
climbing - plan to (29%)

Other commitments take priority
I don't enter or travel below avalanche terrain
It is too expensive
I don't have the equipment
Training opportunities are not available
I don't need it
I don't have anyone to do it with
I prefer to spend time on other activities
I have fitness or health factors that prevent it
The weather has been unsuitable
Personal safety Group safety Requirement for work or guiding Encouraged by friends / family Interest in the topic Other (Please specify)
• Gives us a clearer picture of current avalanche skill levels among active recreationalists in winter.
• Reveals barriers people face in accessing training.
• Uncovers where opportunities might exist
• Helpful for those who deliver Avalanche Safety Courses.
• For MSC this becomes a basis for new resources and content.
(This was just a taste. Contact me if you wish to learn more)

Based on an article I wrote for The Avalanche Review, April 2025
Anna Keeling, SHAC 2026
Why
Drew talked me into it.
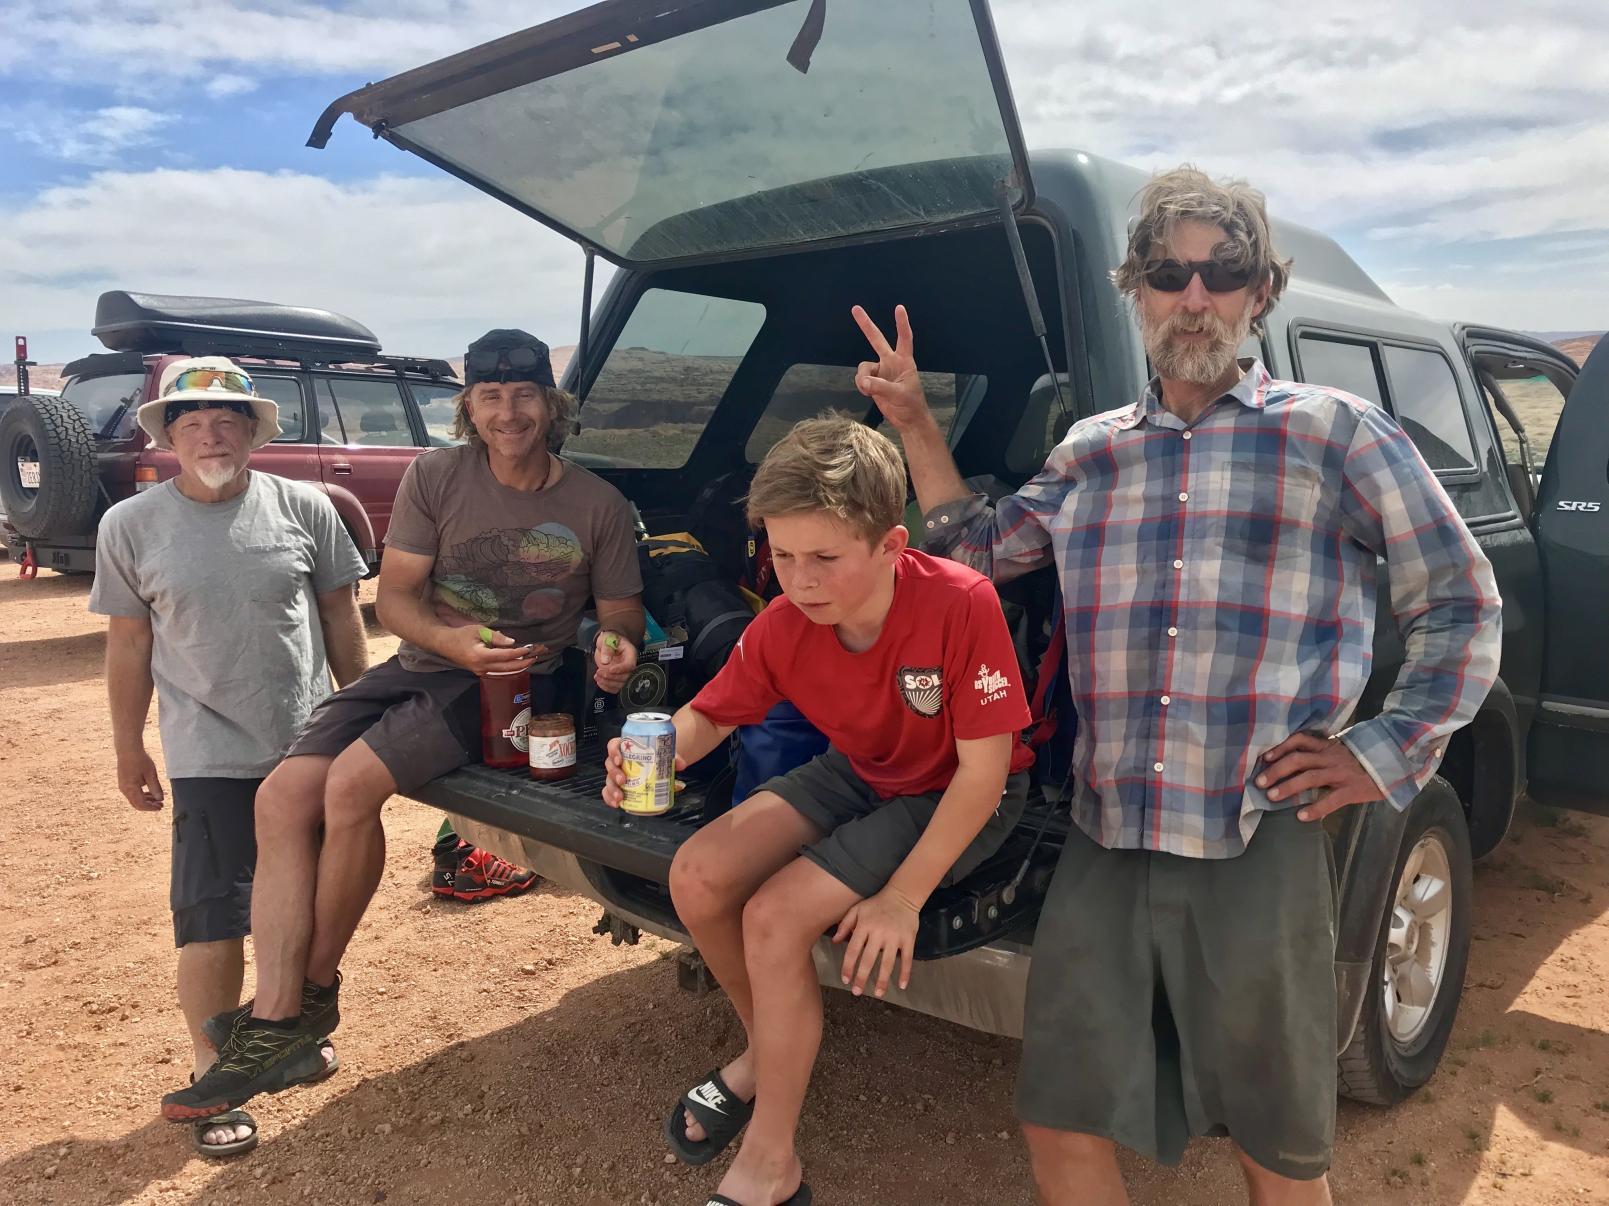
He’d started the conversation
About shame & blame in the Wasatch
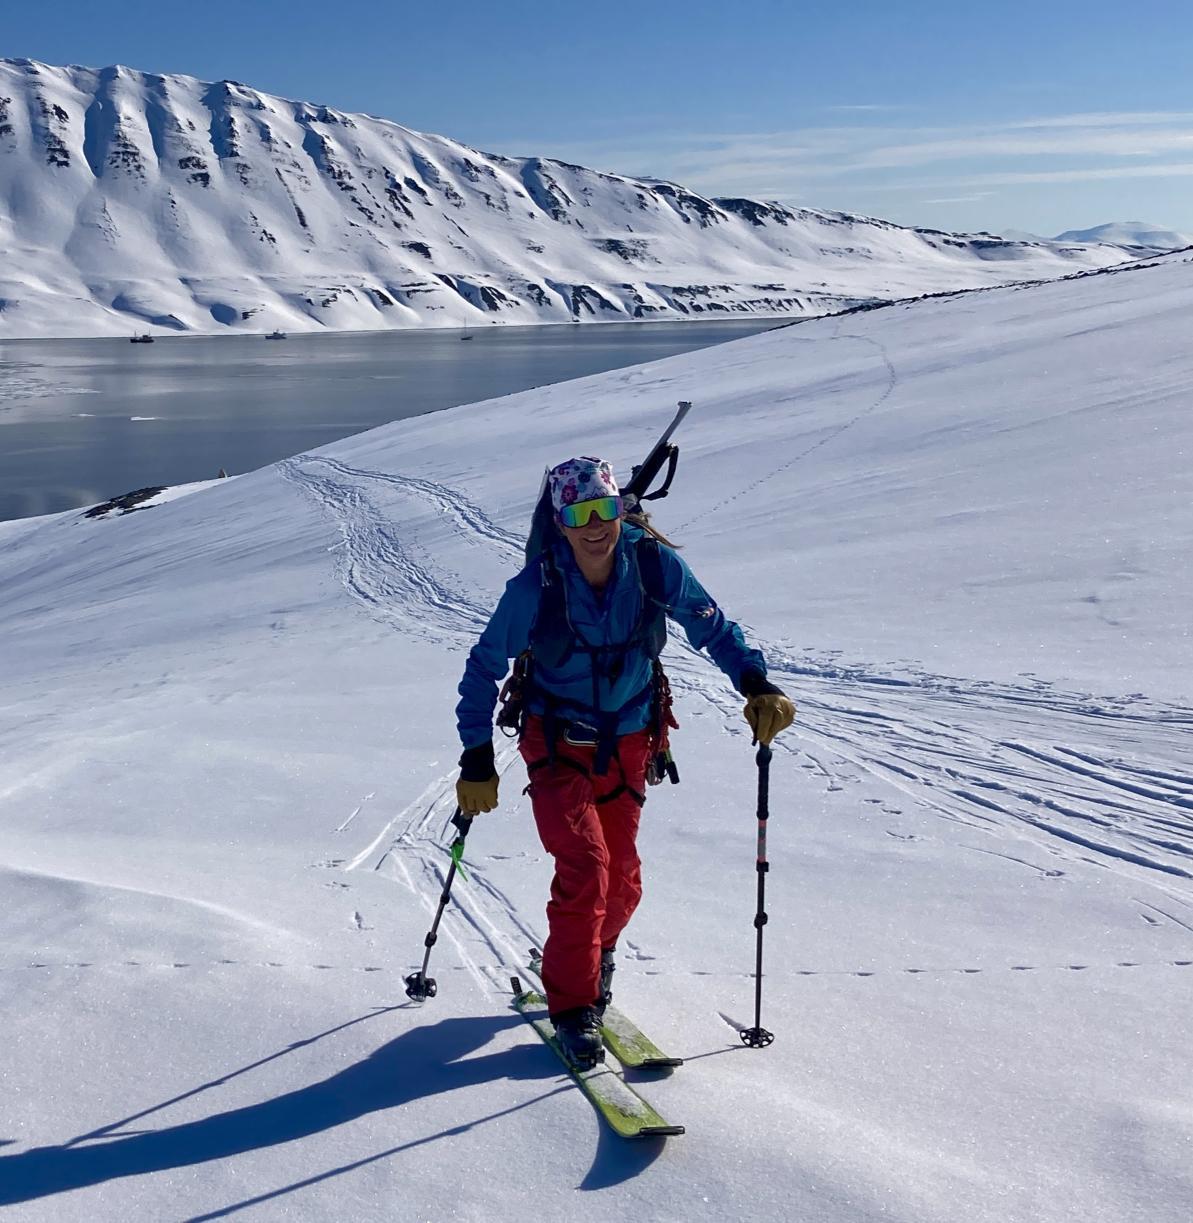
March 12, 2022. Winslow & her clients rescue Willie alive after a 23 minute burial, down 1.5m
• Winslow: American Ski Guide 25+ years of guiding
• Willie: IFMGA (AMGA) 25+ years of guiding.
• Their 6 clients

Research: Qualitative research using Grounded Theory research
• Story telling as a means to human connection: “Storytelling is data with a soul”
• Grounded Theory Research doesn’t start with a hypothesis, a problem or a literature review. “All is data.”
• She explored Connection, Shame and Empathy.
• Vulnerability consistently emerged as a core category in her work
• She became a “Celebrity Academic” after her viral 2010 TED talk on vulnerability
when you

1. Rumbling with vulnerability
- basically: embracing the suck & courage over comfort.
• Winslow reaching out to me
• Her story published in the UAC the day after
• Me going to the debrief (& thinking that maybe I had nothing to offer)
• Willie agreeing to me telling this story
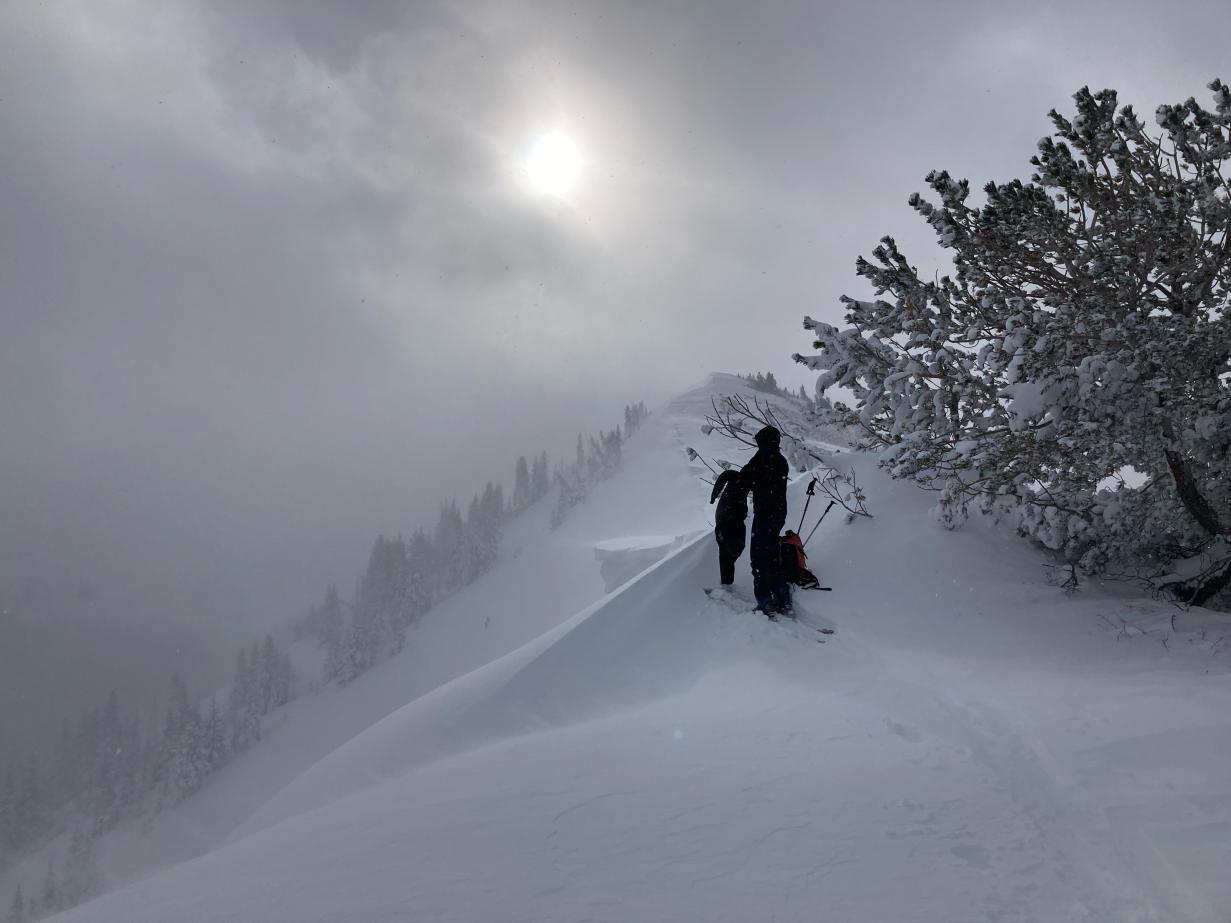
• You have to know them to live them
• You also have to know when you are operating outside them
• In this situation, even though I wasn’t guiding thought maybe I had nothing to offer, I showed up when asked.
• My 2 main values are adventure & wholeheartedness.
Trust is built up in small increments
The BRAVING Inventory:
Boundaries
Reliability
Accountability
Vault
Integrity
No judgement
Generosity
When you take risks, you might fail. This requires resilience
The Reckoning (getting curious about your reactions).
The Rumble (challenging false stories you tell yourself about a failure).
Empathy Skills (from Brown, 2026)
01. To see the world as others see it, or perspective taking
02. To be nonjudgmental
03. To understand another person’s feelings
04. To communicate your understanding of that person’s feelings
05. Mindfulness AKA Paying Attention
How
• She got curious about her emotions
• She embraced what was hard and organised a debrief
• She invited a support person who she trusted
• I brought a text book to help describe emotions
• We didn’t shy from emotion
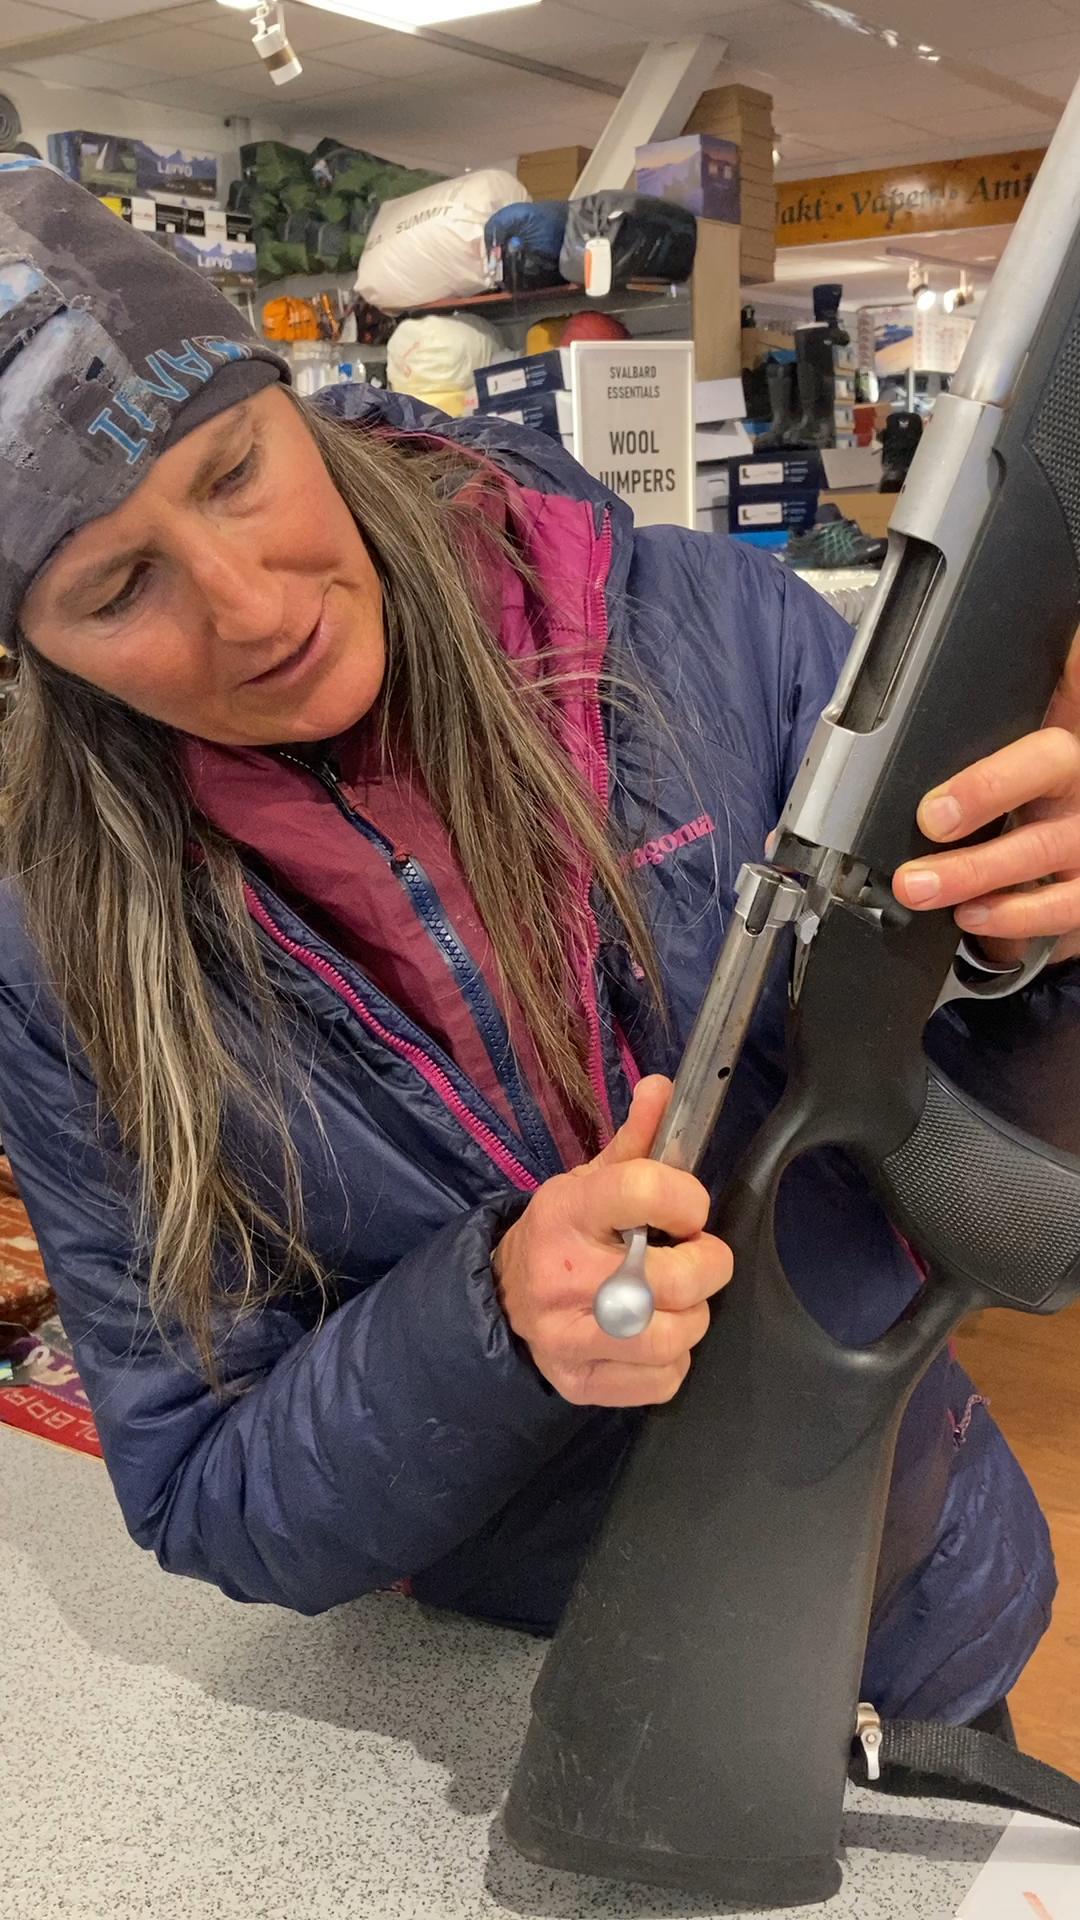
• He was ok that I shared his story
• He focuses on ways to slow down in complex situations
• He recognises the feeling he gets when he focuses on over-delivering (eg. finding pow), instead of working with conditions
• He recognises when his clients’ desires don’t align with conditions, wx etc and he ends the guiding relationship
• Also understanding in a long career (30 years so far), that mistakes are likely = Forgiveness
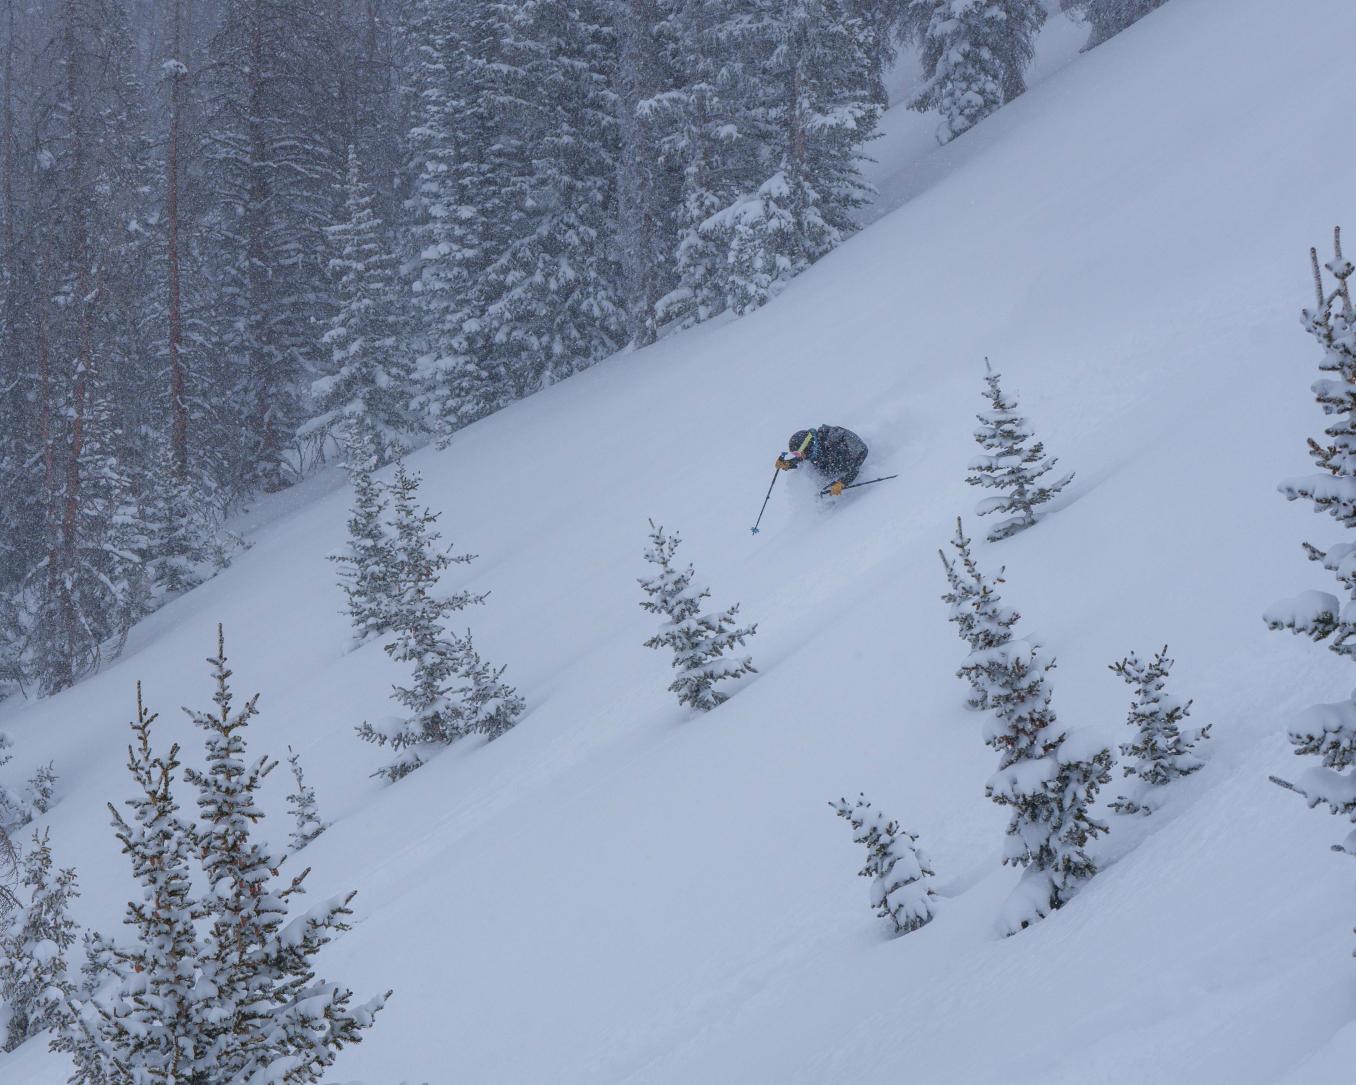
We work in a Wicked Environment with high uncertainty….
• The difference between Guilt and Shame:
• Empathy is a tool of compassion.
• Language: Clear is kind. Unclear is unkind.
• Guilt: I behaved badly (there is room for improvement).
• Shame: I am fundamentally flawed.
• Understanding your values helps you know how to show up.
• It can take time, patience some hard conversations to get clear…
• Especially when emotions run high…
• And you are uncertain…
The Development of an Automated Avalanche Terrain Exposure Scale in the Southern Alps
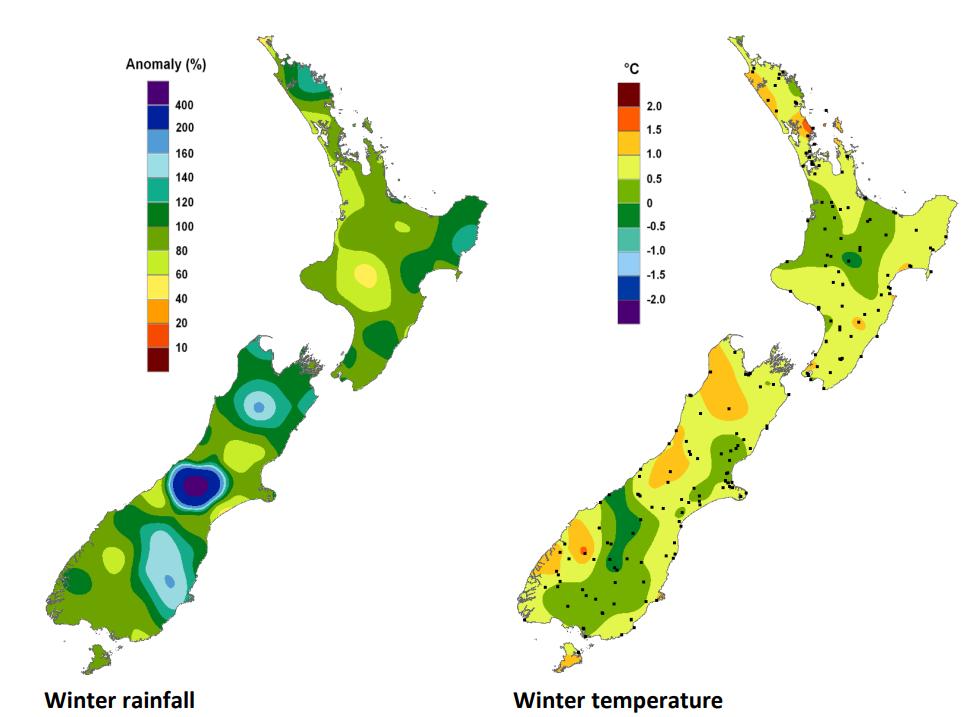
Source: https://niwa.co.nz/climate/summaries/seasonal/winter2024
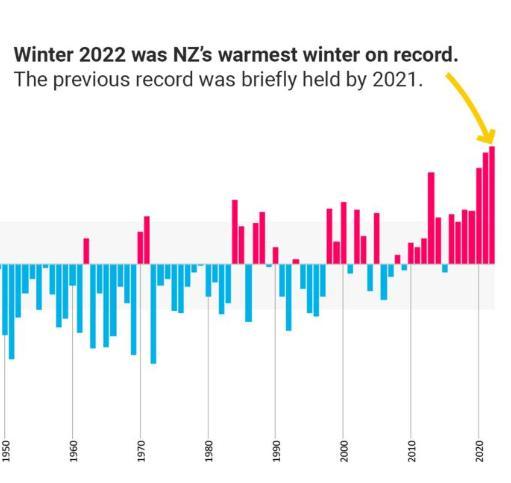
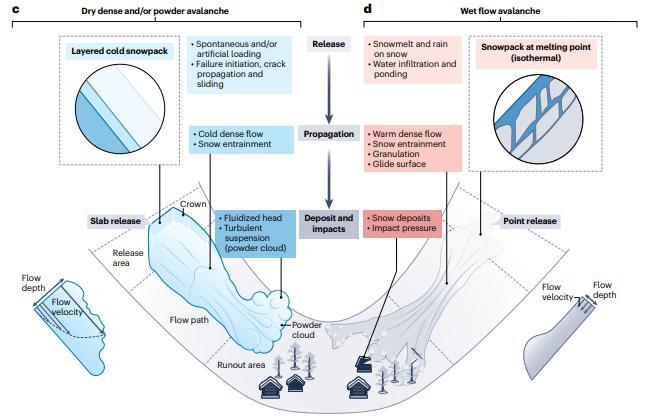
◦ Avalanche count decrease in lower elevations
◦ High elevation and wet avalanche count increase, even in peak winter
◦ Increase in fatalities due to slab (human-triggered) avalanches
Source: Eckert, N, J.et al. (2024).Climate change impactson snow avalanche activityandrelated risks. Nature Reviews earth and env., vol 5, 369-389, https://www.nature.com/articles/s43017-024-00540-2
Decision makers and land managers are experiencing increased pressure to create and apply vulnerability models for natural hazards, as climate change and socio-economic shifts increase both their frequency and the hazard they present to the public. (Durlevic 2022)
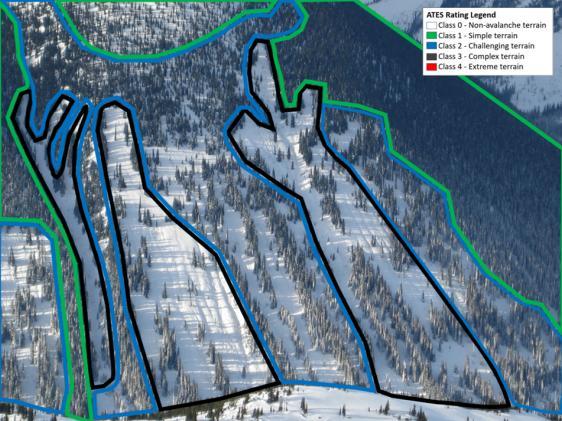
Source: https://www.proquest.com/scholarlyjournals/avalanche-terrain-exposure-scale-ates-v2/docview/3176115572/se-2?accountid=14700
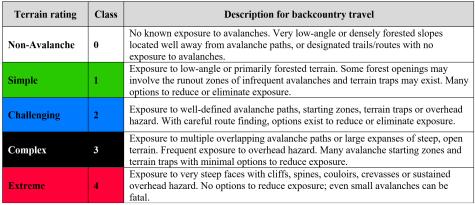
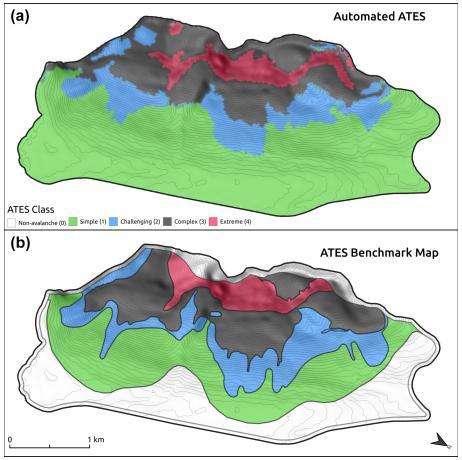
Source: J. Sykes et al.: Automated Avalanche Terrain Exposure Scale mapping. 2024, Nat. Hazards Earth Syst. Sci, pp 947-971 https://www.proquest.com/scholarly-journals/automatedavalanche-terrain-exposure-scaleates/docview/2968810925/se-2?accountid=14700
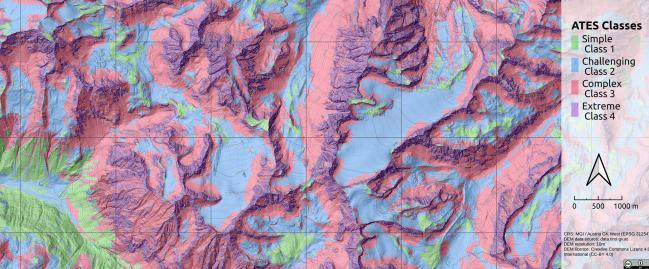
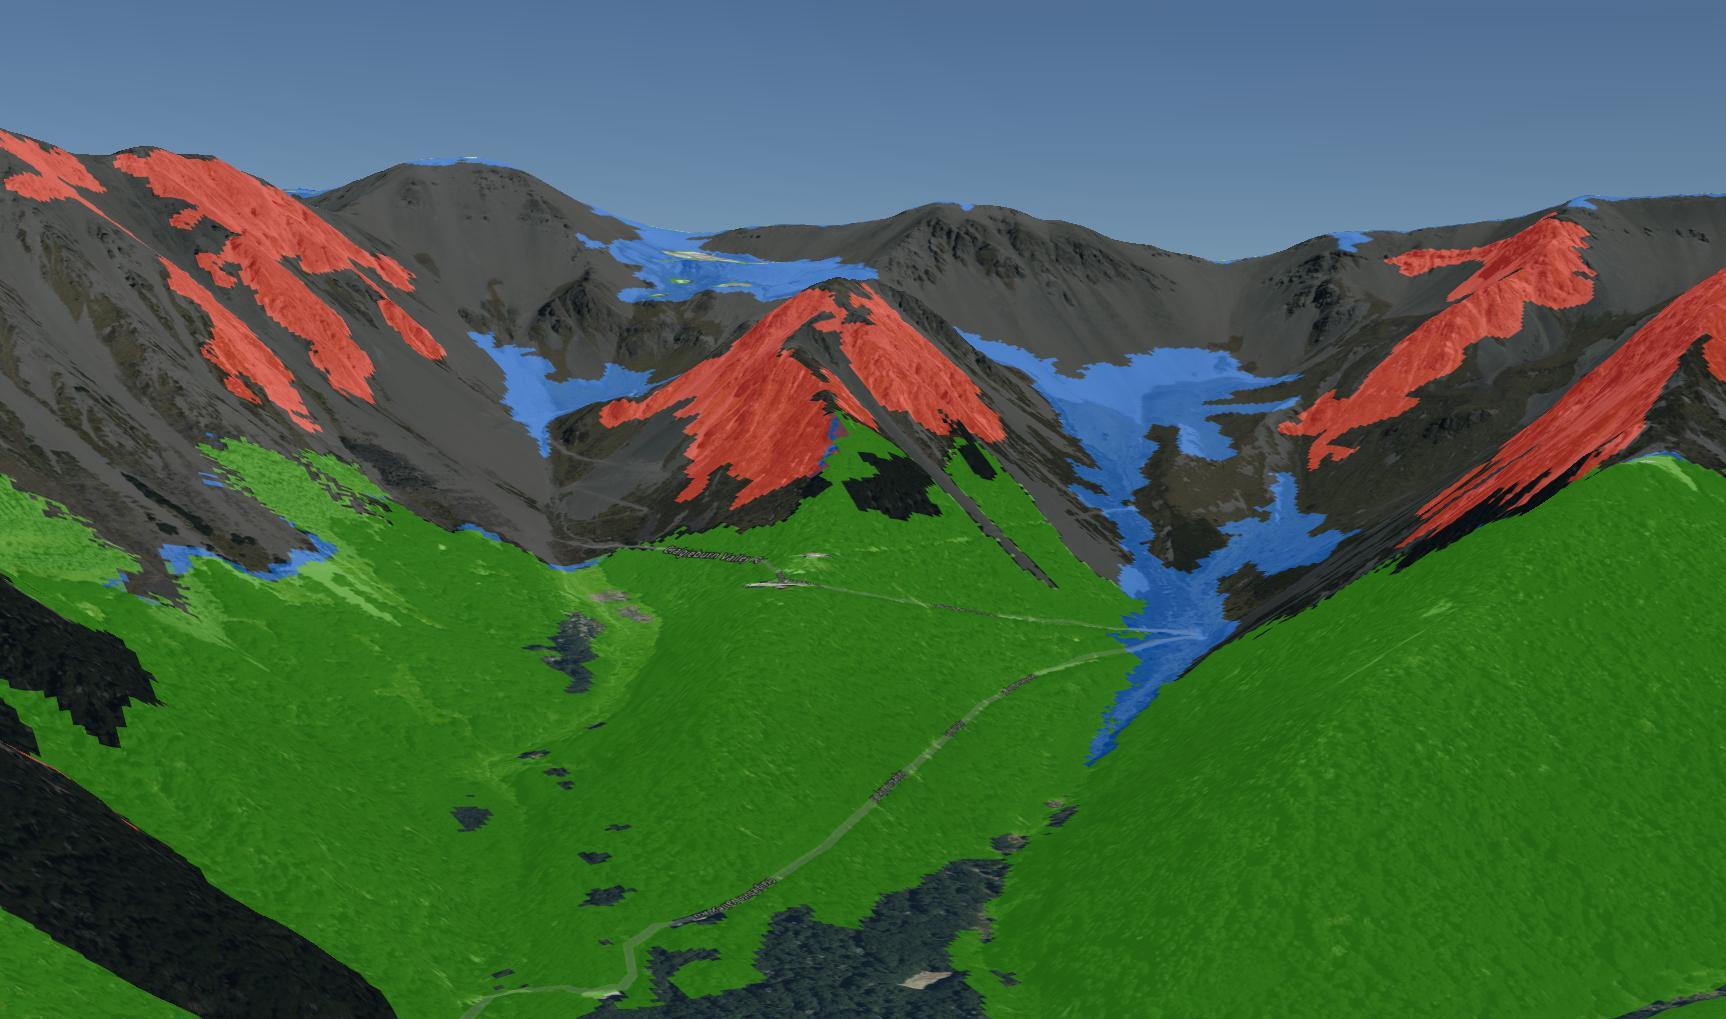
The NZ use case: (m)ATES
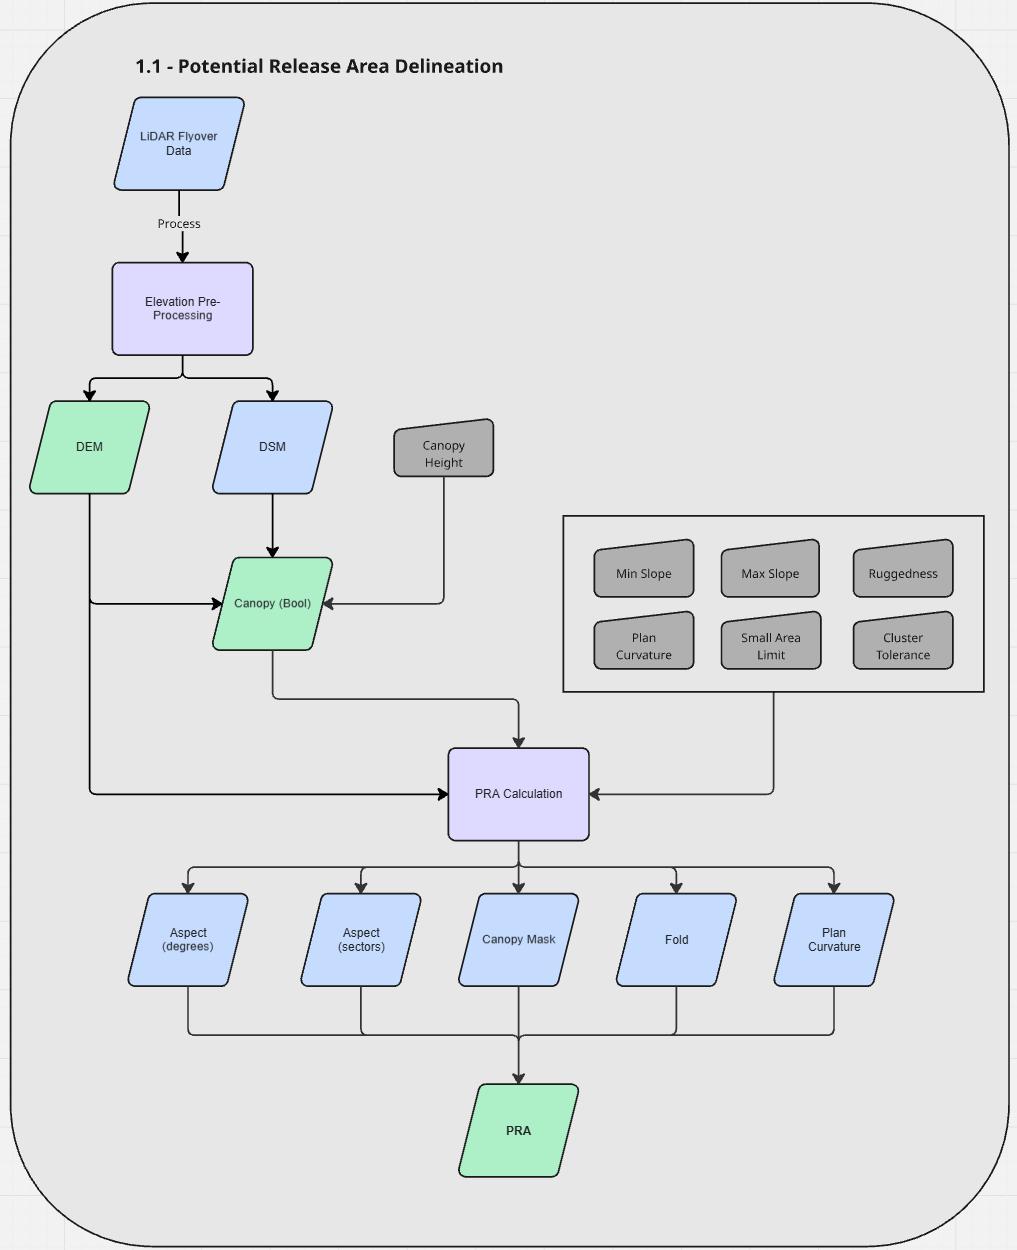
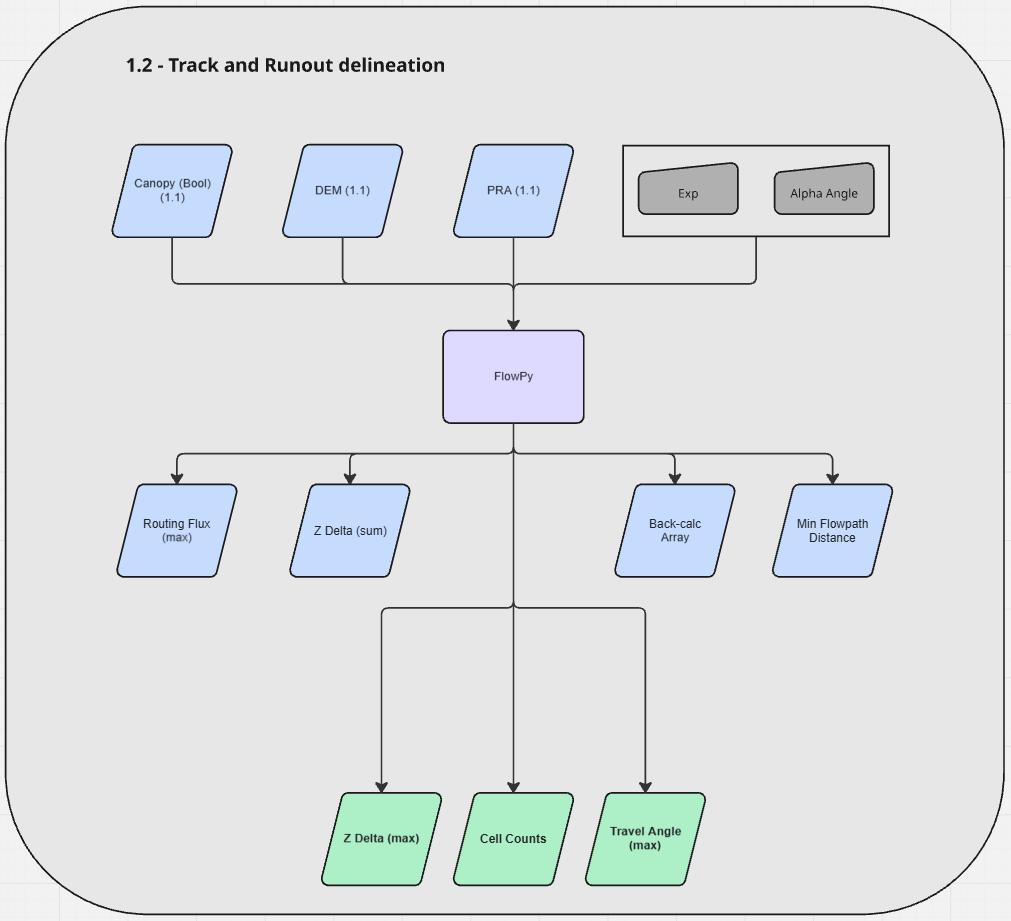
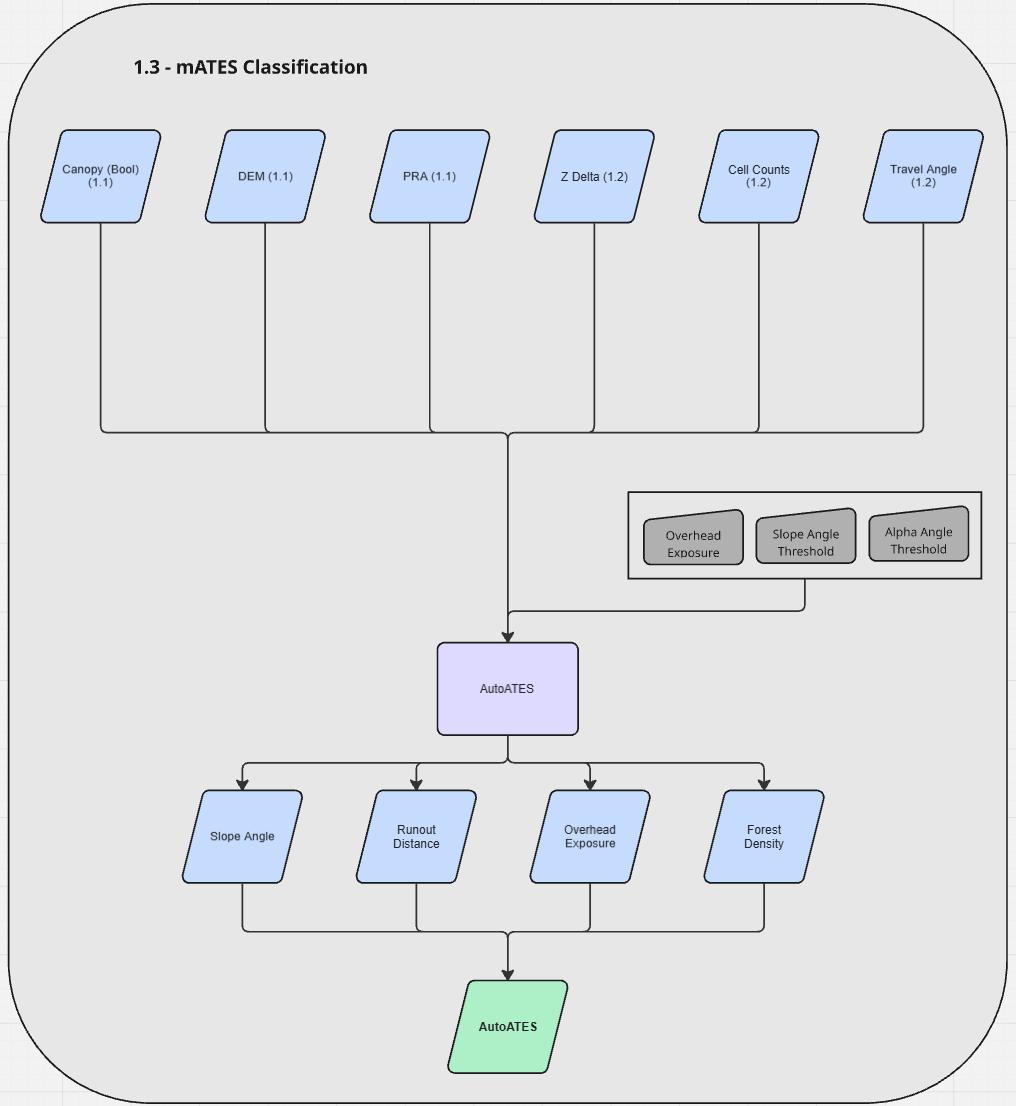


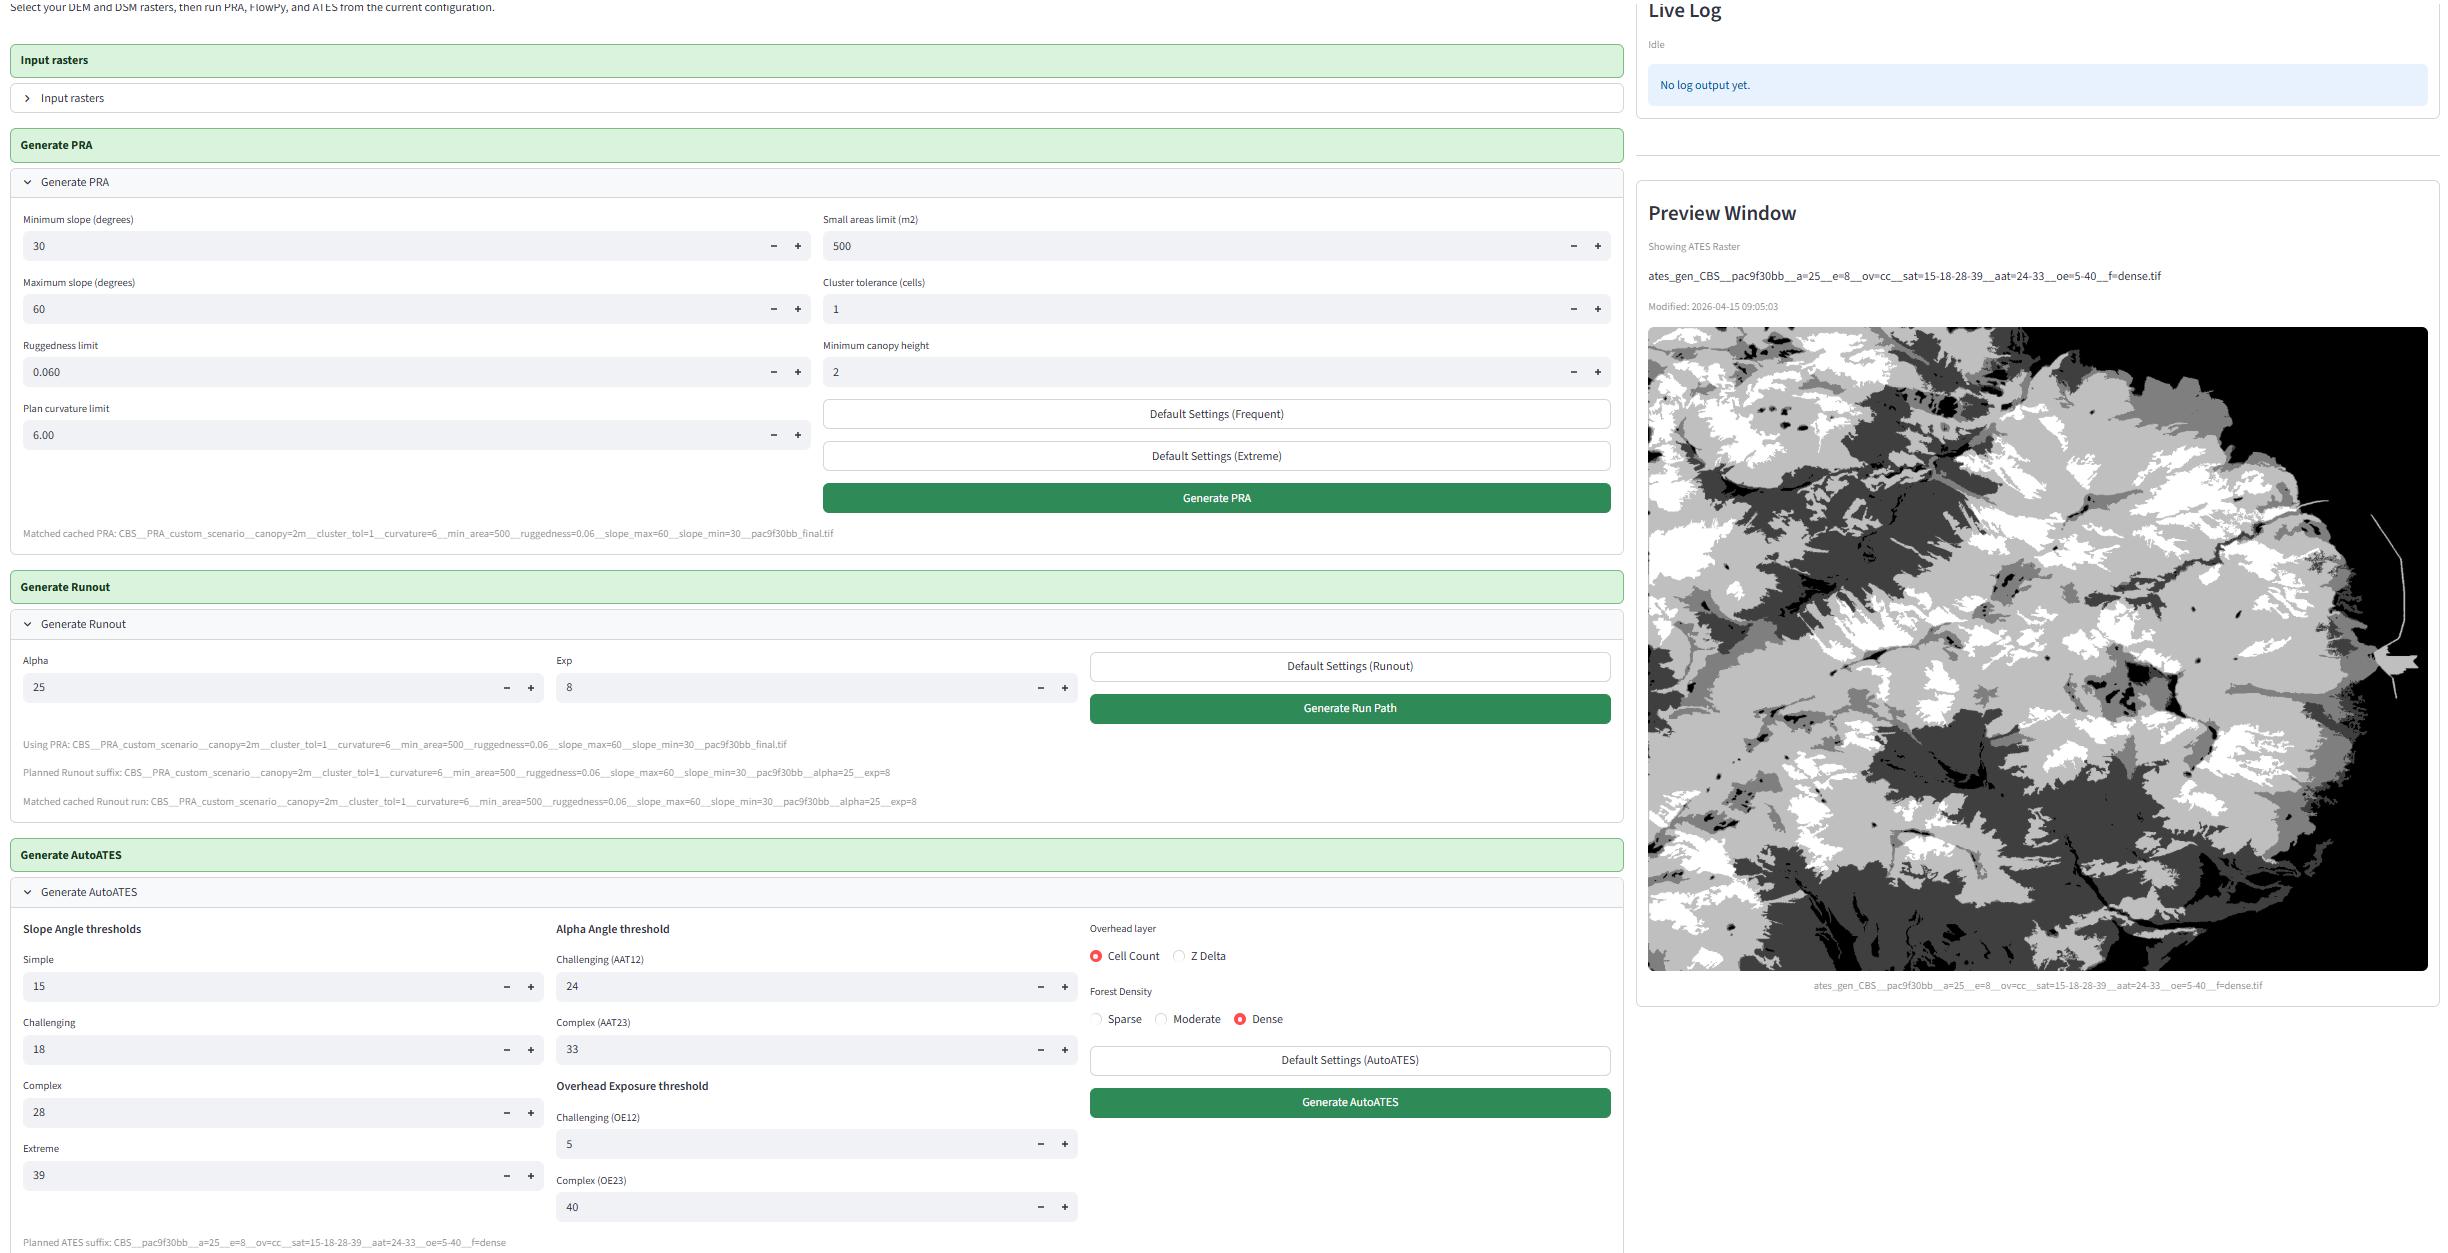
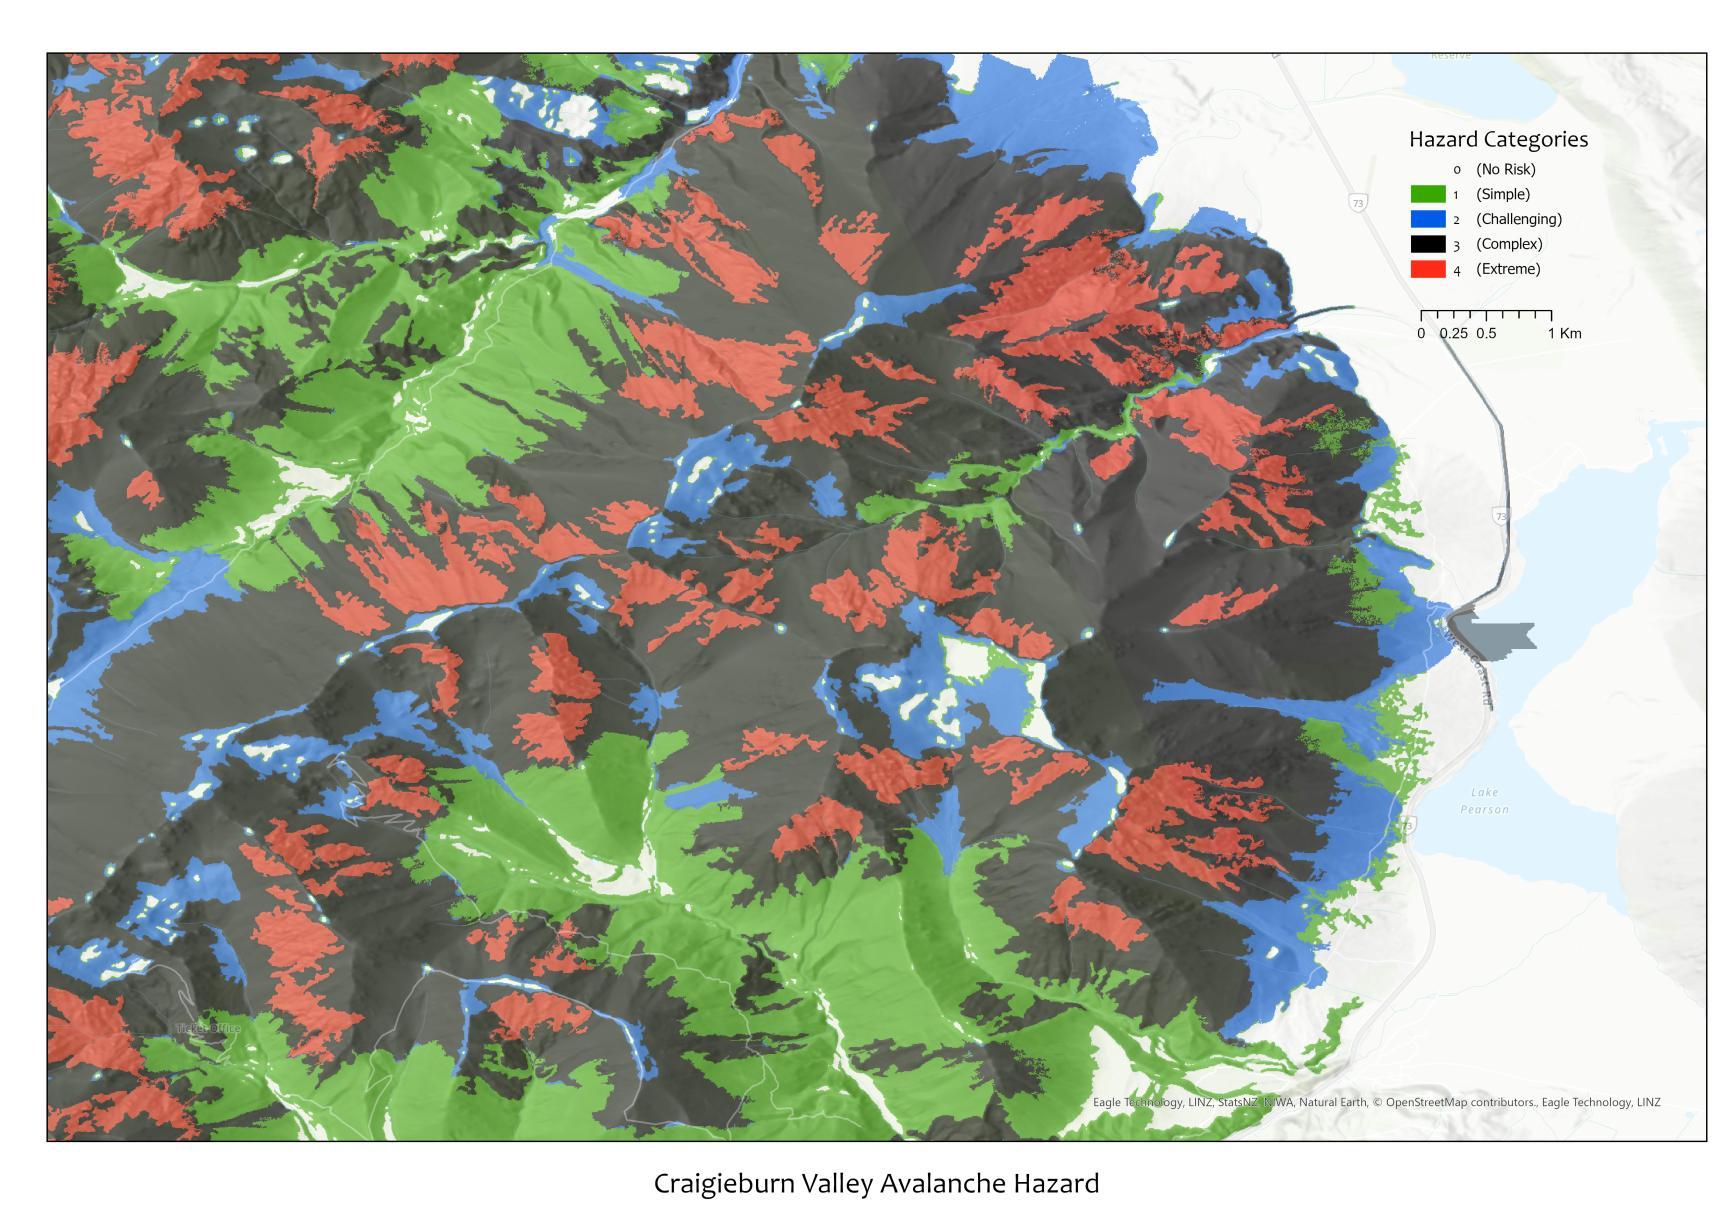
• ATES generation at the mountain scale
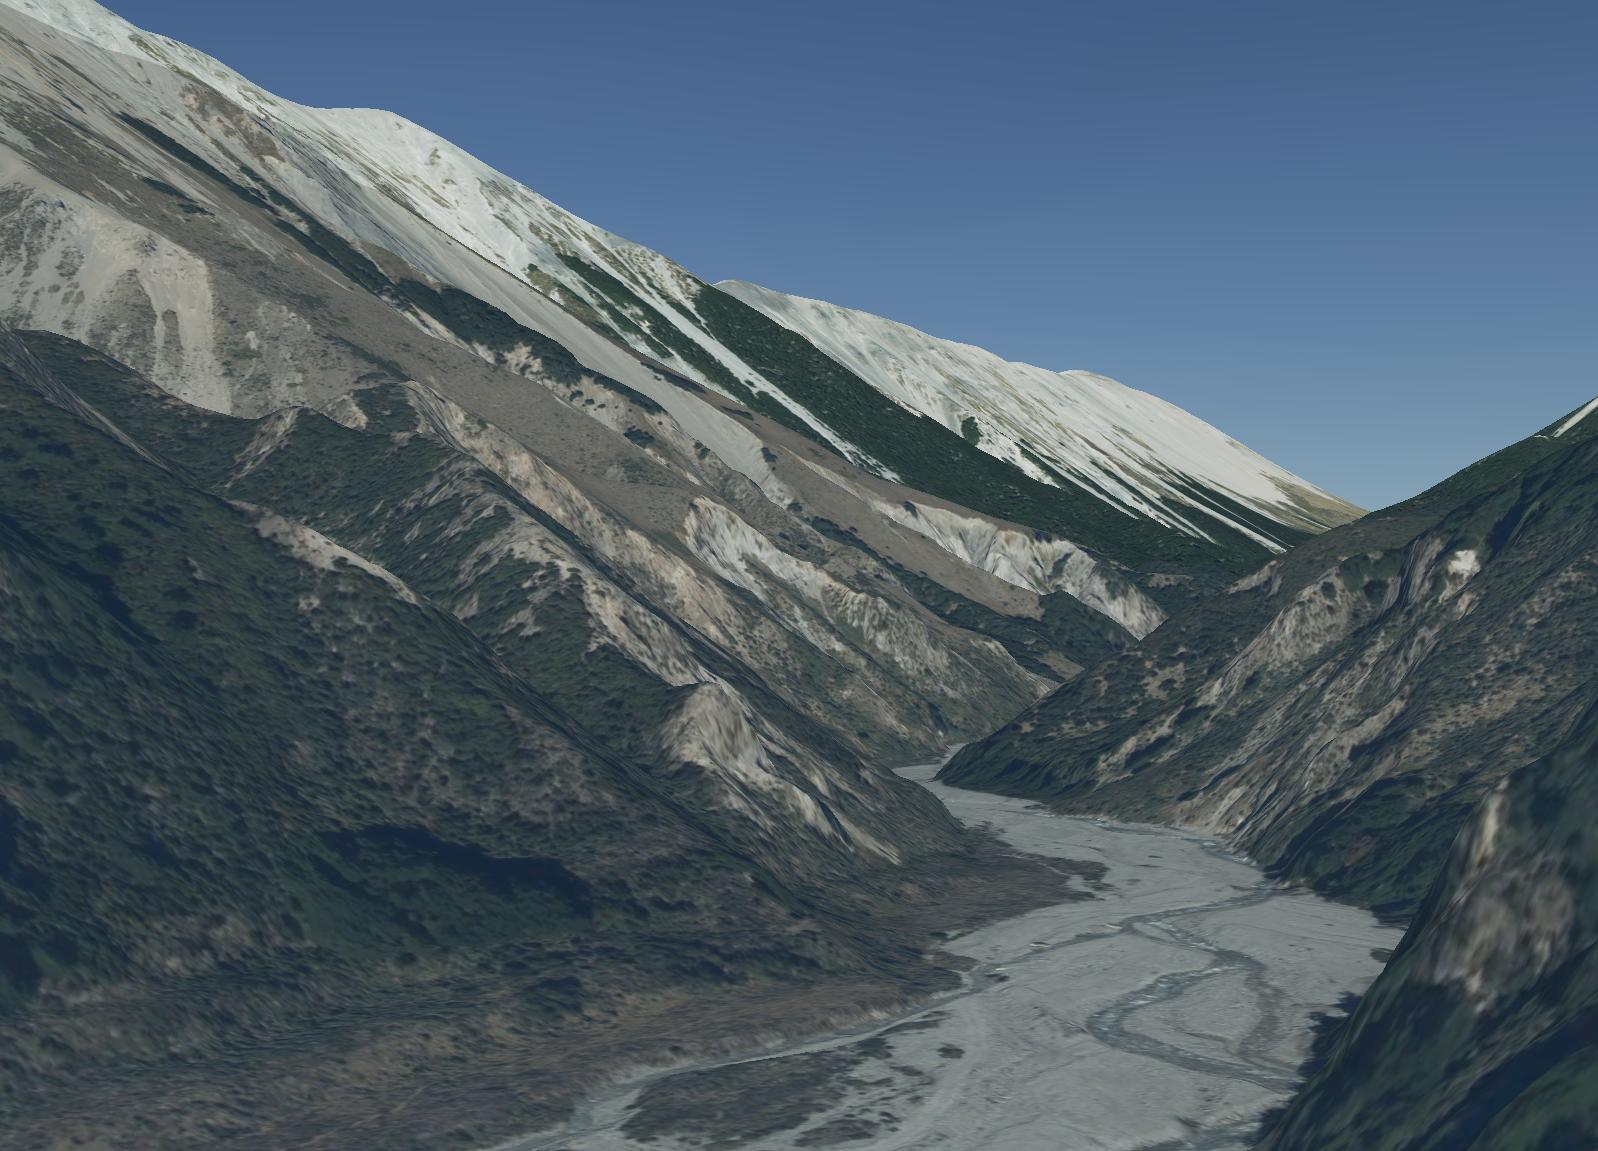
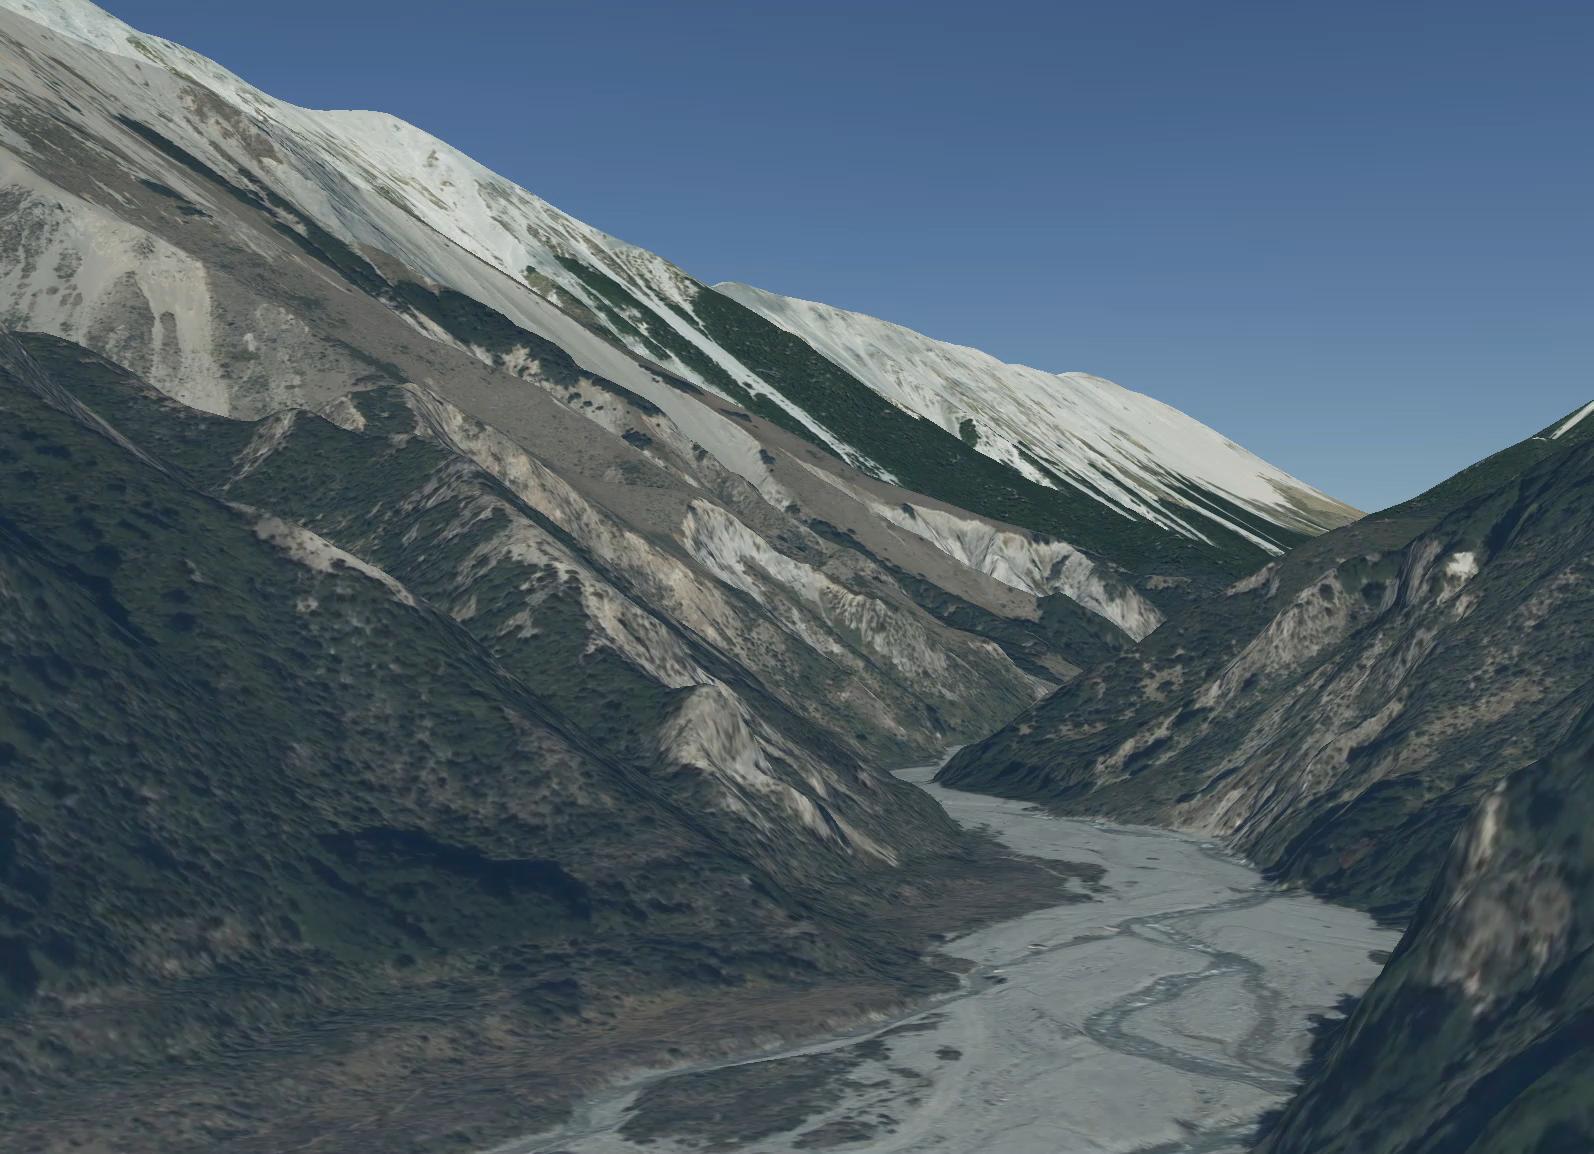
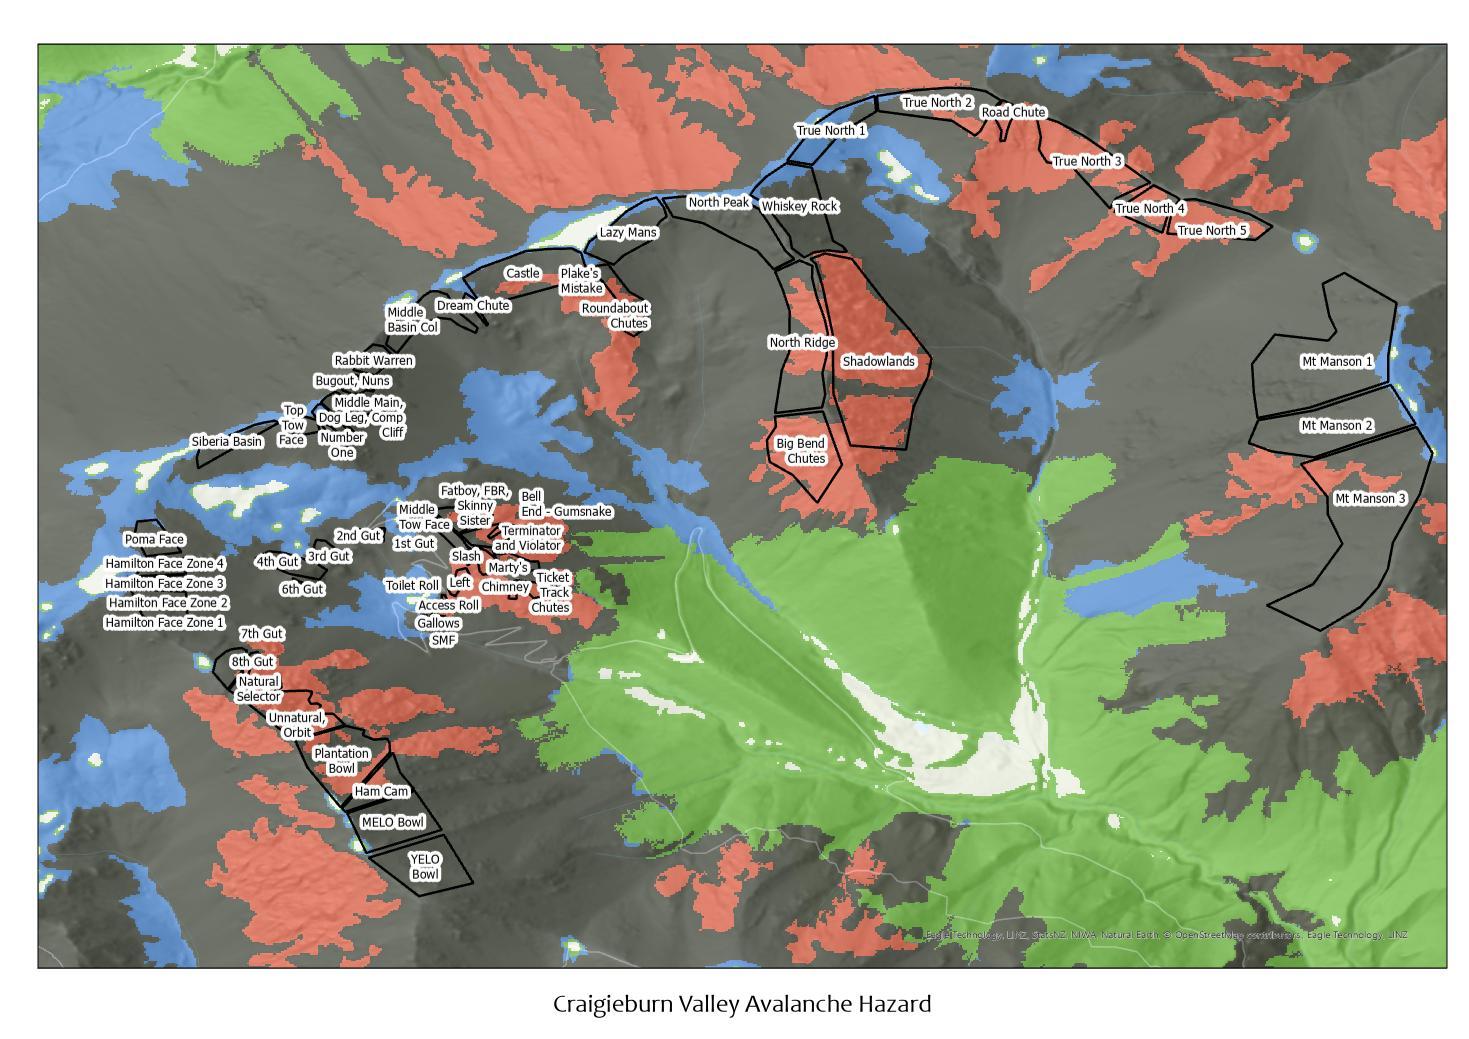
• ATES generation at the ski area scale
• ATES generation at the range scale
• ATES generation at the regional scale
• ATES generation at the national scale
• Embedding into existing systems
• Integrating with snowpack, weather
• A(valanche)I(ntelligence)
• But first… data.
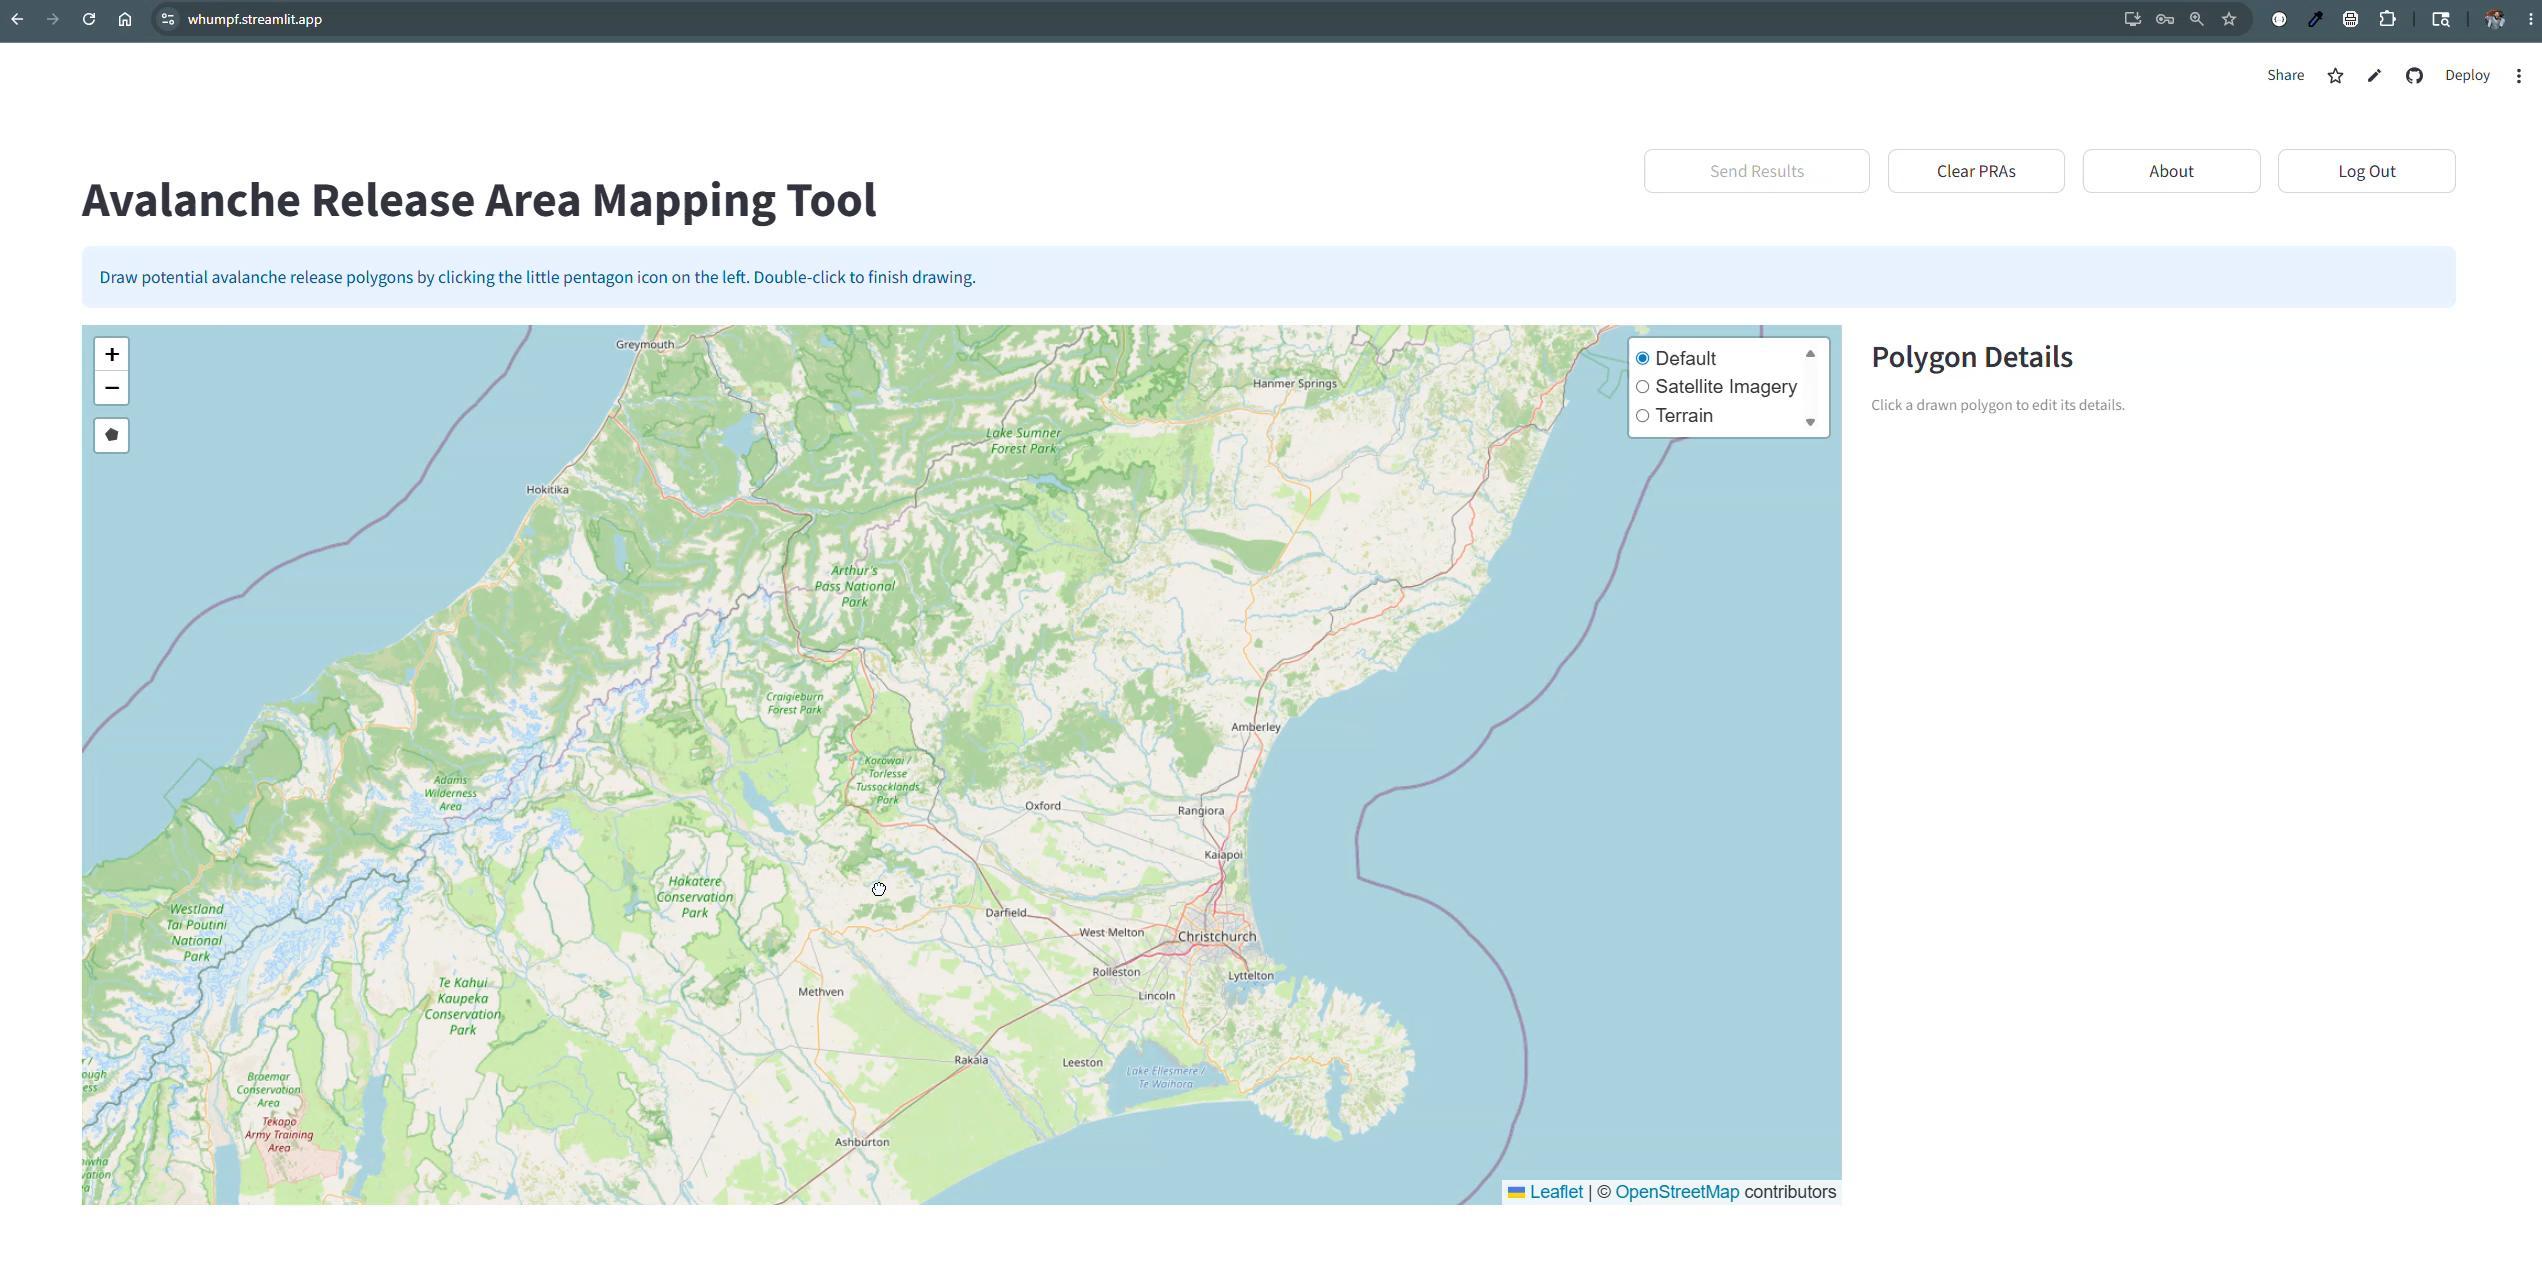






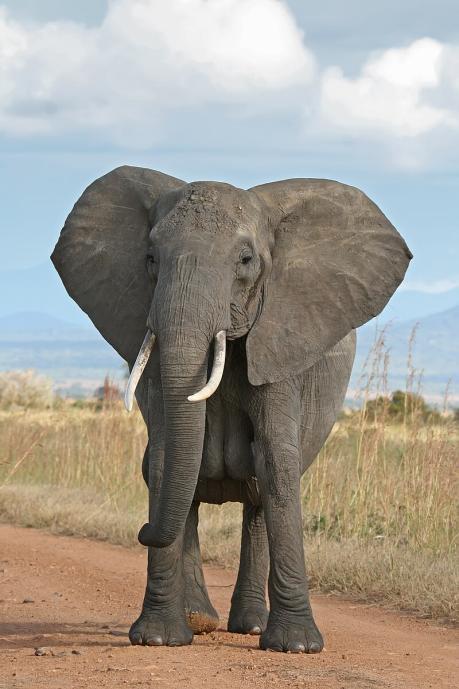
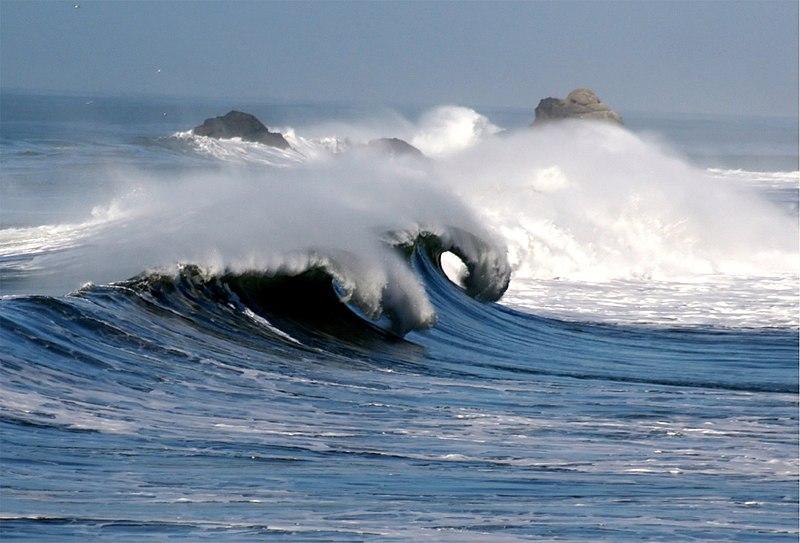
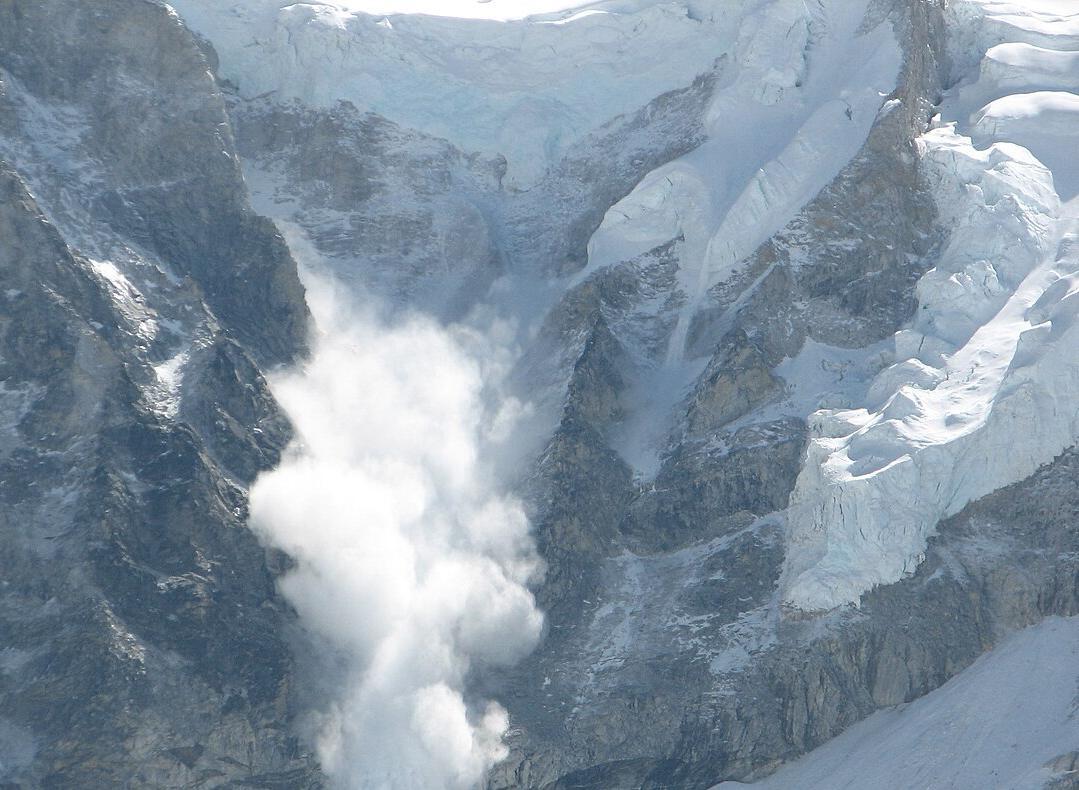
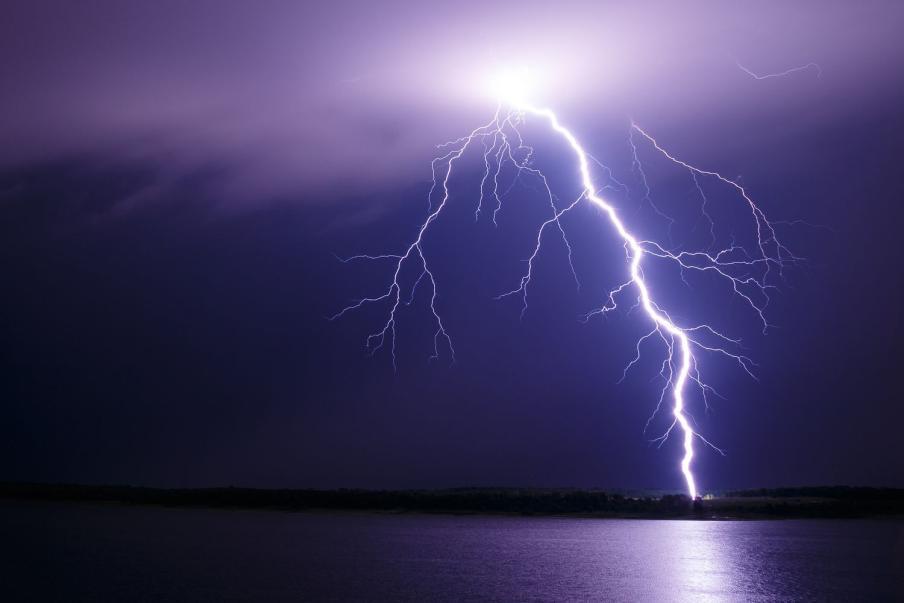
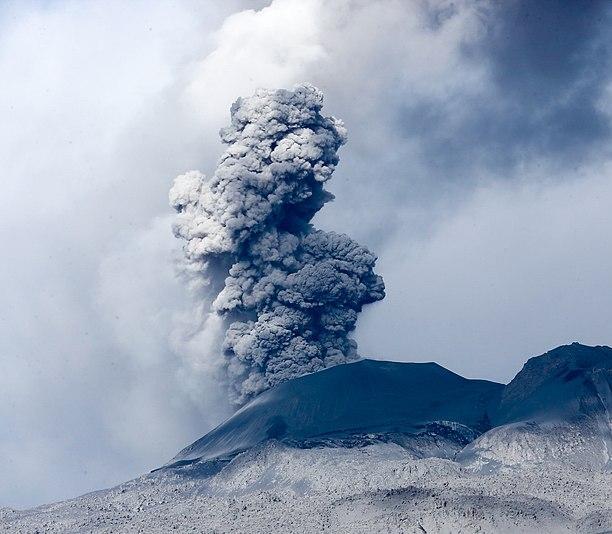
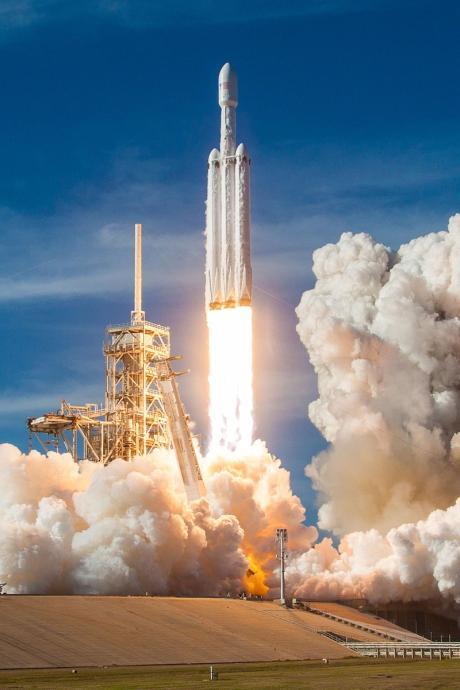
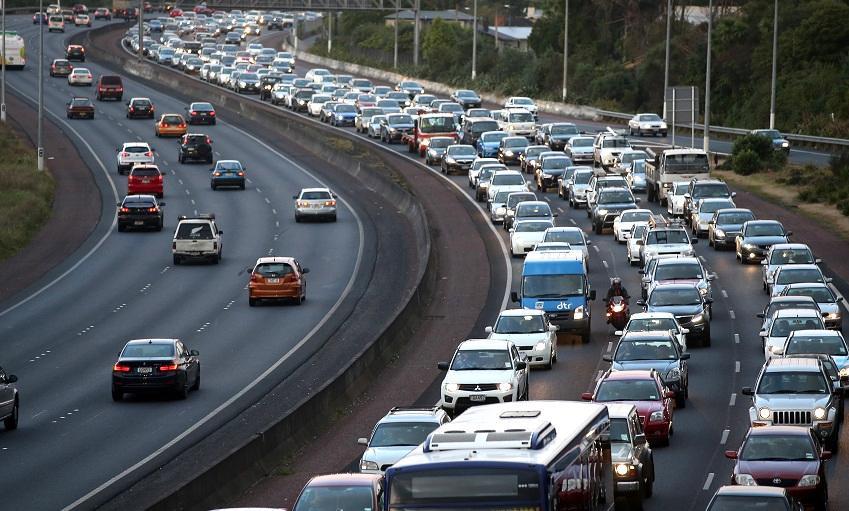
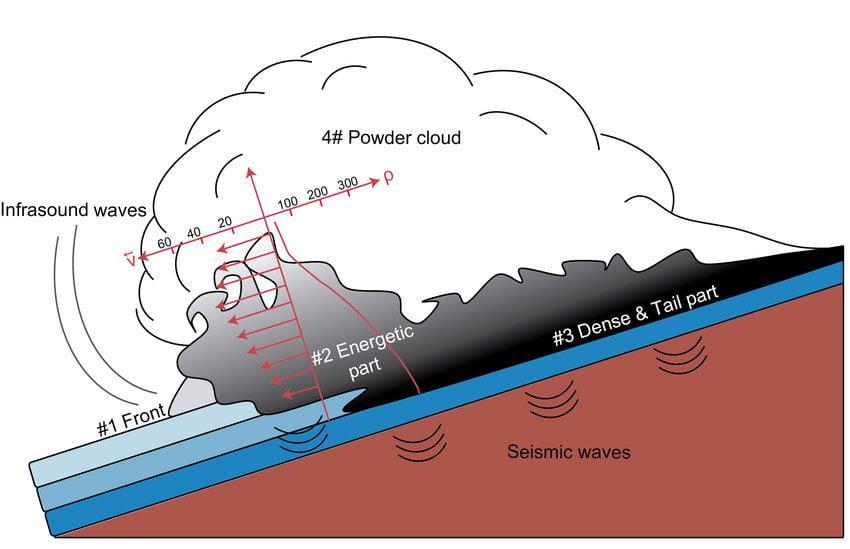
There are many natural and human sources of infrasound
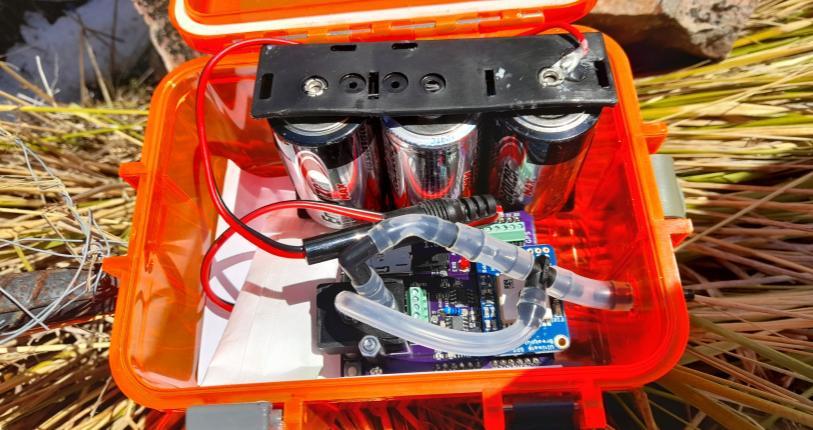
• Extensive spatial coverage
• Unaffected by visibility conditions
• Continuous, passive monitoring
• Cost effective and low impact deployment
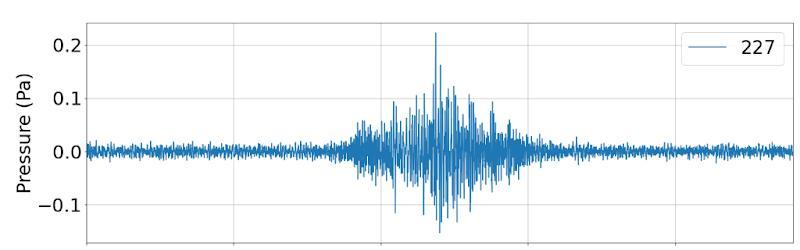
Signal from an avalanche detected in the Hooker Valley
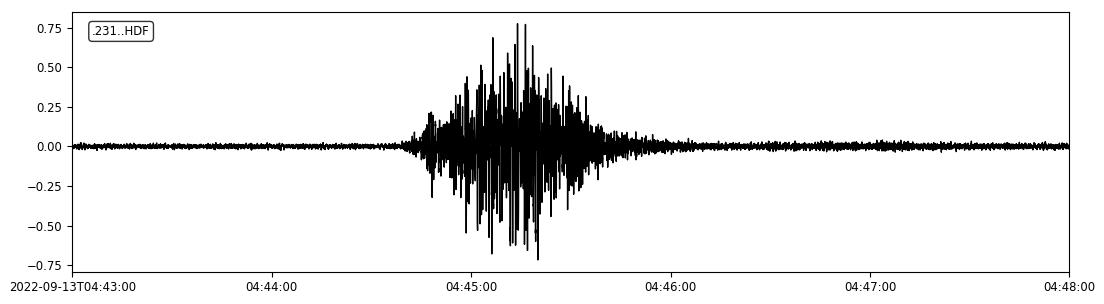
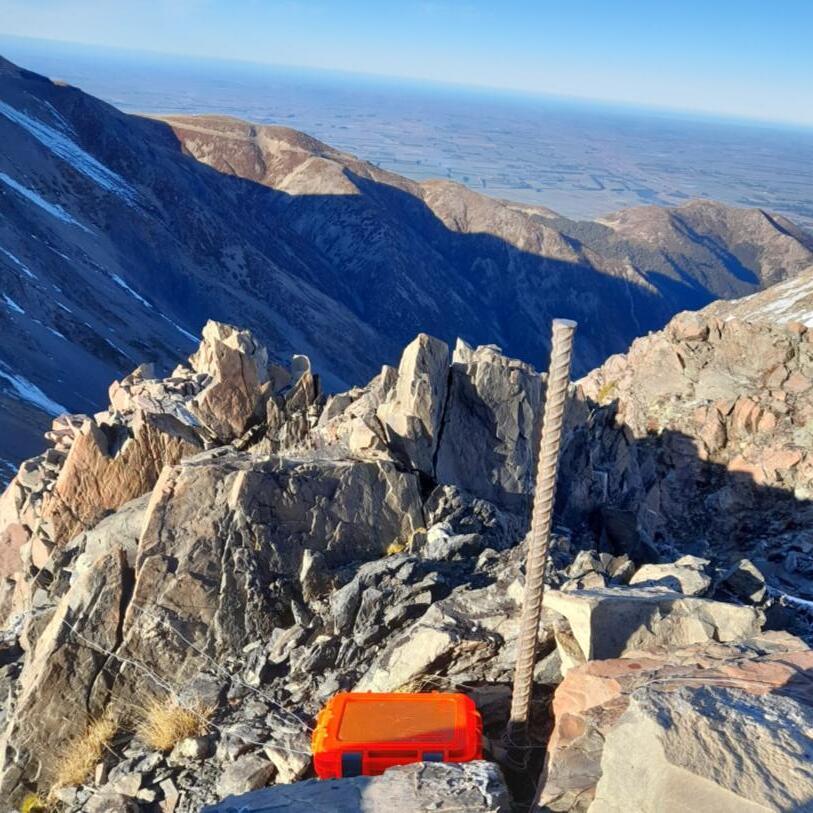
Cross correlation measures how similar two time series are to each other.
High correlation during avalanche
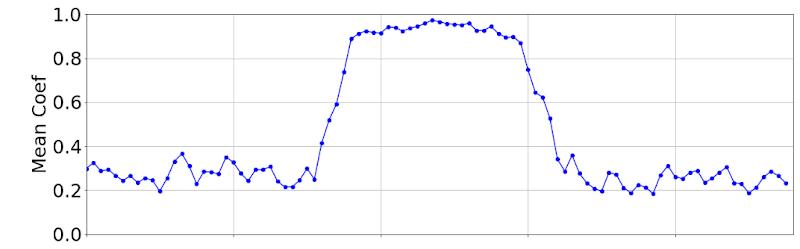
Low correlation before and after avalanche
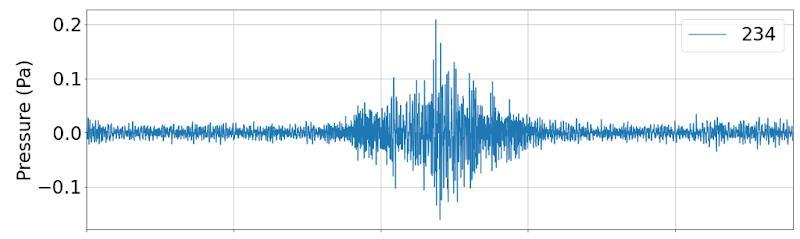
Cross correlation measures how similar two time series are to each other.
Propagation speed measures how fast the signal travels across the array.
High correlation during avalanche
Low correlation before and after avalanche
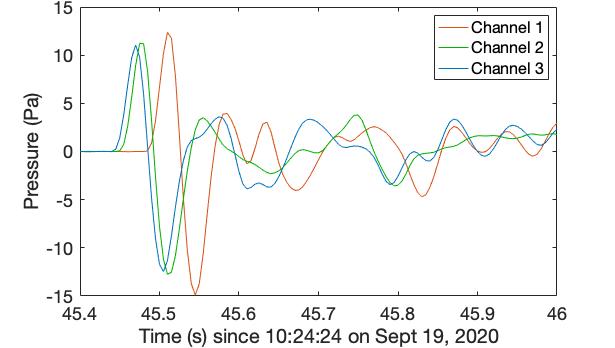
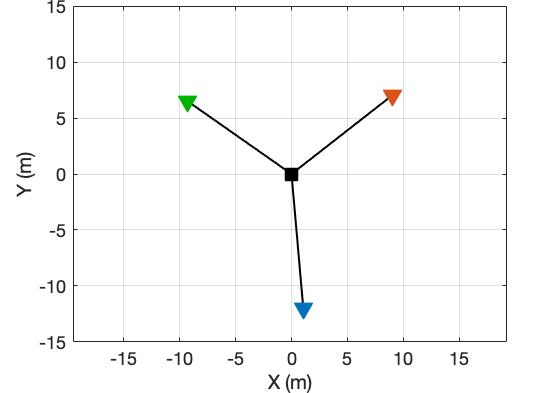
Propagation direction
Cross correlation measures how similar two time series are to each other.
Propagation speed measures how fast the signal travels across the array.
High correlation during avalanche
Low correlation before and after avalanche
Propagation direction
Back azimuth measures where the signal came from.

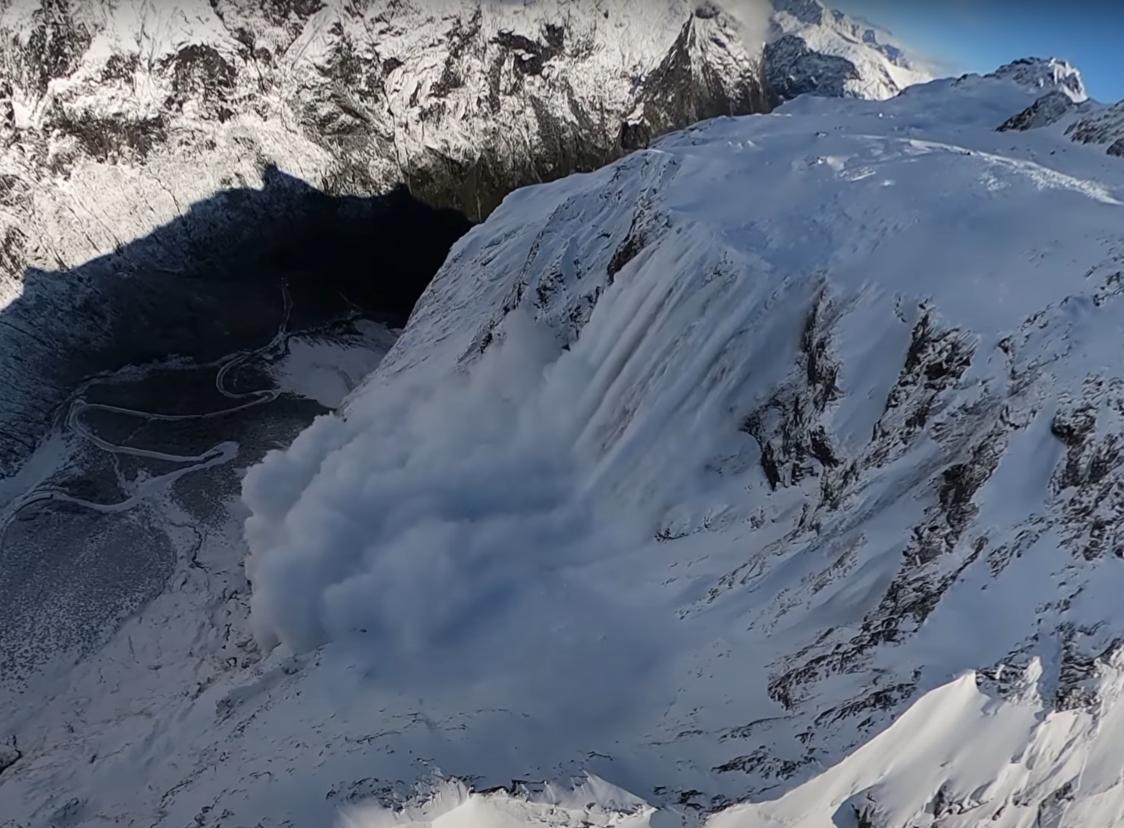
Milford Road Study
• First infrasound monitoring site in New Zealand
• Unique location with steep topography and large avalanches
• Successfully detected controlled and natural avalanches
• Infrasound monitoring currently used operationally
Milford Road Study
• First infrasound monitoring site in New Zealand
• Unique location with steep topography and large avalanches
• Successfully detected controlled and natural avalanches
• Infrasound monitoring currently used operationally
Milford Road Study
• First infrasound monitoring site in New Zealand
Hooker Valley Study
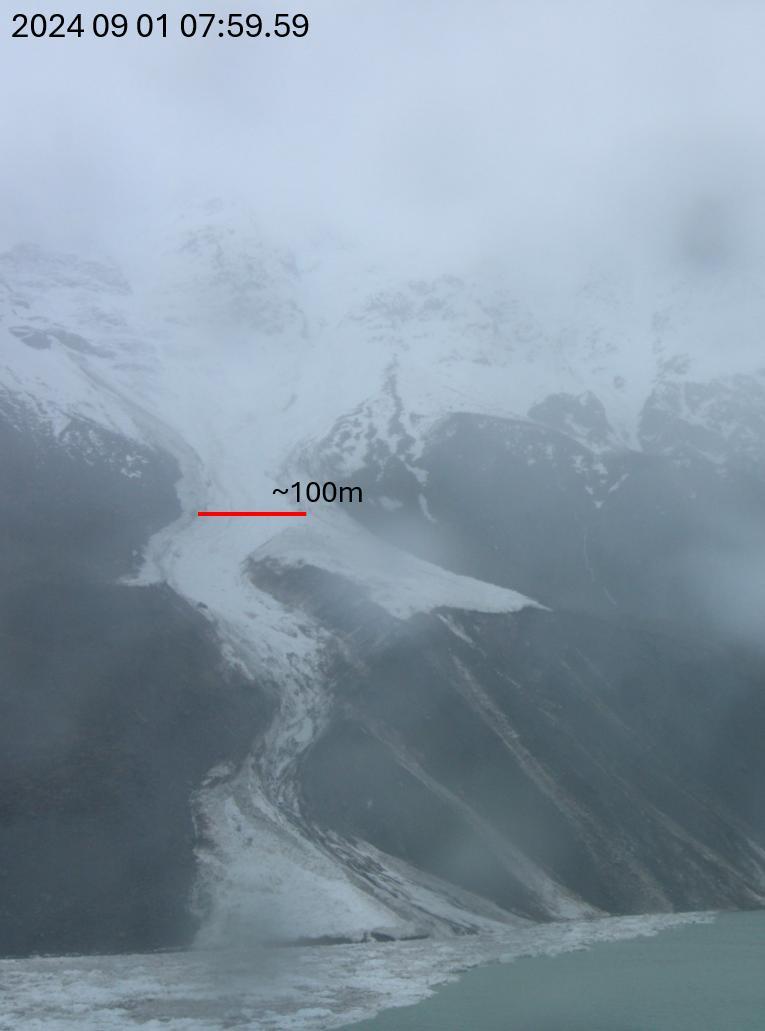
• 7 avalanches detected by camera, only 1 by infrasound
• Unique location with steep topography and large avalanches
• Estimated sizes ranged from 2.5 to 3.5
• Successfully detected controlled and natural avalanches
• Infrasound monitoring currently used operationally
• Other unknown detections outside of the camera field of view
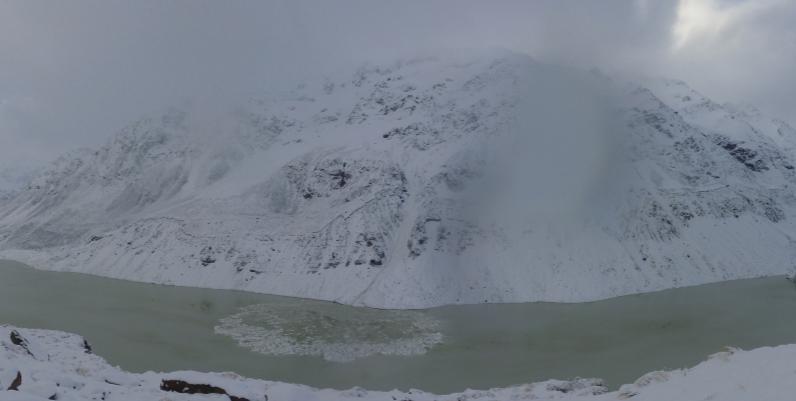
Milford Road Study
• First infrasound monitoring site in New Zealand
Hooker Valley Study
• 7 avalanches detected by camera, only 1 by infrasound
• Unique location with steep topography and large avalanches
• Estimated sizes ranged from 2.5 to 3.5
Current work at Mt Hutt
• Successfully detected controlled and natural avalanches
• Infrasound monitoring currently used operationally
• Other unknown detections outside of the camera field of view
• Investigate limitations of infrasound monitoring
• Consider operational application for ski areas such as supporting control work or access road safety in low visibility
Thanks to Mt Hutt for assistance with sensor deployment, providing avalanche observation logs and sharing valuable insight.
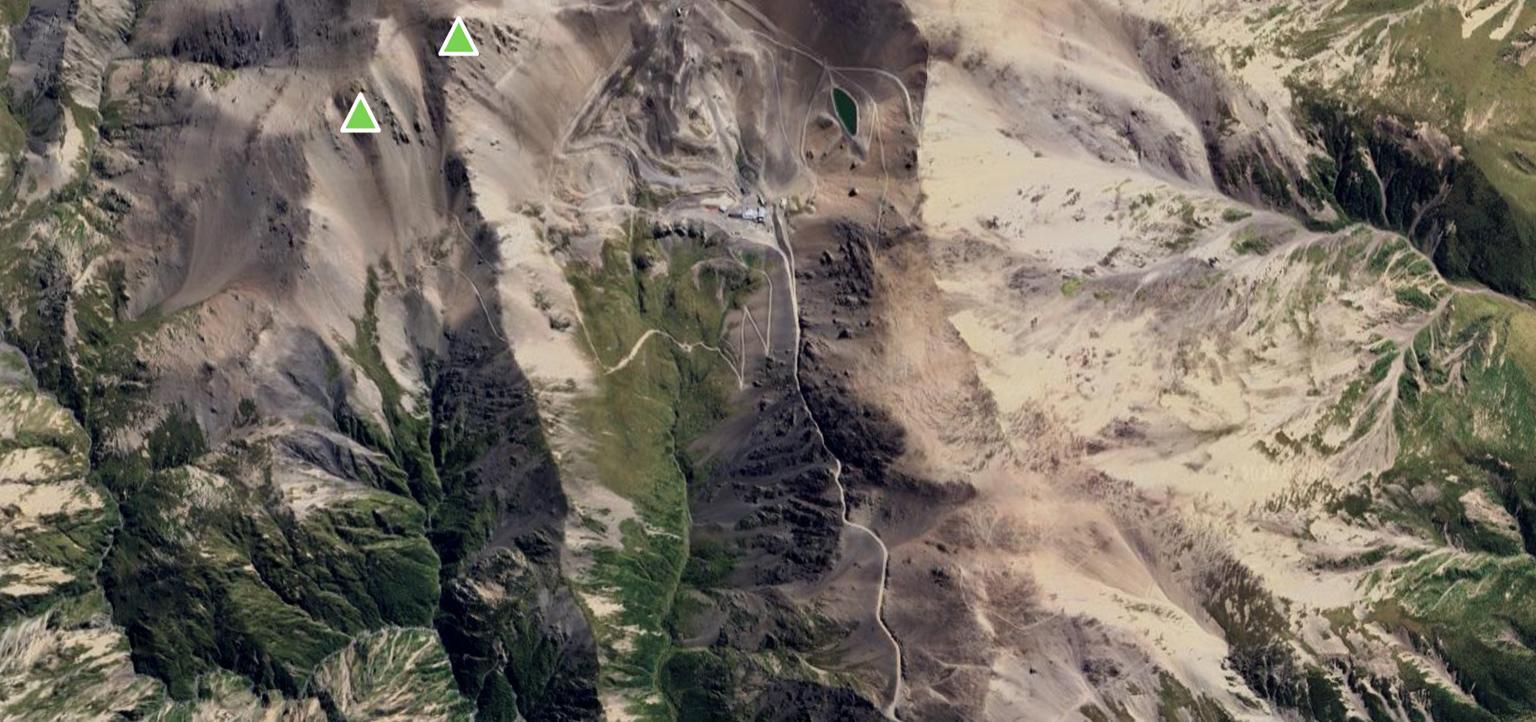
• One array of three sensors installed from July 14thSeptember 28th, 2025
• 12 controlled avalanches occurred during this time, estimated size 1.5 or smaller
• 26 signals were detected, all appearing to be explosive activity
• Could not distinguish if explosives lead to activity or not
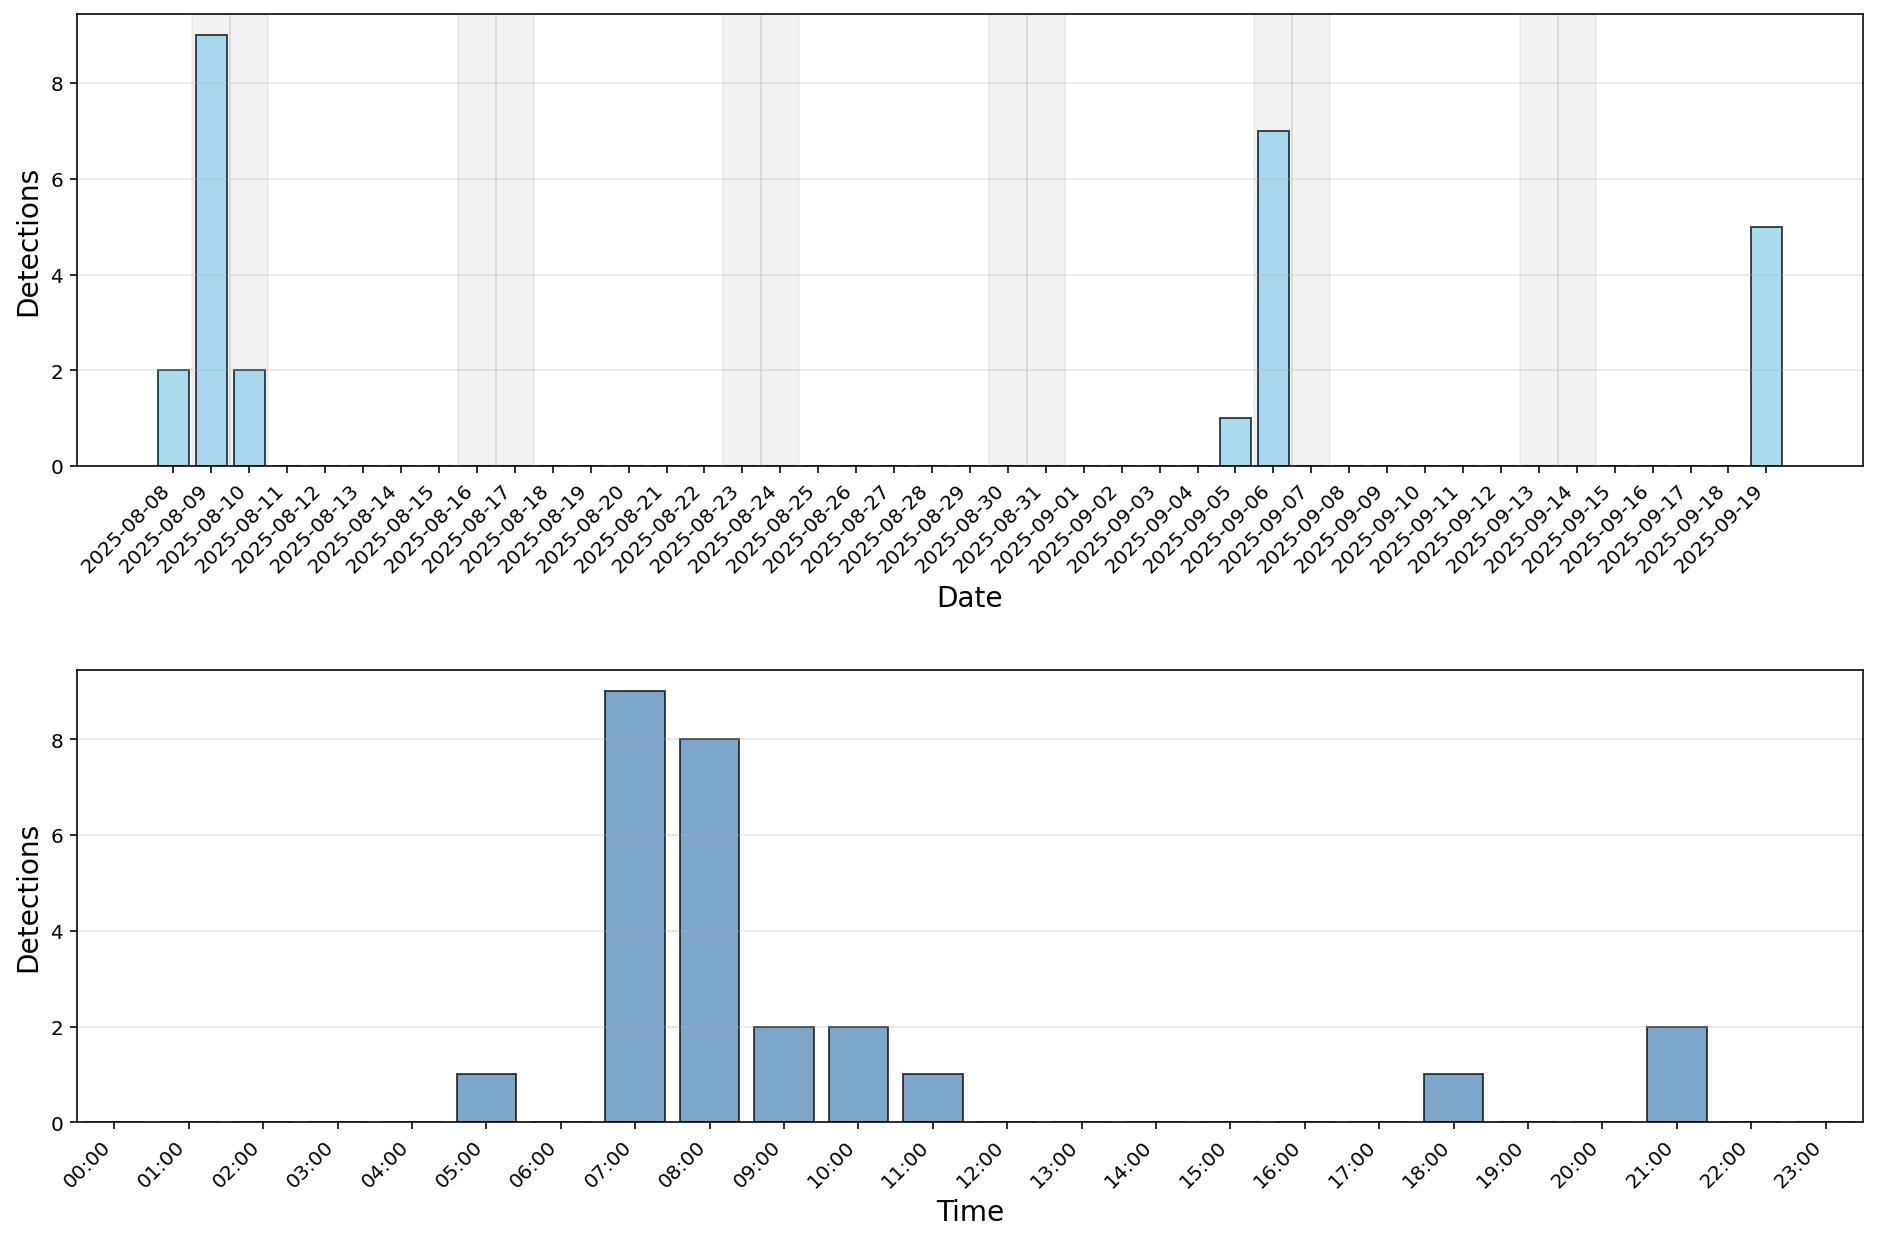
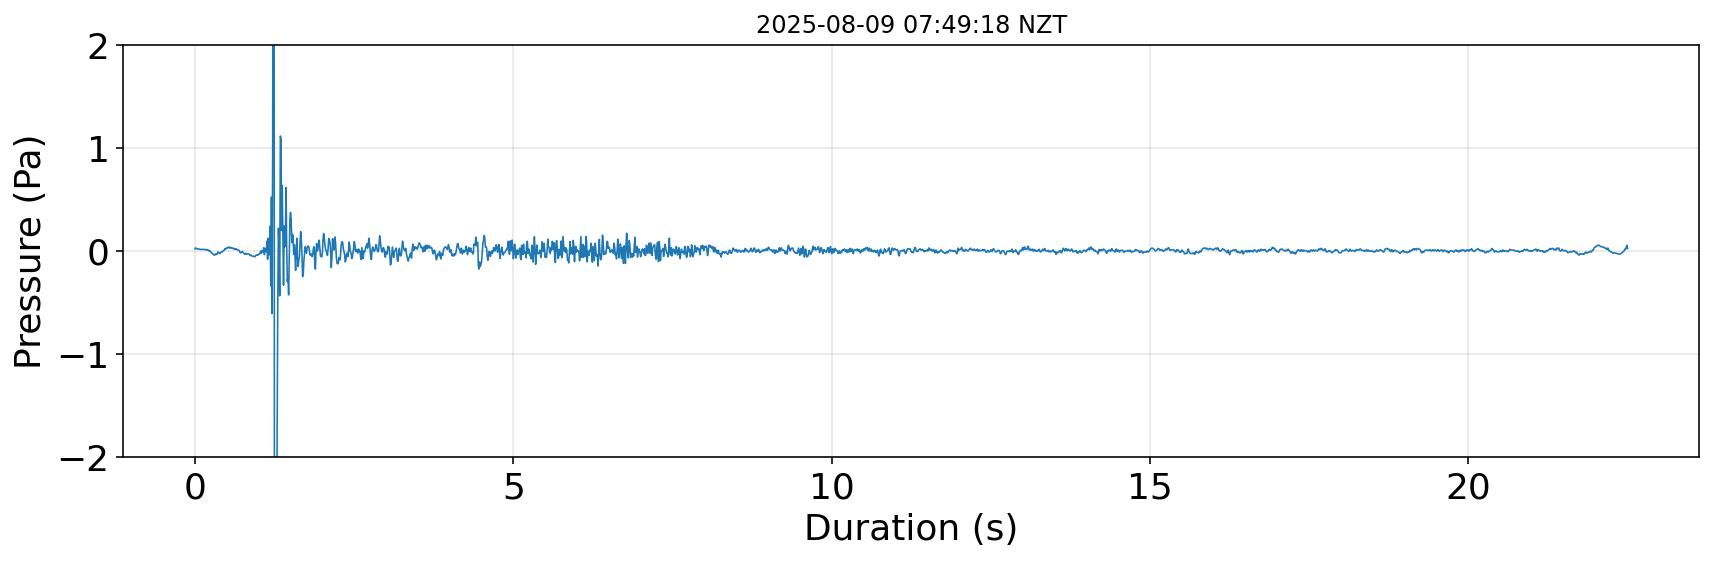
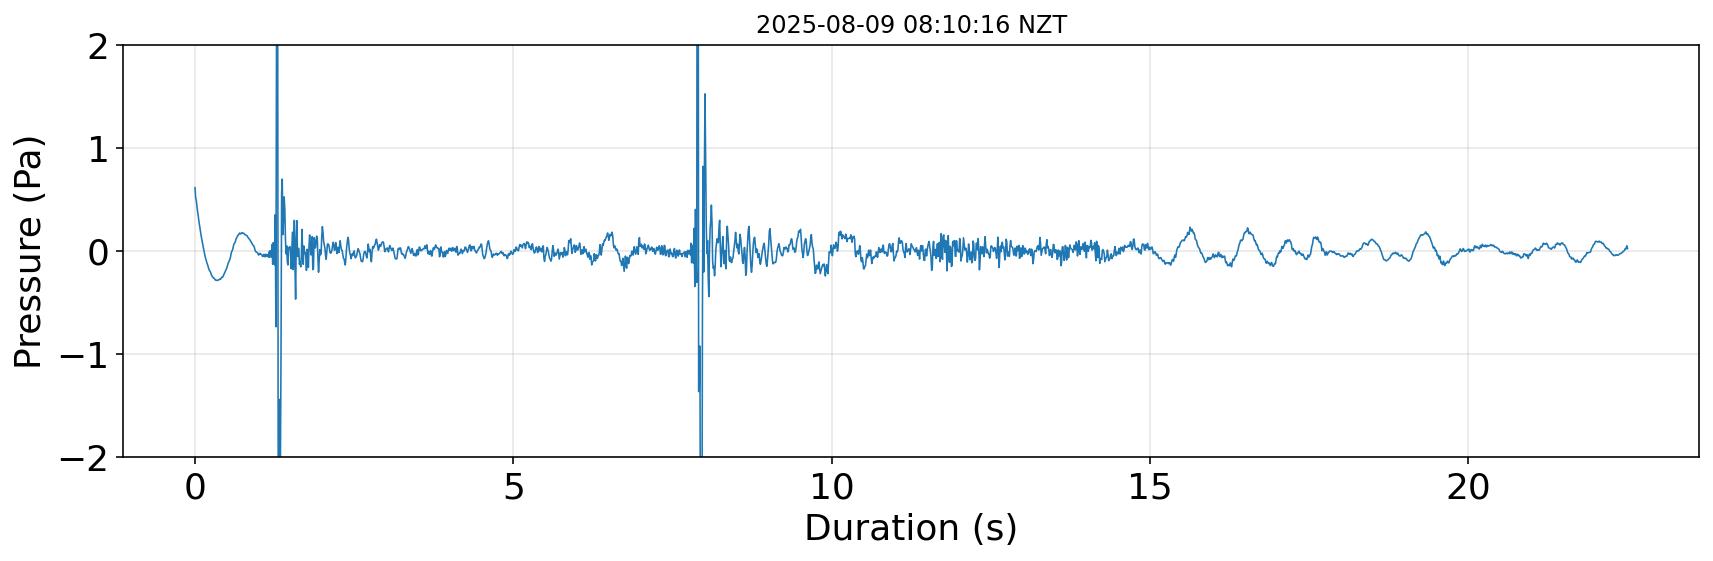
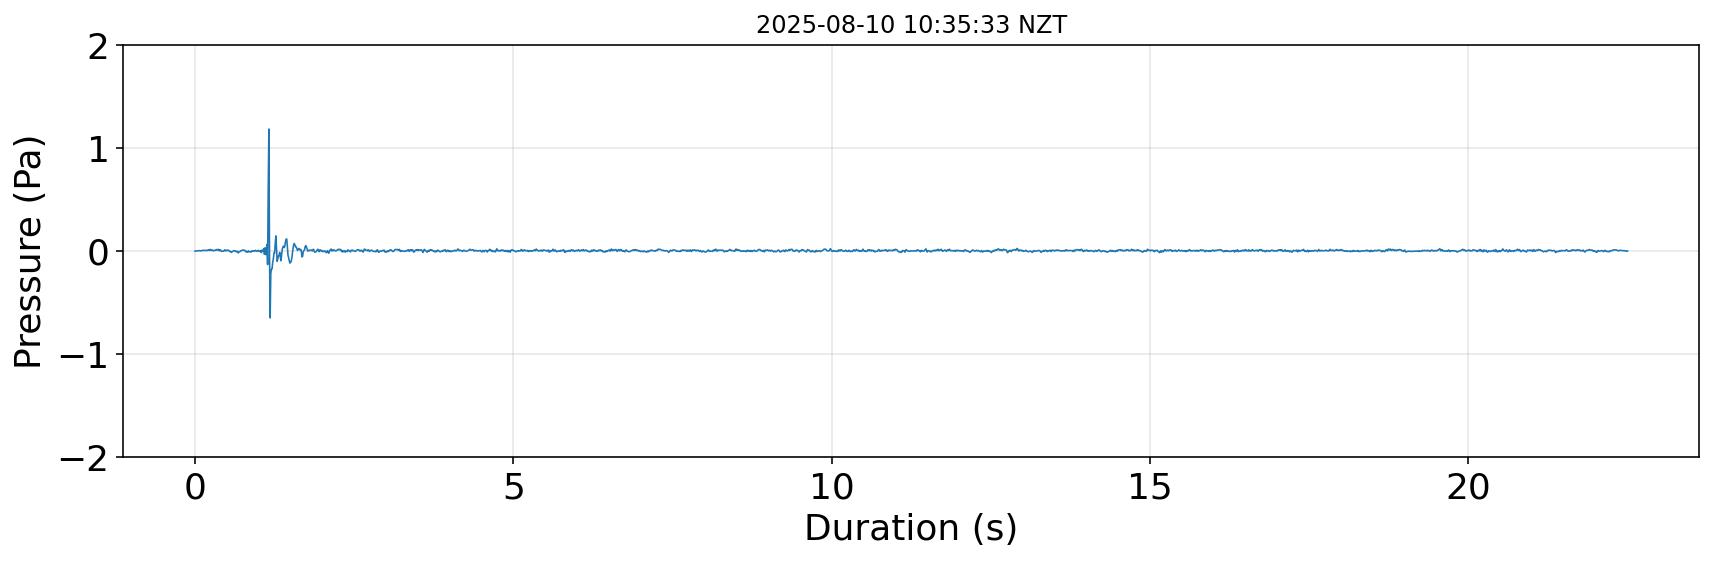
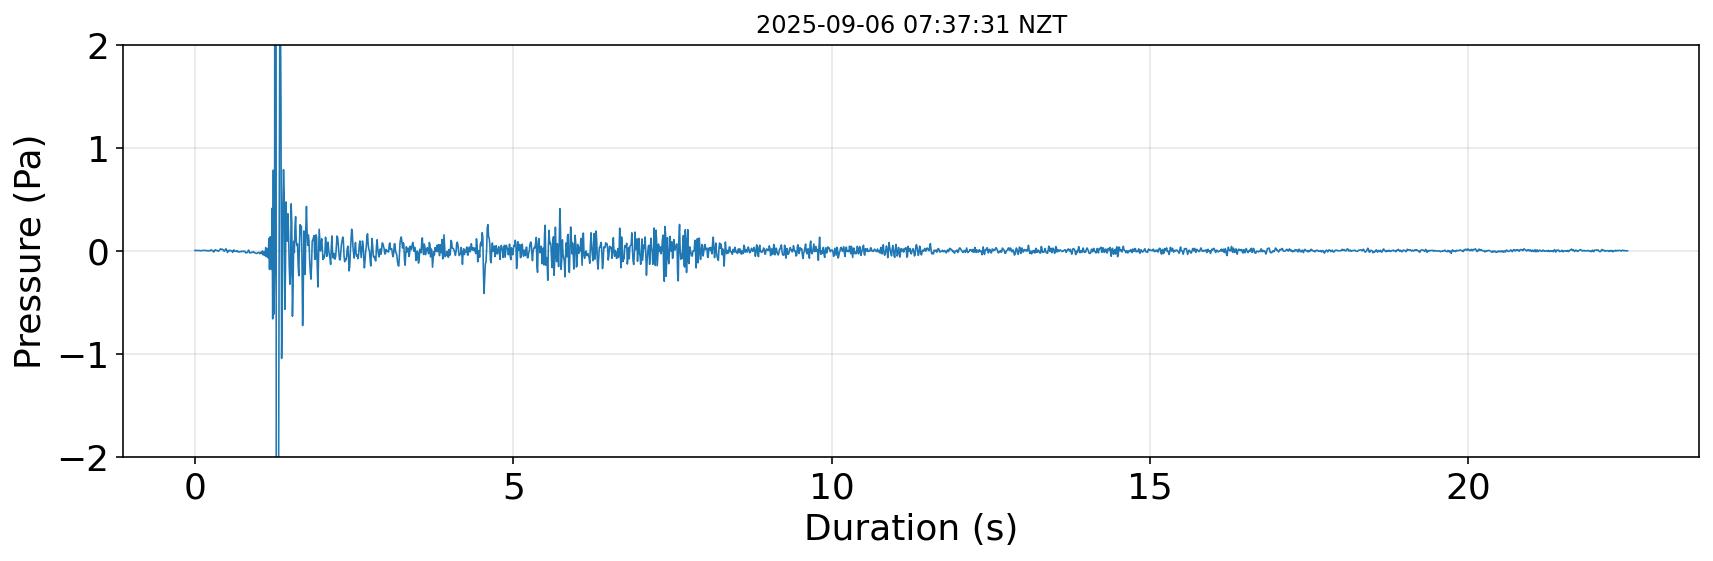
Detections are clustered on specific days, as expected following weather events
Mostly morning detections, aligning with typical avalanche control activity
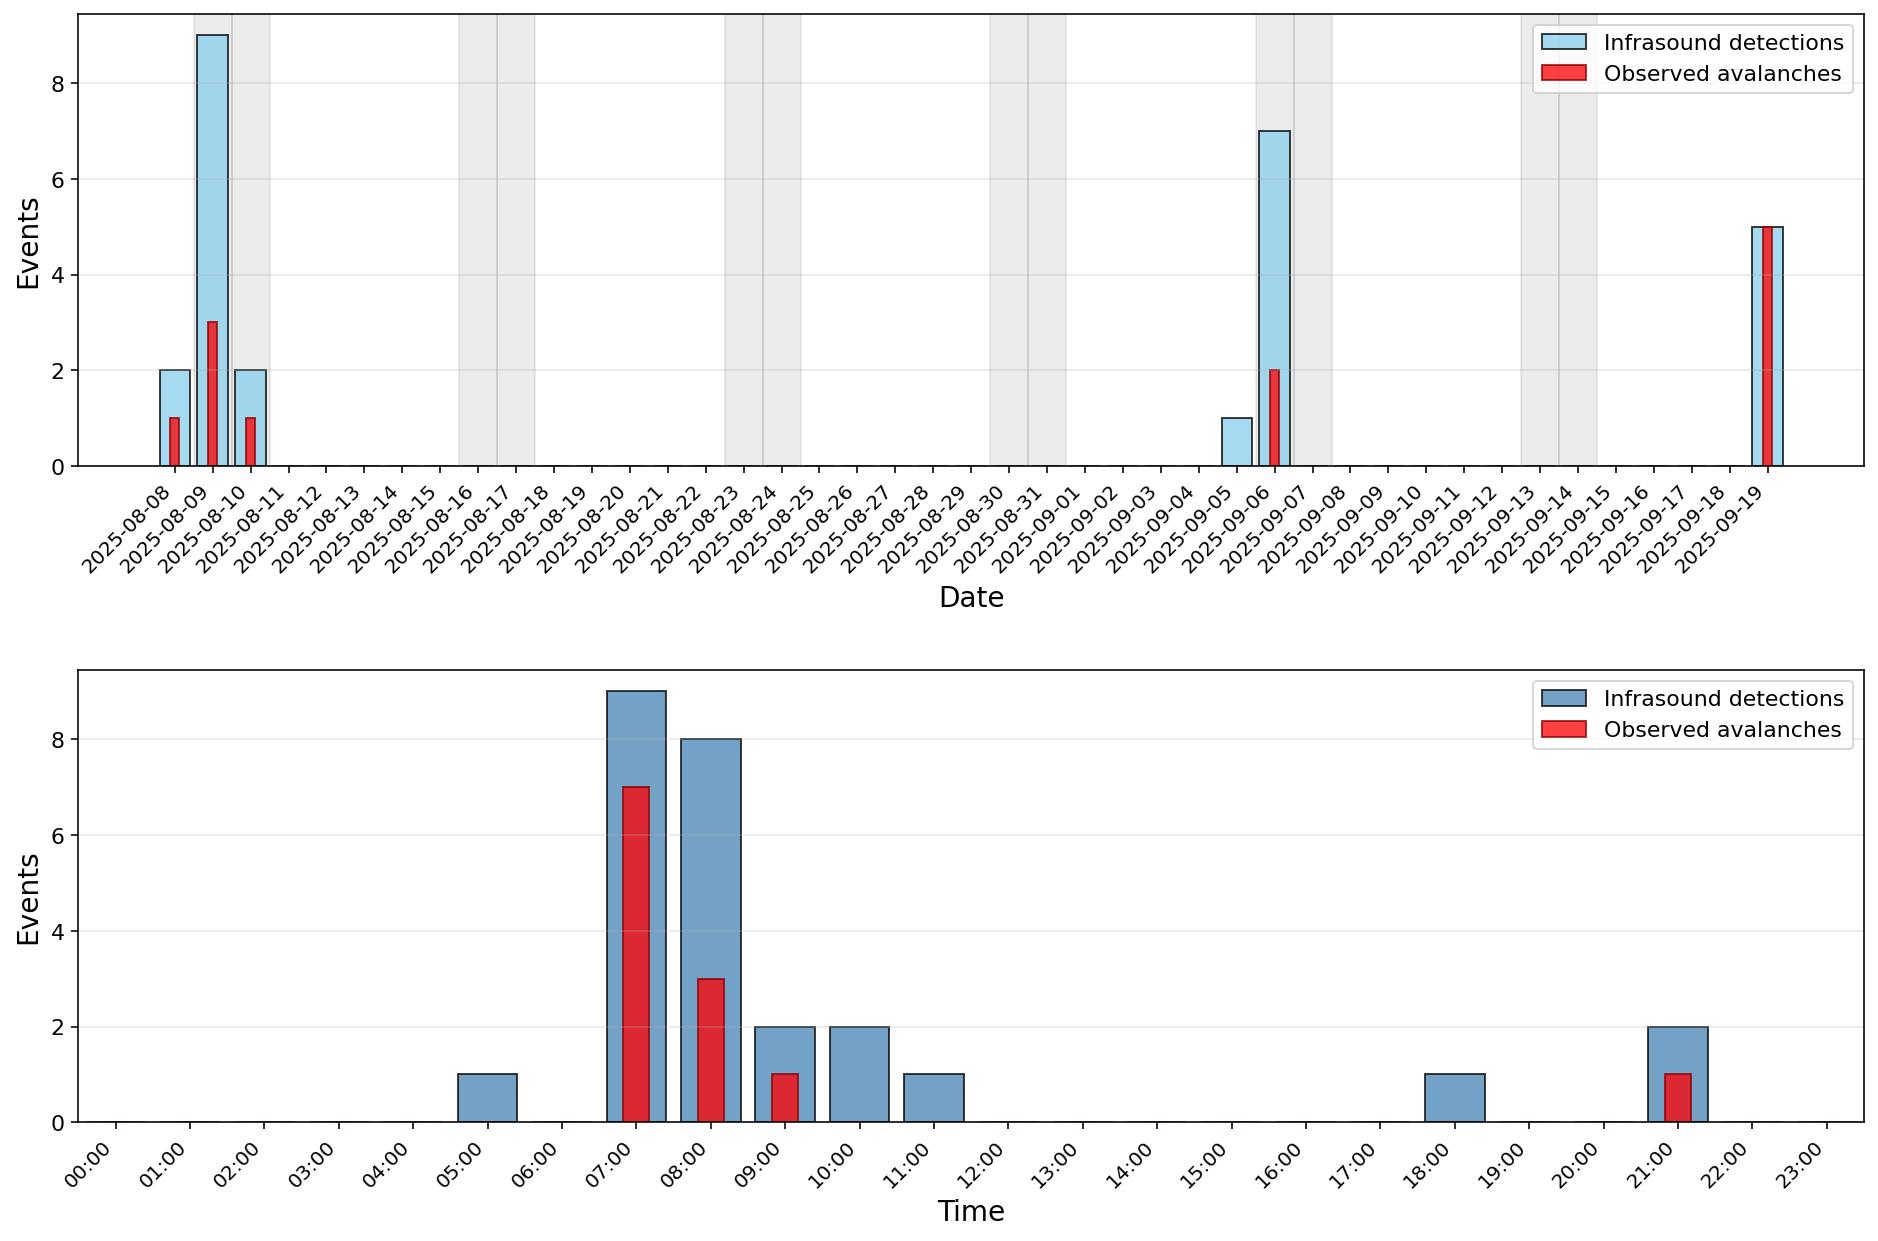
Detections match well with observed avalanches
More detections than avalanches as expected
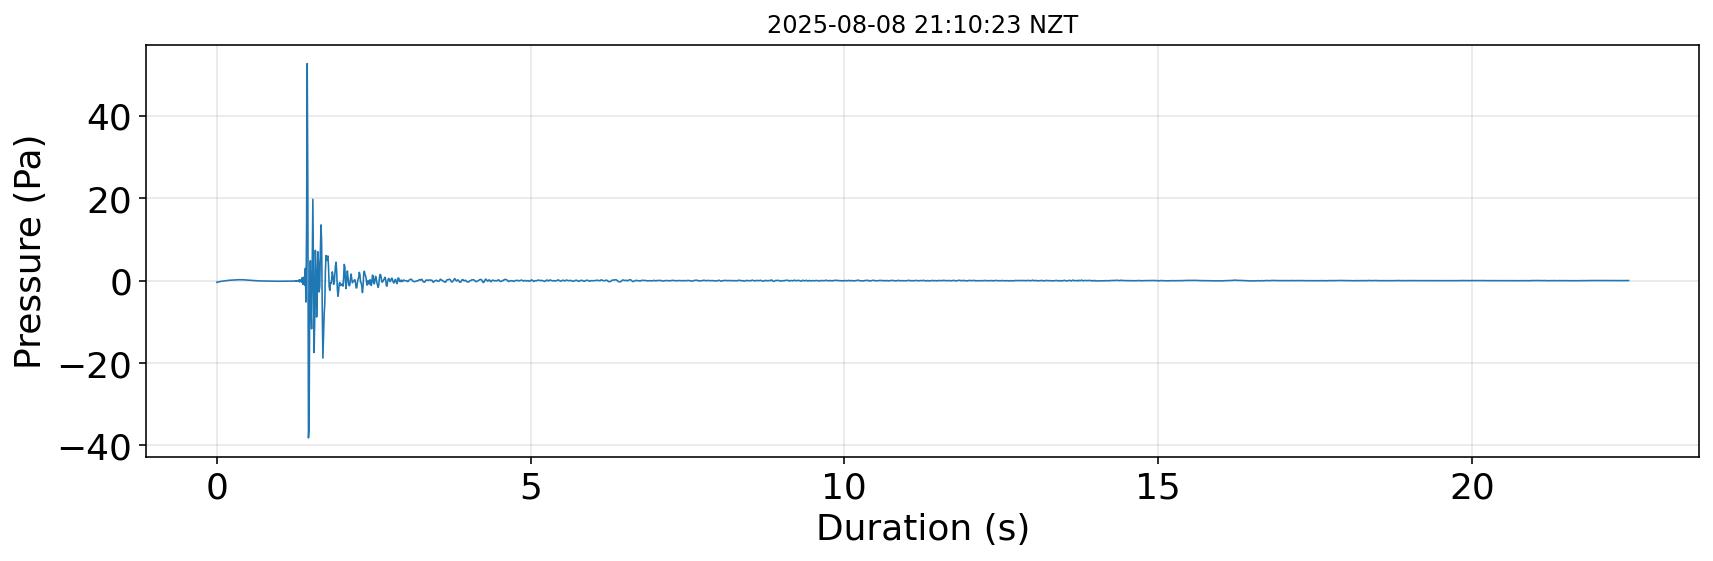
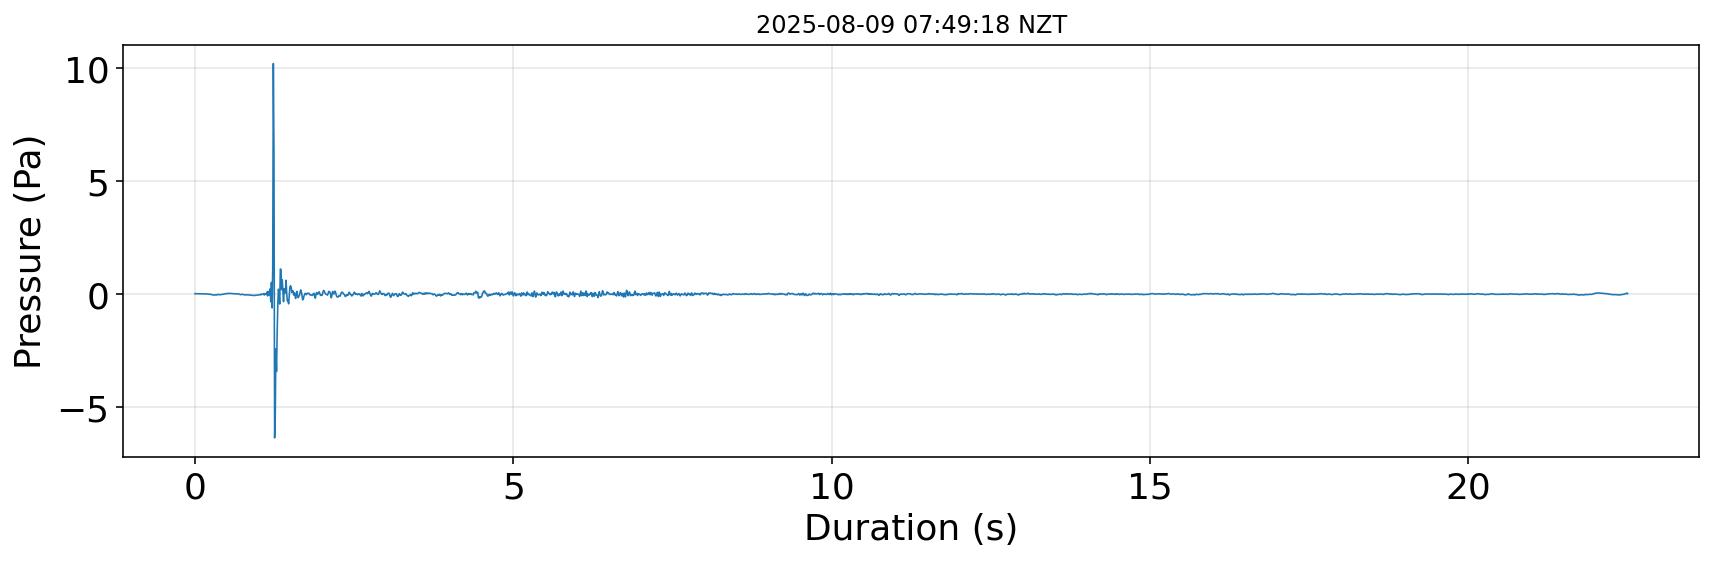
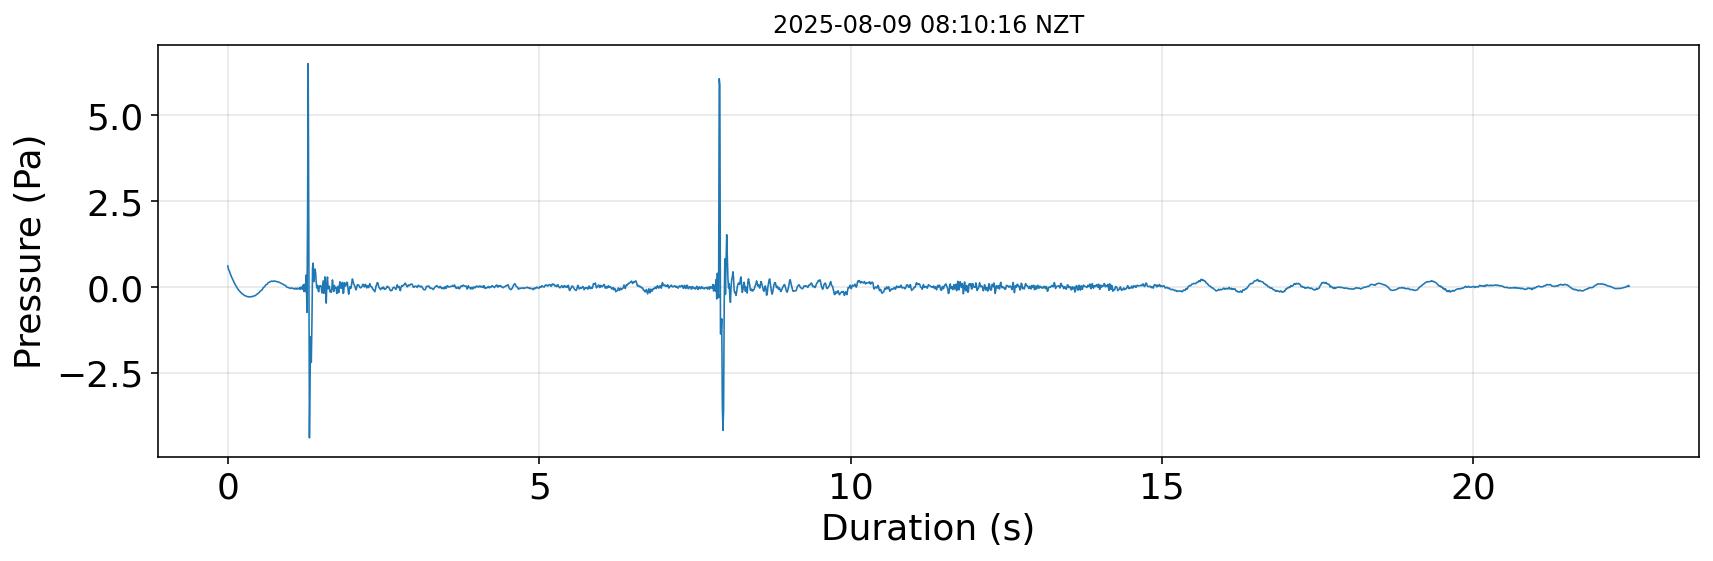
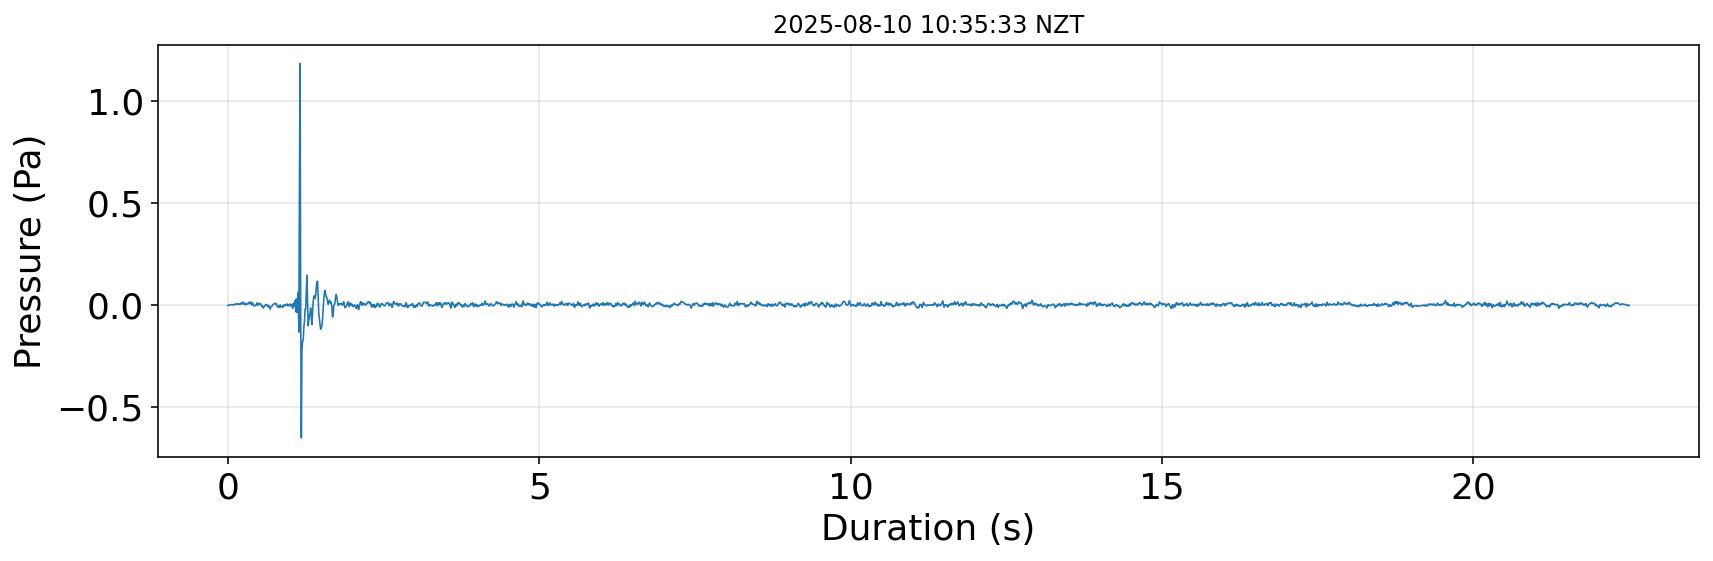
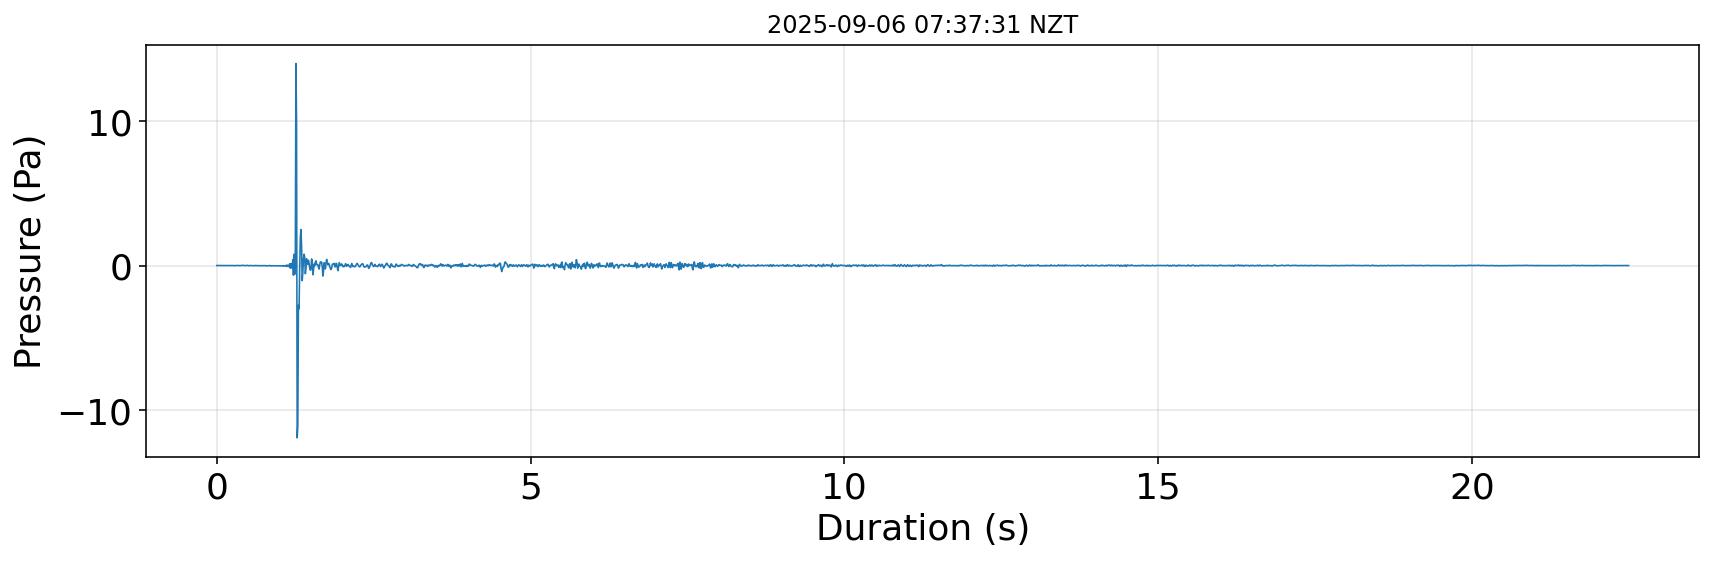
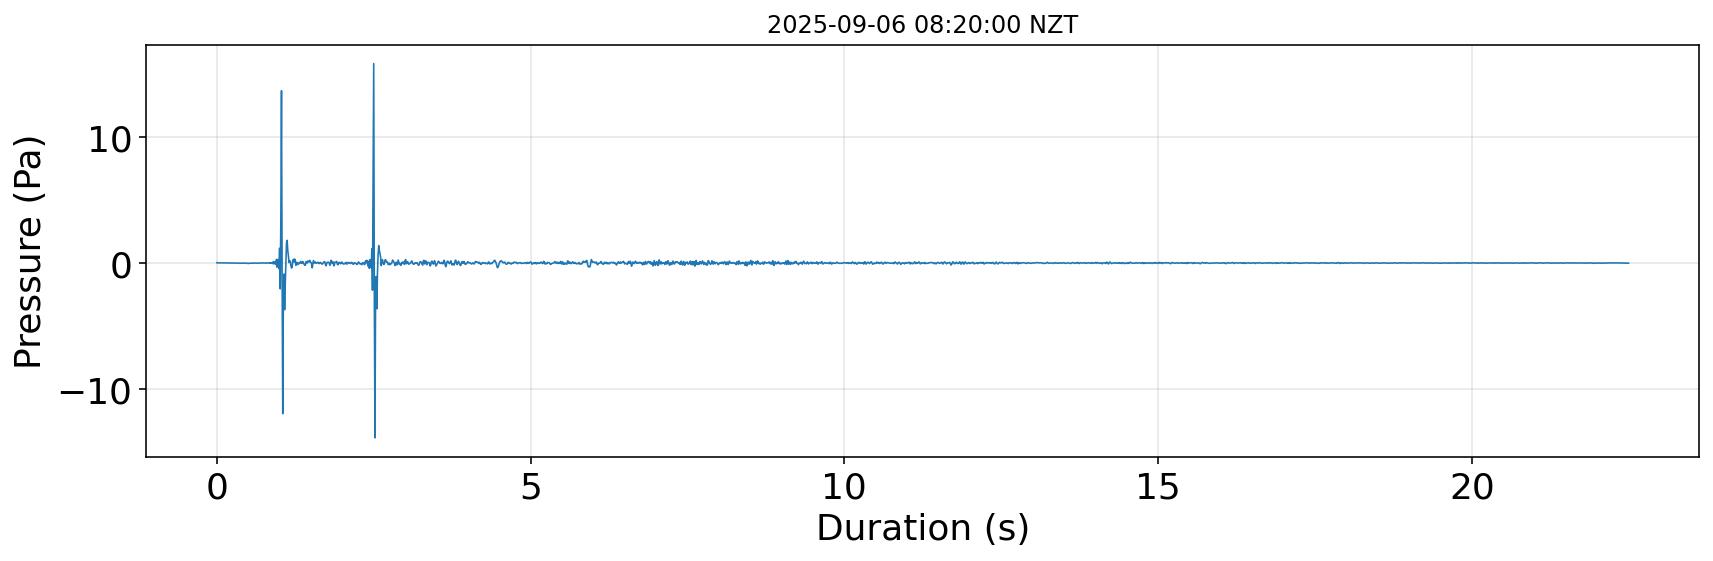
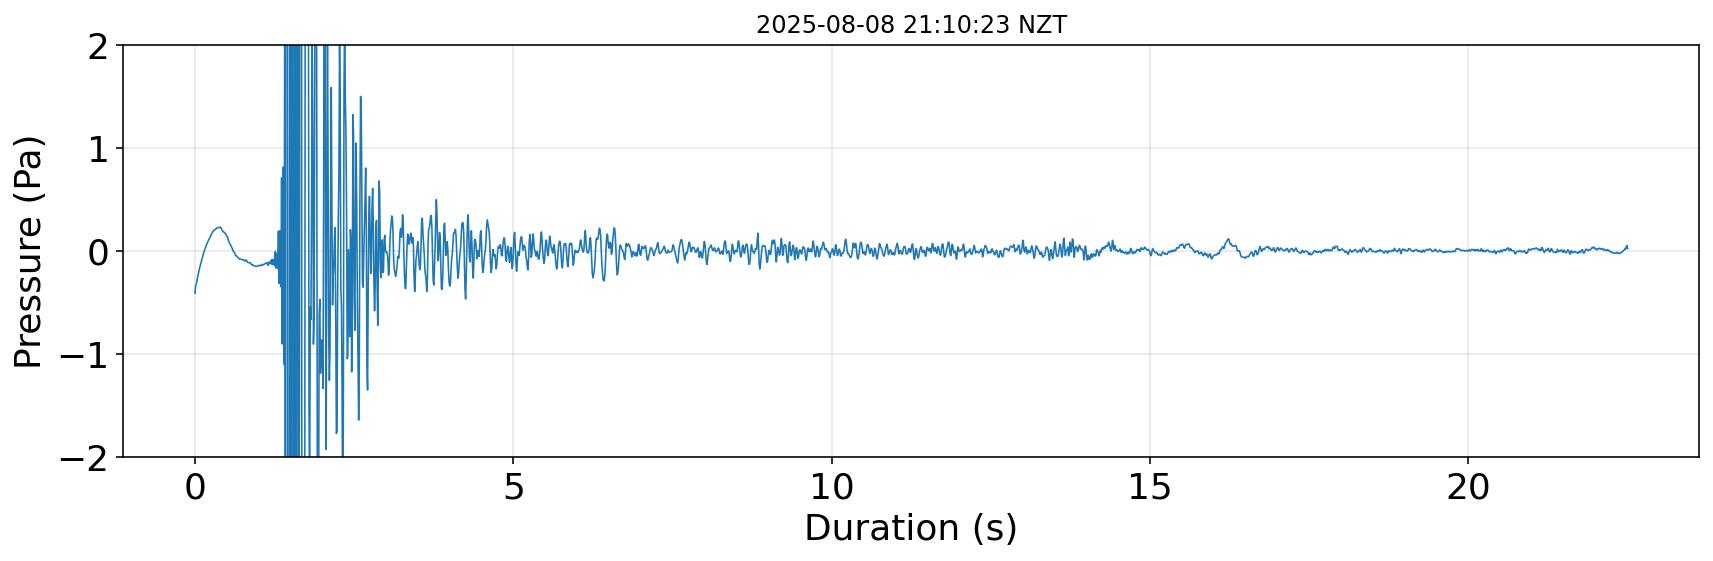
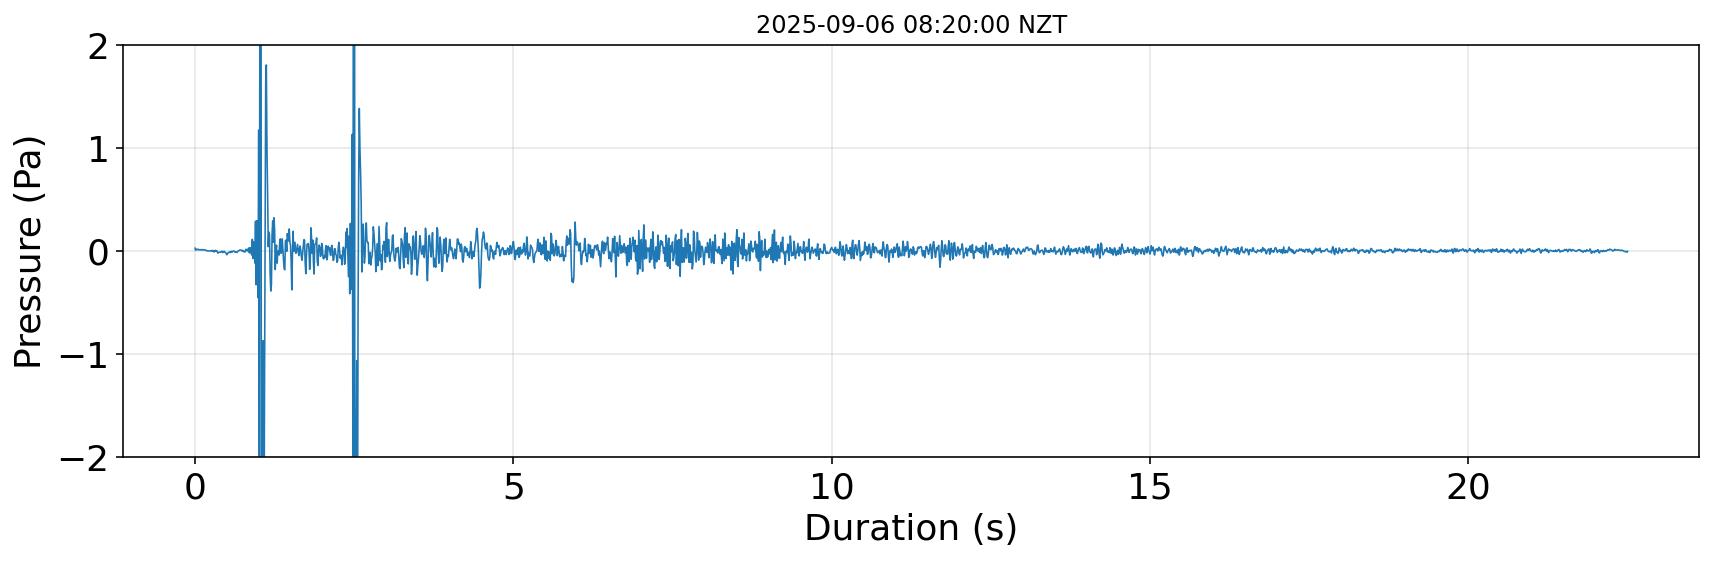
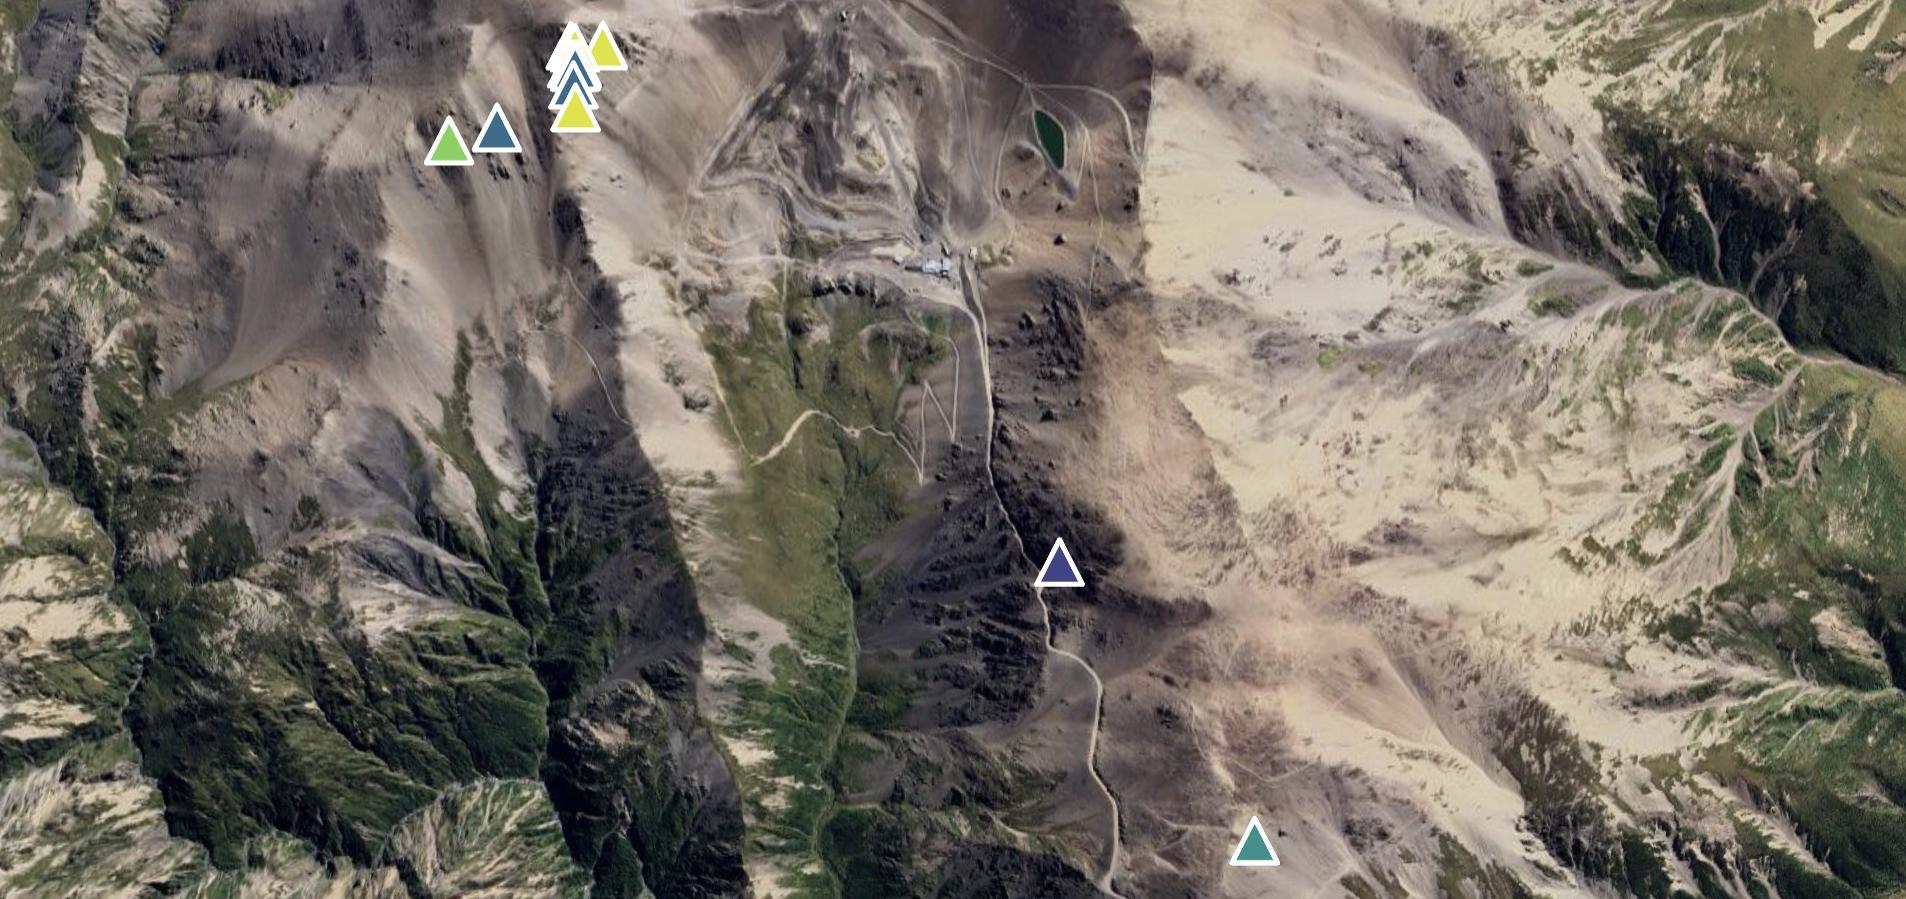
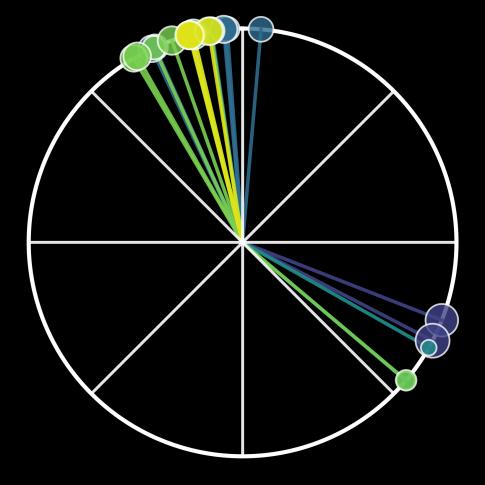
6th of September
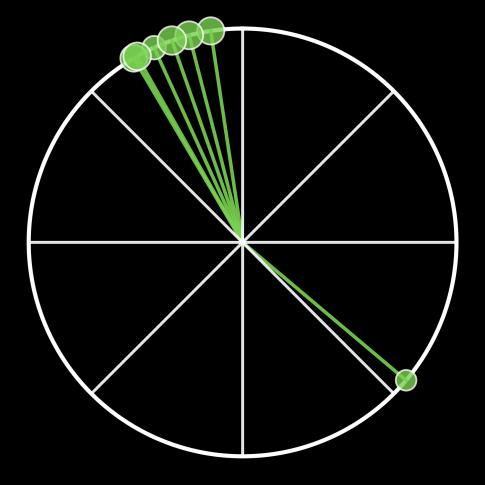
6th of September
th of September
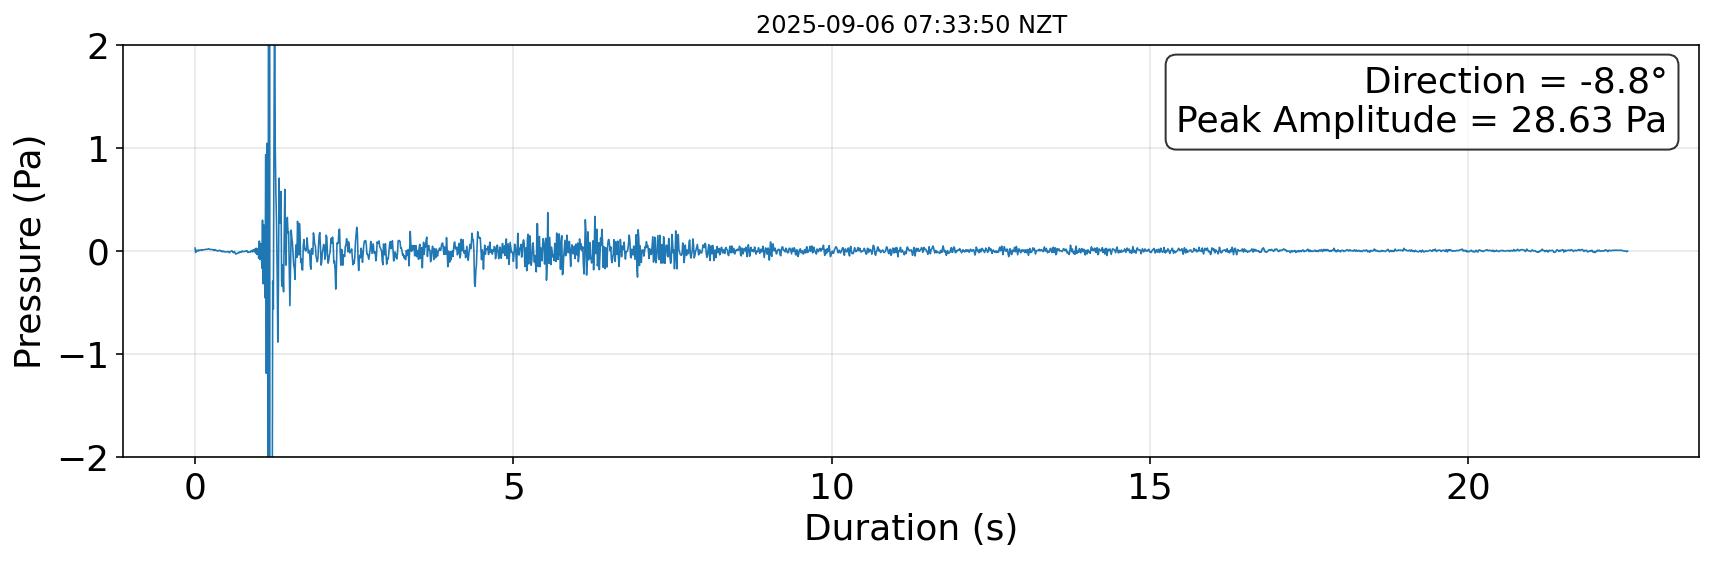
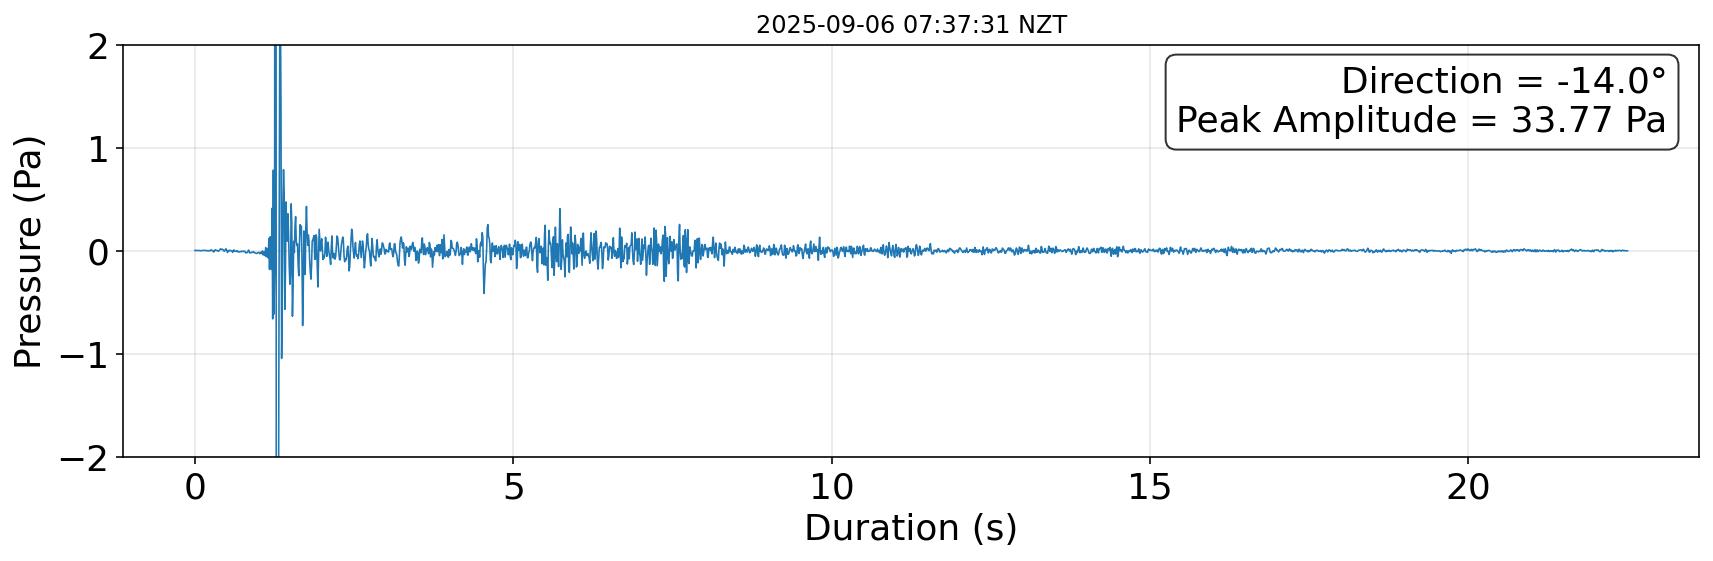
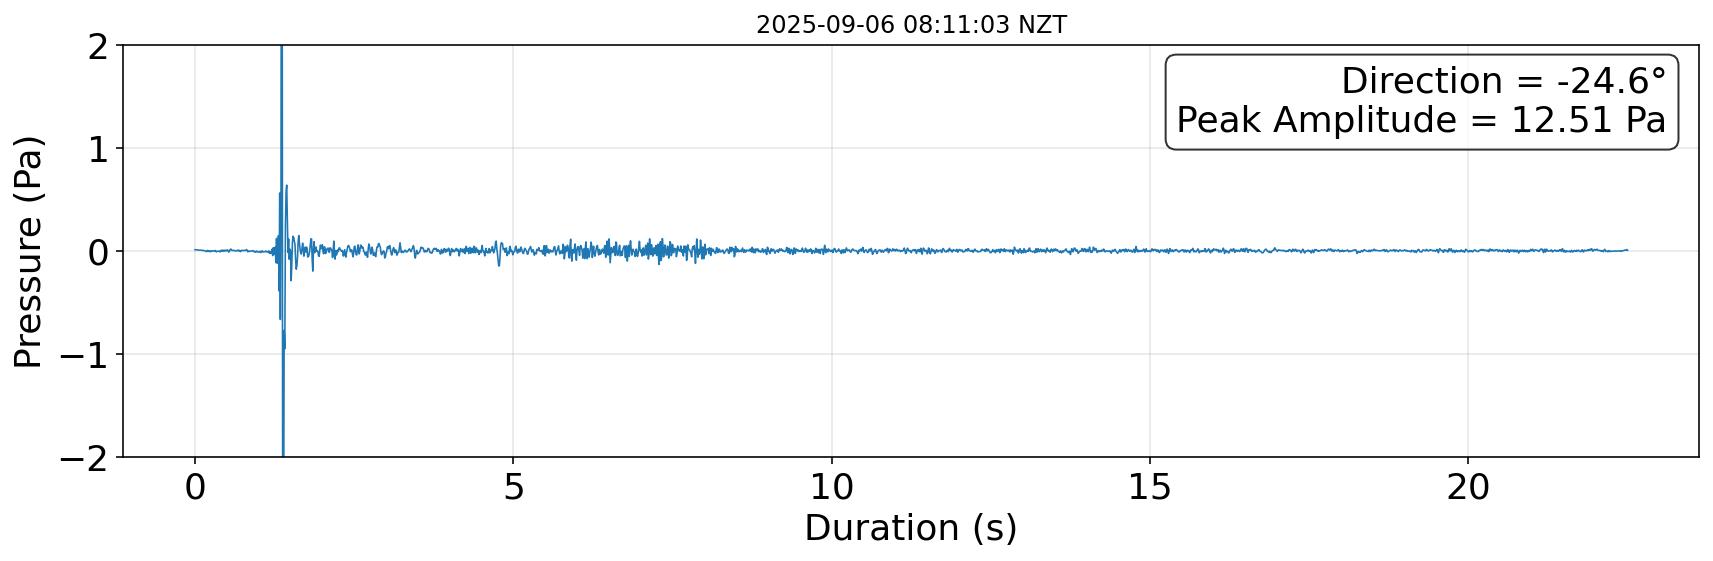
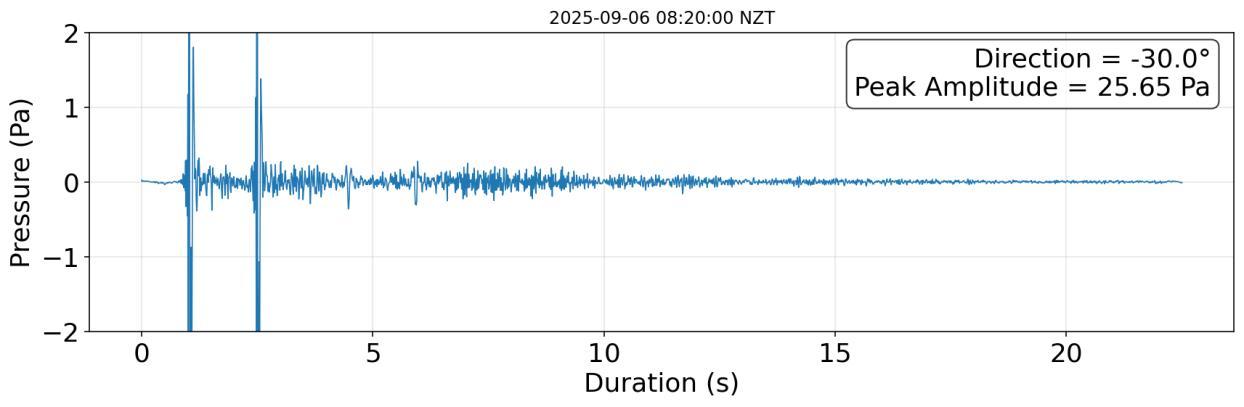
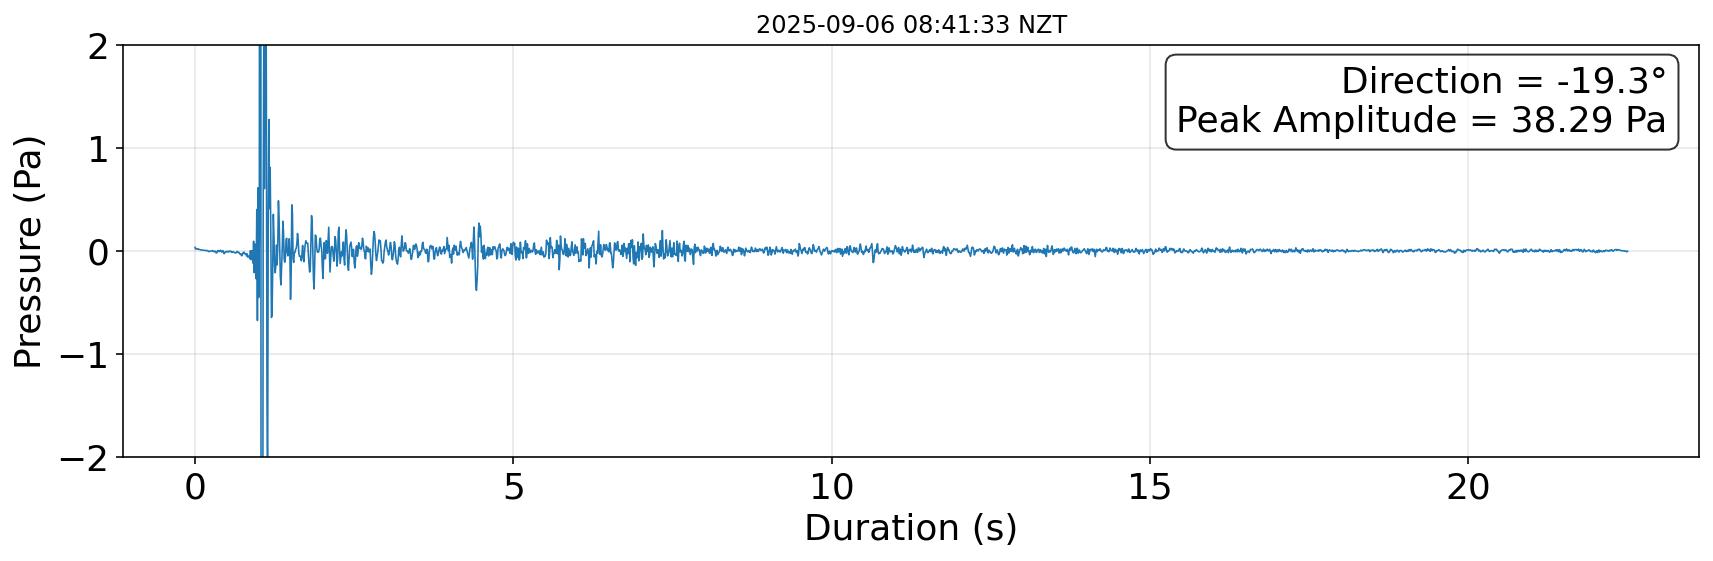
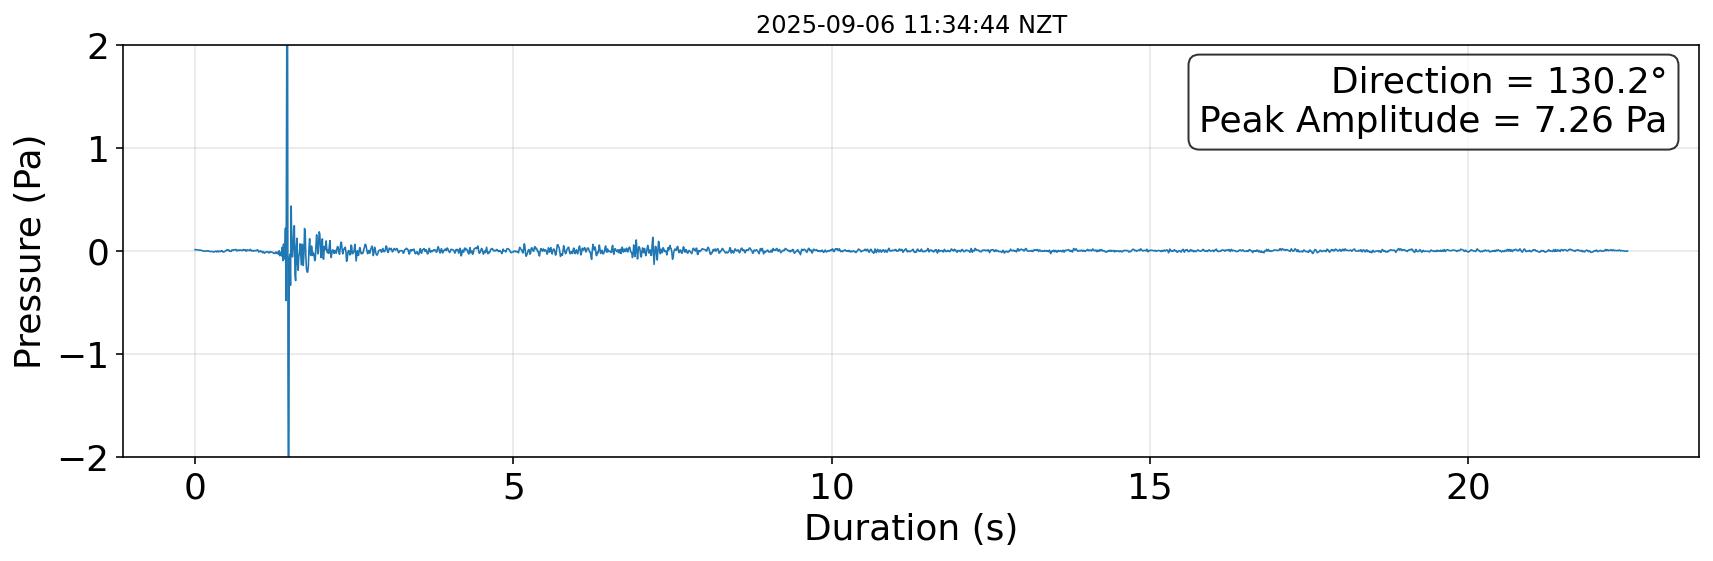
Four remaining detections, one resulting in an avalanche. All signals appear reasonably similar.
Known avalanche signal at 8:20am from the south face
1. Sections of correlated signal decreases following the explosion
2. Sections of consistent propagation speed
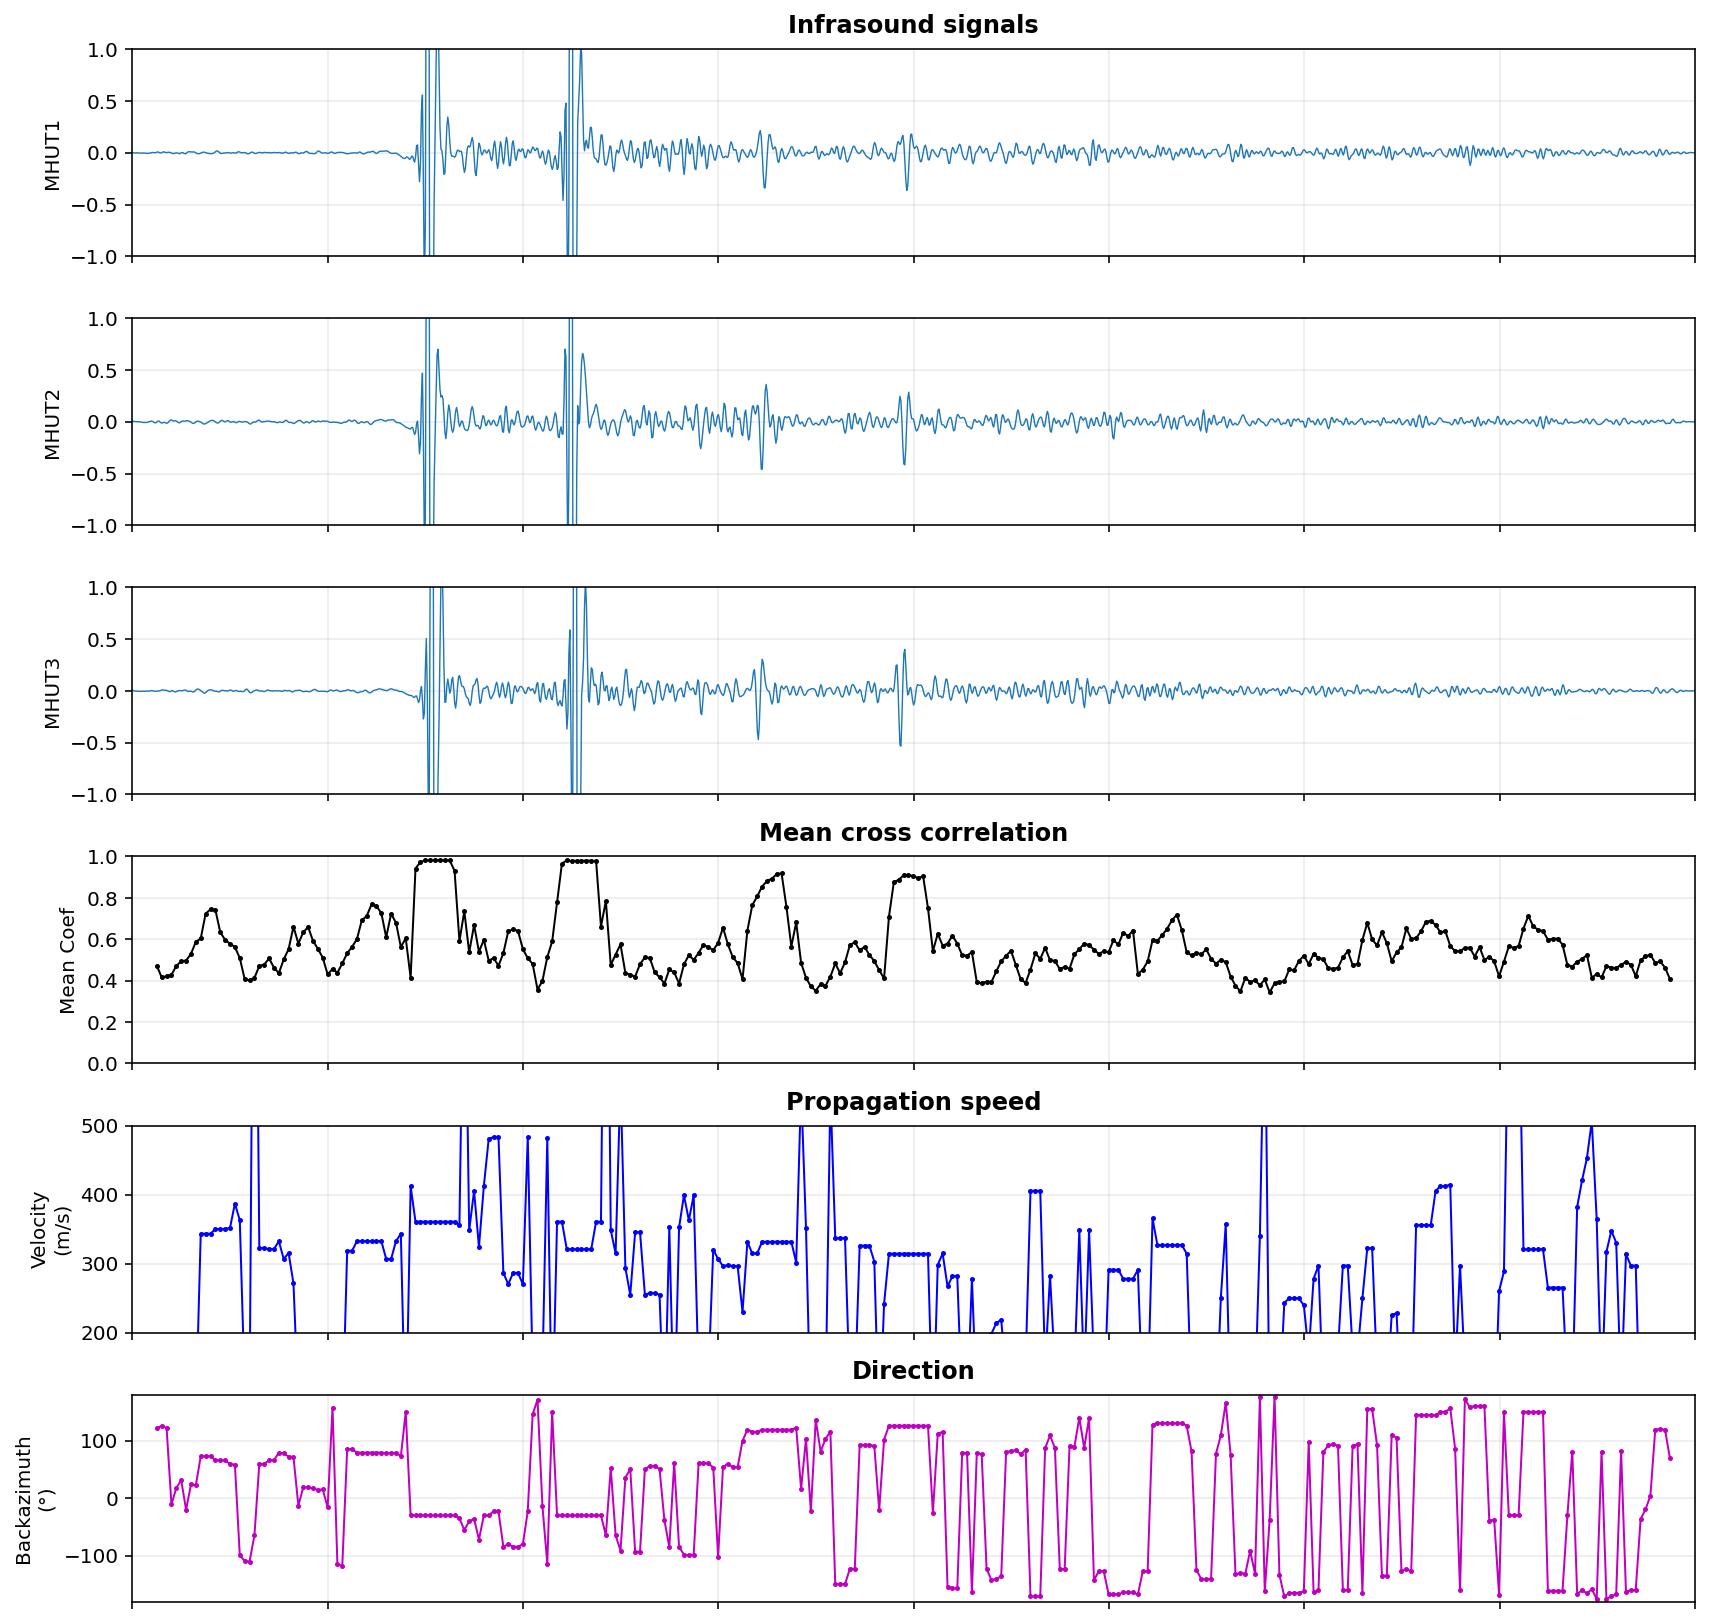
Signal after the explosion is more consistent with echo and interference from the explosion. This could however obscure any weaker avalanche signal present.
3. Sections of consistent back azimuths from different direction to explosion
• The avalanches during this period were relatively small (≤ size 1.5). In comparison, the avalanche detected in the Hooker Valley was approximately size 3.
• Dry snow avalanches are expected to produce stronger infrasound signals than wet snow avalanches.
• Sensors were only deployed in late winter/early spring when wet snow avalanches are more common.
• This suggests that while explosive signals can be detected clearly and consistently, smaller wet avalanches may not produce a sufficient acoustic signal.
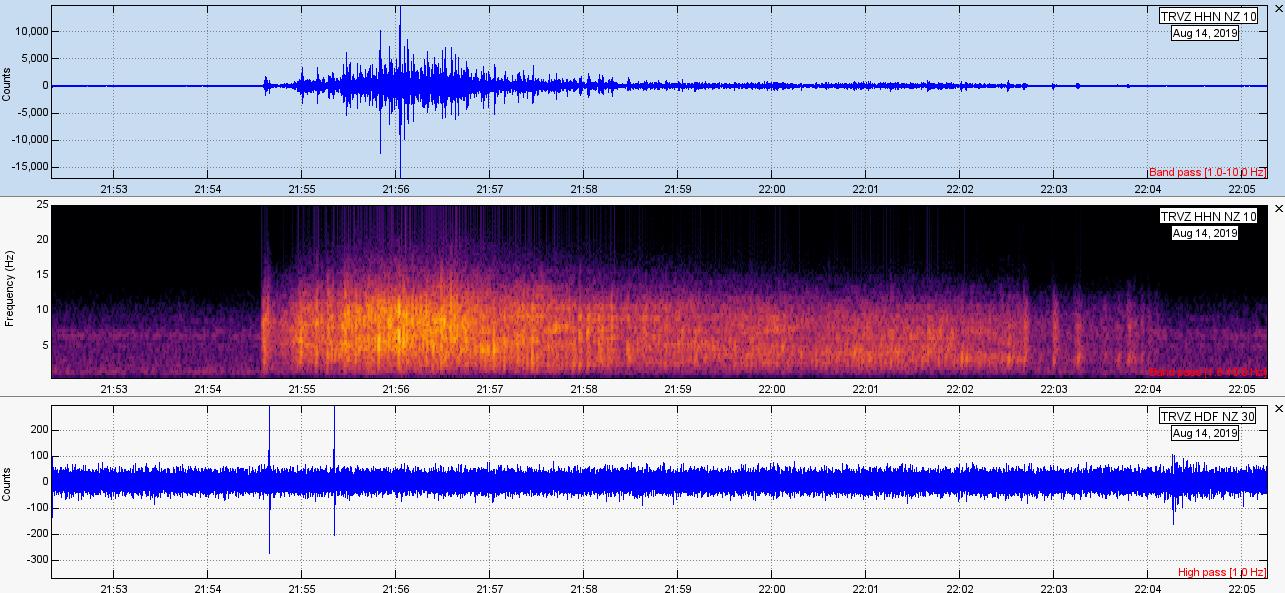
• Dense wet snow avalanches produce stronger seismic signals.
Seismic waveform
Seismic spectrogram Infrasound waveform Avalanche
• Sensors have already been redeployed at Mt Hutt for the coming season.
• Plans to potentially install seismometers
• Ongoing work includes simulations investigating terrain echo effects and optimal sensor placement.