10 minute read
RETAIL NOW

from NSGA NOW - March/April 2021
by NSGA

Cost of Goods Purchased Provides More Realistic Outlook on Health of Retail Business
By Ritchie Sayner
Advanced Retail Strategies
When reviewing a profit and loss statement, one of the traditional benchmarking metrics is Cost of Goods Sold (COGS). What exactly is COGS anyway? Also referred to as Cost of Sales, COGS is just what it says it is, the cost of all of the inventory sold during a given period. Paul Erickson, a colleague of mine at Management One, describes COGS as “the most misleading metric in retail.” He prefers to use Cost of Goods Purchased (COGP) as it more directly relates to cash flow and thus the financial health of the business. COGP is determined by simply subtracting purchases from sales for the same period. Erickson’s claim is using COGS can provide a retailer with a somewhat unhealthy financial perspective since selling very little at full price can result in a very good COGS. Using COGP, on the other hand, relates purchases directly back to cash flow. The following example illustrates the difference between the two. Let’s assume you bought a new style of 50 pairs of hockey skates for the current season. After four months you were only able to sell 5 pairs of the skates, but they all sold at full price. Your Cost Of Goods Sold (COGS) would be excellent since the cost of selling the skates did not require any discounting to generate the sales. Herein lies the problem … you still have 45 pairs you have already paid for remaining in unsold inventory. The Cost Of Goods Purchased (CODP) in this example, would paint a much different picture and it wouldn’t be pretty. Not to complicate issues, but it needs to be stated that varying accounting methods will have a bearing on COGS. FIFO (first in, first out) and LIFO (last in, first out) are the most widely accepted accounting methods and FIFO is the most trusted and easiest to use. Simply stated FIFO assumes items purchased first, were also the items sold first. LIFO (last in, first out) on the other hand, would recognize that items purchased last, would be the ones sold first. Whichever method you use, know that there will be a difference in profits and therefore income taxes. Although clearly not recognized by generally accepted accounting practices, this is where the FISH (first in, still here) accounting method comes in to play. I see this all too often. Has this ever happened to you? A style or styles gets purchased, generally with no regard to the merchandise plan, gets put on the “wall” amidst the rest of the assortment and ends up getting lost. The style doesn’t sell as it should, and for reasons unknown to all does not get returned or marked down. The result is — COGS-excellent, COGP-horrible! The lifeblood of any retail establishment is cash flow and COGS does not take that into account. To add insult to injury, if the item is still in the store at inventory time, you get to pay taxes on merchandise that shouldn’t have been bought in the first place and should have been either stock balanced with the vendor or marked down. This is what is meant by the FISH method of accounting.
Understocked/overstocked
I know this may sound as a contradiction in terms, but I see this situation often. When reviewing data at the total company level, it often appears at first glance that a store has way more inventory than needed to do the business forecasted for a given time period. However, when you drill down to the class/subclass level what you find is an inventory level void of current, fresh seasonal product that is way below levels sufficient enough to produce planned sales. As a result, sales suffer and both inventory turnover GMROI (Gross Margin Return on Investment) are reduced. In addition, unless the merchant is paying attention, open-to-buy is also restricted due to the inventory number being inflated with unsaleable merchandise. If this situation is not recognized and dealt with, no new merchandise is purchased and sales get even worse. You can also encounter the overstocked/understocked dilemma when stores have broken sizes, discontinued vendors and dated inventory that has not been identified. I refer to this situation having “a whole lot of nothing.” A store operating this way can never achieve its true upside potential. One simple way of selfchecking is to pay attention to purchases. A retailer typically should receive somewhat more than it sells. If not, chances are good the store is not buying enough new merchandise. If receipts are way over what is to be sold for a given period, the store is most likely in an overbought situation leading to potential cash flow issues, let alone future markdowns.
The solution is clearly to recognize mistakes quickly and take action. Margin is great, but it’s no substitute for CASH. Consider this, would you rather have:
A. a store full of aging inventory, decreasing sales, slow turnover, low markdowns and poor cash flow, BUT ... a healthy gross margin percentage on the profit and loss statement or
B. the potential for higher sales due to tighter inventory levels with fresh new product, open to buy (OTB) for fill ins, offprice merchandise and new vendors, and faster inventory turnover (cash flow), even though it may mean (but not always) sacrificing a few precious margin points? COVID-caused issues notwithstanding, this shouldn’t be a difficult choice, yet we often see examples of stores choosing option A. Next time you are complimenting yourself on a “healthy” COGS figure, go one step further and simply subtract your purchases from your sales to determine COGP. If you are doing it right, you can pat yourself on the back with both hands. If not, we are always here to help.
Ritchie Sayner
Sayner has spent the past four decades helping independent retailers improve profitability. In addition to speaking to retail groups nationwide, Sayner is a regular contributor to retail industry publications. Prior to embarking on his retail consulting career, he was the general merchandise manager for an independent department store in the Midwest. Ritchie is a graduate of the University of Wisconsin-LaCrosse. He is also the author of the book, “Retail Revelations-Strategies for Improving Sales, Margins, and Turnover.” He can be reached though his website at www.advancedretailstrategies.com.


By Nick Rigitano
NSGA Director of Insights and Analysis
NSGA’s Historical Sports Participation Report offers a wealth of participation data for a wide variety of sports and recreational activities, many of which date as far back as the 1980s. Because NSGA has been careful to keep the survey methodology largely unchanged from year to year, it allows us the unique opportunity to trend the data across decades and glean insights from the analysis. Looking at participation by decade allows us to take a step back and better understand the bigger picture of how certain sports/ activities have fared over time.
Figures 1, 2, and 3 in this article provide a look at the average participation by decade for select sports/activities. Please note this is not an exhaustive list and just because a sport is not included in a particular chart does not mean it has not been growing or decreasing. For a complete synopsis of sports participation, please be sure to check out NSGA’s Historical Sports Participation in the US report at nsga.org.
Arrow Pointing Up
Figure 1 offers a glimpse of some of the sports/activities that have experienced increases in participation in each decade since the 1990s. The fitness segment overall has seen some of the strongest gains since the 1990s as Americans have moved toward becoming more health conscious. Running/Jogging participation has essentially doubled after experiencing a 24 percent increase in average participation from the 1990s to the 2000s, followed by a 56 percent increase from the 2000s to the 2010s. Workout at Club/Gym/Fitness studio saw gains of 51 percent and 12 percent during those same time frames, respectively. Among team sports tracked since the 1990s, only ice hockey and soccer have experienced positive gains in each of the subsequent decades. The gains for ice hockey were mainly driven by increases in male participation and adults ages 18 and over. For soccer, the gains seen in the 1990s were driven largely by increases in female participation and adult participation (18 and over). The slight gains experienced in the 2010s were due to a continued increase in adult participation, as well as an increase in male participation, both of which offset decreases in youth and female participation. Additionally, after experiencing only a slight increase in average participation from the 1990s–2000s, archery experienced a 36 percent increase in average participation during the 2010s compared to the previous decade, in large part from an increase in female participation. Furthermore, the increase coincides with the release of the Hunger Games movie franchise during the early part of the 2010s.
Ups and Downs
Figure 2 looks at a group of sports/activities that have fluctuated over the three decades. Skateboarding saw a huge jump in participation, driven primarily by youths (ages 7–17) during the early 2000s, coinciding with the popularity of professional skateboarding icon Tony Hawk and the release of the Tony Hawk Pro Skater video game series. Since the sport’s peak in participation during the
2000s, in which it saw an average of 9.8 million yearly participants, participation during the 2010s steadily declined to an average of 5.8 million yearly participants due to a steep drop from youths (ages 7–17). Similarly, golf experienced growth during the 1990s as equipment technology drastically improved and Tiger Woods burst onto the scene, ending with an average of 24.7 million participants per year. After average yearly participation increased slightly to 24.9 million participants during the 2000s, participation fell to 19.2 million per year, representing a decrease of 23 percent driven mostly by males. Average yearly participation levels for bowling and camping (vacation/overnight) followed a similar arc of increasing slightly during the 2000s (up 5 percent and 9 percent, respectively) compared to the previous decade. They experienced larger declines in yearly participation during the 2010s (down 19 and 17 percent, respectively) driven by decreases among all groups (males, females, youth, adults). Conversely, average tennis participation decreased 20 percent in the 2000s compared to the previous decade, but rebounded during the 2010s with an increase of 16 percent thanks to increased participation from adults (ages 18 and over).
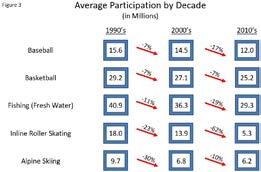
On the Decline
Lastly, the sports/activities shown in Figure 3 have all experienced declines in average participation in each decade since the 1990s. Out of these sports/activities, inline roller skating experienced the most severe decline in participation in terms of percentage change with a decrease of 23 percent from the 1990s to the 2000s and a bigger decrease of an additional 62 percent during the 2010s, which was driven by all categories (males, females, youth, adults). Baseball and basketball were among the team sports that experienced declines in consecutive decades with both sports declining 7 percent in the 2000s compared to the 1990s. In the 2010s, baseball slid further (down 17 percent vs the 2000s) while basketball declined another 7 percent vs the prior decade. All decreases were primarily driven by youths (ages 7–17). Fresh water fishing saw its 1990s average yearly participation rate of 40.9 million shrink to 36.3 million during the 2000s, representing a decrease of 11 percent. Participation levels for the outdoor activity continued to fall another 19 percent in the 2010s to an average yearly rate of 29.3 million. Decreases from both decades were driven by all categories (males, females, youth, adults). Alpine skiing also experienced double-digit percentage decreases in the decades since the 1990s, falling 30 percent in the 2000s and another 10 percent during the 2010s. Similar to inline roller skating and fresh water fishing, decreases from both decades were driven by all categories (males, females, youth, adults). The recent start of a new decade provides opportunities for some sports/activities to continue growing while others hope to reverse the downward trends experienced in previous decades. NSGA’s updated participation numbers for the year 2020 will be available later this spring and will provide insight on which sports/activities performed better than others during the pandemic-riddled year.