2 minute read
Single-Family

SINGLE-FAMILY PERMITS
End on a Strong Note in 2020
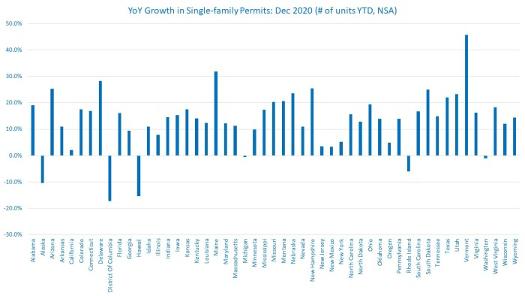
For 2020, the total number of single-family permits issued yearto-date (YTD) reached 977,863 nationwide. On a year-over-year (YoY) basis, this is a 14.5% increase over the December 2019 level of 854,158.
Year-to-date ending in December, single-family permits reported increases in all four regions. The South reported the strongest increase by 16.9%, followed by the Midwest (+13.1%), the Northeast (+11.6%), and the West (10.5%). However, multifamily permits continued to underperform compared to December 2019, recording declines in all four regions. The Northeast region had the steepest decline in multifamily (-11.1%), followed by the South (-9.2%), West (-8.2%), and the Midwest (-1.2%).
Between December 2019 YTD and December 2020 YTD, 45 states saw growth in single-family permits issued while five states and the District of Columbia registered a decline. Vermont recorded the highest growth rate during this time at 45.7% from 882 to 1,285, while singlefamily permits in the District of Columbia declined by 17.3%, from 168 in 2019 to 139 in 2020. The 10 states issuing the highest number of single-family permits combined accounted for 61.5% of the total single-family permits issued.
BY DANUSHKA NANAYAKKARA-SKILLINGTON

Year-to-date, ending in December 2020, the total number of multifamily permits issued nationwide reached 473,716. This is 8.2% lower than its level over the year 2019, 516,189.
Between December 2019 YTD and December 2020 YTD, 16 states and the District of Columbia recorded growth while 34 states recorded a decline in multifamily permits. South Dakota led the way with a sharp rise (124.2%) in multifamily permits from 1,267 to 2,841, while Kentucky had the largest decline of 51.9% from 4,881 to 2,348. The 10 states issuing the highest number of multifamily permits combined accounted for 63.0% of the multifamily permits issued.
At the local level, below are top 10 metro areas that issued the highest number of single-family permits.
Metropolitan Statistical Area Houston-The Woodlands-Sugar Land, TX Dallas-Fort Worth-Arlington, TX Phoenix-Mesa-Scottsdale, AZ Atlanta-Sandy Springs-Roswell, GA Austin-Round Rock, TX Charlotte-Concord-Gastonia, NC-SC Tampa-St. Petersburg-Clearwater, FL Orlando-Kissimmee-Sanford, FL Nashville-Davidson-Murfreesboro-Franklin, TN Washington-Arlington-Alexandria, DC-VA-MD-WV Single-family Permits: Dec (Units #YTD, NSA) 48,208 43,884 31,724 28,057 21,653 17,807 16,028 15,523 14,125 13,594
For multifamily permits, below are the top 10 local areas that issued the highest number of permits:
Metropolitan Statistical Area
New York-Newark-Jersey City, NY-NJ-PA Houston-The Woodlands-Sugar Land, TX Austin-Round Rock, TX Los Angeles-Long Beach-Anaheim, CA Dallas-Fort Worth-Arlington, TX Phoenix-Mesa-Scottsdale, AZ Seattle-Tacoma-Bellevue, WA Miami-Fort Lauderdale-West Palm Beach, FL Minneapolis-St. Paul-Bloomington, MN-WI Nashville-Davidson–Murfreesboro–Franklin, TN
Multifamily Permits: Dec (Units #YTD, NSA)
42,739 20,207 19,222 17,494 16,178 14,894 14,752 14,034 11,515 11,404