Market Intelligence Briefing
2026 · 2033 · GLOBAL OUTLOOK
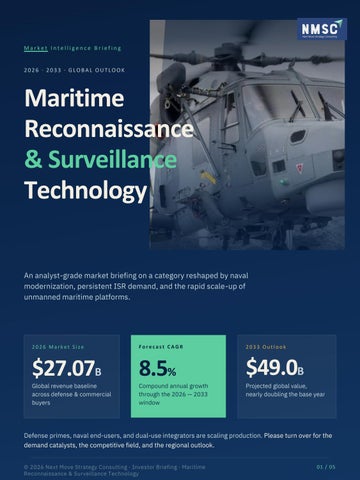
Maritime Reconnaissance & Surveillance Technology An analyst-grade market briefing on a category reshaped by naval modernization, persistent ISR demand, and the rapid scale-up of unmanned maritime platforms.
2026 Market Size
Forecast CAGR
2033 Outlook
$27.07B
8.5%
$49.0B
Global revenue baseline across defense & commercial buyers
Compound annual growth through the 2026 — 2033 window
Projected global value, nearly doubling the base year
Defense primes, naval end-users, and dual-use integrators are scaling production. Please turn over for the demand catalysts, the competitive field, and the regional outlook. © 2026 Next Move Strategy Consulting · Investor Briefing · Maritime Reconnaissance & Surveillance Technology
01 / 05
Section 02 · Drivers & Opportunity Map
Demand catalysts & strategic opportunities Five structural drivers pull spend forward. Segments and regions carry very different growth weights — and the spread is widening.
01
Where capital accelerates
Naval Modernization Surge Allied navies pivot from sustainment to recapitalization through 2030.
Segment growth, 2026 — 2033 2033 Unmanned platforms
02
Anti-Submarine Warfare Demand Submarine proliferation in the Indo-Pacific and High North pulls ASW.
03
Unmanned Surface & Underwater Vessels USV and UUV expand at ~14% CAGR — the fastest line item in the stack.
04
Patrol aircraft & UAS 9.6% CAGR · $13.7B by 2033
Surveillance systems 8.2% CAGR · $15.7B by 2033
AI-Enabled Sensor Fusion AI/ML on radar, EO/IR and acoustic streams compress decision cycles.
05
14.3% CAGR · $5.4B by 2033
EEZ & Anti-Piracy Enforcement Coastal surveillance rises with EEZ definition and sanctions work.
Investor read
Unmanned is highestvelocity, surveillance still anchors revenue. Capital follows capability that scales without crew cost.
North America
Fastest growth → Asia-Pacific
Europe
$17.6B
10.2% CAGR
$13.7B
2033 cumulative · ~36% share USN recapitalization, P-8 expansion, MQ-4C Triton.
$11.8B by 2033 · ~24% share Japan, India, Korea, Australia — EEZ & ISR.
2033 cumulative · ~28% share AEW build-out, North-Sea EEZ, EU supply reshores.
© 2026 Next Move Strategy Consulting · Investor Briefing · Drivers & Opportunities
02 / 05
Section 03 · Competitive Field
Competitive scenario & strategic positioning A consolidated field, six integrated primes at the top, surrounded by specialists that increasingly win on sensors, autonomy and analytics. Recent strategic moves Positioning matrix
Capital is consolidating, cooperating, converging.
Platform innovation ↑ · portfolio breadth →
Leonardo Helicopters · radar
Saab
Thales
GlobalEye · 2000 MPA
Surface radar · sonar sonar
M&A · Oct 2025
Airbus · Leonardo · Thales space space JV Partnership · 2026
Thales · BAE Herne XL mast
Lockheed Martin General Atomics
Sensors · integration
MQ-9B SeaGuardian
Northrop Grumman MQ-4C Triton · NATO
BAE Systems
Orders · 2026
P-8A expansion: Denmark + others Lease · India
₹1,943 Cr · MQ-9B SeaGuardian SeaGuardian
Herne mast · combat
What the field is signaling
Three dynamics worth tracking
56%
4+
14%
The big-six primes still win the majority of declared contracts.
JV and partnership formations reshaping supply in 2025–26.
Specialists win unmanned without competing head-on with primes.
Top-6 revenue share
Cross-border alliances
© 2026 Next Move Strategy Consulting · Investor Briefing · Competitive Scenario
Unmanned-only CAGR
03 / 05
Section 04 · Geography & Application Stack
Regional demand & application outlook Asia-Pacific accelerates the category, North America anchors it, Europe modernizes — unmanned reshapes every region's portfolio mix. North America
36% SHARE
Europe
28% SHARE
2026 · baseline
2033 · outlook
2026 · baseline
2033 · outlook
$9.7B
$17.6B
$7.6B
$13.7B
7.4% CAGR
7.0% CAGR
USN recapitalization, P-8 expansion, MQ-4C at scale.
AEW build-out, Baltic EEZ, EU supply reshoring.
Asia-Pacific · fastest
24% SHARE
Rest of World
12% SHARE
2026 · baseline
2033 · outlook
2026 · baseline
2033 · outlook
$6.5B
$11.8B
$3.2B
$5.9B
10.2% CAGR · highest
7.1% CAGR
Japan, India, Korea, Australia — EEZ & ISR.
LATAM, MENA, ASEAN — first-time procurement.
Application stack · 2033
Where the $49.0B lives
Highest-velocity line
Surveillance systems
Unmanned Systems
Radar · EO/IR · SAT
$15.7B
14.3% CAGR
Patrol aircraft & UAS P-8 · MQ-4C · MQ-9B
$13.7B
Surface & naval platforms Corvettes · OPVs · tenders
$9.8B
© 2026 Next Move Strategy Consulting · Investor Briefing · Regional & Application Outlook
$5.4B
2033 forecast USVs and UUVs reshape spend mix across all four regions.
04 / 05
Section 05 · Connect
Thank you.
Let's chart the next horizon, together. Reach out for the full report, tailored briefings, or an evidence-grade consultation.
Website
Phone
nextmsc.com
+1 (857) 758-5017
Full report catalog & sector briefings
Direct line to research & consulting leads
Full Report
info@nextmsc.com
Get the complete report
Briefing requests & analyst follow-up
nextmsc.com/report/maritime-recon-surveillance-technologymarket
Follow Next Move Strategy Consulting
in
LinkedIn /nextmsc
f
YouTube
/nextmsc
@nextmsc
𝕏
© 2026 Next Move Strategy Consulting · All rights reserved · Investor Briefing
@nextmsc
@nextmsc
05 / 05