Report HC398 · Investor Brief · 2026 Edition
Global Diagnostic Imaging
Magnetic Resonance Imaging (MRI) Market Outlook Global opportunity analysis & industry forecast, 2025 – 2030 Sizing the diagnostic imaging frontier — where aging demographics, hybrid systems and AI-assisted acquisition reshape a USD 6.6 billion
baseline into a USD 9.18 billion opportunity by 2030.
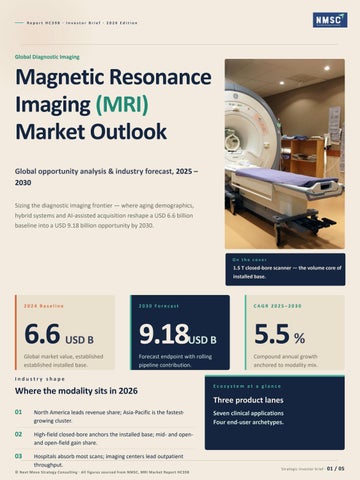
On the cover
1.5 T closed-bore scanner — the volume core of installed base.
2024 Baseline
6.6
2030 Forecast
USD B
Global market value, established established installed base.
CAGR 2025–2030
9.18
5.5 %
Forecast endpoint with rolling pipeline contribution.
Compound annual growth anchored to modality mix.
USD B
Industry shape
Where the modality sits in 2026
Ecosystem at a glance
Three product lanes 01
North America leads revenue share; Asia-Pacific is the fastestgrowing cluster.
02
High-field closed-bore anchors the installed base; mid- and openand open-field gain share.
03
Hospitals absorb most scans; imaging centers lead outpatient throughput.
© Next Move Strategy Consulting · All figures sourced from NMSC, MRI Market Report HC398
Seven clinical applications Four end-user archetypes.
Strategic investor brief · 01 / 05
02 · Growth Dynamics
What compounds demand Aging Wave
Demand drivers 65+ and opportunity corridors corridors
age cohort
Globally expanding fastest, driving neurological, oncologic and musculoskeletal imaging demand.
Four demand vectors are pulling the modality forward, while three
three product corridors and one regional cluster absorb the new growth. growth. Driver 02
Driver 01
Driver 03
Aging & chronic disease
Innovation velocity
Outpatient migration
Cardiovascular, neurological and oncologic case loads rise; MRI is the non-ionizing standard.
7-liter helium-free magnets, AIassisted acquisition, and hybrid OR / OR / PET-grade systems.
Imaging centers, ASCs and freestanding suites capture throughput from inpatient settings.
Driver 04 · Cross-cutting
Emerging-market democratization Low-cost mid-field and refurbished platforms are widening access across Latin America, Southeast Asia and Africa — converting latent demand into installed base. Regional opportunity map
Where the next dollar accrues
Growth velocity · APAC outpaces all other regions through 2030. Region 03 · Fastest
Region 01
Region 02
North America
Europe
Asia-Pacific
Rest of World
Mature installed base, geriatric tailwinds and demand for advanced diagnostic devices.
Rapid healthcare build-out, low-cost service corridors and rising early-diagnosis awareness.
Brazil, Mexico, GCC and Africa — refurbishment-led adoption and publichospital modernization.
+↑
↑
Current revenue leader — high healthcare spend and hybrid MRI installations anchor share.
#1
share
#2
share
Region 04 · Emerging
rising
Fastest-growing cluster.
© Next Move Strategy Consulting · Drivers classified via NMSC qualitative scoring, MRI scoring, MRI Market Report HC398
Investor brief · 02 / 05
03 · Competitive Scenario
Strategic landscape Tier 01 · Global majors
Who leads, and how they stay there
Siemens · GE · Philips Shared dominance of installed base and channel — premium pricing preserved.
Three global majors anchor share, while specialist challengers use helium-free, AIhelium-free, AI-aided and cost-engineered platforms to redraw the second tier. second tier.
Players to track
Six companies shaping the next cycle Siemens Healthineers
DE
GE Healthcare
US
Koninklijke Philips
Magnetom platform family; heliumfree & AI reconstruction are signature bets.
Premier / SIGNA portfolio; signs TULSA-PRO partnership with Profound Medical.
Launched 7-liter helium-free Blue Blue Seal magnet (July 2020) — a a structural cost reset.
Canon Medical
Fujifilm Holdings
United Imaging
JP
Vantage Galan 3T; deep APAC installed installed base and tier-2 contracting contracting foothold.
JP
Cross-modality synergy with healthcare portfolio; aggressive midmid-field launches.
NL
CN
APAC challenger with domestic pricing power and global tier-2 channel build-out.
Strategic moves, 2020 → today
Three plays that moved the map Play A · Engineering
Play B · Partnership
Play C · Cost reset
Helium-free magnets
Adjacent-modality tie-ups ups
Cost-engineered systems systems
GE × Profound Medical interfaces TULSA-PRO with new MRI scanners — opens new clinical use cases.
Chinese and Japanese challengers sell mid-field closed units to tier-2 hospitals in LATAM, MEA, SE Asia.
Philips Blue Seal operates on 7 litres vs ~1,500 litres conventional — install footprint and lifecycle cost reset.
Investor takeaway
Margin flows to platform owners; volume follows costcost-engineered challengers.
© Next Move Strategy Consulting · Company set drawn from MRI Market Report HC398, supplemented with named filings
15
named players
Investor brief · 03 / 05
04 · Segmentation Lens
How the market is sliced
Four segmentation axes, one regional growth map. The modality is sliced along four orthogonal axes; relative bar widths are indicative indicative composition, not statistical point estimates.
2 segments
By Product Type
Closed MRI Open MRI
Volume backbone Sub-segment · outpatient outpatient
High-field (1.5T – 3T)
Premium core
Mid-field
Volume tier
Low-field
Niche / refurbished
7 clinical uses
By Application
3 tiers
By Field Strength
4 archetypes
By End User
Brain & Neurological
Abdominal
Hospitals
①
Spine & Musculoskeletal
Breast
Imaging Centers
②
Vascular
Others
ASCs
③
Others
④
Cardiac
Geographic outlook
Where revenue accrues through 2030 North America
Europe
Revenue leader
Mature, aging tailwind
Bar widths follow 2030 forecast share · APAC: fastest by velocity, not by size. Asia-Pacific · Fastest
Steepest growth curve
Rest of World
Emerging · refurb. LATAM · MEA · SEA
Hybrid MRI · high spend
Advanced diagnostics
Healthcare build-out
© Next Move Strategy Consulting · Composition is qualitative segmentation; see HC398 see HC398 for full size and forecast tables
Investor brief · 04 / 05
Continue the dialogue
Thank you.
Direct line
Analyst desk
Official site
+1 857 758 5017
info@nextmsc.com
nextmsc.com
Mon – Fri · 09:00 – 18:00 ET
Replies within one business day.
2,000+ reports across industries.
Call to action
Read the 449-page MRI Market report 303 tables · 245 figures · PDF + dashboard access · report code HC398
nextmsc.com/report/
magnetic-resonance-imaging-mrimri-market
Five channels, one research desk in
linkedin.com/ company/ next-move-strategyconsulting
f facebook.com/ Next-MoveStrategy-Consulting
𝕏
youtube.com/ @nextmsc
twitter.com/ nextmsc
instagram.com/ nextmsc