Lithium-ion Battery Market · Investor Briefing October 2026 · Strategic Intelligence Series
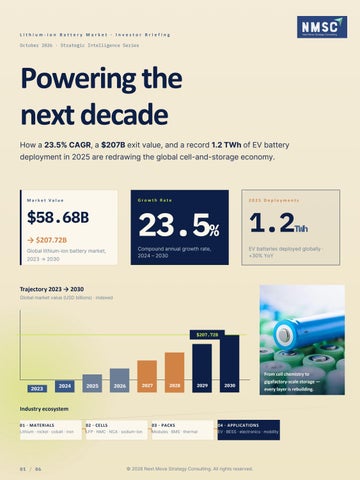
Powering the next decade How a 23.5% CAGR, a $207B exit value, and a record 1.2 TWh of EV battery deployment in 2025 are redrawing the global cell-and-storage economy.
Growth Rate
Market Value
2025 Deployments
23.5% 1.2
$58.68B
TWh
→ $207.72B
Compound annual growth rate, 2024 – 2030
Global lithium-ion battery market, 2023 → 2030
EV batteries deployed globally · +30% YoY
Trajectory 2023 → 2030 Global market value (USD billions) · indexed
$207.72B
2023
2024
2025
2026
2027
2028
2029
2030
From cell chemistry to gigafactory-scale storage — every layer is rebuilding.
Industry ecosystem 01 · MATERIALS
02 · CELLS
03 · PACKS
04 · APPLICATIONS
Lithium · nickel · cobalt · iron
LFP · NMC · NCA · sodium-ion
Modules · BMS · thermal
EV · BESS · electronics · mobility
01 / 06
© 2026 Next Move Strategy Consulting. All rights reserved.
Growth Drivers & Opportunities · 02
Three engines, one compounding tailwind. Why the century's most-deployed storage technology keeps pulling every adjacent market onward.
1.2
112
$108
EV battery deployments, 2025
Stationary storage added, 2025
Average pack price, 2025
GW
TWh
307 GWh of batteries added worldwide
Up +30% from 2024, with electric
— +48% year-on-year — pushing
trucks alone approaching 8% of EV
annual additions toward a forecast 158
battery demand — clear momentum
GW in 2026 (BNEF, ex-pumped hydro).
into light-, medium-, and heavy-duty
/kWh
Record low (BNEF). LFP $81/kWh undercuts NMC $128/kWh — economics that widen the addressable market.
segments.
High-Growth Segments
Where the next round of capital is concentrating. LFP chemistry
Grid BESS
Solid-State
Sodium-Ion
>55%
$70/kWh
2027→
~1% today
of global EV batteries
stationary storage pack, 45%
BYD launch target · Toyota
deployed in 2025 (IEA).
below 2024.
2028 · mass prod by 2030.
of cell capacity · ~7% of 2030 announced pipeline.
Regional Opportunities
Where demand and policy intersect.
60%
~15%
10%
6%
China, 2025 demand
European Union
United States
EMDE / RoW
+80% of cell production.
LFP up ~90% YoY · JV buildout.
IRA-driven fabs plus reshoring.
Rising fastest from low base.
02 / 06
© 2026 Next Move Strategy Consulting. All rights reserved.
Competitive Scenario · 03
Concentration plus consolidation. Two firms ship more than half of every EV battery on Earth. The next three lift coverage above 70%. The race is now for chemistries, geography, and cost.
Top 2 share
56%
Top 5 share
Top 10 share
74%
89%
Top 10 · 2025 global EV-battery installations (1,187 GWh total)
CATL
39.2%464.7 GWh
BYD
16.4%194.8 GWh
LG Energy Solution
9.2%108.8 GWh
CALB
5.3%62.8 GWh
Gotion
4.5%53.5 GWh
SK On
3.7%44.5 GWh
Panasonic
3.7%44.2 GWh
Eve Energy
2.6%31.3 GWh
Samsung SDI
2.4%28.9 GWh
Svolt
2.4%28.5 GWh
Key Strategies · 2024 – 2026
Capacity expansion
Cross-border partnerships
Stellantis & CATL 50 GWh Spain JV · nameplate cell capacity passes 4 TWh by end of 2025.
OEMs anchor long-term offtake with cell leaders to derisk rawmaterial cost.
Chemistry pivot
Next-gen roadmap
LFP share rises as cost-gap (~30% below NMC) reshapes plant footprints and pack designs.
Solid-state launches 2027 – 2028; sodium-ion pipelines reach ~7% by 2030.
03 / 06
© 2026 Next Move Strategy Consulting. All rights reserved.
Market Segmentation · 04
Three cuts of one enormous market. Where the chemistry, the application, and the geography converge to define each submarket's separate rhythm.
By chemistry · 2025
By application · 2025
LFP is the new default.
EV dominates; storage closes in. 72%
Legend
LFP 56%
56% LFP 2025
Automotive & e-mobility
NMC family 24% NCA 12%
18% Energy storage / BESS
Sodium-ion 6%
LTO + others 2%
6%
Consumer electronics 4%
LFP exceeds 55% of EV batteries deployed in 2025 vs ~50% in 2024 (IEA). Shares here are investor-illustrative.
Industrial · aerospace · marine Application shares are illustrative weighted blends; IEA reports EV batteries exceeded 85% of energy-sector battery demand in 2025.
By region · 2025 demand
China remains the structural anchor. China
60%
Anchor of supply & demand
2025 demand share
European Union
~15%
Reshoring + LFP build-out
2025 demand share
United States
10%
IRA-anchored capacity build
2025 demand share
EMDE / RoW
~6%
Fastest growth from low base
04 / 06
© 2026 Next Move Strategy Consulting. All rights reserved.
Pricing, Risks & Outlook · 05
What stays cheap, what stays hard. Deflation continues at the cell level — but mineral volatility, supply concentration, and policy churn reshape the upside. Pricing snapshot · 2025 (BNEF)
Avg pack
BEV pack
$108
/kWh
record low · -8% vs 2024
LFP pack
$99
$81
/kWh
/kWh
transport segment average
~30% below NMC
NMC pack
$128
/kWh
density-led applications
BESS pack
$70
/kWh
-45% vs 2024
Risks to underwrite Where to deploy capital
Strategic priorities
Supply concentration
Mineral volatility
China retains >80% of cell-nameplate capacity — single-region exposure to logistics and policy shock.
Lithium carbonate roughly 2x its early-2025 level; cobalt doubled YoY (IEA).
Policy churn
Operational safety
Build storage-native product
IRA, EU CRMA, and re-shoring subsidies reshape plant-level IRRs across every geography.
Overcharge / thermal-runaway risk and high cap-ex pressure keep insurance terms tight (NMSC).
BESS at $70/kWh is the fastest volume game — not a spillover from EV.
Lock LFP lines first Cheaper $/kWh widens the addressable market for entry-level EVs and BESS.
Watch sodium-ion as hedge Cost-curve diversification away from tight lithium markets.
Technology roadmap · 2026 → 2030
2026
2027
2028
2029
BNEF forecasts 158 BYD's first Toyota's first GW of storage all-solid-state EV all-solid-state added worldwide. enters production. vehicle launches.
EV battery deployment crosses 3 TWh (IEA).
2030
Hedge concentration exposure Multi-region sourcing + mineral recycling duediligence.
Solid-state at scale · sodium-ion ≈7% of pipeline.
Investor takeaway
Cell economics remain deflationary — but the next layer of value belongs to scale winners, chemistry optionality, and geography-aware supply — not the cell alone.
05 / 06
© 2026 Next Move Strategy Consulting. All rights reserved.
Thank you · 06
Let's open the next chapter. Reach Next Move Strategy Consulting for tailored briefings, custom sizing models, and primary-source diligence on the lithium-ion battery economy.
Website
Phone
nextmsc.com
+1 857 758 5017
info@nextmsc.com
Direct line — strategy & intelligence desk.
Briefing intake, RFPs, and bespoke research.
www.nextmsc.com
Call to action
Get the complete research report.
Read →
Follow us
in
f
YouTube
linkedin.com/company /next-move-strategy /consulting
facebook.com/ Next-Move-Strategy -Consulting-1127...
youtube.com/channel /UCJuVRxfBo... /DE4uPQ
twitter.com/nextmsc
instagram.com /nextmsc
X
We turn this market's moving parts into a single, defensible point of view — so your next decision is the right one.
06 / 06
© 2026 Next Move Strategy Consulting. All rights reserved.