42 minute read
Low Temperature Fluidity of Polymer-Modified Greases


Erik Willett, PhD, Functional Products Inc.
1. Introduction
Polymers and Grease
Polymer additives are often used to modify the interaction of greases with surfaces or other materials.1 High speed couplings may use a tackifier to reduce the fling-off of the grease under centrifugal forces.2 Waterresistant grease may require a functionalized grease polymer.3 4 Internal interactions like incompatibility between a very non-polar synthetic base stock and a highly charged thickener, like lithium or calcium salts which results in oil bleed can be mitigated by the oil swell effect of polymers.5 6 Some polymers can even reinforce the mechanical stability of greases when picked correctly.7
Various polymers can be used to achieve the desired effects depending on the grease type, base oil, and additives. Polymers may be picked from oil-soluble viscosity modifier grades used to prepare fluids and lubricants or from specialized semi-crystalline or oil-insoluble ‘grease polymer’ grades.
It is rare that an additive can solve many problems without causing a few problems of its own. The question then becomes: for all the benefits of polymers in grease, what is being given up? Traditionally the answer for polymers in grease has been fluidity. This has been investigated previously with Lincoln Ventmeter at near ambient conditions for various functionalized polymers.8 This current work focuses specifically on the chemical structure of several simpler polyolefins, the resulting tackiness properties based on polymer type and loading, and the ultimate effect on grease fluidity as low as -40°C (-40°F).
Polymers Under Study
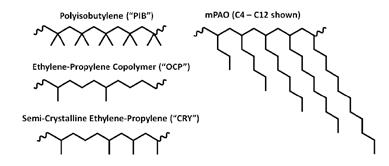
Three polymer chemistries (polyisobutylene “PIB”, olefin copolymer “OCP”, and semi-crystalline olefin copolymer “CRY”) with varying low temperature fluidity were evaluated at three different molecular weight regimes against a control group of heavy paraffinic, naphthenic, and PAO/mPAO based greases. Figure 1 compares these three chemistries against the structure of metallocene PAO. The three polymer chemistries were chosen based on good solvency in petroleum oil and solubility in PAO6 which was used to prepare ISO 150 base oil blends for grease. PAO6 has a pour point of <-57°C (<-71°F) so any changes in fluidity of the oils or finished grease in the test conditions were attributed only to the polymers. The PIB, OCP, and CRY polymers and mPAO are suitable for NSF H1 grease formulations due to their high purity and lack of reactive functionality – many are already NSF-listed as one or more products.
Figure 1: Generic chemical structure of the polymer chemistries used in the tackiness and low temperature testing.
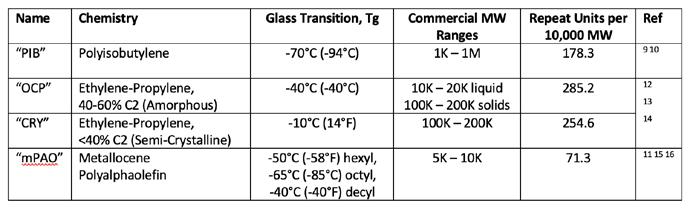
“PIB” is a pure homopolymer (‘same monomer’) of isobutylene prepared from very low to very high molecular weights for a wide range of applications in lubricants, coatings, and consumer goods. PIB’s glass transition temperature (Tg) which is essentially a molecular pour point for polymers < -70°C (-94°F) even at hundreds of thousands molecular weight.9 10 T g is one way to compare the relative low temperature performance of different polymer chemistries. Tg is essentially a measure of ‘molecular pour point’ where polymers lose their flexibility and become highly structured which may result in brittleness or loss of fluidity.
Figure 2 demonstrates the effect of molecular weight, or polymer size, versus glass transition temperature for PIB. In theory, the low temperature fluidity of a polymer chemistry is best at low MW, becomes less favorable with increasing MW, and stabilizes to a constant value at high MW.
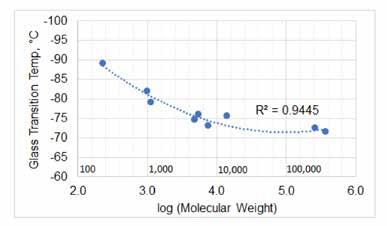
Figure 2: Molecular weight dependence of glass transition temperature in the example of PIB.
“OCP” is a copolymer of ethylene-propylene with 40-60% ethylene which results in low wax-like structure and is called “amorphous” as it is free flowing as either a liquid or a soft solid bale. “CRY” is a copolymer of ethylene-propylene with <40% ethylene which results in crystalline regions of polypropylene forming within the polymer that can behave much like a wax. These grades are called “semicrystalline” and appear as solid pellets which require heat and long stirring times to properly incorporate into oil. Figure 3 demonstrates the effect of varying ethylene or propylene content on the crystallinity and form of ethylene/propylene copolymers.
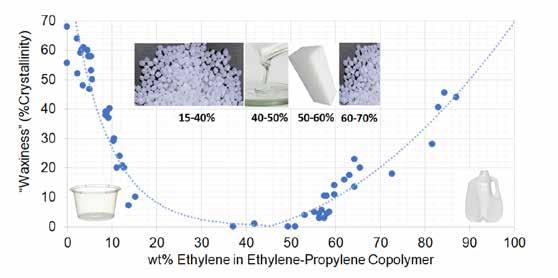
Figure 3: Varying the ratio of ethylene and propylene imparts different crystallinity to the molecule which causes changes in physical form and fluidity at different temperatures.
The more common form of semi-crystalline OCP is when ethylene is >60% which results in crystalline regions of polyethylene that behave more gel-like. CRY chemistry with low ethylene content tends to produce small, localized crystallites or “spherulites” microparticles which improves low temperature fluidity but can greatly affect product clarity. CRY chemistry can be used as a viscosity modifier in high solvency Group I or naphthenic oils while the high ethylene semi-crystalline chemistry rapidly gels in any petroleum or synthetic base oil.
“mPAO” chemistry is a proprietary copolymerization of short, long, and even branched straight chain alpha olefins. The mixture of monomers can suppress the high crystallinity of short olefins or waxy nature of longer olefins. mPAOs are typically produced in the thousands of molecular weights which grants some additional low temperature fluidity. mPAO 100 is a polymer since mPAO molecular weights can range from 5,000 – 10,000 g/mol which implies 36 to 72 decene units or 360 to 720 carbon atoms. Figure 4 compares the Tg of various poly(n-alpha olefins) from 0 (polyethylene) to 14 (polyhexadecene) carbons per side group. Curve in Tg versus carbon units is a good demonstration of how monomer selection can affect low temperature fluidity in the form of Tg.11
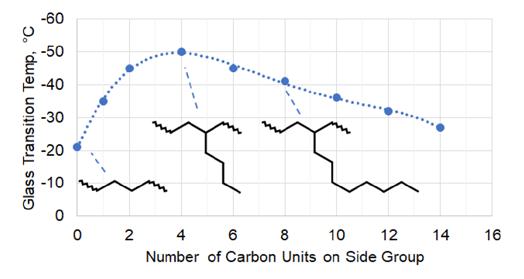
Figure 4: Glass transition temperature, and crystallinity, can be determined by monomer selection even for simple hydrocarbon polymers.
When diluted in fluids, Tg may manifest as aggregation of individual polymer chains to form a solid or semi-solid network. Tg forms through waxy interactions like long runs of ethylene or propylene in the semicrystalline olefin copolymers, or through polar attractions on polymeric esters. Tg is dependent on MW up to a few thousands (g/mol) and then remains constant and independent of molecular weight. Only mPAOs or low MW PIBs would be of sufficiently low MW to gain this benefit. Glass transition, molecular weight, and wt% usage may be key factors in comparing the low temperature fluidity of polymer-modified greases. Many more factors like catalyst selection or large-scale branching can also have subtle effects depending on the source of a given polymer. Table A compares the major properties available in the four types of hydrocarbon polymer discussed so far.
Low Temperature Grease Testing
Fluids tend to become more viscous with reduction in temperature. The internal molecules have less energy to move quickly and navigate obstacles and this further contributes to resistance to motion known as “viscosity”.
Viscosity must remain within proper tolerances for lubrication to occur. Lubrication guidelines seek to deliver an appropriate amount of viscosity based on the speed and load of the equipment to minimize wear and friction on the Stribeck c Curve. When viscosity becomes very high in greased systems it can put excessive torque on moving elements and cause damage. Electric motors can easily stall at startup from only a fraction of their rated torque under the resistance of a lubricant or grease which has thickened. Central lubrication systems pump grease through narrow tubes over up to several hundred feet and any increase in viscosity is quickly magnified to the point where flow stops.
Low temperature test methods are added to grease specifications to ensure adequate flow under cold conditions. The original NLGI grease specification (ASTM D4950) covered automotive chassis greases and limited low temperature testing to only the ASTM D4693 low temperature torque on wheel bearing test. Table B shows which test methods have been used in ASTM/DIN/ISO standards and excludes more specific OEM standards.
Table B: Comparison of Low Temperature Testing Featured in ASTM/DIN/ISO Standards for Lubricating Grease
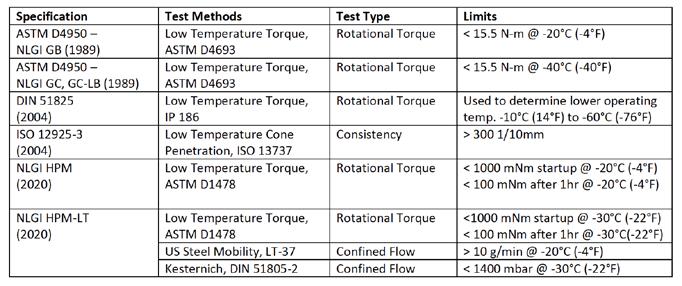
However, many industrial greases that have no use in automotive have been developed to the NLGI GC-LB specification which does not test for performance under low temperature conditions relative to their specific application. The NLGI High Performance Multiuse specification (HPM) was developed in recent years to include test methods to ensure performance in a wide range of non-automotive uses. The Low Temperature subcategory (LT) adds two new test methods and is the only specification to test more than one type of low temperature property.
ISO 12925-3 provides an international specification for greases in enclosed and open gear systems that includes ISO 13737 - Low Temperature Cone Penetration test but, allows for any suitable low temperature test if the grease does not channel at the lowest operating conditions and the customer agrees. DIN 51825 specification requires setting a lower limit for operating temperature using IP 186 low temperature torque. This is unique as the ASTM, HPM, and ISO standards only test the grease at one arbitrary temperature and do not specify exactly how the minimum operating temperature should be determined.
Several other low temperature grease test methods are popular but not officially listed as testing requirements. Lincoln Ventmeter is a popular method of determining the pumpability of grease through 25 feet of ¼” tubing and has direct application to how far grease can be pumped in central lubrication lines. Prior work has evaluated the effects of polymer additives on Lincoln Ventmeter pumpability down to -1°C (30°F).8 ASTM 1092 - Apparent Viscosity of Lubricating Greases, is another ‘confined flow’ test which forces grease under high pressure at low temperature through a narrow tube and measures the mass flow rate. Test setup is similar to US Steel Mobility.
2. Materials
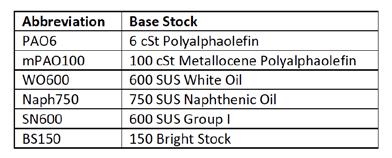
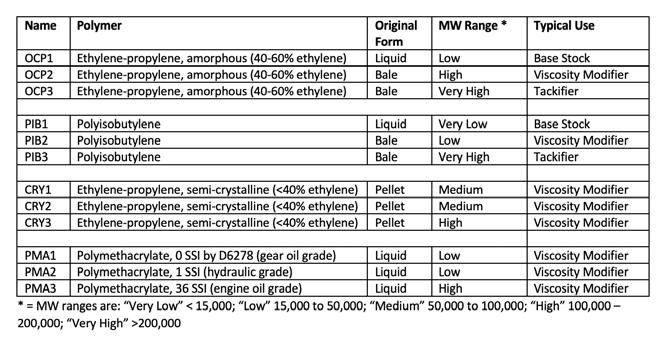
A range of base stocks (Table C) and polymer additives (Table D) were used to evaluate the effects of different polymer chemistries and molecular weights on the tackiness and low temperature fluidity of synthetic #2 simple lithium grease.
Table D includes molecular weight, abbreviated as “MW”, which in this study refers to the ‘weight-average molecular weight’ (Mw). There are multiple ways to report molecular weight of polymers depending on test method. Polybutenes are commonly named by the ‘number-average molecular weight’ (Mn) – i.e. PIB1000 or PIB2300 – which tends to be one-third to one-half the Mw value. Polybutenes are quite long and linear compared to highly branched mPAO, and this fact has implications on the low temperature fluidity described later.
Table C: Base stocks used to prepare conventional and synthetic base oil blends for greasemaking.
Polymers were diluted into light petroleum oil (ISO 22-25) such that 20 wt% of the concentrate gave an ISO 150 viscosity in PAO6. This allows a repeatable preparation of the base fluid mixture and a standardized viscosity. PAO6 was chosen due to its very low pour point, <-50°C (-58°F), which allows clear observation of any effects from polymer.
Polymethacrylate polymers (PMA1, PMA2, PMA3) were adjusted with the diluent oil such that 30 wt% of PMA and diluent oil produced ISO 150 blends in PAO6. The lower thickening efficiency of the PMAs required higher treat than 20 wt%. The PMA polymers are only used in this study for additional tackiness testing with the Tackiness Adhesion Analyzer (TAA, described in the Methods section) to establish a wider dataset. No low temperature testing was performed with PMA greases but may be tested later when the TAA data interpretation has been further matured.
Four more common ISO 150 base oil blends were prepared as control groups against the highly polymer modified experimental samples described above. The White Oil ISO 150 base oil was not compatible with the pre-formed lithium 12-hydroxystearate thickener and produced poor texture which could not be corrected by milling. • Paraffinic ISO 150 = 85wt% SN600 + 15% BS150 • Naphthenic ISO 150 = Naph750 • PAO ISO 150 = 50wt% PAO6 + 50wt% mPAO100 • White Oil ISO 150 = 95wt% WO600 + 5wt% PIB1
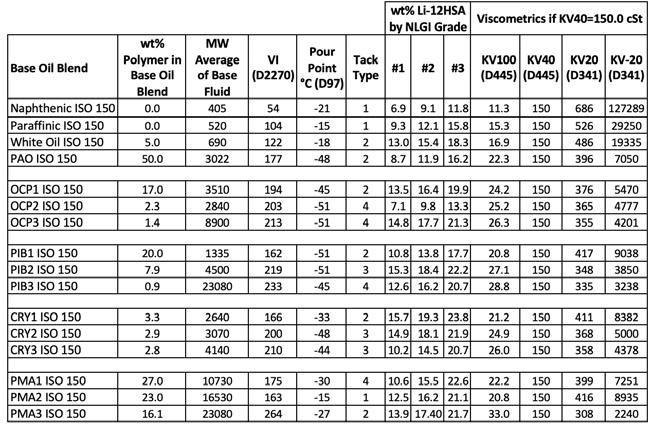
ISO 150 base oil blends are shown below in Table E with comparisons for KV100, KV20, and KV -20 assuming all oils were prepared at a perfect 150 cSt at 40°C (104°F). The fluidity and pour point of the base oil is considered to be a limiting factor in the lower operating temperature of grease. KV20 and KV -20 are extrapolated from the ASTM D341 calculation. “Tack Type” is a metric developed and discussed later in this work describing the tackiness behavior of the grease.
3. Methods
2.1 Simple Lithium Soap Base Preparation
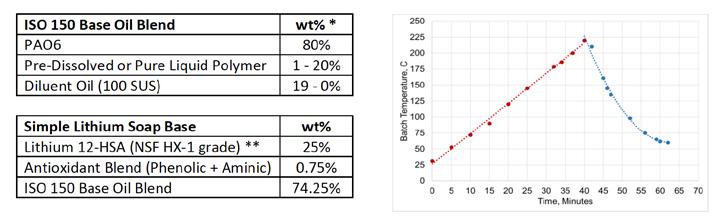
Soap bases for later cut-back to prepare #2 simple lithium greases were initially prepared using Blachford Lith12 HX-1 preformed lithium 12-HSA powder in a lab-scale open kettle. The basic recipe for the ISO 150 Base Oil Blends, the Simple Lithium Soap Bases, and the heating profile are organized below in Figure 4.
* mPAO grease uses 50% mPAO + 50% PAO6; PMA greases use 30% polymers/oil + 70% PAO6 ** Naphthenic base oil blend starts with 20% Lithium 12-HSA preform. Figure 4: Base formulation and temperatures for preparing simple lithium greases from pre-formed thickener.
400 gram batches of soap base were prepared from pre-formed thickener in a three-speed Hobart C-100 mixer with a 10-quart bowl, a B-style Hobart agitator paddle, and an electronic heating mantle (Glas-Col, 600 W, 5000 mL, silicone-impregnated fiber glass, #100AO414). A 120V Variac was used to regulate the heating mantle power and batch temperature.
Temperature was ramped up using a Variac to control the power level of the electric heating mantle at a rate of +5°C (+9°F) per minute. The batch was held above 220°C (428°F) until the lithium salts became molten and in full synthetic base oil blends temperatures up to 230-240°C (446-464°F) may be required. Once molten, the batch was mixed for five minutes before removing the electric heating mantle and continuously stirring down to 60°C (140°F).
Greases were milled to good texture with a two-roll mill (Seattle Findings #28-281) adjusted to the finest gap setting that would allow material to pass through. The mill was modified with a motor (Dayton 6A198; 1/20 HP, 154 rpm, 20 ft-lbs torque) to power the rollers. Material was passed through the rollers three times. However, full synthetic greases with no diluent petroleum oil produced larger, coarser grains of thickener that required up to six passes. The ISO 150 Naphthenic base oil was prepared with 20 wt% lithium 12-HSA instead of 25 wt% due to the higher yield in the naphthenic oil which produced soap bases too thick to properly mix in the kettle.
2.2 Adjusting Greases
Soap bases with simple lithium thickener were cut back with 10 wt%, 25 wt%, and 50 wt% additional ISO 150 base oil blend. These three preparations were milled on a simple two-roll mill three times at the lowest gap setting. The consistencies of milled greases were measured by ASTM D1403 - Quarter Cone Penetration. A linear or logarithmic plot of wt% thickener versus full-scale cone penetration was used to determine the middle of the NLGI #2 grease consistency range. The remainder of the grease batch was cut back using the three-point calibration curve and milled to good texture.
2.3 Low Temperature Testing
Two methods were used to scan the low temperature rheology of the polymer-modified greases and control greases.
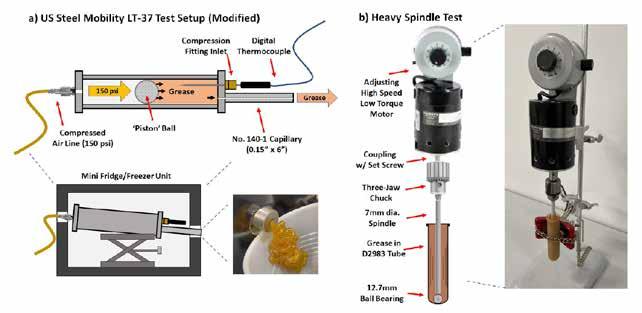
In Figure 5a, US Steel Mobility LT-37 allows the flow of grease in central lubrication systems to be modeled. This type of testing ensures that changes in the grease’s resistance to flow with temperature does not affect pumpability in narrow, high pressure lines. Lincoln Ventmeter or DIN 51805-2 Kesternich method achieve similar goals with varying amounts of difficulty in setting up the experiment.
In Figure 5b, the Spindle Stall Test is a house-made test to emulate and investigate the resistance of viscous and tacky greases on rotating elements like bearings or shafts upon startup where the machinery’s torque is lowest and risk of stalling is highest. This test is intended to be a simple and quick alternative to methods like Low Temperature Ball Bearing Torque (ASTM D1478) or Low Temperature Wheel Bearing Torque (ASTM D4693).
2.3.1 Modified US Steel Mobility (LT-37)
US Steel Mobility was measured using an LT-37 unit in a modified procedure to allow the unit to run in a sideways orientation in a small consumer ‘mini-fridge’.
The unit was placed sideways into the freezer of a 3.1 cubic foot combination refrigerator/freezer (Whytner MRF-310DB) with 1” diameter holes drilled to allow the pressure inlet and grease outlets to be accessible. An adjustable lab jack was used to position the unit in the center of the freezer at an approximately 15 degree downward slope. Pressure was provided by a Craftsman air compressor (2.6 SCFM, 6 gallon capacity, 150 psi).
Initial testing showed channeling of the grease sample which caused the 150 psi gas to blow through the grease sample even when filled with grease. To evenly distribute pressure across the sample, a golf ball (Titleist II) was found to fit the inner diameter of the LT-37 unit perfectly and was used as a piston (or pig). The rubber composition of modern golf balls provides excellent flexibility and compression even at low temperatures, no blow through occurred.
A digital temperature probe was inserted into the sample about 5 cm using a NPT-compression fitting adapter and rubber ferrule to prevent leakage. The freezer remained closed after sample preparation. The probe was calibrated at four temperatures from room temperature, ~20-25°C (68-77°F), to -40°C (-40°C) against ASTM-certified analog thermometers.
Table F tabulates the different times that grease was allowed to flow at each temperature point as well as the timing required to cool to the target temperature. The LT-37 was loaded with a lightly greased ‘piston ball’ and 250 grams of grease before sealing and inserting into the freezer. The freezer stabilizes at -29°C (-20°F) and allows readings down to -20°C (-4°F) within 3 hours if the unit and grease are pre-chilled at -6°C (-21°F) overnight in the refrigerator section of the cooling unit. If the unit is left in the freezer overnight, the sample temperature can reach down to -25°C (-13°F).
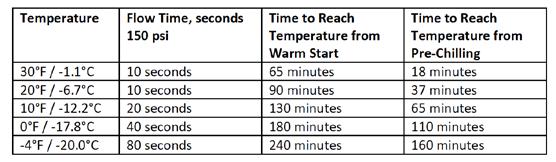
Temperatures and times for the PAO-based ISO 150 greases are below. Non-PAO greases or PAO greases using the highest MW polymers for a given category were given twice the flow time due to slower flow rates. Roughly, every 10°F/6°C reduction causes flow rate to half for the majority of grease formulations in this study.
Samples were degassed by cycling 5 minutes on and off under vacuum (25-27” Hg vacuum) until pressurization and depressurization of the vacuum chamber did not cause the grease to expand or contract. Typically five purge cycles are sufficient to remove any entrained air.
2.3.2 Low Temperature Spindle Test
Several attempts at modifying ASTM D2893 low temperature Brookfield viscosity method were made using partial penetration of the #4B2 Brookfield spindle into the grease to give a qualitative measure of grease viscosity versus temperature. Reproducibility was poor due to the very high viscosity of the #2 grease samples which are far above the 6,000,000 cP limit of a Brookfield unit.
Instead, a low power 110V electric motor (Talboys, Model 103A, 1/12 HP, 1000-10000 rpm, 120VAC, 110W) with three-jaw chuck was used to hold a 7 mm diameter steel rod immersed approximately 100 mm in a tube of grease (115x25 mm tube from ASTM D2893). A 0.5” AIST steel ball bearing was placed at the bottom of the tube beneath the grease to serve as a support and to prevent the rod from accidentally breaking through the tube. The grease was charged to the tube using a 3-oz scale grease gun. The startup RPM of the motor versus the temperature of the grease was used to emulate conditions of low temperature torque tests but provide a ‘scanning’ mode for evaluating the torque on the grease at various temperatures quickly. The first measurement was made at 22°C (72°F), after 30 minutes in the -6°C (21°F) refrigerator, after 1 hours in the -29°C (-20°F) freezer unit, and 1 hour in -40°C (-40°F) Brookfield viscometer bath.
The startup speed (in rpm) of the motor was measured as the number of rotations in 30 seconds at each temperature before moving the sample to the next cooling zone. A black line marked on the chuck allowed visual counting. If the motor stalled, this was noted as “0 rpm”. After stopping the motor at 30 seconds any partial rotations are included to nearest ¼ turn which provides improved accuracy at very low rpms. At high rpms or if the motor begins to accelerate, the number of turns in 15 seconds is used to calculate rpm.; Otherwise, the motor is operating out of startup torque conditions, or the tacky grease may begin to climb the rod.
Startup rpm versus temperature of the grease is reported. The startup torque may be calculated through the equation: Torque (mN-m) = -0.0226 * (rpm) + 11.79. A calibration curve was established by measuring rpm
versus the weight (in Newtons) of various weights pulled up by a string attached to the spindle. The torque required to stall the motor at startup was 11.8 mN-m, equivalent to pulling up a 300-gram weight. Startup rpm and torque will greatly vary from the rated capacity under steady state operation.
2.4 Falex TAA Tack Testing
Adhesion and cohesion of the greases were measured by a Falex Model 200 Tackiness Adhesion Analyzer (TAA). Using software version 1.3.3. Data processing was performed through an included Excel macro, software version 1.2. Work has been previously demonstrated using the TAA method on #1 calcium sulfonate greases with various grease polymers.5
The 15-well sample carousel was loaded with fifteen repeat samples of each grease to allow for automating scanning at different probe retraction speeds. Compression energy and separation energy were calculated in microjoules. Thread length was calculated in millimeters.
Approach and retraction speeds were varied at 0.1, 0.5, 1.0, 2.0, and 5.0 mm/s per the default “Round Robin 2021” procedure show in Figure 6. One full run tests each speed fifteen times (5 cycles per well on three wells) and calculates averages for each tackiness parameter from all fifteen runs. The first few cycles may vary from the last cycles per well.
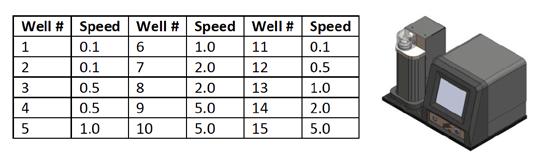
Figure 6: Protocol for testing the grease samples in wells #1-15 using varying speeds for approach and retraction
The probe approaches the sample at the approach speed, waits 1 second, embeds into the grease to produce a force of 50 mN, then holds for 3 seconds before retracting (same speed as approach). A micro force gauge measures the push and pull on the probe as it manipulates the grease, and this information is recorded for later analysis.
3. Results and Discussion
Testing for Different Types of Tackiness in Grease
Our goal is to relate tackiness to quantified measurements of low temperature fluidity in the LT-37 US Steel Mobility test and the custom-made Spindle Stall Test. For this, we must also quantify tackiness to create and investigate a correlation.
Four types of tacky behavior were observed in the various grease formulations. It was hypothesized that these different types of behavior would be the result of different adhesion and cohesion parameters. Therefore, it was important to classify these types before using the Falex TAA to quantify the tackiness parameters. Different polymer structures in the greases should cause differences in the adhesion and cohesion properties, which caused differences in the observed tackiness performance.
The four behaviors observed with manual thumb and finger tack testing are depicted in Figure 7 as: • Type 1 – “No Tack” – The grease sample pulls apart into two thin, slightly bumpy layers. • Type 2 – “Stiff Peaks” – There is some structuring occurring where the grease pulls into two triangular peaks reminiscent of a dolphin or shark fin. • Type 3 – “Elastic” – The grease exhibits elastic behavior and elongates over a longer distance and narrows in the middle into an hourglass shape. The narrow region will snap and result in two long peaks.
The thick thread of grease elongates by stretching of the material already between the two surfaces. • Type 4 – “Threading” – The grease immediately pulls into narrow threads which elongate rather than thin and can produce quite long strands. The thread appears to be extending not through stretching of the material in the thread but by pulling in surrounding grease from the two surfaces.
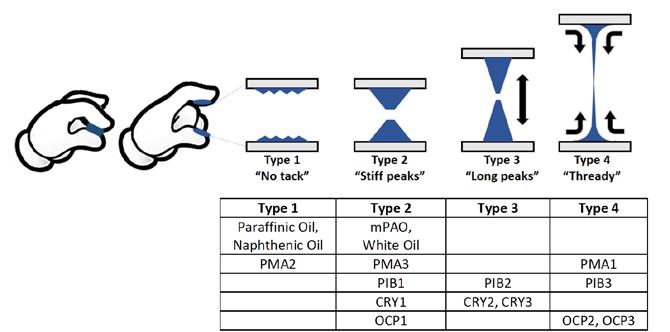
Figure 7: Visual depiction of the four different Tack Types observed in the sixteen greases prepared
Can a highly precise microscale force gauge (the Falex TAA instrument) capture this behavior in some fashion?
The Falex TAA unit can measure: thread length (length before breakage), compression energy, separation energy, peak force to pull the thread, and all as a function of time or distance between the grease sample and the moving probe. Conditions can also change and be measured for various probe movement speeds and timing. There are several opportunities to find unique correlations between those pieces of data and the four tack behaviors observed. The forces and distances are recorded as a TAA plot in Figure 8 which can be further analyzed by integration to calculate energies (force x distance) or observe physical events (breakage of the grease thread).
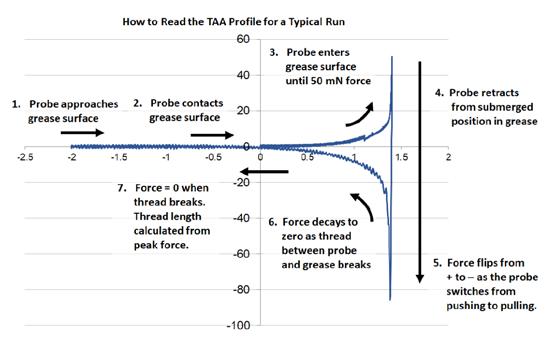
Figure 8: Tackiness adhesion analyzer (TAA) plot which relates the distance of the probe tip from the grease (x-axis) versus the positive push or negative pull forces on the grease (y-axis) as it approaches or retracts.
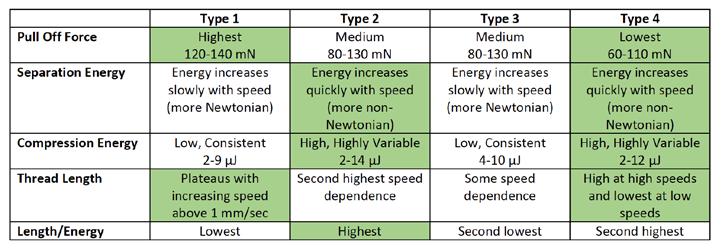
Pull off force (Fn) exhibited during retraction of the probe from the grease samples was typically highest in greases with Type 1 “no tack” behavior (120-140 mN) while peak force trended lowest for Type 4 “thready” greases (60 – 110 mN) from speeds of 0.1 to 5.0 mm/sec. Type 2 and Type 3 greases exhibited similar (80 – 130 mN) levels of intermediate peak force. Peak force could be read as the stress required to cause the grease to yield and allow the probe to pull away. Higher peak forces demonstrate a tougher or less yielding grease and vice versa for lower peak forces.
Separation energy increases with retraction speed for all greases. However, Type 1 and Type 3 tackiness behavior show a rather linear steady increase from 0.1, 0.5, 1, 2, and 5 mm/sec while Type 2 and Type 4 behaviors show disproportionately low separation energy at low speeds (0.1) and much higher separation energy at high speeds (5.0). The slope of separation energy vs. retraction speed is steeper for Type 2 and 4 which implies the formation of stiff peaks or narrow threads is speed dependent. As all non-Newtonian behavior is expected to be. The lack of tackiness in Type 1 or the elastic, Newtonian behavior of Type 3 (where the thicker thread stretches and snaps) would be more Newtonian and less speed dependent.
Compression energy during embedding the probe into the grease sample did not vary with speed. Type 2 and Type 4 greases trend higher in compression energy with a wide variations between different grease formulations. Type 1 and Type 3 greases are lower in compression energy on average and more consistent between different grease formulas.
Thread length versus retraction speed follows a similar trend to separation energy. Type 2 (“stiff peaks”) and Type 4 (“thready”) show exaggerated speed dependence with low retraction speeds showing low thread lengths and higher retraction speeds showing higher thread length. Type 3 (“long peaks”) are slightly speed dependent, but all samples fall within a narrow band of thread lengths versus speed. The ratio of thread length at 5.0 mm/sec to thread length at 0.1 mm/sec was typically 1.5 – 2.0 for most greases yet two greases with Type 4 behavior showed ratios of 2.7 and 3.9 from the very high MW PIB3 and OCP3 greases. Thread length tends to plateau for Type 1 greases above 1 mm/sec.
Thread length divided by separation energy (“length/energy”) against follows the trend of separation energy and thread length with Type 2 and Type 4 showing high contrast in length/separation energy from low (0.1 mm/sec) to high (5.0 mm/sec) speeds. Again, Type 1 and Type 3 greases show very similar results for this metric despite the very different physical effect of no tack in Type 1 and very elastic tack in Type 3. Overall, the length/energy increases as Type 1 < Type 3 < Type 4 < Type 2.
From the findings organized in Table G, the Falex TAA using the default ‘Round Robin 2021’ protocol of testing can separate greases with Type 1 and Type 3 tack behavior (more Newtonian based on the TAA data) from greases with Type 2 and Type 4 behavior (more non-Newtonian based on the speed dependency observed in the TAA data). Yet the default information cannot separate Type 1 from Type 3 or Type 2 from Type 4.
Table G: Comparison of measured values for the different types of grease tack behavior. Key characteristics are highlighted.
The parameters above are automatically calculated from the average of three 5-cycle runs for each approach/ retraction speed. Averaging the TAA force-distance profile may remove subtle details that may further help sort different grease behaviors into the four types experimentally observed with the simple finger tack test.
It is acceptable if Type 2 and Type 4 greases, both objectively tacky, cannot be differentiated by a tack tester but Type 1 (not tacky) and Type 3 (very elastic and tacky) ought to be easily distinguishable. Looking at all the evidence it may take a combination of factors to be assessed to quantitatively separate Type 1 from Type 3 in testing. Type 1 grease behavior has very high pull off forces with low change in thread length at higher speeds (>1 mm/sec). Type 3 behavior comes with moderate pull off force and thread length which continues to increase with retraction speed. The differences exist but are subtle and not one clear feature distinguishes the two.
Figure 9 below compares two representative samples from each tack behavior type at 5.0 mm/sec speed. The main difference occurs in the curvature of the force versus distance plots, specifically on the shoulder as force increases or decreases rapidly when the probe enters or exits the bulk of the grease sample. Comparing the TAA profile for Type 2 to Type 3 to Type 4 shows continuously broadening of this shoulder as the increase in force with distance becomes less ‘sharp’.
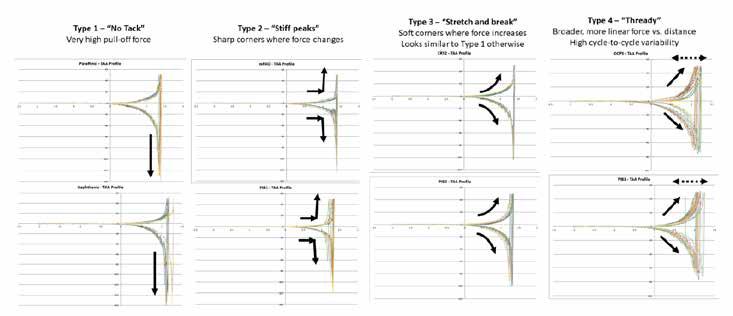
Figure 9: Plots of raw TAA data showing qualitative changes in the shape of the TAA plot with repeat cycles for different Tack Types.
However, Type 1 and Type 3 exhibit similar features and, much like the parameters discussed previously, the only difference appears to be the very high pull-off force of the Type 1 greases versus the Type 3 grease. It seems possible that Type 1 and Type 3 belong to one single type of grease behavior since these numerous comparisons show very few concrete differences that could separate the two types definitively. While no parameter or TAA profile can distinguish the two clearly it is still very apparent that Type 1 and Type 3 greases show obviously different behavior to any casual observer.
We can identify four different types of grease tackiness behavior, but the default TAA test protocol did not produce any clear singular value for “tack” that all formulations could be measured against. Thread length would be most useful but all greases from Type 1 (no tack) up to Type 4 (very thready and tacky) show that all the greases are forming threads which break at in the range of 0.4 – 2.0 mm depending on the retraction speed from 0.1 – 5.0 mm/sec. The finger tack method can pull threads of grease several orders of magnitude longer for Type 4 greases.
Future work will entail optimizing the TAA test conditions to better isolate the key parameters that govern the four types of grease behavior and distinguish between greases with higher precision. It is to note that this preliminary test shows that certain speeds of retraction can begin to show different phenomena. At 0.1 mm/ sec, it appears that the speed is too low and the TAA profile shows irregularities. At 1.0 mm/sec, there is a transition point where non-tacky greases don’t increase in thread length with increasing speed. At 5.0 mm/ sec, thready/tacky greases will show high cycle-to-cycle variability. Key points from section: • Falex Tack Adhesiveness Analyzer (TAA) measures quantities like pull-off force, separation energy, and thread length as a function of grease composition and the protocol which consists of different test speeds and cycles. • Four empirical ‘types’ of tackiness behavior were seen in the many polymer-modified greases prepared in the study; from ‘no tack’ -> formation of ‘stiff peaks’ -> ‘elastic, stretch, and break’ -> ‘thready’. • The default “Round Robin” parameter for the TAA unit can distinguish between three of the four grease behavior types based on qualitative features like curvature of force vs. distance and pull-off force.
• Type 1 and Type 3 greases are very hard to differentiate in the TAA test, but the difference is obvious to the ‘finger tack’ method. Type 1 and Type 3 behavior may be two opposite ends of one single behavior type. • A more specific TAA testing protocol needs to be developed that can separate the four tackiness behavior types.
Spindle Stall Test
The Spindle Stall test shows a wide range of effects of polymer-modified greases, using the resistance on a moving element (rpm) versus temperature. For an electric motor, increasing torque from the resistance between the rotating shaft and the viscous grease causes the RPM to decrease until the motor stalls when the resistance equals the torque output, and the RPM becomes zero.
Figure 10 compares the spindle rpm versus temperature for the controls, PIB, OCP, and CRY formulations. The non-petroleum greases all produce gradual reductions in rpm with decreasing temperature to -40°C (-40°F) while petroleum greases rapidly decline in rpm (increase in torque) by 0°C (32°F).
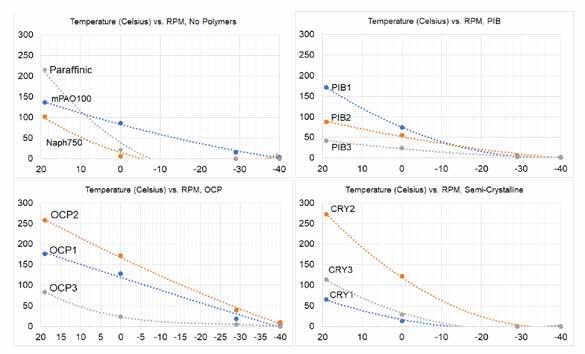
Figure 10: Plots of spindle rpm versus temperature. The rpm decreases due to rising consistency in the grease as it cools which imparts more torque on the motorized spindle.
Since the majority of greases were synthetic-based, most greases did not stall the motor at -40°C (-40°F). Only the paraffinic, naphthenic, and CRY polymers (semi-crystalline OCP) based greases exhibited 0 RPM at -40°C (-40°F), which is the test temperature for ASTM D1478 on the NLGI HPM-LT grease specification. These samples were the highest, i.e. worst, pour points at -15°C (5°F), -21°C (-6°F), and -33°C (-27°F) for Paraffinic, Naphthenic, and CRY2 base oil blends. It is a common rule of thumb that a grease’s lower limit for operating temperature is the pour point of the grease’s base fluid and all three base fluids for the greases that stalled were above -40°C (-40°F). The CRY polymer blends have Tg, molecular pour points, of roughly -10°C (14°F) which appears to dominate the low temperature fluidity even though isolated CRY2 and CRY3 base fluid blends had pour points of -48°C (-54°F) and -44°C (-47°F) below the grease test temperature of -40°C (-40°F).
Interestingly, measuring RPM versus temperature from 20°C (68°F) to -30°C (-22°F) show that the medium molecular weight polymers OCP2 and CRY2 are far more favorable than their low molecular weight counterparts OCP1 or CRY1. At -40°C (-40°F), even the PIB2 outperforms the PIB1 and allows the highest RPM of the PIB series. In all cases the highest molecular weight polymers; PIB3, OCP3, and CRY3 produced the lowest RPM which implies the highest resistance to spindle rotation at low temperature. However, for OCP and CRY polymer chemistries the best performer was neither the lowest nor the highest molecular weight. Why is this so?
The results highlight a key dilemma in formulating with polymers. Is it better to formulate with a low wt% of high MW polymer or a high wt% of low MW polymer to achieve a target viscosity? In fluids, the low wt% / high MW option typically produces higher low temperature fluidity since, more of a lighter base oil can be used which ultimately drives the fluidity. Yet for applications like, gear oil or industrial HF where stringent limits of shear stability are placed, the high wt% / low MW strategy provides the best mechanical stability.
The way to compare low wt% / high MW vs. high wt% / low MW is to calculate a molecular weight average which gives a single number to rank the formulations against their low temperature fluidity or the RPM on the motor. Molecular weight average (MW) is an arithmetic average of each component (PAO6, polymer, diluent oil) versus their respective wt% in the base oil.
Figure 11 shows comparisons of the startup RPM at -40°C (-40°F) versus the log of the molecular weight of the respective polymers, the MW average of the base fluid blends, and the wt% polymer. Looking at the dataset from these three perspectives, it shows that the highest RPM was not achieved by the highest or lowest molecular weight polymer (first plot). The highest performance was centered around the medium MW polymers with an average MW of 5,000 in the base oil blend (second plot). Several blends fell within the ~5000 MW, but the third plot comparing wt% polymer used separates performance of the OCP2 vs. OCP1 vs. mPAO100, which compete as the highest RPM formulas.
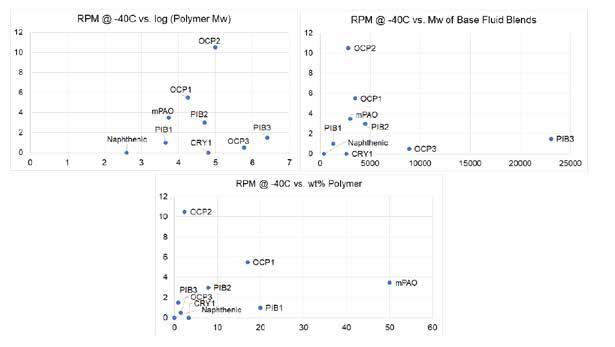
Figure 11: Comparing rpm of the spindle at -40°C (-40°F) against different parameters of the polymer-modified base oil formulation to determine the factors that correlate best to increased torque on the motor at low temperatures.
From the data, it appears that having too much polymer is negative and the lower MW grades (OCP1, PIB1, CRY1) plus mPAO will require more polymer than other formulations to achieve the ISO 150 base oil viscosity. It also appears, that high molecular weight is also negative for OCP3 and PIB3, though due to the PIB’s higher MW, and it outperforms the OCP slightly. A moderation between suitably low MW and good thickening efficiency (low wt% polymer needed to meet ISO grade) appears to occur around 5,000 MW which coincide with OCP2. Which does so with the least amount of polymer. OCP1, mPAO, and PIB2 also fall into the 5,000 MW region but, have notably more polymer and produce lower startup rpm.
Why does OCP1 outperform the similar PIB2? PIB2 has a lower polymer wt% and similar MW average of ~5,000. However, the OCP modified greases all appeared to be more yielding and shear thinning than PIB or CRY modified greases despite all greases testing as NLGI #2 on the ASTM D1403 cone penetration test. This is also apparent on the higher startup RPMs at room temperature, 20°C (68°F), which indicate the OCP greases have lower startup resistance. Cone penetration is a very simple test which only captures the rheology of the grease under one arbitrary condition and though all greases are NLGI #2, they present differently under different shearing tests.17
US Steel Mobility – LT-37 Results
The flow rate on US Steel Mobility LT-37 at -20°C (-4°F) is required to be >10 g/min to meet the Low Temperature category of the new NLGI High Performance Multiuse grease specification. Previous discussion on polymers, measuring tack, low temperature fluidity, and the simple Spindle Stall Test have all served as groundwork to discuss the effects of polymers on performance in US Steel Mobility down to -20°C (-4°F).
Most of the greases were able to flow at -20°C (-4°F). Not every grease met the >10 g/min requirement for HPM-LT subcategory.
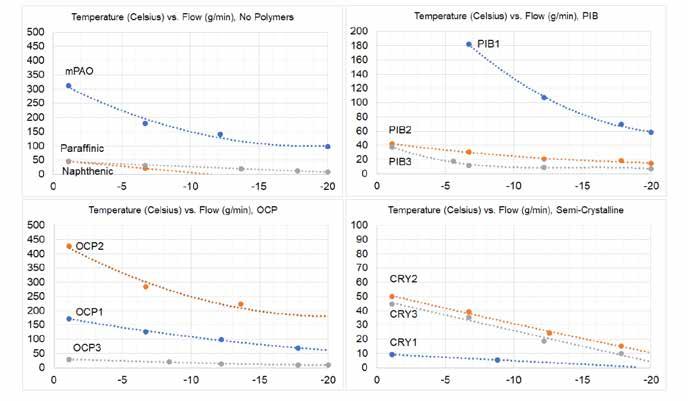
Figure 12: Comparison of LT-37 flow rate (g/min) from 0 (32°F) to -20°C (-4°F) for control and polymer-modified greases.
Comparing the US Steel Mobility flow rates versus the Spindle Stall test in Table I, it is apparent that there is good correlation between grease that stall the spindle motor at -40°C (-40°F) versus greases that fail the HPM-LT flow rate of 10 g/min. CRY2 was the only grease that failed the Spindle Stall but, passed HPM-LT although the CRY2 grease only exceeded the limit by 1.6, which may be well within experimental error for US Steel Mobility.
Table I: Low Temperature Test Results from US Steel Mobility and Spindle Stall Tests
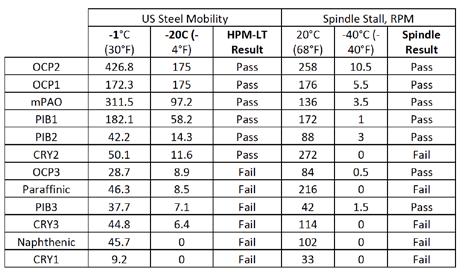
The very high MW polymers PIB3, OCP3, and CRY3 appear very poor on the Spindle Stall test yet do flow at -20°C (4°F) in US Steel Mobility. No formulation here was optimized and with some adjustment it would likely be possible to meet the 10 g/min limit if starting from the 6 – 9 g/min starting formulations demonstrated here. Spindle Stall test at -40°C (-40°F) appear to be a good pass/fail or go/no-go indicator for US Steel Mobility at -20°C (-4°F). Setup is minimal and results can be obtained within 2 hours.
Which other factors in grease composition and properties can also help to predict US Steel Mobility success? Figures 13 – 21 compare various factors of grease composition or different properties versus the US Steel Mobility in grams/minute at -20°C (-4°F).
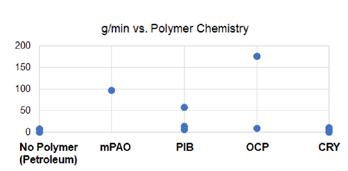
Figure 13: Polymer chemistry vs. US Steel LT-37 at -20°C (-4°F) Polymer chemistry appears to matter. The use of polymers, if mPAO is included, helps to create a synthetic base fluid required for -20°C (-4°F) flow. Indeed, the original US Steel Mobility testing only calls for testing down to -1°C (30°F) when conventional base stocks were most prevalent. The ISO 150 Group I and naphthenic base stocks both failed HPM-LT with the naphthenic sample giving no flow.
The interesting point is that PIB, even low MW PIB1, has relatively low flow rates despite having the best Tg of the four polymers,-70°C (-94°F). It could be due to the poor thickening efficiency of PIB polymers which requires them to be used at higher wt% can cause overtreat of the polymer.
Figure 14: Tackiness type vs. US Steel LT-37 at -20°C
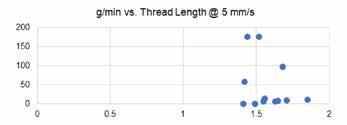
Figure 15: Low speed thread length vs. US Steel LT-37 at -20°C
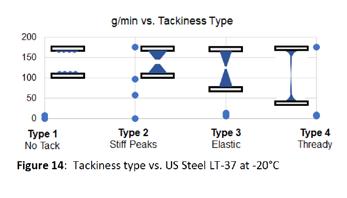
Figure 16: Separation energy vs. US Steel LT-37 at -20°C
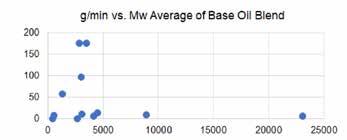
Figure 17: MW of base oil blend vs. US Steel LT-37 at -20°C Tackiness Type – Whether no tack, to some structure, to very thready behavior – it gave welldefined results. Only the conventional greases were Type 1, all Type 1 greases gave poor flow rate. All Type 3 greases (elastic) failed the HPM-LT spec and were the worst performers. Three of the four Type 2 greases passed while only one of the three Type 4 greases passed (OCP2).
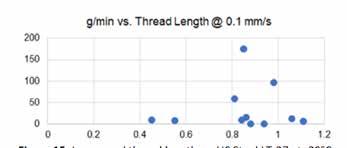
TAA test parameters that best fit the US Steel Mobility trends were Thread Length at a low speed (0.1 mm/s) and Separation Energy at a high speed (5.0 mm/s). The Thread length plot shows the familiar ‘triangular’ shape seen in other figures above where flow rate increases to a maximum and then decreases beyond that value.
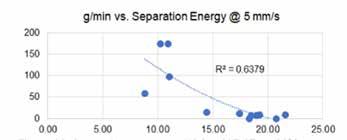
Higher separation energy at higher speeds typically produce better flow rates in low temperature for the US Steel Mobility. Separation energy tends to be reduced by high MW polymers and is very low in the Type 4 “thready” greases as the threads are pulled very easily.
Average molecular weight of the base oil blend had a strong effect on the US Steel Mobility. Much like the Spindle Stall test, the most successful and highest flow greases were centered around MW = 5,000 g/mol.
Figure 18: Base oil blend pour point vs. US Steel LT-37 at -20°C
Figure 19: Base oil blend VI vs. US Steel LT-37 at -20°C
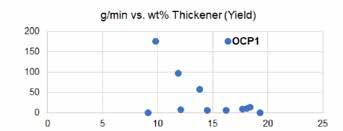
Figure 20: Thickener wt% vs. US Steel LT-37 at -20°C
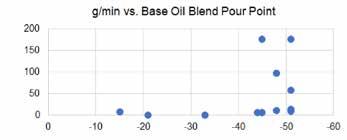
Figure 21: High speed thread length vs. US Steel LT-37 at -20°C Pour point of the base oil blend shows a strong effect. No base fluid with a pour point warmer than 40°C (104°F) gave a passing flow rate in US Steel Mobility at 20°C (68°F). This may be the reason behind the good correlation between Spindle Stall at -40°C (-40°F) versus US Steel Mobility at -20°C (-4°F). Low pour point was a necessary but not sufficient parameter for success.
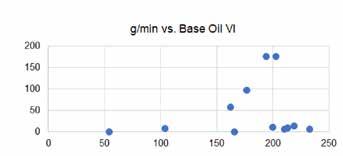
Base oil viscosity index (VI) shows an interesting, ramp-like relationship. VI of 150 to 200 produced good flow rates at -20°C (-4°F) but, exceeding a VI of 200 suddenly gave very poor results. The highest VI base oil blends were from the highest MW polymer grades while, the medium MW polymers preferred low temperature fluidity and produced the 150-200 VIs.
Thickener wt% showed a ramp-like trend with higher amounts of thickener had a strong decline in flow rate. The low MW OCP1 stood out with very high flow rate but, otherwise higher thickener content was unfavorable.
Many of these factors may be the result or symptom of other, more fundamental factors. Which factors did not greatly affect US Steel Mobility in a systematic way?
Thread length at high speed (5 mm/sec) has notably low correlation with flow rate. Overall thread lengths were much lower on the TAA tack test versus being pulled by the simple finger test. More work is needed to refine the testing protocol to emulate the exact conditions. US Steel Mobility flow rates tend to be quite low so highspeed tackiness may not be applicable due to the difference in time frame.
A range of greases were prepared using ISO 150 synthetic base stocks adjusted with different molecular weights (base stock, viscosity modifier, tackifier) from three different polymer chemistries (PIB, OCP, CRY). The resulting greases show a wide range of tackiness which can be summarized as four different types of tack behavior.
Quantification of tackiness behavior with the Falex TAA has been moderately successful in corroborating the empirical, visual finger tack results with real force and energy numbers. However, this preliminary work with the Falex TAA does not yet produce a singular measure of tack that we can line up all the greases against. Knowing that there are different regimes of tackiness behavior, it will help guide careful consideration of future testing protocols with TAA.
Low temperature testing with the in-house Spindle Stall test and the US Steel Mobility LT-37 methods give insight into the balance of wt% polymer versus polymer molecular weight and chemistry.
The Spindle Stall test demonstrates that the best low temperature fluidity and low resistance to torque are achieved when the molecular weight average of the base fluid blend (between polymer, base oils, and synthetic base stocks) is limited to 5,000 g/mol. The limitations of mPAO became apparent due to the very high treat rate (50%) which made the mPAO control grease less fluid than the OCP chemistries.
US Steel Mobility results at -20°C (-4°F) correlate well with the Spindle Stall at -40°C (-40°F). Similar phenomena are in effect between the resistance to rotation of a spindle versus grease being pushed through a confined metal tube, the difference is whether it is the metal substrate or the grease sample is in motion. Not all greases that passed US Steel Mobility passed the Spindle Stall test and vice versa. Thus, it is important to screen multiple types of grease flow (i.e. rotational torque, confined flow, consistency changes) to cover possible failure in different end uses.
5. Acknowledgements
Thank you to Jim Cordek (Functional Products Inc.) for the numerous soap bases and characterizing each base fluid blend; and to Pat Stockton (Clark Testing) for discussions on US Steel Mobility method. Thank you to Falex Tribology (US and European teams) and Compass Instruments Inc. for continued discussion and training with the Falex TAA tack tester equipment and to H.L. Blachford for supplying the NSF HX-1 lithium 12-hydroxystearate preformed grease thickener.
6. References
1. Vargo, D. M. Polymers to Enhance the Performance of Inorganic Grease. NLGI Spokesman 32–36 (2017). 2. Vargo, D. The Adhesiveness of Grease. NLGI 81st Annual Meeting (2014). 3. Willett, E. Overcoming Obstacles in Water Resistant H1 Specialty Greases Using Polymer. 4. T.G. Musilli. Water Spray-off Characteristics of Lubricating Grease. NLGI Spokesman December, (1982). 5. Georgiou, E. et al. Measuring Grease Tackiness Objectively. ELGI AGM (2019).
6. Gonçalves, D. et al. Formulation, rheology and thermal ageing of polymer greases—Part I: Influence of the thickener content. Tribology International 87, 160–170 (2015). 7. Willett, E. The Mechanical Stability of Polymer-Modified Greases. 8. Vargo, D., DeVore, D. & Lipowski, B. The Effect of Polymer Additives on Grease Flow Properties.
NLGI 81st Annual Meeting (2014). 9. Kunal, K. et al. Polyisobutylene: A most unusual polymer. Journal of Polymer Science, Part B: Polymer
Physics 46, 1390–1399 (2008). 10. Malhotra, S. L., Minh, L. & Blanchard, L. P. Thermal Decomposition and Glass Transition Temperature of Poly(isobutylene). http://dx.doi.org/10.1080/00222338208056515 18, 455–475 (2006). 11. NATTA, G., DANUSSO, F. & MORAGLIO, G. ISOPHASIC TRANSITIONS OF POLYMERS OF n-ALIPHATIC α-OLEFINS. Stereoregular Polymers and Stereospecific Polymerizations 386–387 (1967) doi:10.1016/B978-1-4831-9883-5.50068-4. 12. Linnig, F. J., Parks, E. J. & Wood, L. A. Ethylene–propylene copolymers: Crystallinity, infrared, and creep studies. Journal of Applied Polymer Science 8, 2645–2651 (1964). 13. Gahleitner, M. et al. Propylene–ethylene random copolymers: Comonomer effects on crystallinity and application properties. Journal of Applied Polymer Science 95, 1073–1081 (2005). 14. Tammy Uan-Zo-li, J., Marand, H. & Brian Love William Reynolds Alan Esker Richey Davis, C. J.
Morphology, Crystallization and Melting Behavior of Propylene-Ethylene Statistical Copolymers. (2005). 15. US20090281360A1 - Polyalphaolefins and processes for forming polyalphaolefins - Google Patents. https://patents.google.com/patent/US20090281360A1/en. 16. US8080699B2 - Two-stage process and system for forming high viscosity polyalphaolefins - Google
Patents. https://patents.google.com/patent/US8080699B2/en. 17. Flemming, W. & Sander, J. Is It Time to Retire the Grease Penetration Test? NLGI Spokesman 14