18 minute read
Bearing Corrosion Analysis Using Machine Vision and Computational Algorithms

Jason Galary Director of Research and Development Nye Lubricants, Inc., Fairhaven, MA 02719 USA
Abstract
This paper presents a new corrosion detection system to identify, accurately measure and categorize corrosion on bearings. The new corrosion detection system uses machine vision technology hardware and computer software to identify and classify corrosion and accurately determine the percentage of affected surface area on test specimens. This new methodology reduces human error, improves accuracy and increases repeatability of consecutive measurements relative to the traditional visual evaluation of corrosion.
At present, there are several test methods that use bearings to determine the corrosion prevention properties of lubricating greases. They include the EMCOR method (ASTM D6138) and two other standard corrosion tests (ASTM D1743 and D5969). The downside of these methods is that they rely on subjective visual evaluation of corrosion and an approximate rating system.
This paper also presents results from a study to compare the new corrosion detection system with the subjective visual analysis technique. Lithium greases (NLGI grade 2) based on PAO (polyalphaolefin) base oil were tested according to D6138. Corrosion on bearing races was evaluated with both techniques by means of an experimental design (DOE). Statistical analysis of percent corroded surface area from the new system showed that there was a statistically significant difference between greases from two manufacturers. This important result was not obvious from visual ratings. Actual corrosion percentages provide finer resolution than traditional visual analysis.
1 Introduction
Corrosion is defined as the deterioration and break down of metal due to chemical reactions with moisture, salts and other materials. Left unprotected, machine components can suffer severe damage from corrosion of their surfaces. Mild steel alloys such as 100Cr6 and AISI 52100, used commonly in rolling element bearings, are vulnerable to corrosion. Since bearings are exposed to water in many applications, many specifications require greases to protect steel from corrosion.
1.1 Current Corrosion Tests
Several test methods are used widely for measuring corrosion prevention properties of lubricating greases in rolling element bearings [1-6]. These include ASTM D1743 [3], ASTM D5969 [1,4] and the EMCOR test, ASTM D6138 [2]. A good comparison of the history of these test methods can be found in the paper by Kaperick, Aguilar, and Lennon [6].
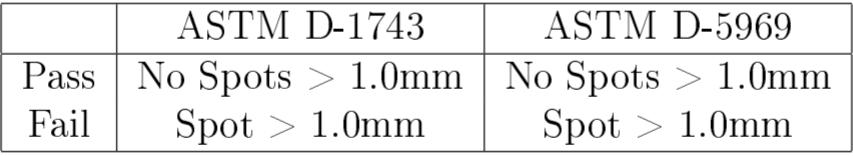
ASTM D1743, “Standard Test Method for Determining Corrosion Preventive Properties of Lubricating Greases”, evaluates the ability of grease to protect bearings stored under wet conditions. A tapered roller bearing is immersed in distilled water for 48 hours at 52⁰C. ASTM D5969 is similar to D1743, although bearings are immersed for only 24 hours in various concentrations of salt water. At the end of these two tests, the bearings are disassembled and evaluated on a pass-fail basis (Table 1). For a grease to pass either test, two out of three bearings must receive a pass rating (no corrosion spots greater than 1.0 mm diameter). D1743 and D5969 are static tests because the bearings are motionless during these procedures.
ASTM D6138 is a dynamic bearing corrosion test called “Standard Test Method for Determination of Corrosion-Preventive Properties of Lubricating Greases Under Dynamic Wet Conditions (EMCOR Test)”. In this test, double row self-aligning ball bearings (1306K/236725) are immersed partially in salt water or distilled water while they undergo a sequence of running and stopping during 168 hours. At the end of the test, the bearings are disassembled, and corrosion is evaluated on a scale of 0-5 (Figure 1).
Table 1: ASTM D1743 and D5969 Corrosion Test Criteria [1,3]
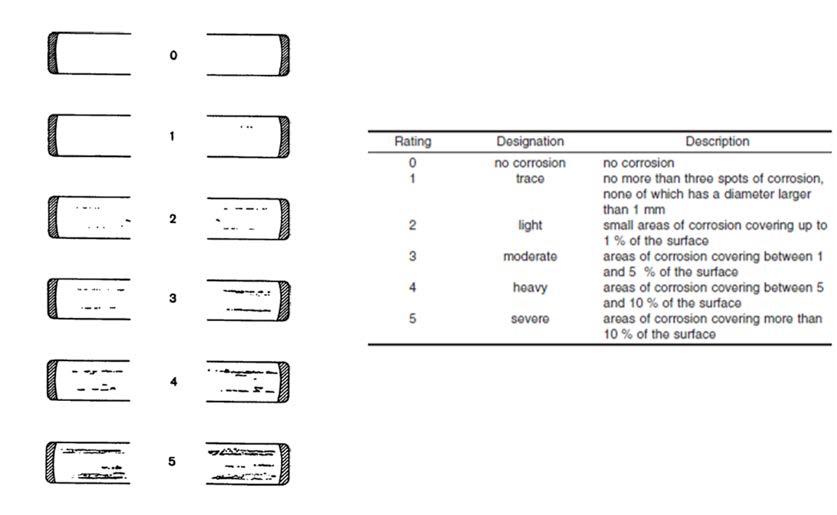
Figure 1: ASTM D6138 (EMCOR) Corrosion Test Scale [2]
1.2 Limitations
The static and dynamic ASTM bearing corrosion tests give an indication of the efficacy of a lubricating grease to protect metal surfaces from corrosion. However, those methods are subjective because they rely on the eyesight and judgement of the person performing the test. The reproducibility of results from EMCOR tests run in salt water is two grades [2]. This means that one laboratory may report no corrosion (rating 0) while another laboratory may report up to 1% of surface area corrosion (rating 2, light corrosion) for the same grease and standard test method.
The limited reproducibility is due partly to the subjectivity and human error that reside in the grading process. If observations of corrosion are more accurate and precise, then it becomes possible to use a rating scale with finer resolution. These points motivated this project to develop a corrosion detection system that utilizes a computational method to determine and analyze corrosion on bearings.
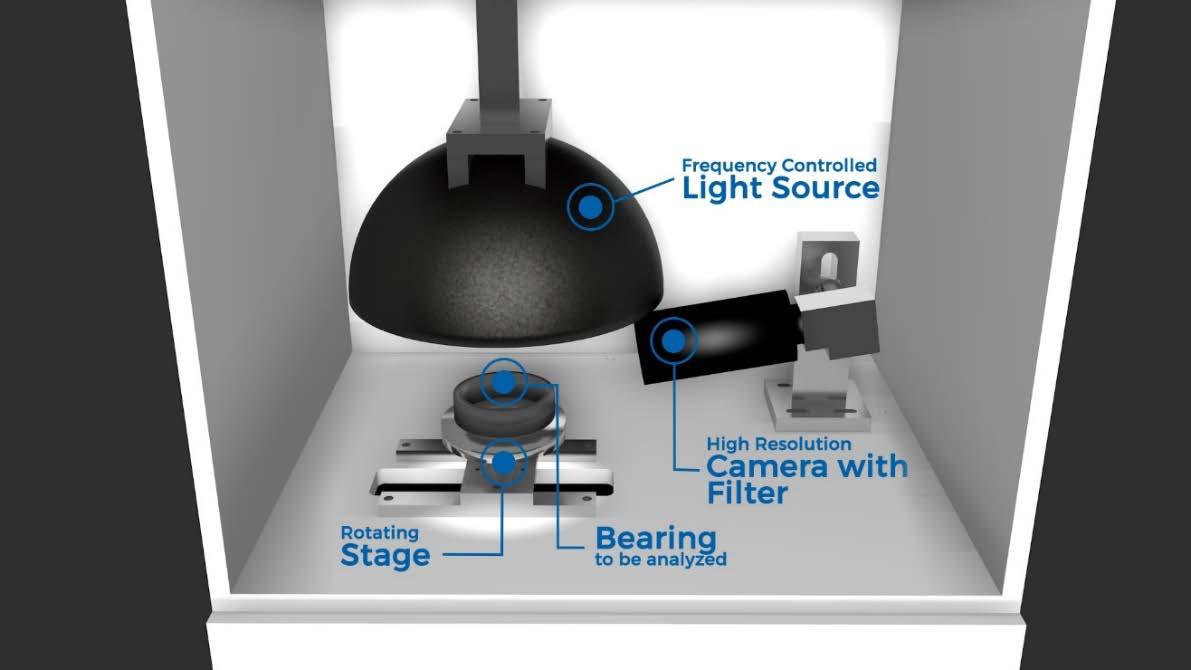
1.1 Corrosion Detection System The new corrosion detection system consists of a light source, a camera and computer analysis software (Figure 2). The custom analysis software system was developed in house. It calculates the actual percentage of surface corrosion on a bearing race after a corrosion test.
The corrosion detection system utilizes a frequency-controlled light source calibrated to a proprietary frequency to illuminate a bearing race. Light reflected from the bearing race is filtered with a polarizing filter before it reaches a high-resolution camera (patent pending). This hardware was designed specifically to reduce noise and other unwanted effects, and to allow stronger discrimination of corrosion (edge detection). The camera creates digital images of bearing surfaces. The entire system is contained in a blacked-out sealed box (to control the amount of light samples are exposed to) and placed on an anti-vibration table.
Proprietary software (a series of computational algorithms) is used to analyze images of the bearing surface (Appendix). This software was written in an embedded language with various elements in C++ and LabVIEW (National Instruments).
The new corrosion detection system was designed to match the accuracy of the human eye for direct comparison with ASTM corrosion tests. The accuracy of human vision, also known as visual acuity, was calculated [7] and found to be 30 μm. It is vital to understand human visual acuity as magnification devices cannot be used with the ASTM methods discussed above. Differences in visual acuity of individuals can affect corrosion test results.
For the statistical analysis and DOE calculations in this study, Minitab 17 (Minitab, Inc.) was used.
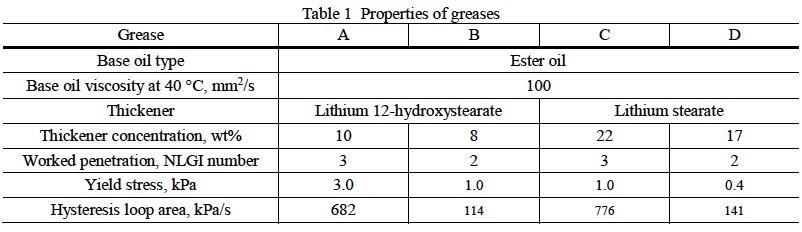
1.2 Lubricating Grease The lubricating grease used in this study satisfied MIL-PRF-32014, “Performance Specification: Grease, Aircraft and Instrument” [5]. This grease is formulated from lithium soap thickener and polyalphaolefin base oil. It is used as an aircraft grease for bearings, gears, and other mechanisms. As this is a military specified lubricant, there are multiple suppliers. This study compared products from two different suppliers. The typical physical properties of MIL-PRF-32014 greases are listed below (Table 2).
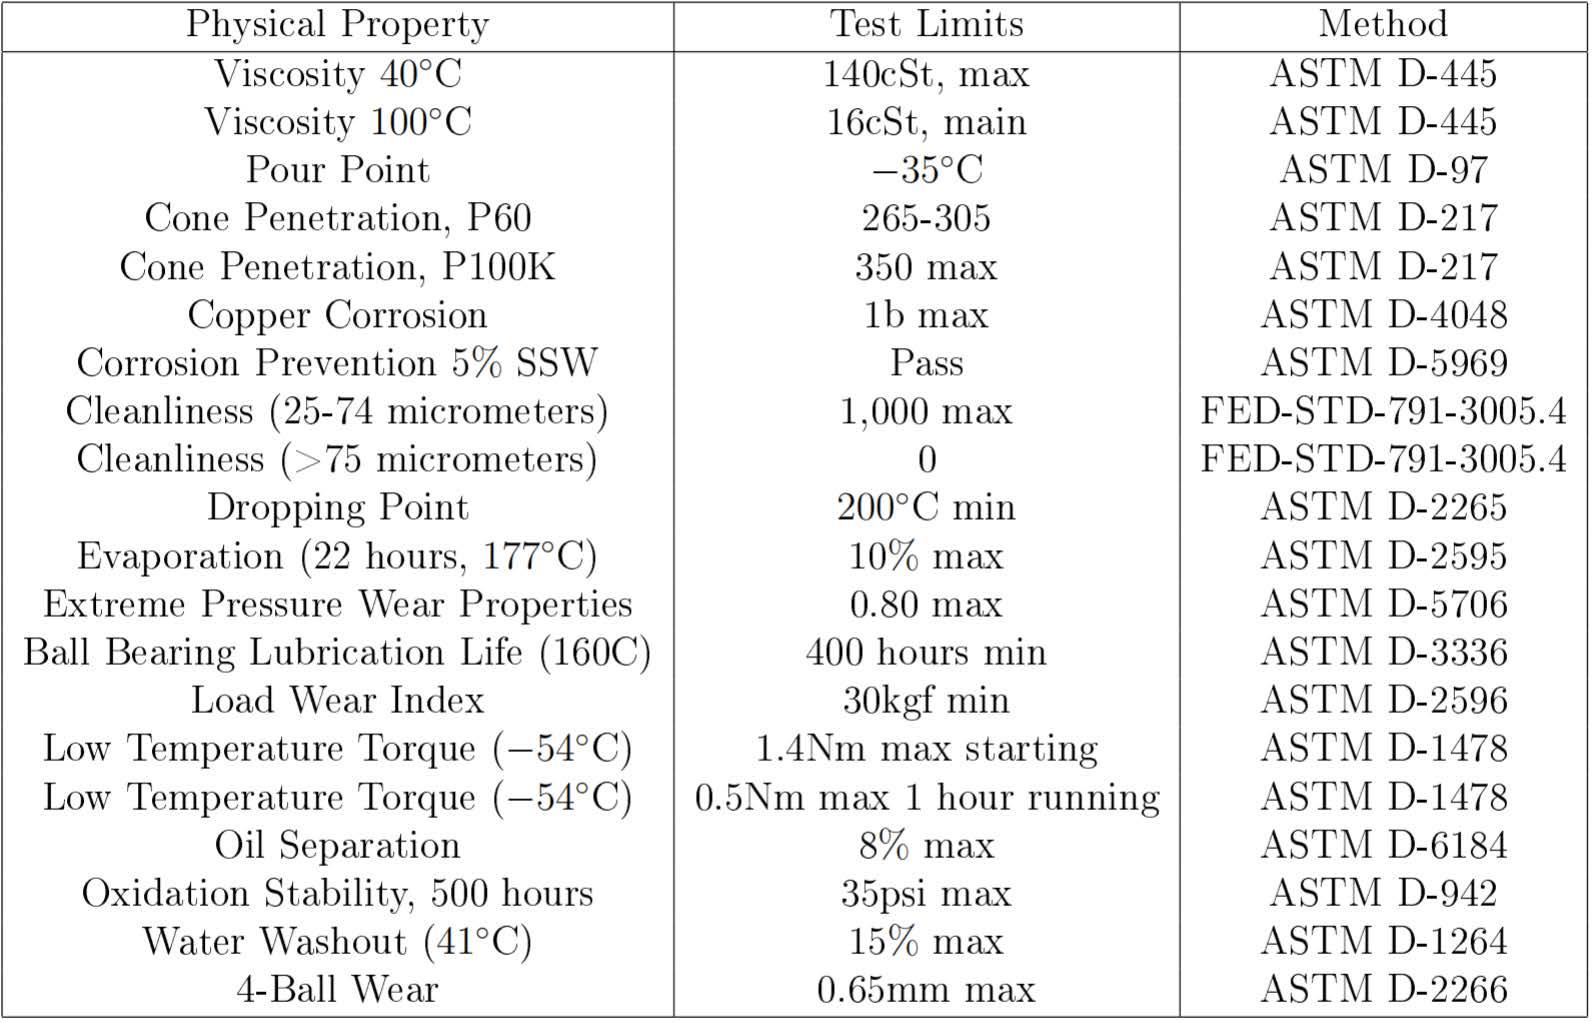
Table 2: MIL-PRF-32014 Grease Physical Properties [5]
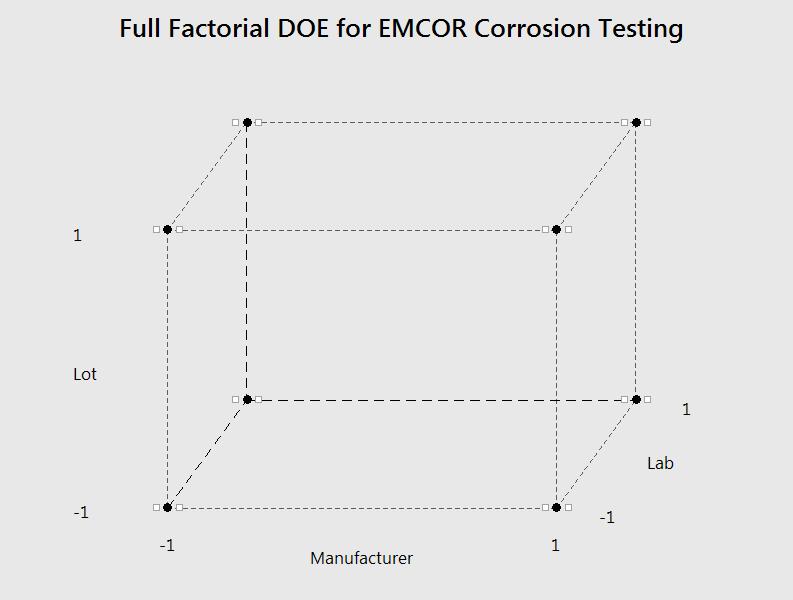
1.3 Experimental Design A three-factor, two-level full factorial DOE was created to evaluate the new corrosion detection system in a test of variability between two manufacturers of MIL-PRF-32014 grease, two lots from each manufacturer, and test results from two independent labs (Table 3). The corrosion preventive properties of the lubricants were evaluated for bearings tested in a solution of 3% synthetic sea water per the ASTM method. Tests were run in accordance with ASTM D6138 (EMCOR).
The goals of this study were: 1. Determine the repeatability of results from the new corrosion detection system. 2. Compare the results and statistical spread of the results for percent corroded surface area measured with the new corrosion detection system versus the standard visual EMCOR corrosion ratings. 3. Investigate three factors (supplier, lot, test lab) that may have a statistically significant effect on the corrosion of bearings lubricated with MIL-PRF-32014 grease.
Figure 3: Full Factorial DOE Design
2 Results
2.1 Visual Versus Computational Methods Thirty-two bearings were tested, disassembled and evaluated with the standard visual rating system as well as the new corrosion detection system (Table 3). There were two replicates for each of 16 cases.
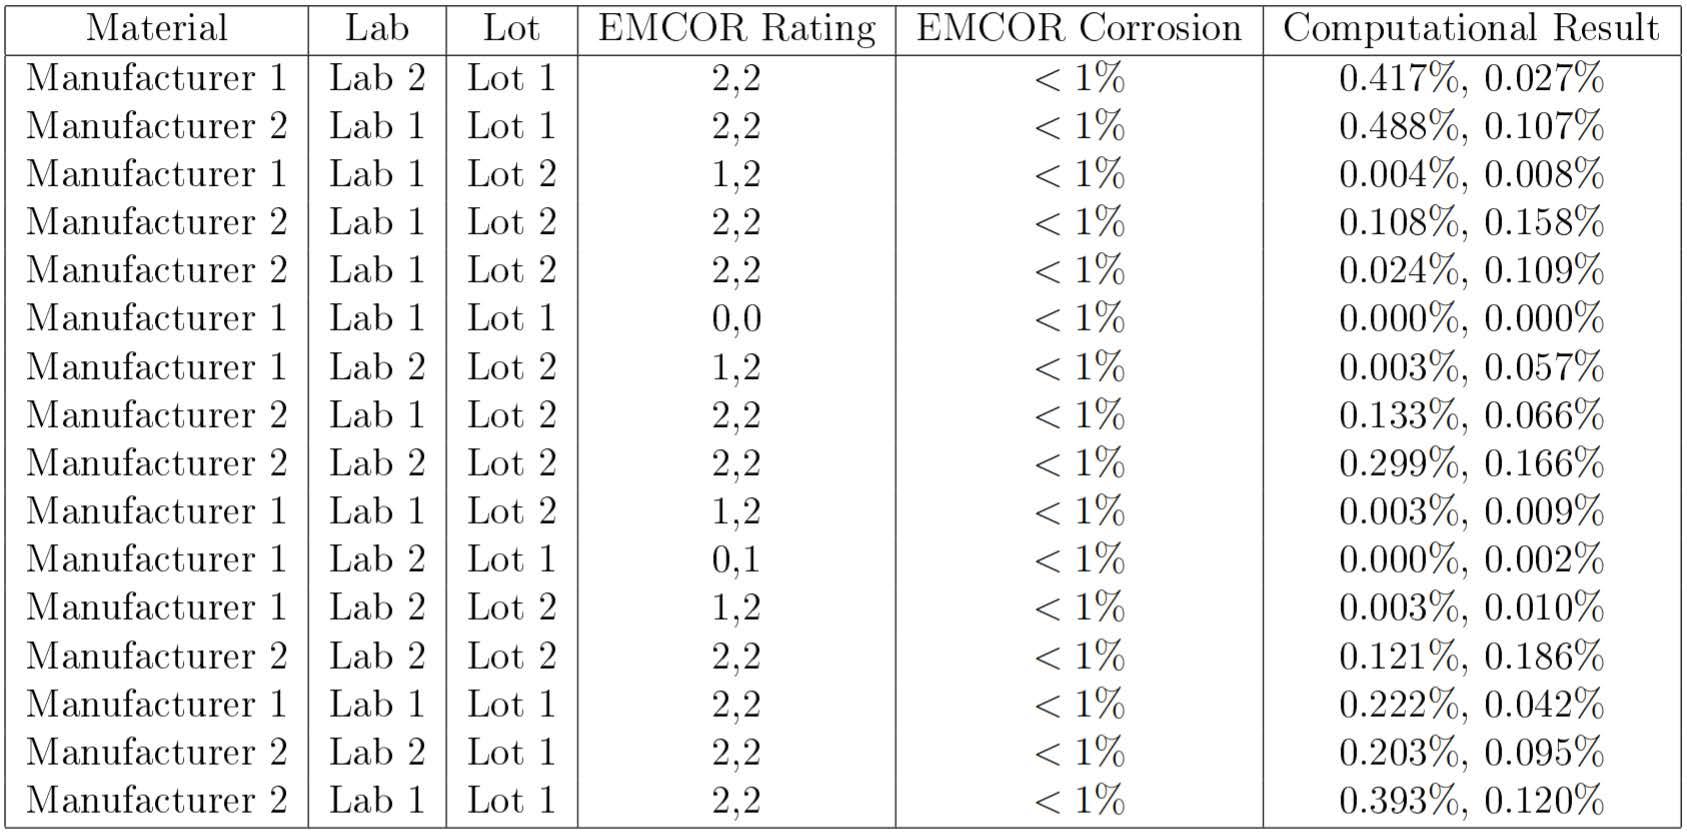
Table 3: Corrosion test results from standard visual evaluation and the new computational corrosion detection system
Every bearing had less than 1% corrosion using the standard EMCOR rating system. However, their categories ranged from 0 to 2, with the majority of these bearings category 2.
Results from the new corrosion detection system were all less than 0.5% corrosion of the total surface area of each bearing. All of these results were plotted in a histogram, and a normal statistical distribution was fitted over it (Figure 4). Most of the results fell within the normal distribution, and only three samples fell outside the +/-3σ level or more than three standard deviations from the average.
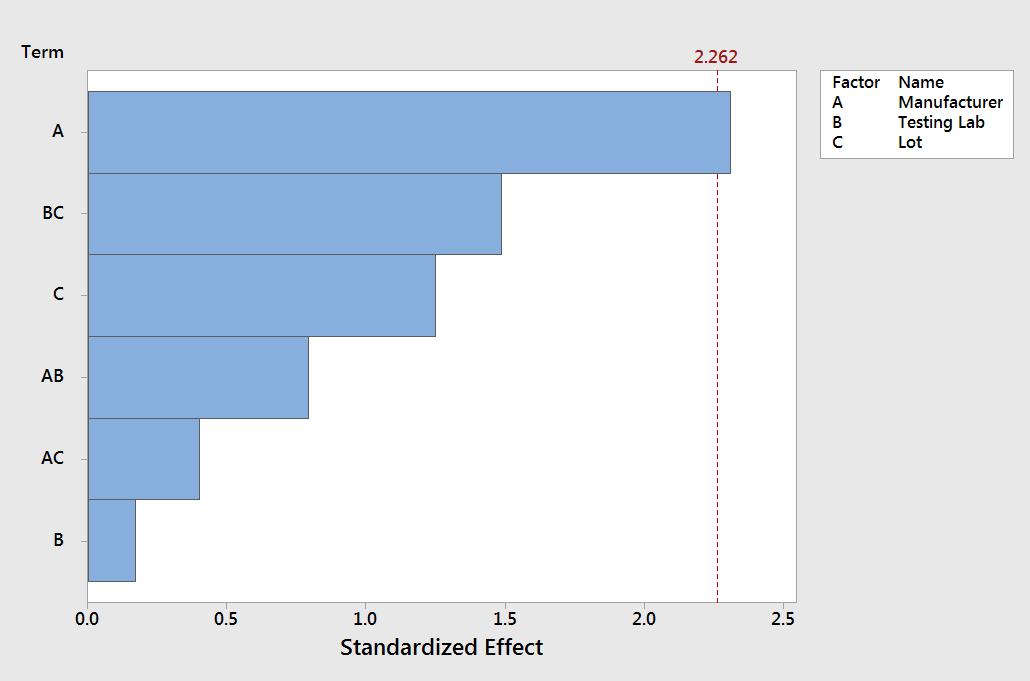
The results from the full factorial DOE were analyzed using Minitab software. The standardized effects of the factors were plotted on a Pareto Chart (Figure 5). Only one factor had a statistically significant effect on the percent corroded surface area: the manufacturer of the grease. The choice of independent test lab and grease lot did not have a statistically significant correlation with percent corrosion and can be ignored as variance factors in this analysis.
While both manufacturers of MIL-PRF-32014 grease claimed that their products met the specifications, the new corrosion detection system found a statistically measurable difference between the two, possibly due to a difference in the additive formulations for the MIL-PRF-32014 greases, processing methods, etc.
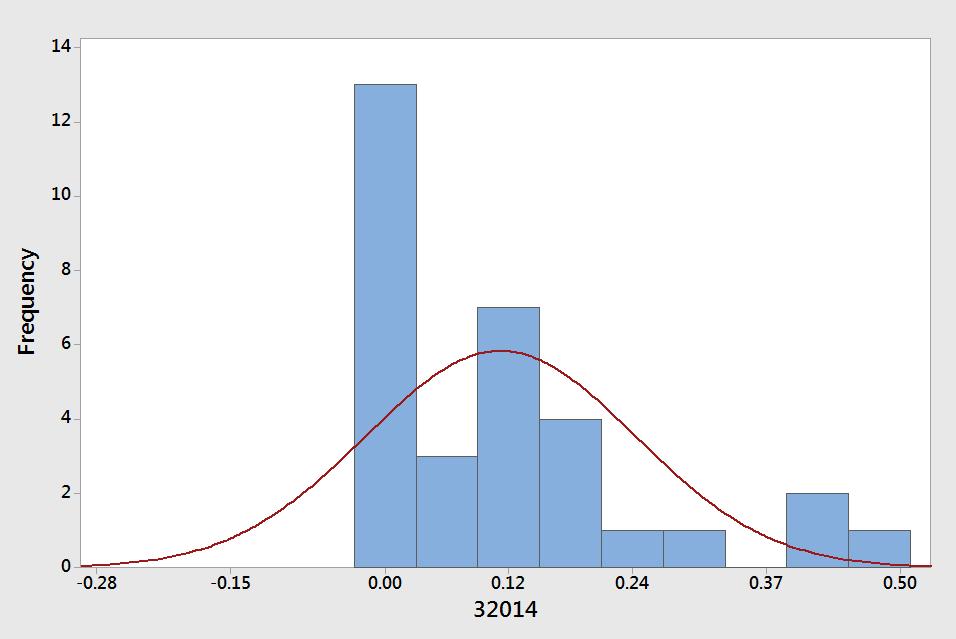
Figure 4: Histogram of MIL-PRF-32014 Samples with Normal Distribution Curve
Figure 5: Pareto Chart of the DOE Standardized Effects of Factors on Percent Corrosion
A 2-sample t-test was performed to take a closer look at the distribution of data (Figure 6) for greases from the two manufacturers. From this plot, it is apparent that the average surface corrosion differs significantly. There is almost no overlap of the 95% confidence intervals for the two means. This confirms that greases from these two suppliers are significantly different with respect to corrosion protection.
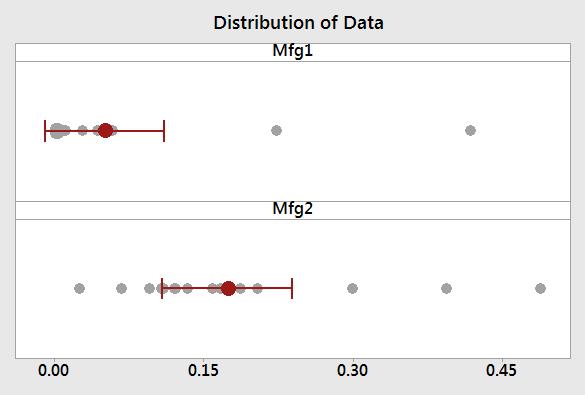
Figure 6: Distribution of Results (Percent Corrosion) by Grease Manufacturer
2.2 Additional Materials Tested
To further illustrate the capability of this new corrosion detection system, several perfluoropolyether (PFPE) greases were tested (Table 4). These PFPE greases did not perform well in the EMCOR test, and all of the bearings received a visual rating of 3 (1 – 5% corroded surface area). The computational results for the three PFPE grease ranged from 1.12 to 4.42% corroded surface area. This higher precision of the results from the new corrosion detection system illustrates the value of this computational method.
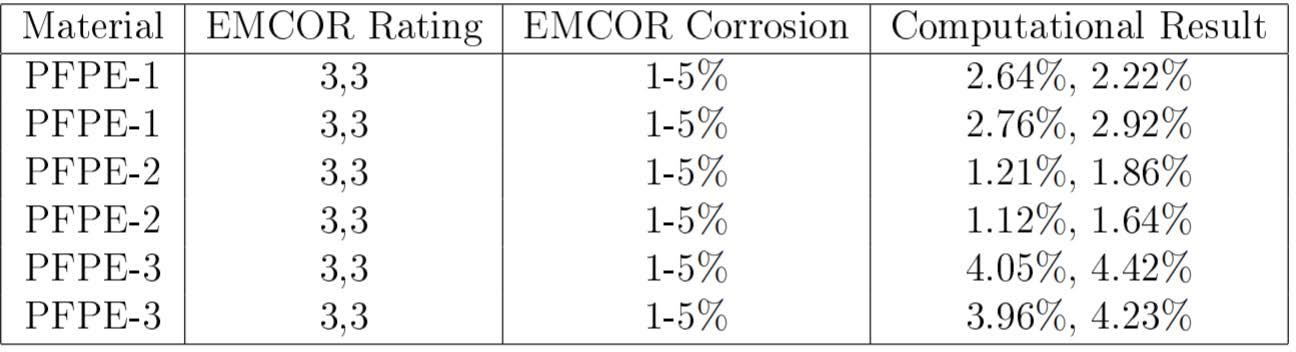
Table 4: PFPE EMCOR Corrosion Results
3 Conclusions
This research illustrated the use and value of a corrosion detection system for measuring corrosion on bearing races. Statistical analysis and surrogate modeling through a designed experiment showed that this computational approach is sensitive enough to detect subtle differences in the formulation or manufacturing process of MIL-PRF-32014 grease. There was good repeatability of results for bearings that were tested multiple times and by different operators.
A wide range of percent corrosion was observed within a specific rating category as currently used in the ASTM D6138 EMCOR method. With the new corrosion detection system, it is feasible to accurately measure percent surface corrosion, which will allow specifications to be written with more specific requirements and research and development to be carried out with a higher level of accuracy.
This new corrosion detection system is accurate enough to detect small but statistically significant differences between two manufacturers of MIL-PRF-32014 grease. This presents the opportunity to use this testing methodology for more accurate screening experiments and differentiation of materials.
The bearing corrosion tests outlined in the ASTM D1743, D5969, and D6138 are excellent. This research shows an opportunity to improve these tests by using more accurate technology to measure surface corrosion on bearings instead of subjective human visual evaluation.
4 Acknowledgements
I would like to thank my colleagues in the Application Development and Validation Testing (ADVT) Lab at Nye Lubricants Inc. who conducted the EMCOR testing, specifically Mason Wood and Kevin McBarron. I would also like to thank Brendan Smith and Richard Bellizzi, also from Nye Lubricants, for their support with the development of the Corrosion Analysis system.
Appendix
The visual acuity of the average sighted person is 1/60of a degree, also known as 1 minuteof arc. Using the trigonometric sketch of the human eye in Figure 7, the smallest size visiblein microns can be calculated as shown below.
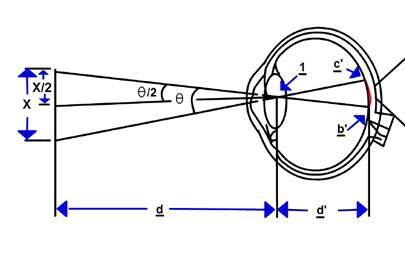
Figure 7: Trigonometric Sketch of the Human Eye
First we start with the basic trigonometric formula with d being the viewing distance
Where α represents the visual acuity expressed in radians.
Under the assumptions that the closest object an adult can focus on is approximately at 100 mm and the average acuity is 1 minute of arc, this would mean that the smallest visiblesize would be around 30 microns [7].
Using this calculated value as the minimum size for detection on the bearing race, anything smaller would be ignored for rating but used in the calculation of overall surface corrosion. In order for the computational bearing analyzer to handle the shape of the bearing race, the field of view (FOV) of the lens and the area of the race were used to determine how many images to take without getting any fringe effects from the curvature of the race. After the computational bearing analyzer takes a series of high resolution images, software stitches them together to form one single image. This stitched image now goes through a series of calculations called edge detection. The purpose of applying an edge detection algorithm is to find the transition areas on the bearing surface or to identify one object from another [8]. The process of edge detection is used to find the boundaries of an image where there is significant change in gray-level intensity. In this case, software finds the edges where the bearing surface transitions from clean metal to an area of corrosion. The edge detection on this surface requires the gradient and magnitude to be calculated. In order to determine the gradient of the surface, we need to measure the first derivative which will give us the positive or negative spike at the boundary point. As the image of the bearing surface is a two-dimensional discretized gray-level function ��(��,��), the gradient (magnitude) of this function ∇��isgivenbythefollowingequation.
The gradient direction is given as an angle measured by
where φ is the angle with respect to the y-axis. The gradient can then be approximated to the following equation for simpler computation.
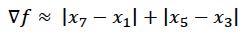
The function for these bearing surfaces is a discrete function and the derivatives can be approximated by difference equations. These derivatives are calculated using masks where the term is the difference in the x-direction and is the difference in the y-direction. From this, the difference between pixels in the rows and columns of a mask can be found. Using an example of a 3 X 3 mask of pixel values (Figure 8), the approximate gradient can be calculated using x5 and x3 to get the derivative in the x-direction and x7 and x1 for the derivative in the y-direction.
Figure 8: 3 X 3 Mask of Pixels
Which produces a gradient of
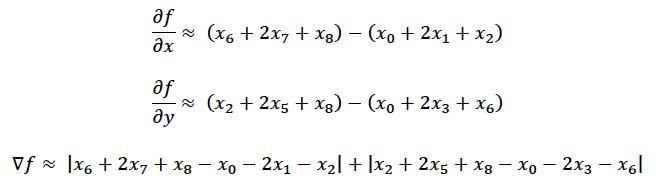
There are many different types of edge detection algorithms like Prewitt, Sobel, and Laplace operators. Some of the algorithms will increase noise as they are first-order derivative-based operators, while second-order derivative-based operators will typically reduce noise and smooth out the edges. Using the Sobel operator as an example of an edge detection operator will balance the ease of using a first derivative computation and also provide a smoothing action on the edge detection [9]. This will allow the gradient ∇�� and gradient direction φ to be calculated easily and provide a smoothed response on the edge detection with this operator.
After the edge detection operator is applied to the entire image, the image is transformed based on the areas that are not within the acceptable gray scale. (The acceptable gray scale was determined through the measurement of a very large sample of pristine surfaces for bearings that had been cleaned recently and dissembled, but not exposed to a corrosive material. The results were used to construct a histogram of the distribution of normal gray scale intensities for clean metal surfaces without corrosion.) After this transformation, the corroded surface area is calculated, and the percentage of corroded surface area is reported.
References
[1] ASTM. Standard test method for determining corrosion-preventive properties of lubricating greases in presence of dilute synthetic sea water environments. ASTM D5969-11, D5969(11):1-15, 2011. [2] ASTM. Standard test method for determination of corrosion-preventive properties of lubricating greases under dynamic wet conditions (EMCOR test). ASTM D6138-13, D6138(13):1-15, 2013. [3] ASTM. Standard test method for determining corrosion-preventive properties of lubricating greases. ASTM D1743-13, D1743(13):1-15, 2013. [4] Samil Beret. The development of ASTM D5969: The standard test method for corrosion preventive properties of lubricating greases in the presence of dilute synthetic sea water. The NLGI Spokesman, 61(4):16-23, 1997. [5] Lois Gschwender, Carl E Snyder Jr, Shashi K Sharma, and George W Fultz. Multipurpose, moisture-resistant, high load carrying polyalphaolefin based grease, MIL-PRF-32014. Tribology Transactions, 46(2):217-222, 2003. [6] Gaston Aguilar, Joseph Kaperick, and Michael Lennon. Rust never sleeps: An investigation of corrosion in grease lubrication. The NLGI Spokesman, 79(6):815, 2016.
[7] Michael Kalloniatis and Charles Luu. Visual acuity by Michael Kalloniatis and Charles Luu. Webvision. The Organization of the Retina and Visual System, 5, 2007.
[8] Raman Maini and Himanshu Aggarwal. Study and comparison of various image edge detection techniques. International Journal of Image Processing (IJIP), 3(1):1-11, 2009. [9] Rebeca O. Vincent and Olusegun Folorunso. A descriptive algorithm for Sobel image edge detection. Proceedings of Informing Science & IT Education Conference (InSITE), 40:97-107, 2009. [10] Ernst D. Dickmanns. The development of machine vision for road vehicles in the last decade. Intelligent Vehicle Symposium, 2002. IEEE. Vol. 1, 2002.

Following the positive reception to last year’s new interactive format. We are proud to bring you the
– ’ – – delegates to “lean in” and have in

In Memoriam
May 5, 1927- August 2, 2018
Edward J. Palecki, 91, originally from Pittsburgh, Pennsylvania, passed away on August 2, 2018. Ed resided at Casey’s Pond Senior Living Community in Steamboat Springs, Colorado. He is survived by his sister, Helyne McMullen, who lives at Casey’s Pond, and by 4 daughters and 2 sons: Ann Fierstos (Ed) of Hendersonville, North Carolina; Michael Palecki (Emma) of Tallahassee, Florida; Jean Ray (Jim Chubrilo) of Steamboat Springs, Colorado; Paul Palecki (Susan) of Royse City, Texas; Mary Palecki of Littleton, Colorado; and, Carol Palecki of Oakland, California. He is also survived by 10 grandchildren and 3 great-grandchildren. He is preceded in death by his son, Thomas Palecki and his beloved wife of 60 years, June Palecki.
Ed was born on May 5, 1927 in Pittsburgh, Pennsylvania. He graduated from St. Francis de Sales High School in McKees Rocks, Pennsylvania, where he began dating his future wife, June. He earned his Bachelor’s Degree at Duquesne University in Pittsburgh, Pennsylvania and pursued post-graduate studies later in life in Kansas City, Missouri. Ed served in the Navy on the USS Oglethorpe in the South Pacific during the conclusion and aftermath of WW II.
Ed worked with Trans World Airlines in various management capacities for 34 years. While employed with TWA, he moved his family from Pittsburgh to Baltimore, Maryland, to Freeport, New York, and finally to Kansas City, Missouri. After a short retirement, Ed became General Manager of the National Lubricating Grease Institute in Kansas City, where he worked for an additional six years Ed loved to travel and circumnavigated the globe numerous times, often with his wife, June, and his sons and daughters. He visited family and hosted family reunions overseas in Greece, India, Japan, Peru, and Lithuania, the birthplace of his beloved parents, Adolph and Anna. He was an excellent photographer and won several awards for his work. He especially enjoyed sailing his small boat on Weatherby Lake near the family’s home in Kansas City. Ed was passionate about music, literature, nature and outdoor adventures with his family. He had an enthusiastic spirit and described the afterlife as “the next great adventure”.
Above all, Ed was a wonderful father to his large and loving family and a devoted husband to June. He lived a full life and will always be remembered as a good, honest and kind man with a warm and wonderful smile. He will be greatly missed by his family and all those who had an opportunity to know him.
A funeral mass will be held in the chapel at Holy Name Catholic Church, 524 Oak Street, Steamboat Springs, Colorado on Monday, August 13 at 3:00 PM. A reception will be held afterwards at 4:30 PM at Casey’s Pond.
His ashes will be placed with those of his wife, June and son, Tom at Resurrection Cemetery in Kansas City, Missouri, at a later date. At the family’s request, in lieu of flowers, donations may be made to the Casey’s Pond Employee Appreciation Fund, Casey’s Pond Senior Living, 2855 Owl Hoot Trail, Steamboat Springs, CO 80487.