22 minute read
Lubricating Behavior of a Superior PTFE Powder in Lithium Grease


Mary Moon, PhD, MBA
Consultant to Shamrock Technologies, Inc., Newark, NJ 07114 USA
Abstract
Anti-friction and anti-wear effects of polytetrafluoroethylene (PTFE) additives in lubricating greases depend on characteristics of specific grades of PTFE powders. In a recent study, seven experimental PTFE powders were formulated and milled to prepare models of simple lithium greases. One of seven grades of PTFE gave superior performance in four-ball tests where loads up to 1 765 N (180 kgf) were applied gradually to decrease run-in effects. This grease is a good starting point for formulations with benefits from PTFE. [1-3]
The present paper analyzes friction data from these experiments with simple statistics. At low applied loads (< 500-700 N or 50-70 kgf), statistics are similar for polyalphaolefin (PAO) base oil and lithium and PTFE-lithium greases. At higher loads, there are abrupt changes or spikes in friction. For PAO and some PTFElithium greases, these friction spikes are associated with lubrication failure and adhesive wear, which trigger significant increases in friction, temperature and wear scar diameter. A superior grade of PTFE provides antifriction and anti-wear protection against failure and adhesive wear in these tests, however. Analysis of friction data and wear scars indicates that this superior PTFE may be entrained in contacts (and/or at their inlets), compressed and have a resilient protective effect. Results from the literature in support of this mechanism are discussed.
Introduction
Previous papers discussed the use of polytetrafluoroethylene (PTFE) as an anti-friction and anti-wear additive, grease formulation guidelines, and a modified four-ball test for friction and wear. Greases were prepared from PTFE, lithium thickener and PAO base oil. Standard four-ball friction and wear tests were performed to evaluate the performance of seven grades of PTFE in greases. However, run-in effects interfered with this comparison. A standard test procedure was modified by gradually applying the load in a ramp. This modification significantly reduced run-in effects. Fourball tests with load ramps were used to measure friction, temperature and wear scars for PTFE-lithium greases, control grease (no PTFE) and base oil. [1-3]
In lithium grease, one grade of PTFE was superior to the other six grades. As the applied load was increased, abrasive wear was observed at low loads until adhesive wear occurred for base oil, control grease, and six of seven PTFE-lithium greases. Adhesive wear released heat, softened or melted contact surfaces, and significantly increased wear scar diameters. For the seventh grade of PTFE, adhesive wear did not occur as the load was increased to 1 765 N (180 kgf), the limit of the test machine. As a result, friction and temperature were lower and wear scars were smaller, than for other cases where adhesive wear occurred. This superior model PTFE-lithium grease is a good starting point for formulation studies. It could be enhanced with other additives such as anti-oxidants. [1-3]
The present paper addresses several intriguing questions associated with lubricating behavior of this superior grade of PTFE. Are results for this PTFE powder anomalous, or are they reasonable in the context of results for other greases and PAO base oil? What are some similarities and differences for lubrication with PAO base oil, control lithium grease and PTFE greases? Is there a possible explanation for effects of superior PTFE on lubrication? Do results from the literature support these findings?
Background about PTFE
Polytetrafluoroethylene or PTFE is a synthetic fluoropolymer of tetrafluoroethylene (-CF2- CF2-)n that resembles ethylene (-CH2-CH2-)n but with fluorine instead of hydrogen atoms. High molecular weight PTFE is a thermoplastic solid that can be ground into powders and dispersed in oil or water. The surface of PTFE is extremely slippery with coefficients of friction, COF, between 0.04 (sliding friction) and 0.1 (ASTM D1894). Other useful properties include resistance to chemicals, solvents and temperature extremes (highs and lows). [4]
However, effects of PTFE powders depend upon their dispersion in lubes and greases, particle size and shape and surface polarity as well as test conditions (geometry of the contact, roll-to-slide ratio, speed, load, viscosity, etc.) [5-7]
Grease Formulation Strategy
Thus, it makes sense to first compare grades of PTFE in simple model formulations to identify the PTFE powder with the best inherent properties as a lube additive. Formulating grease from only PTFE, thickener and base oil avoids possible interference from interactions between other lubricant additives and PTFE, grease fibers and contact surfaces. The best grade of PTFE can be developed, and greases can be formulated with it. For PTFE, this approach can be more efficient than trial-and-error using more complex formulations.
Seven experimental grades of PTFE were compared in simple model greases made ‘from scratch’. Greases were prepared by mixing and heating 4 wt.% PTFE and 8 wt.% preformed lithium 12-hydroxy stearate (Li12OHSt) thickener powder in PAO base oil (25-35 cSt at 40°C) until the soap melted, the mixture thickened, and the soap recrystallized. PTFE- Li12OHSt greases and Li12OHSt control grease (12 wt.% Li12OHSt in PAO) were off- white, smooth, buttery and NLGI grade 2. PTFE-Li12OHSt greases were slightly softer than Li12OHSt greases, and storage stability was similar for all greases. [2]
Each batch was milled with a pilotscale high-pressure homogenizer, which provided a consistent method for forming grease fibers similar to grease manufacturing. In this study, three PTFE powders were ‘sub-micron’ with average primary particle diameter < 1 μ, and four PTFE powders had average diameters > 1 μ. Milling ensured that grease fibers formed around well-dispersed PTFE particles. In the literature, electron micrographs show grease fibers (and gaps between fibers) from approximately 0.1 to 10 μ. [8] When nanoparticles (at least one dimension <0.1 μ) were mixed (not milled) in lithium grease, particles were not dispersed among grease fibers, Fig. 2 in [9].
Four-Ball Test Strategy
Greases were evaluated with a commercial four-ball wear machine and ASTM D2266 Standard Test Method for Wear Preventive Characteristics of Lubricating Grease in a laboratory maintained at 21-23°C. [10] Wear scars were measured and photographed with commercial light microscopes and cameras. [2] A test was stopped if welding occurred or friction approached the upper limit of the load cell (1 765 N or 180 kgf). [2]
When Li12OHSt and PTFELi12OHSt greases were tested with D2266, friction spiked at the start of each test and then fluctuated. [2] Wear during run-in could produce wear particles; these particles could entrain in contacts, cause three-body wear, create more particles, and affect test results. [11] Thus, a fourball procedure with smaller run-in effects was developed.
In practice, D2266 is applied to evaluate fully-formulated lubricants relative to specifications for qualification and quality control purposes. Grease is heated to 75°C and tested under an applied load of 392 N (40 kgf) at 20 Hz (1 200 rpm) for 60 min. However, the D2266 procedure was too severe for these simple model greases.
This procedure was modified by gradually applying the load in a ramp of increments of 29.4 N/ min (3 kgf/min) from 29 to 1 765 N (3 to 180 kgf). Grease was not pre-heated. Ramping up the load corresponded to progressing to the left on Stribeck’s curve in mixed and, possibly, boundary lubrication regimes. This is similar to progressive loading during breakin, which prolongs service life of machinery [12] and may enhance oil bleed from grease [13].
Modifying D2266 with a load ramp made it possible to evaluate these simple model greases.
This modified four-ball test provides an additional benefit: friction and temperature can be observed as the load is increased. In this study, friction and wear were measured at 2 s intervals (0.5 Hz) or 0.05 s intervals (20 Hz). Significant differences were observed in friction and temperature data for PAO, control grease and various PTFELi12OHSt greases.
Four-Ball Results
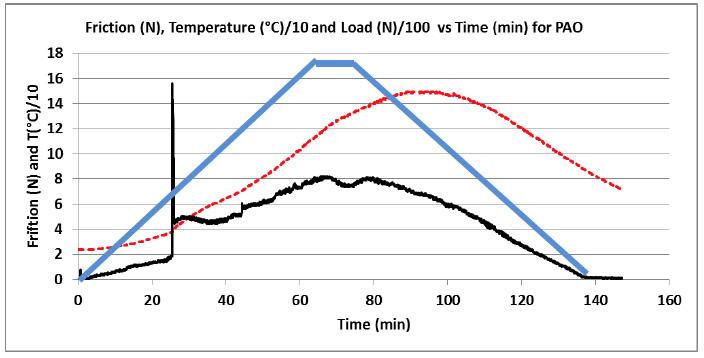
Experiments with this modified four-ball procedure differentiated between PTFE-Li12OH greases, Li12OHSt control grease and PAO base oil. Figure 1 shows data for PAO from a test where the applied load was ramped up from 29 to 1 765 N in increments of 29 N/min (from 3 to 180 kgf in increments of 3 kgf /min), maintained for
15 min, and ramped down. Friction and temperature initially increased steadily with applied load. [2] When the load was 753 N (75 kgf), friction spiked sharply for approximately 1 min. [2] Afterward, friction more than doubled (from 2 to 4 – 5 N) and temperature shifted higher by approximately 10°C, Fig. 2.
Failure was mechanical, not chemical (oxidation), and associated with adhesive wear. [2]
Adhesive wear released heat, softened or melted contact surfaces and increased wear scar diameters. [2] After the test, oil was black due to suspended wear particles (< 0.1 mm), and larger particles (0.1 - 1 mm) were visible in the bottom of the cup. [2]
The best PTFE-Li12OHSt grease was a significantly better lubricant than PAO. In Fig. 3, friction spiked at loads of 677 N (69 kgf, 23 min), 794 N (81 kgf, 27 min), several times above 1 030 N (105 kgf, 35 min) on the ‘up’ ramp and once on the ‘down’ ramp. Spikes were 1 min or less in duration. Lubrication failure and adhesive wear were not observed.
After friction spiked for the best PTFE-Li12OHSt grease, friction recovered almost entirely and temperature shifted slightly or not at all, Fig. 4. Maximum temperature (65°C) was less than half that observed for PAO (150°C) during similar tests, Fig. 1. Only slight discoloration of grease and few wear particles were observed after these tests. Although friction spiked, this grease prevented most of the damage and heat accumulation observed for PAO.
Friction data suggests that grease solids contributed to lubrication. At low loads, friction fluctuations resembled those for PAO, Fig. 2. After the first spike (23 min, 677 N, 69 kgf), friction fluctuations appeared more regular with larger amplitude and higher frequency.
These changes indicated a somewhat more resilient response to the load. An opposite pattern was observed on the ‘down’ load ramp. These observations suggested that grease solids entrained in contacts and respond to applied loads in a more resilient manner than metal surfaces. While asperity contacts or stress concentrations may initiate friction spikes, these entrained solids prevented development of adhesive wear.
Data from another experiment (below) are shown in Figs. 5 and 6. Friction data were comparable at low loads for PAO, Li12OHSt grease and this PTFE-Li12OHSt grease. Load and number, shape and effects (temperature, friction) of spikes were similar for PAO, Li12OHSt grease and this PTFE-Li12OHSt grease – but not the best PTFELi12OHSt grease.
The best PTFE-Li12OHSt grease was unique: friction spikes were more numerous and briefer in duration (narrower), and effects on friction and temperature were smaller than for Li12OHSt grease and other PTFE-Li12OHSt greases. However, data for the best PTFE- Li12OHSt grease were not anomalous; friction at low loads and onset of spikes at higher loads were comparable to those for PAO, control grease and other PTFE-Li12OHSt greases.
Thus, results for the best PTFE-Li12OHSt grease are associated with the specific PTFE powder used to formulate this grease. This superior grade of PTFE is submicron with average particle diameter < 1 μ. A statistical data analysis was performed to gain additional insight about effects of this superior grade of PTFE on grease lubrication.
Fig. 1 Friction (black) and temperature (red) data for PAO. The blue line represents the applied load (N)/100, which was ramped up from 30 to 1 765 N in increments of 29.4 N/min (from 3 to 180 kgf in increments of 3 kgf / min), maintained for 15 min, and ramped down.
Data were collected at intervals of 2 s (0.5 Hz).
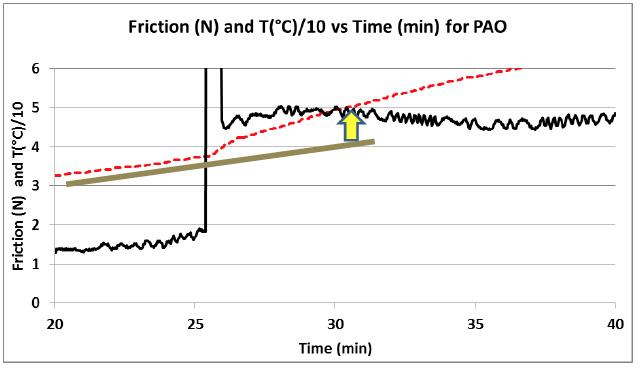
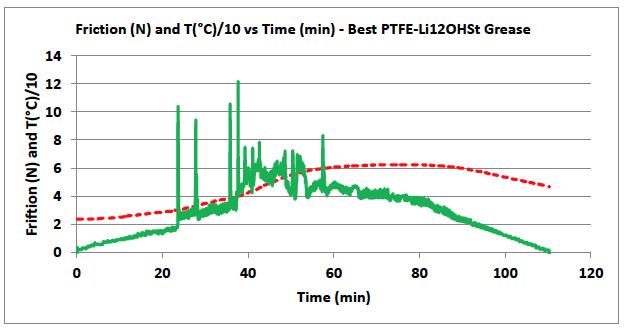
Fig. 2 Friction (black) and temperature (red) data for PAO, Fig. 1. After the friction spike, friction more than doubled and temperature shifted higher by approximately 10°C (arrow).
Fig. 3 Friction (green) and temperature (red) data for the best PTFE-Li12OHSt grease as the load was ramped up 0.3 to 1 471 N in increments of 0.3 N/min (from 3 to 150 kgf in increments of 3 kgf /min) and ramped down. The scale of the vertical axis is smaller than Fig. 1. Data were collected at intervals of 2 s (0.5 Hz).
Fig. 4 Friction (green) and temperature (red) data for the best PTFE-Li12OHSt grease from Fig. 3. The scale of this vertical axis of this figure is the same as Fig. 2 for PAO. Data were collected at intervals of 2 s (0.5 Hz).
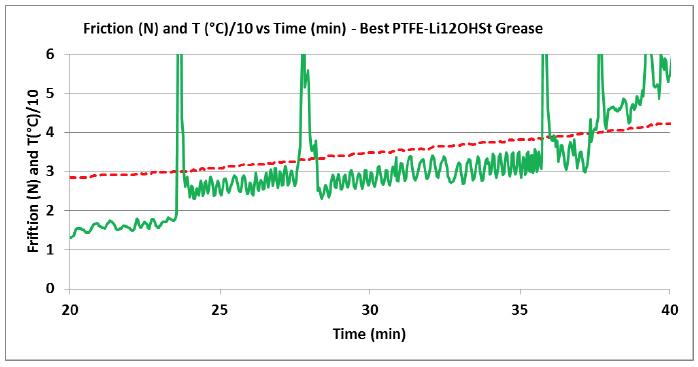
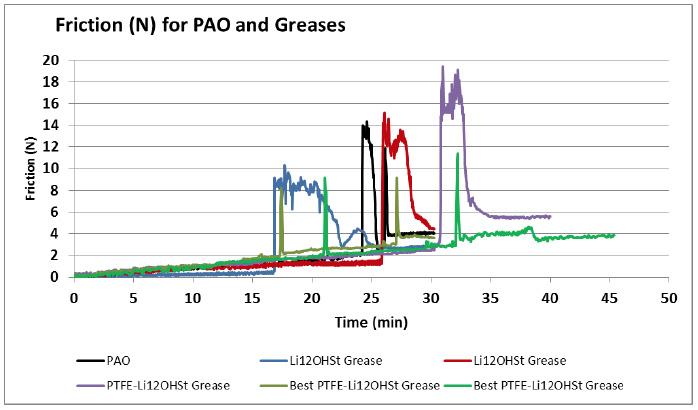
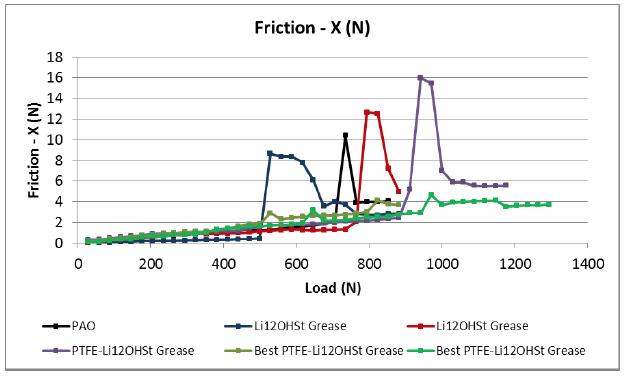
Fig. 5 Friction data (N) for PAO, Li12OHSt control grease and PTFE-Li12OHSt greases.
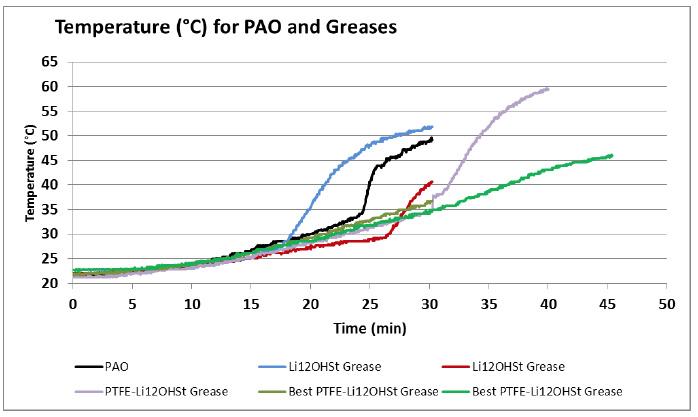
Fig. 6 Temperature data (°C) for PAO, Li12OHSt control grease and PTFE-Li12OHSt greases.
Statistical Analysis of Four-Ball Data
Friction and wear are statistical in nature; asperity size, wear, fatigue, grease and bearing lifetimes and so forth are described by distributions (statistical) and not fixed values. [13] Thus, it is reasonable to apply a statistical approach to examine friction data and characterize effects of PTFE powders on grease lubrication, Table 1. Statistics were calculated from 30 (or 1 200) data points collected during 1 minute at each load.
Table 1 Statistics calculated from friction data points (x1, x2, x3, …, xn) where n=30 or n=1 200. For random data points with a normal (bell-curve) distribution, |Skew| < 0.18 and |Kurt| < 0.69 when n=30, and |Skew| < 0.005 and |Kurt| < 0.020 when n= 1 200. [14] Distributions may be non-normal when sources of data are biased and/or auto-correlated (memory effects).
Statistics for PAO friction data (Fig. 1) are shown in Fig. 7. The mean (X) clearly shifts upward after the friction spike. The ratio of standard deviation to mean (s/X) decreases during run-in and formation of grooves in contacts. The ratio s/X decreases again when X increases after the friction spike. Skew and Kurt are larger than typical for random data (|Skew| < 0.18 and |Kurt| < 0.69 for n=30 data with a normal distribution or ‘bell curve’).
There is no obvious feature in data at low loads that precedes the friction spike at 753 N (75 kgf). However, number of data points at each load (30), frequency of data collection (0.5 Hz), number of contacts (3) and load cell sensitivity may limit these particular results.
Friction statistics for the best PTFE-Li12OHSt grease (Fig. 3) are compared with PAO in Fig. 8. This PAO test was stopped before adhesive wear occurred; wear scars showed abrasive wear. [2] For the best grease, X was very similar to PAO below 650 N (66 kgf), i.e., abrasive wear. At higher loads, X shifted due to friction spikes unrelated to adhesive wear (Fig. 1) and possibly because grease solids were entrained and compressed.
The ratio s/X reflected larger fluctuations in friction for the best grease than PAO as in Fig. 4. As the load was increased above 300 N, s/X tended to increase for grease but not PAO. These results suggest that additional solids are entrained and compressed as the load was increased.
Skew and Kurt for this grease varied less than for than PAO. Entrained solids (and fewer wear particles) possibly resulted in more stable lubrication and friction for grease than PAO.
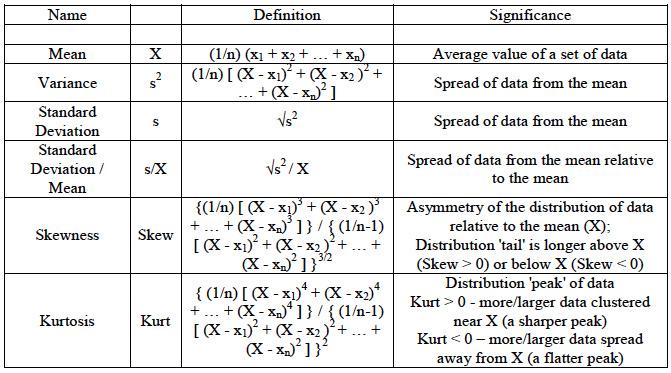
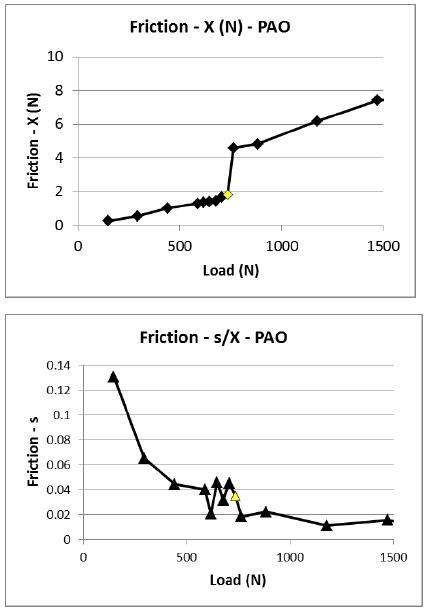
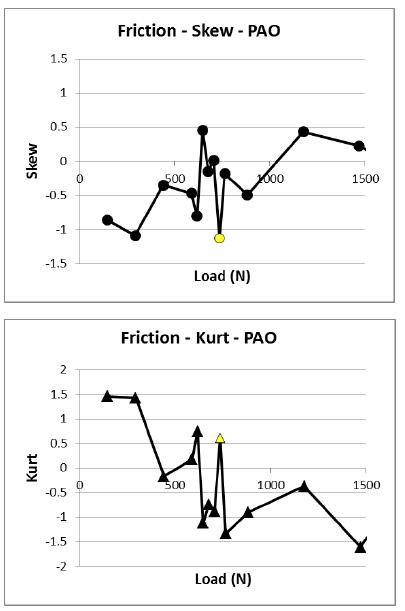
Fig. 7 Statistics calculated from friction data for PAO (Figs. 1 and 2). Friction spiked when the load was 753 N (75 kgf), yellow fill.
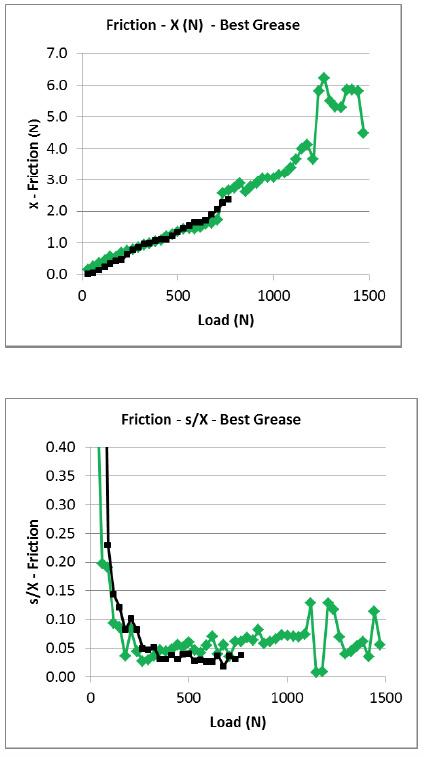
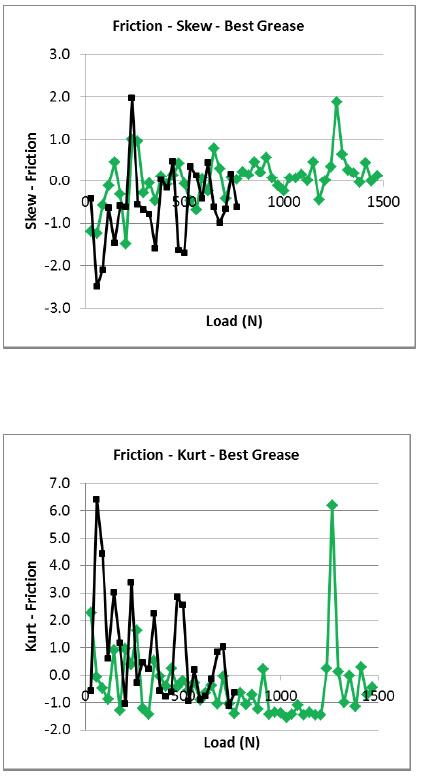
Fig. 8 Statistics calculated from friction data for the best PTFE-Li12OHSt grease (Figs. 3 and 4), green. Statistics from another PAO test (data not shown), which was stopped before adhesive wear occurred, are shown in black. [2]
Figure 9 compares X calculated from friction data for several greases and PAO (Fig. 5 and below). At loads below 500 N (51 kgf), X was similar for greases and PAO. At higher loads, friction spikes were brief in duration and had small effects on X for the best PTFE-Li12OHSt grease (Fig. 5). Instead of failure, lubrication recovered after friction spikes, which was consistent with entrainment and compression of grease solids instead of adhesive wear.
For a more in-depth analysis of lubrication behavior, the load was increased in increments of 0.3 N/min until lubrication failed and then maintained. Data were measured before, during and after lubrication failure. At each load, 1 200 data points were collected at intervals of 0.05 s, equal to the frequency of rotation of one bearing on three fixed bearings (20 Hz). Each data point corresponded to one complete rotation of the top ball instead of an average over multiple rotations.
In Fig. 10, friction data for PAO were collected by increasing the load until lubrication failed at 677 N and then maintaining the load at 677 N. Statistics in Fig. 11 showed that X and s increased steadily with load until failure. The ratio s/X was relatively steady, consistent with increasing asperity interactions proportional to load. Skew and Kurt were more stable than in Figs. 7 and 8 and showed that friction fluctuations were not random. Instead, these friction fluctuations were probably biased and/or auto-correlated for reasons such as mechanisms of wear and lubrication, effects of grooves in contact surfaces and so forth. Figure 12 is a bar chart that compares statistics at 677 N before, during and after lubrication failure at the same load. There were significant differences in friction during abrasive (blue) and adhesive wear (orange). After adhesive wear (green), friction recovered partially due to damage to contact surfaces and, possibly, presence of wear particles in lubricant and contacts.
Fig. 10 These friction data for PAO were collected by increasing the load from 29.4 N in increments of 29.4 N/ min until lubrication failed at 677 N. The load was maintained at 677 N and data were collected during and after failure. Data were measured at intervals of 0.05 s, which is the same frequency as the rotation of one bearing on three fixed bearings (20 Hz).
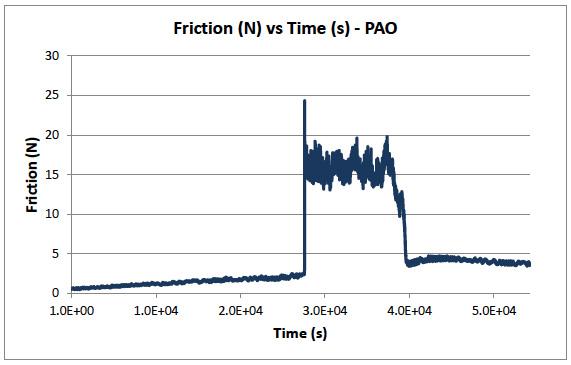
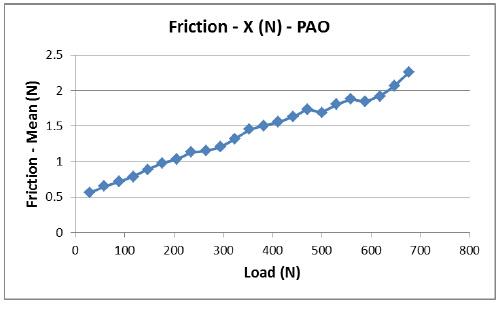
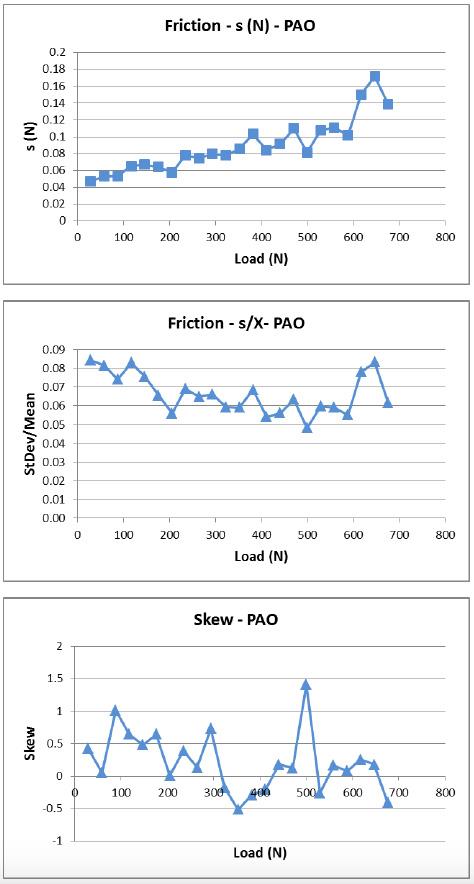
Fig. 11 Statistics calculated from friction data in Fig. 10 prior to lubrication failure.
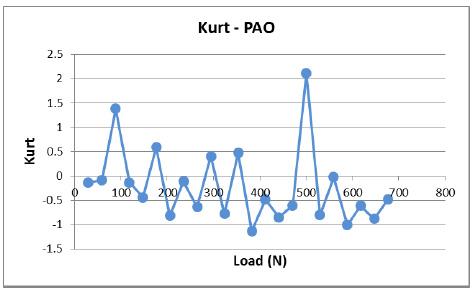
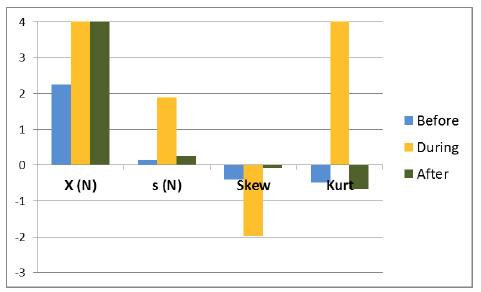
Fig. 12 Statistics calculated from friction data before, during and after lubrication failure of PAO at an applied load of 677 N.
In Fig. 13, friction data for the best PTFE-Li12OHSt grease were collected by increasing the load from 29.4 to 1 353 N in increments of 29.4 N/min. This load was maintained while friction spiked briefly at 632 and 971 N.
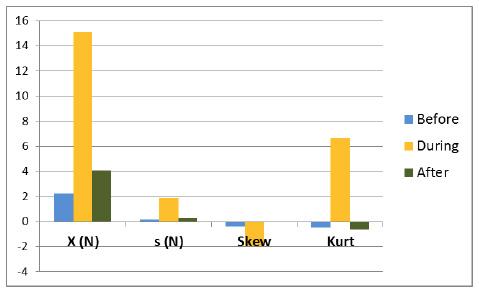
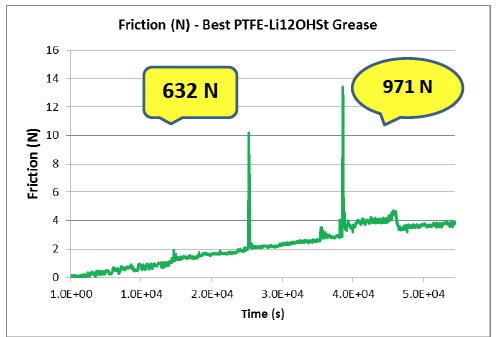
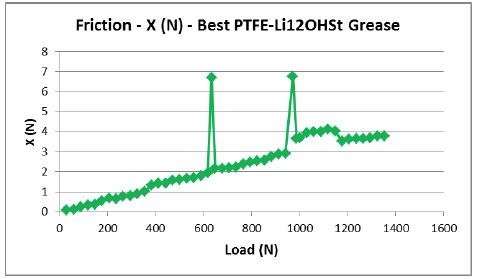
Figure 14 showed that X increased steadily with load before and after friction spikes. The ratio s/X decreased more strongly than for PAO as the load was increased to 400 N, possibly because grease solids were compressed. Skew and Kurt increased only during friction spikes.
Fig. 14 Statistics calculated from friction data for the best PTFE-Li12OHSt grease in Fig. 13.
For the best PTFE-Li12OHSt grease, friction spikes briefly interrupted lubrication. In contrast, for PAO, friction spikes corresponded to distinct changes in lubrication. In the case of the best PTFE-Li12OHSt grease, friction spiked due to entrained solids not adhesive wear.
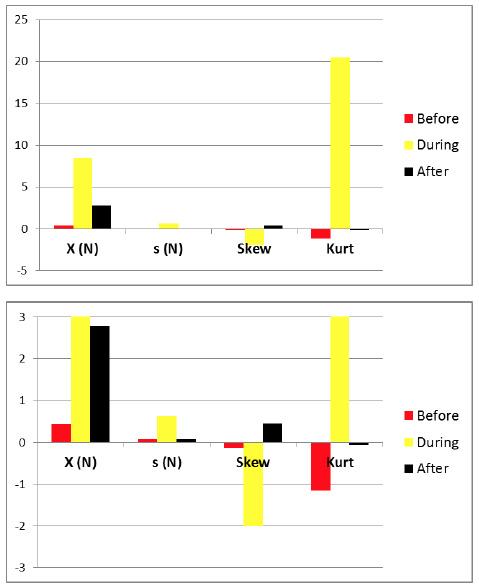
Lubrication failure was observed for a different PTFELi12OHSt grease (applied load 927 N) and control Li12OHSt grease (500 N), Fig. 9. Statistics were calculated from friction data before, during and after lubrication failure of these two greases, Figs. 15 and 16. This PTFE powder provided a modest advantage in that failure occurred at a higher load (927 N) than for control grease (500 N). However, statistics suggested that lubricant failure was similar for both greases and PAO and related to adhesive wear. After failure, friction recovered only somewhat due to damage to contacts and wear particles.
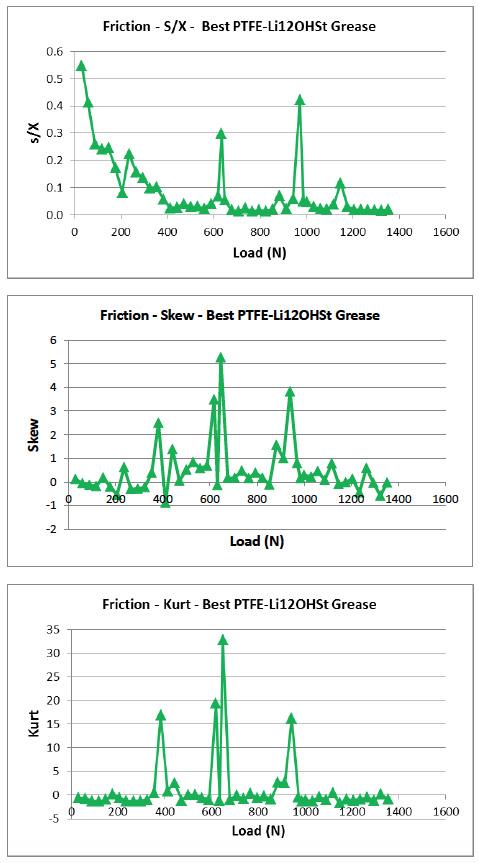
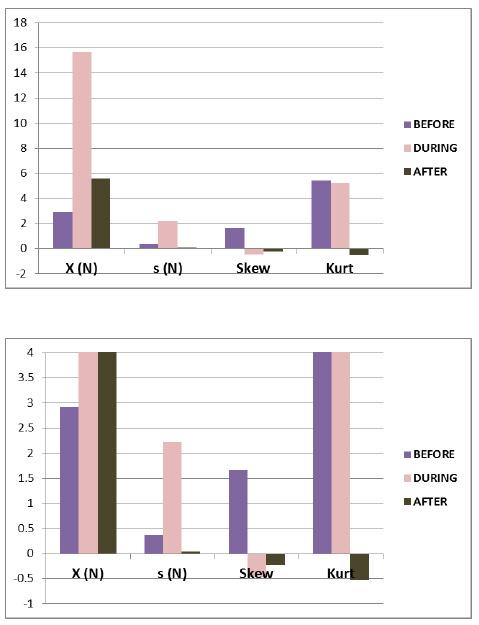
Fig. 15 Statistics calculated from friction data before, during and after lubrication failure of a PTFE-Li12OHSt control grease at an applied load of 927 N.
Fig. 16 Statistics calculated from friction data before, during and after lubrication failure of Li12OHSt control grease at an applied load of 500 N.
Wear Scars
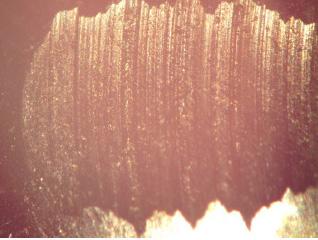
A typical wear scar from the best PTFE-Li12OHSt grease is shown in Fig. 17. Scars were oval, elongated perpendicular to direction of sliding, while scars from tests with PAO and other greases were round. In Fig. 17, the average wear scar diameter was 1.41 mm, and 0.93 and 1.89 mm parallel and perpendicular to the direction of sliding, respectively. Parallel to sliding, this diameter was similar to scars from abrasive wear for PAO. [2]
Perpendicular to sliding, stresses in contacts affected scar shape. Along inlets and outlets of contacts, scar edges were irregular. Similar irregular edges were observed for round scars from PAO tests that were stopped immediately after adhesive wear started. (Scar edges were relatively smooth and regular for PAO tests with no adhesive wear.) [2] However, no softening or melting of metal was present on the wear scar. (Likewise, there was no evidence for adhesive wear in friction and temperature data for the best PTFE-Li12OHSt grease.)
Thus, this superior grade of PTFE provided anti-wear as well as anti-friction benefits in simple lithium grease. The appearance of wear scars was consistent with the proposed mechanism that grease solids were entrained and compressed in contacts, giving rise to brief friction spikes but preventing adhesive wear.
Fig. 9 Enlarged photograph of a magnified (5x) wear scar for the best PTFELi12OHSt grease (Figs. 3 and 4). [2]
Anti-friction and anti-wear mechanism of a superior sub-micron PTFE powder
In general, adhesive wear is initiated by localized direct metal-to-metal contact between asperities on two surfaces in relative motion. Adsorbed molecular layers of sacrificial anti- wear additives and lubricating oil films can prevent asperity contacts and adhesive wear.
However, friction can remove adsorbed anti-wear additives, and asperities can penetrate oil films, triggering adhesive wear. The present study did not include a chemical analysis of scar scars, and there was no information about the possible presence of PTFE on contact surfaces.
In this study, four-ball data and wear scars suggested that the best lubrication behavior was obtained with a superior PTFE powder that was entrained and compressed in contacts during these tests. There is some evidence in the literature that supports this interpretation.
Several authors reported observations of PTFE in liquid lubricants undergoing elastohydrodynamic lubrication (EHL). Palios et al., Wan et al. and Jia et al. observed individual PTFE particles in contacts during EHL that helped support applied loads. Lubricating effects and mechanisms of PTFE depended on particle properties (size, shape, surface polarity, etc.), dispersion and test conditions (contact geometry, roll-to-slide ratio, speed, load, etc.) [5-7]
A fluid dynamics model for mixed EHL was developed by Ishimaru et al. Their calculations showed that details of asperity size, shape and location relative to a Hertzian contact can detract from or enhance oil flow through surface grooves and film thickness in rolling- sliding and pure rolling contacts. [15] Their findings imply that PTFE particles at surfaces of inlets and contacts could affect lubrication as observed in the present study.
Electron photomicrographs from the literature show inorganic nanoparticles inside grooves in wear scars generated by tribotests. [8] In this study, it is possible that some PTFE particles likewise accumulated in grooves and inlets of wear scars, preventing adhesive wear.
The best PTFE-Li12OHSt grease in this study is a useful starting point formulation for the development of greases with good anti-friction and anti-wear performance.
Conclusions
1. A superior sub-micron PTFE powder provided antifriction and anti-wear effects when formulated and milled in simple lithium greases and tested at applied loads up to 1 765 N (180 kgf) in four-ball tests with load ramps. This model grease is a useful starting point for developing formulations with anti-friction and anti-wear benefits from PTFE. 2. Friction data, statistics and the appearance of wear scars indicated that this superior PTFE was entrained in contacts or their inlets and compressed. This lubrication mechanism is feasible in the context of results in the literature for PTFE and other types of particles. 3. In these tests, friction data were similar at low loads (< 500 N) for PTFE-lithium greases, lithium control grease and PAO base oil. At higher loads, there were abrupt changes or spikes in friction. For PAO and some greases, these spikes were associated with adhesive wear and increases in friction, temperature and wear scar diameters. For a superior PTFE powder, friction spikes were harmless because this
PTFE prevented lubrication failure in these tests. 4. Preparing and milling individual batches of PTFElithium greases ensured consistent dispersion of particles among grease fibers as in commercial manufacturing. Four-ball friction and wear tests with load ramps provided useful information about
PTFE additives and avoided interference from runin effects and other chemical additives. Statistical analysis provided useful insights about grease lubrication performance.
Acknowledgements
The author gratefully acknowledges Shamrock Technologies, Inc. for support of this experimental project and permission to present this paper at the NLGI 82nd Annual Meeting, Coeur d’ Alene, ID USA, June 6-9, 2015.
References
1. M. Moon, A Superior PTFE Powder for Grease,
Extended Abstract, Society of Tribologists and
Lubrication Engineers, National Meeting, Dallas, TX,
May 21, 2015. 2. M. Moon, PTFE for Lubricating Greases, Paper #1408, National Lubricating Grease Institute Annual
Meeting, Palm Beach Gardens, FL, June 17, 2014, accepted for publication in The Spokesman, 2015. 3. M. Moon, PTFE for Lubricating Greases, Extended
Abstract, Society of Tribologists and Lubrication
Engineers National Meeting, Orlando, FL, May 20, 2014. 4. L.R. Rudnick, Ed., Lubricant Additives: Chemistry and Applications, Second edition, CRC Press, Taylor and Francis Group, Boca Raton, FL, USA, p 181-2. 5. S. Palios, P.M. Cann and H.A. Spikes, Behavior of
PTFE in Rolling/Sliding Contacts, The Third Body
Concept, D. Dowson et al., Editors, Elsevier Science ,
B.V.1996. 6. G.T.Y. Wan and H.A. Spikes, The Behavior of
Suspended Solid Particles in Rolling/Sliding
Elastohydrodynamic Contacts, STLE Transactions, 31, pp. 12-24, 1987. 7. Z. Jia and Y. Tang, Composites Part B: Engineering,
Vol 43, Issue 4, June 2012, pp. 2072-2078. 8. NLGI, Lubricating Grease Guide, Fourth, Fifth and
Sixth Editions, National Lubricating Grease Institute,
Lee’s Summit, MO, USA, 1996, 2009 and 2015. 9. L. Rapoport, N. Fleischer and R. Tenne, Fullerene-
Like WS2 Nanoparticles: Superior Lubricants for
Harsh Conditions, Advanced Materials 15:7-8, 61-65, 2003.


