
18 minute read
Impact of New Technology and 4th Industrial


Impact of New Technology and 4th Industrial Revolution on Grease Industry for Electric Vehicles
Dr. Jisheng E, GKN Driveline Technology Centre, Hauptstrasse 130, 53797, Lohmar, Germany
Abstract
Efficiency is one of the key factors for electric vehicles (EVs). This paper shows that an advanced design for grease formulation could provide good efficiency and improved life of power transmission systems based on better understanding of tribology systems and behaviour of thickeners, base oils, and additives in greases.
For a company to stay, to grow and to develop in the grease industry, it needs to adapt to the Fourth Industrial Revolution (4IR) and its emerging technology breakthroughs in robotics, artificial intelligence, autonomous vehicles, etc. It is imperative to adapt new technology to understand the interactions between base oils, additives, and thickeners on a molecular level. For example, two grease samples with the same formulation but manufactured by two different companies could behave differently. Nano-FTIR and confocal Raman spectroscopy techniques could be adapted for understanding the different physical behaviour of these two samples. Their different physical behaviour might be related to different interactions between the same substances inside these two samples.
A change of inspection philosophy - from the use of phenomenological measurement techniques to determine the macroscopic properties of greases to the use of 4IR technology to understand the behaviour of greases based on their composition and their molecular interactions - will improve the knowledge of greases and result in stronger links between formulation designs, manufacturing processes, laboratory tests, bench tests, and application performance. With the progress in the 4IR, expensive chemical analysis on a molecular level could become normal, daily analysis with lower cost than today. This could make it possible to better enable us to understand the behaviour of fresh and used greases based on integrative materials models that cover the full range from molecular level to macroscopic performance. As a result, it is possible to use characteristic curves based on formulation design and manufacturing processes to provide customers quick and firsthand information about their specific tribology system.
Introduction
Robotics, artificial intelligence, and autonomous vehicles are important parts of the Fourth Industrial Revolution (4IR) for the automotive industry. McKinsey research suggests that the 4IR could raise productivity growth globally by between 0.8 and 1.4% annually, where the First Industrial Revolution raised it by about 0.3% [1]. Companies that actively involve new ways of thinking and working in coming years could develop and grow rapidly.
An article by Schwab [2] stated that on the supply side, many industries are seeing an introduction of new technologies that create entirely new ways of serving existing needs and significantly disrupt existing industry value chains. Disruption is also flowing from agile, innovative competitors who, thanks to access to global digital platforms for research, development, marketing, sales, and distribution, can oust well-established incumbents faster than ever by improving the quality, speed, or price at which value is delivered to customers.
A research report by Manyika [3] stated that technology-powered companies have also demonstrated the ability to make lightning-fast moves into new sectors—often to the delight of consumers and users, who flock to these new offerings for convenience, simplicity, or even free services. In other words, technology is one of the key driving factors for the 4IR. For a company to stay, to grow, and to develop in the grease industry during the 4IR, it is imperative to adapt new
technology to understand the interactions between base oils, additives, and thickeners on a molecular level and to understand correlations between formulation design, manufacturing influence, laboratory tests, bench tests, and field applications. As a result, grease companies can give confidence to their customers so that they rely on both grease products and technical service.
Impact of greases on efficiency of electric cars
Fig.1 Efficiency of fixed ball-type CVJs For example, depending on their design, electric vehicles (EVs) and hybrid electric vehicles (HEVs) can operate at higher efficiencies compared to petrol or diesel vehicles [4,5]. Power transmission shafts with constant velocity joints (CVJs) could still be key components of EVs and HEVs until 2050 [6]. An improvement in the efficiency of power transmission shafts could greatly contribute to enlarge conversion of energy for movement of EVs [7].
Figure 1 shows the influence of GKN greases on the efficiency of fixed ball-type CVJs. Using the same batch of fixed ball-type CVJs, there was a reduction of about 30% in energy loss in these CVJs in GKN standard tests using the advanced grease instead of the commercial grease. It was seen that, with a consideration of synergistic effects between solid lubricants and chemical additives, a large improvement was achieved by the advanced grease over the commercial grease by using an additive package based on solid lubricant additives. This result indicates that an understanding of interactions between additives could help make it easier to design better advanced greases.
Interaction between thickener, oils and additives
Grease contains thickener, oils, and additives. As described by Chen in the 1950s [8], grease is a structural dispersion system with oils as a matrix phase and oil-thickener gel particles as a dispersed phase. The oils in the gel particles would interact with the thickener structure and the oils in the matrix phase, which relates closely to the behaviour of the gel phase. The interactions between thickener, oils, and additives play the most important roles. Therefore, the same formulation can be used to make greases with different behaviour by using different manufacturing systems. Understanding interactions of thickeners with oils and additives at a molecular level in grease could help the grease industry to better develop advanced greases.
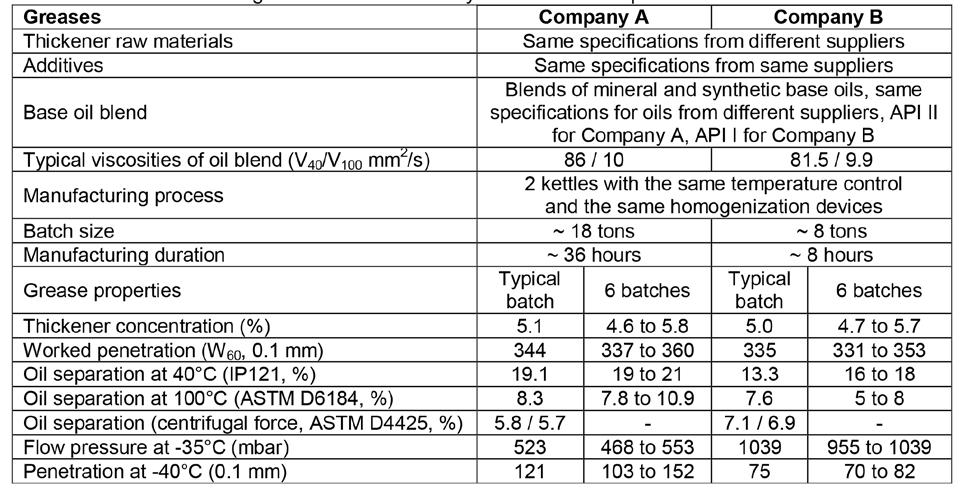
Table 1 shows the influence of the manufacturing process on lithium 12-hydroxystearate soap greases used in GKN drivelines. The greases were manufactured from lithium hydroxide monohydrate and 12-hydroxystearic acid by two different companies in two different countries. Companies A and B made Greases A and B, respectively, using: a) the same formulation containing the same additives from the same additive suppliers; b) thickener raw materials with the same specifications from different suppliers; c) blends of mineral and synthetic base oils with the same specifications, in the same ratio, from different suppliers where API Group II oils were used by Company A and API Group I oils by Company B; d) the same manufacturing temperature curves controlled in the same way before adding additives during manufacturing; e) the same manufacturing structure process design with two kettles and homogenization devices with the same specifications from different suppliers.
The significant differences were the batch size and manufacturing duration where Company A made about 18 tons of Grease A with manufacturing duration of about 36 hours, and Company B made about 8 tons of Grease B in about 8 hours.
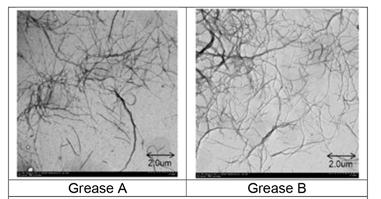
Fig.2 TEM microphotographs of thickeners from Greases A and B show no difference in microstructure.
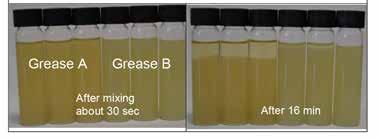
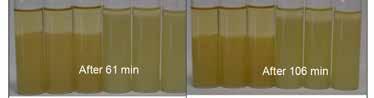
Fig.3 Dispersion phenomena of greases in a nonpolar solvent, heptane, where particles in Grease A (left) fell faster than particles in Grease B (right).
Several grease properties are listed in Table 1. Results show that, with the same type of thickener at similar concentrations, Grease A from Company A exhibited several differences compared to Grease B from Company B: a) softer consistency; b) higher oil separation at 40 and 100°C in static situations; c)and less oil separation in a dynamic situation (under centrifugal force)
This behaviour was not only observed in one grease sample from a particular batch of Grease A or Grease B, but also in multiple batches of both greases for statistical analysis during quality control studies.
In order to understand the influence of thickener microstructure on grease behaviour, TEM microscopy was employed to inspect thickener microstructure after extracting oils and additives from grease samples. Inspection showed the same microfibers and the same distribution of microfiber sizes in Greases A and B, Figure 2.
An investigation of dispersion phenomenon was also carried out. In this study, small grease samples were added to heptane, a solvent with nonpolar molecular structure, and to tetrahydrofuran, a solvent with polar molecular structure. After shaking these samples well to make properly suspended solutions, the samples were placed on the laboratory bench and the suspended particles in the solutions were observed. It was expected that most of the oils and additives were dissolved in the solvents.
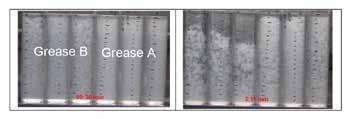
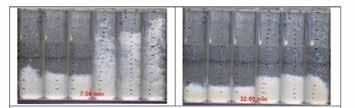
Fig.4 Dispersion phenomena of greases in a polar solvent, tetrahydrofuran, where particles in Grease B (left) fell faster than particles in Grease A (right) In the nonpolar solvent, heptane, the suspended particles from Grease A fell faster than the particles from Grease B, Figure 3. But in the polar solvent, tetrahydrofuran, the opposite phenomenon was observed, Figure 4.
Considering that both Greases A and B were formulated with Li 12-hydroxystearate soap thickener, if an interaction took place only between thickeners with solvents, it could be expected that both grease samples would show similar behaviour in different solvents. From the dispersion study, it is implied that there might be additional different interactions between Li 12-hydroxystearate soap and other substances in Greases A and B. Different chemically bonded substances on Li 12-hydroxystearate soap in Greases A and/or B might not dissolve totally. Therefore, an investigation of interactions on a molecular level between thickeners, oils, and additives is one of the key factors to understand greases and their formulation in both grease development and applications.
The results of the dispersion study implied that the particles contained base oils and/or additives as well as thickener, which meant that there were significant interactions between the thickeners and the base oils and/or additives in the particles. That is, base oils and/or additives interacted with thickener and did not dissolve totally in heptane or tetrahydrofuran.
4th Industrial Revolution and new technology
Chemical investigations of interactions between substances on a molecular level are already widely used in the pharmaceutical industry and in the field of biology.
In a recent interview by Prince Harry with DeepMind CEO, Dr. Demis Hassabis, it was forecast that biotechnology and chemistry could be leading areas of breakthrough technology in Automation Intelligence (AI) during the 4IR [9]. Automation Intelligence refers to the development of hardware or software that is capable of doing things automatically, without human intervention. The abbreviation ‘AI’ can also mean Artificial Intelligence for machines that mimic learning, problem solving, and other types of human cognition or mental activities.
Chemistry is a leading area of breakthrough AI technology because technology related to chemical analysis can be developed, automated, and simplified rapidly. For instance, robots could replace humans in the workplace in predictable and/or dangerous environments like laboratories and factories, and data collection and processing could be automated and utilize cloud data storage [10]. With these two developments, chemical analysis methods could be integrated within one multifunctional click-to-run device for chemical investigation on micro- and/or nanoscales. At the same time, it is expected that a dramatic reduction in the cost of chemical analysis will take place quickly. For example, the cost of an HPLC analysis in some external laboratories was about 10 times lower in 2017 compared with a few years ago.
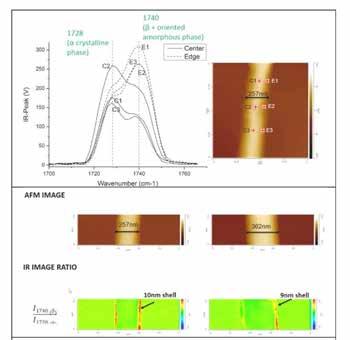
Fig. 5 Nano-FTIR analysis shows different spectra of α and β phases of a polymeric material (top) and a thicker shell of β phases on thinner nanofibers (bottom, left) than thicker nanofibers (bottom, right) [12]. Figure courtesy of Bruker Corp., Bruker.com/nanoIR
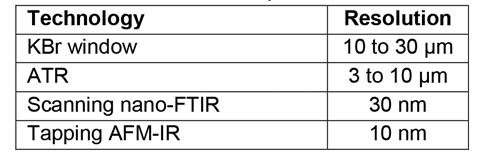
Infrared (IR) analysis is a powerful chemical analysis technique used to identify chemical structures of organic substances. Table 2 gives the resolutions of different technologies for IR analysis. It is not possible to use KBr windows and ATR (Attenuated Total Reflection) instruments for an investigation of interactions between thickeners and oils/additives on a molecular level. Currently developed nano-FTIR (Fourier transform infrared) spectroscopy with higher resolution can be used for these investigations [11].
Figure 5 shows an example of a polymeric storage material, poly[(R)-3-hydroxybutyrate-co-hexanoate], manufactured using different processes [12]. An investigation of these nanofibers shows that a β-oriented amorphous phase with a strong 1740 cm-1 ID peak is present on the exteriors of these nanofibers, and an α-crystalline phase with 1728 cm-1 ID peak is present in the centre of these nanofibers.
Mapping analysis using the ratio of the intensity of the 1740 cm-1 ID peak to the 1728 cm-1 ID peak shows that there is a thicker shell on the surfaces of thinner nanofibers than thicker nanofibers. For the grease industry, it is expected that interactions of oils and additives with thickener fibers could be investigated using this nano-FTIR technology.
Table 2 Resolution of IR spectrometers
Raman spectroscopy is another powerful chemical analysis technique similar to IR spectroscopy. The idea of inelastic scattering of monochromatic light, the principle of Raman spectroscopy, was first reported by Sir C. V. Raman in 1928; he received the Nobel Prize in 1930 for his discovery [13]. Raman spectroscopy was used first in special instruments for academic research. Forty years ago, one Raman device would fill a large room. A few hours might be needed to take one Raman spectrum without a good database.
Following the development of new digital technology and electronics, Raman spectroscopy has progressed rapidly. Nowadays, Raman analysis has become a commercial technique for chemical analysis alongside FTIR analysis in terms of the size of the device and the duration of taking one spectrum. The beauty of Raman spectroscopy is that no sample preparation is required for most devices. Some of these instruments, such as confocal Raman microscopes, are similar in size to light microscopes and sit on a laboratory bench. A grease sample in any form can be used to carry out a Raman analysis. Another advantage of Raman is that the best resolution reported so far, from about 20 to 50 nm, would be suitable for chemical analysis on a molecular level.
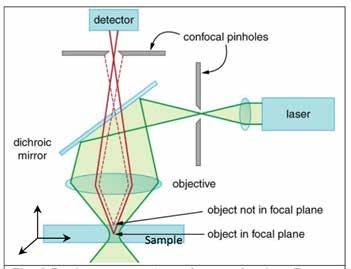
Fig. 6 Basic concept of confocal Raman spectroscopy: light from a laser passes through a pinhole to a dichroic mirror, and then to the sample. Scattered light is analyzed to generate the Raman spectrum. A map of a sample can be made by moving the confocal pinholes to generate Raman spectra, one by one, while moving the sample in 3D.
Raman technology is still in development with many variants. About 17 variants are listed in the Internet [14]. One of them is confocal Raman spectroscopy. Figure 6 shows how a confocal Raman spectrometer could be used to make a 3D mapping of a sample by measuring Raman spectra with a resolution of about 250 nm.
Figure 7 shows a result reported in the literature [15]. Raman spectra clearly show a map of the distribution of materials in an emulsion. The emulsifier, polyglycerol polyricinoleate (PGPR), surrounds droplets of an aqueous phase (blue) dispersed in a mixture of two fats. The emulsifier (yellow) interacts with fat II (green) but not fat I (red), which forms clumps. In greases, there could be similar distributions of oils, additives, and thickeners caused by their interactions. In other words, the mapping technology of Raman spectra could potentially be adapted to investigate the interactions and distributions of thickeners, oils, and additives in greases.
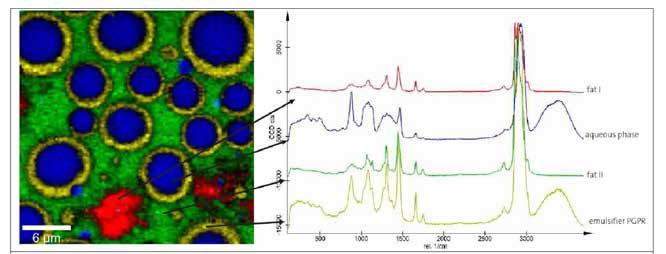
Fig. 7 Raman confocal spectroscopy of an emulsion used in food production [15]. Figure courtesy of WITec GmbH, Ulm, Germany.
New technology and grease development
Development of grease currently goes through several steps: formulation design, laboratory tests, bench tests, and, finally, field tests and applications. In addition, there is the consideration of variants in the manufacturing processes between laboratory and production line (orange lines in Figure 8). It is necessary to carry out many laboratory tests related to tribology and grease properties to predict the grease performance, Figure 8. Once the application and field tests are underway, there is little feedback or information related to the behaviour of additives and oils. Also, there is limited information on the behaviour of thickener microstructure during applications. High costs limit the investigation of thickener microstructure. Fig. 8 Inspection of grease samples to understand grease behaviour on a molecular level by chemical analysis in the 4IR (green and blue lines) instead of by phenomena and general test performance used currently (orange and blue lines)
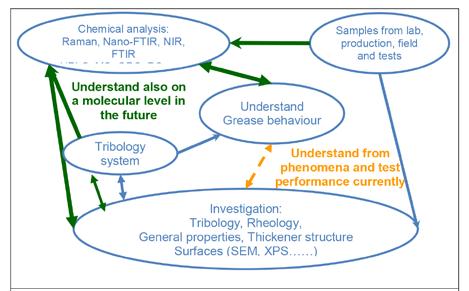
As mentioned above, the 4IR could bring the cost of chemical analysis down significantly. As a result, it becomes possible to carry out grease design and manufacturing process design based on understanding the behaviour of additives, oils, and thickeners, plus interactions between them on a molecular level, using an ROC (Receiver Operating Characteristic) curve [16], Figure 9.
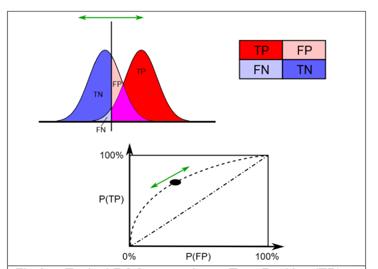
Fig.9 Typical ROC curve shows True Positive (TP), False Positive (FP), True Negative (TN) and False Negative (FN) (top) and probability of True Positive against probability of False Positive (bottom) [16]. The green arrow shows the criterion for making a pass/fail decision. Figures courtesy of Wikipedia, Sharpr (https:// commons.wikimedia.org/wiki/File:ROC_curves. svg), „ROC curves“, https://creativecommons. org/licenses/bysa/ 3.0/legalcode
Figure 9 shows an ROC curve where the probability of True Positive (TP) is plotted against the probability of a False Positive (FP) decision for a pass/fail test. In other words, an ROC curve is a plot of true (correct) positive decisions against false (wrong) positive decisions (false alarms). ROC analysis was first developed during World War II for detecting enemy objects in battlefields. Now ROC analysis is used in machine learning in AI, medicine, biometrics, model performance assessment, etc. Basically, it is used to predict the possible future good or bad performance from existing results and/or phenomena.
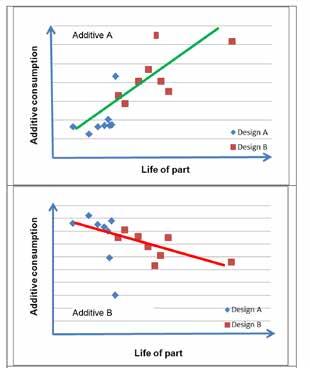
Fig.10 ROC curves of the behaviour of 2 additives in the same grease tested in 2 different CVJ designs
Fig. 11 ROC curve of part life influenced by property change of materials, shows that the life could be improved if the property change is to the right of the green line
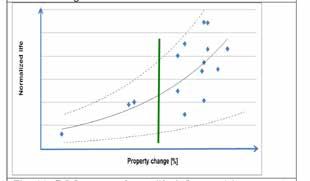
Figure 10 shows work done by GKN Driveline. After CVJ life tests, consumption of 2 different additives inside the tested samples was measured by HPLC (High Performance Liquid Chromatography). The CVJ life for two different CVJ designs increased with an increase in consumption of additive A. This implied that an active interaction of additive A with surfaces of CVJ parts could contribute to long CVJ life but additive B might do differently. Figure 11 is an ROC curve from another GKN study. In this case, GKN measured a property change against the normalized life of parts in CVJs with different designs and different materials. True positive or TP results show that the property change should be kept on the right side of the green line to improve the life of the parts.
It is seen from this paper that grease development, understanding of grease behavior, and insight about the influence of manufacturing on grease performance could be significantly improved by the use of proper chemical analysis to understand the interactions between thickeners, oils, and additives on a molecular level in tribology systems. Therefore, this technology could make it possible for a grease company to provide customers not only new grease products, also quick and first-hand information about lubrication of their specific tribology system as technical service during the 4IR.
Conclusions 1. An improvement in efficiency of power transmission shafts will be one of the most important contributions to energy conversion for EV design in coming years.
2. Understanding the interactions between thickeners, oils, and additives at the molecular level could help give good links between grease formulation design, manufacturing process design, laboratory inspection tests, bench validation tests, and grease performance in field applications.
3. With AI, technology for chemical analysis could be rapidly developed and simplified. As a result, complex techniques such as Raman confocal spectroscopy and nano-FTIR spectroscopy could be simplified and made available at a low cost to help the grease industry understand interactions between thickeners, oils, and additives on a molecular level in tribology systems.
4. Technical information about interactions between thickeners, oils, and additives on a molecular level could help grease companies improve not only their products, but also their technology service, and this could help them to stay, to grow, and to develop in the grease industry during the Fourth Industrial Revolution.
References: 1. James Manyika, Workplace automation: Separating fiction from fact, LinkedIn, 16th Jan 2017. 2. Klaus Schwab, The fourth industrial revolution; what it means, how to respond. World Economic Forum. https://www.weforum.org/agenda/2016/01/the-fourth-industrial-revolution-what-it-means-and-howto-respond/
3. James Manyika, Playing to win: The new global competition for corporate profits, LinkedIn, 19th Oct 2015. 4. Advantages of electric vehicles, Electric vehicle benefits and considerations. https://www.energywise. govt.nz/on-the-road/electric-vehicles/advantages-and-challenges-of-evs/ 5. All-Electric Vehicles. https://www.fueleconomy.gov/feg/evtech.shtml 6. Global EV outlook 2017, International Energy Agency, OECD/IEA, 2017, Website: www.iea.org, https:// www.iea.org/publications/.../publication/GlobalEVOutlook2017.pdf 7. Jisheng E, Fuel economy and lubricants in powertrain systems, Lube-Tech, No. 134, Aug 2016, page 26 to 31. 8. Shaoli Chen, Grease – a structural dispersion system with oils as matrix phase and oils-thickener gel particles as dispersing phase, Proceedings of The First Chinese National Conference on Friction, Wear and Lubrication, 1963, page 233 – 247. 9. Prince Harry, AI and the future of DeepMind, an interview with Dr. Demis Hassabis by Prince Harry BBC Radio, 27th Dec 2017. https://www.bbc.co.uk/programmes/p05s372t 10. Miha Krali, How cloud serves as the foundations for AI, 19th Sept 2017. https://www.bbc.co.uk/ programmes/p05s372t 11. Nano infrared spectrometer, Anasysinstruments. https://www.anasysinstruments.com/products/ nanoir2-fs/ 12. Dr. John Rabolt, IBM Almaden Research Centre, University of Delaware, Nanoscale IR spectroscopy on single nanofibers, Webinar by Bruker Nano and Anasys Instruments, Bruker.com/nanoIR 13. J. Javier, An Introduction to Raman Spectroscopy: Introduction and Basic Principles, 1st July 2014, Infrared Spectroscopy / Raman, Education Article in www.Spectroscopynow.com. http://www. spectroscopynow.com/raman/details/education/sepspec1882education/An-Introduction-to-RamanSpectroscopy-Introduction-and-Basic-Principles.html?tzcheck=1 14. Ares Liam, et al. Raman spectroscopy, from Wikipedia, the free encyclopaedia www.Wikipedia.org. https://en.wikipedia.org/wiki/Raman_spectroscopy 15. WiTec focus innovations, Food analysis with confocal Raman spectroscopy, Application notes, www. witec.de. 16. Jagadeesha Kanihal, et al. Receiver Operating Characteristic, from Wikipedia, the free encyclopaedia www.Wikipedia.org. https://en.wikipedia.org/wiki/Receiver_operating_characteristic


