26 minute read
PTFE for Lubricating Greases


Mary Moon, Ph.D. marymoonphd@gmail.com Consultant to Shamrock Technologies, Inc. Newark, NJ 07114 USA
Abstract
The purpose of this study was to investigate the performance of seven experimental PTFE powders in grease and evaluate effects of particle size and dispersion on consistency, stability, friction and wear. Laboratoryscale batches of simple lithium greases were prepared and milled with a high-pressure homogenizer. All PTFE greases were comparable to controls in appearance (offwhite), NLGI grade (2), texture (smooth, buttery) and storage stability (<5% bleed after 4-5 months storage).
Four-ball friction and wear tests demonstrated the value of specific PTFE powders as additives. Submicron PTFE powders, formulated in grease without other extreme pressure (EP) or anti-wear additives, reduced wear, friction and temperature during mixed/ boundary lubrication. These PTFE powders prevented adhesive wear due to oil film failure at applied loads up to 180 kg. Test results suggested that PTFE was entrained in contacts and helped support loads. These results depended upon PTFE dispersion in specific formulations.
Introduction
The present paper takes a direct and pragmatic approach to investigate effects of experimental PTFE powders in simple lithium greases formulated without other additives. This Introduction provides background information about PTFE powders. In prior studies of PTFE in greases and liquid lubricants, results were situational and depended upon particle size, dispersion and tribology test conditions such as speed, load and roll-to-slide ratio. This study compares seven powders with primary (fully dispersed) particles that range from sub-micron to larger sizes. This Introduction compares these particle sizes to nanoparticles, grease fibers and wear scars. [1]
Grease preparation is the subject of the next section. Each lab-scale batch of grease was blended and milled with the same procedure to model PTFE dispersion in manufacturing processes. Results for grease consistency and storage stability are presented next. Then, the heart of this paper focuses on four-ball friction and wear testing. Data collected during tests with ASTM D2266 [2] indicated that start-up and run-in affected test results. A four-ball technique was customized by gradually applying loads to lessen start-up and run-in effects. Friction and temperature data and wear scars were analyzed to characterize effects of PTFE powders on lubrication.
Polytetrafluoroethylene or PTFE is a synthetic fluoropolymer of tetrafluoroethylene (-CF2-CF2-)n with a chemical formula that resembles ethylene (-CH2CH2-)n but with fluorine instead of hydrogen atoms. In contrast to hydrocarbons, PTFE chains are stiffer with a greater tendency to pack in semi-crystalline arrangements. PTFE films and solid surfaces tend to be white, waxy and smooth. (The most well-known application of PTFE is non-stick coatings on cookware.) PTFE is extremely slippery with coefficient of friction, COF, between 0.04 (sliding friction, D1894 [3]) and 0.1. Other useful properties include resistance to chemicals, solvents and temperature extremes (highs and lows). [4]
Lubricants are formulated with PTFE particles that are either synthesized or produced by milling solids. PTFE
powders are used as thickeners for grease and additives to improve resistance to water, chemicals and friction. For example, PTFE is formulated in spray-on dry film lubricants, release agents and non-flammable lubricants intended for use under oxidizing or chemically aggressive conditions. [4] PTFE powders were investigated as possible friction-reducing additives in crankcase engine lubes and transmission fluids. Continued research in PTFE has observed that lubricating effects and mechanisms depend upon PTFE particle properties (size, shape, surface polarity, etc.), dispersion and test conditions (contact geometry, roll-to-slide ratio, speed, load, etc.) [5-7]
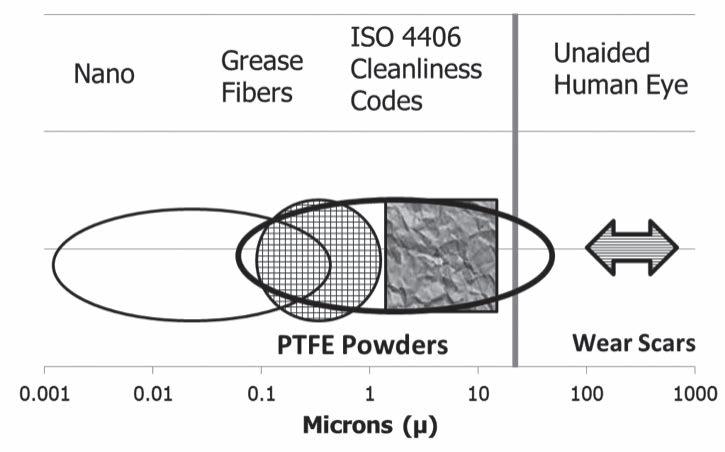
PTFE powders can be manufactured with specific size distributions of primary (non-aggregated) particles. Sub-micron grades of PTFE contain primary particles with average diameter < 1 μm, comparable to some nanoparticles and grease fibers, Fig. 1. In other grades, the average primary particle size is larger, similar to dust, etc. [8] Aggregates or agglomerates can be microscopic or macroscopic, i.e., invisible or visible to the unaided human eye (resolution ~ 40 μm). For comparison, typical specifications for wear scars from tribology tests are approximately 0.5 mm or 500 μm.
Fig. 1 Size scales of nanoparticles (< 1 μm), grease thickener fibers (0.1 – 1 μm), ISO 4406 categories (> 4, 6 and 14 μm) for dust, etc. [8], PTFE particle diameters (0.1 – 100 μm), and wear scar specifications (0.5 mm or 500 μm) relative to the resolution of the unaided human eye (~ 40 μm).
In other studies, PTFE powders were added to greases, and friction, wear and load carrying capacity were measured. Aswath [9] mixed PTFE with ZDDP (zinc dialkyl dithiophosphate), MoS2 and FeF3 (shown to catalyze adhesion of PTFE and MoS2 on metal) in lithium stearate base grease. They performed block-on-ring tests and reported that smaller PTFE (0.2 mm or 200 μm) was better than larger PTFE (1 - 4 mm) in terms of wear resistance and weld load. Krawiec [10] added 6 wt.% PTFE powder (20 - 40 μm) to all-purpose vehicle grease and reported that PTFE increased seizure loads by 150% and decreased wear scars by 30% relative to control grease in four-ball tests.
Fish et al. [11, 12] compared effects of additives on load carrying capacity of base grease with a weld load of 160 kg (D2596, [13]). In three cases (3 wt.% PTFE; 3 wt.% MoS2; and 1.5/1.5 wt.% PTFE/MoS2), weld loads improved to 250 kg. The weld load reached 500 kg for grease with PTFE plus a borate additive. Their results suggested that PTFE (particle size not specified) showed potential as a substitute for MoS2 as an extreme pressure (EP) additive in grease.
Ballester et al. [14] compared four PTFE powders with average primary particle diameters of 0.8, 4.2, 20.5 and 46.8 μm. They mixed PTFE (1 wt.%) into commercial lithium base grease (no EP additives) using an overhead
mixer and a Cowles blade. Four- ball friction and wear tests were performed according to D2266. One powder (20.5 μm) reduced COF (20% relative to control grease). Wear scar diameters were comparable for control and test greases.
Grease Consistency and Stability [15]
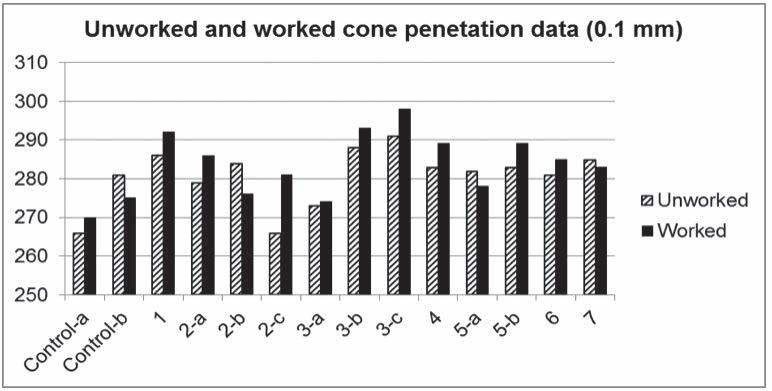
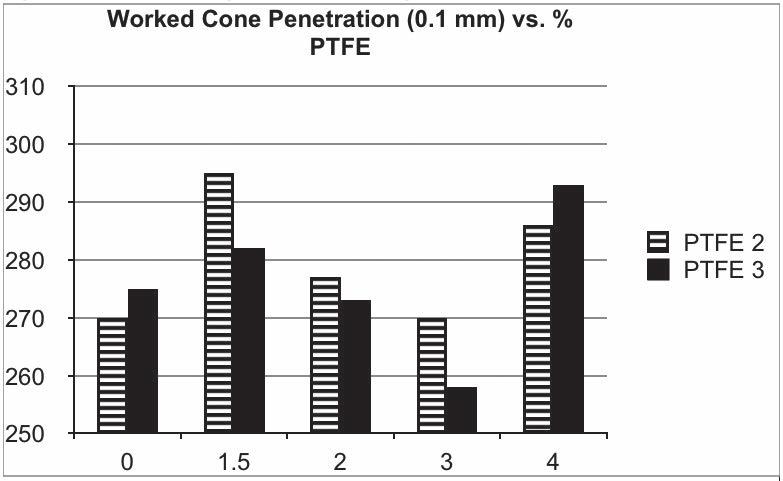
Greases prepared from PTFE, Li12OHSt and PAO (4/8/88) and control grease (0/8/92) were off-white in color with smooth, buttery texture and NLGI grade 2. In most cases, working grease slightly increased penetration depth, i.e., softened grease by dispersing solids and entrained air, Fig.3. Cone penetration data were comparable for control and PTFE greases. This indicated that lithium fibers determined consistency, and PTFE particles were dispersed among lithium fibers. Consistency did not trend with weight percent PTFE-2 (appropriate for HX-1 registration) and PTFE-3, Fig. 4.
Twenty-five samples of control and PTFE greases were stored in the laboratory with no exposure to light. After four to five months, there were no changes in appearance. Less than 5% of the oil separated but mixed easily into 23 samples. Two samples (control grease, PTFE-2 grease) softened and released more oil during storage.
Fig. 3 Control and PTFE greases were NLGI grade 2
Fig. 4 Worked cone penetration for greases prepared with different levels of PTFE-2 and PTFE-3
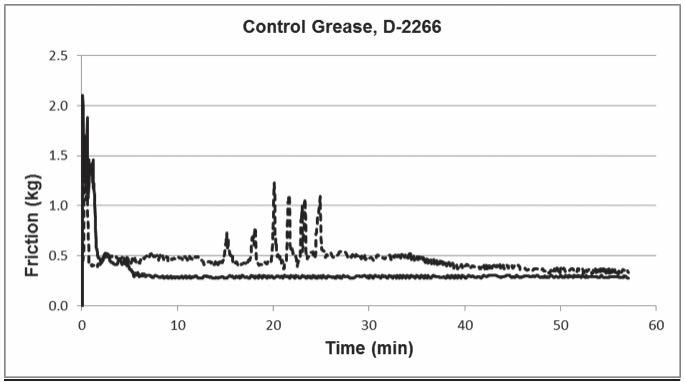
Greases were evaluated using a four-ball friction and wear machine and D2266 (75°C, 40 kg load, 1,200 rpm, sliding speed 20 rps x 2 π x 3.8 mm ≈ 0.5 m/s). This test is used to make preliminary assessments of anti-wear properties of greases in sliding contacts. In practice, fully-formulated lubricants are tested relative to specifications for qualification and quality control. In this study, friction data indicated that contacts were damaged during start-up and run-in, e.g., Fig. 5 for control grease. Damage can form wear particles, and a few wear particles can initiate a cascade of more damage and wear particles [18, 19]. Insufficient oil bleed can contribute to wear.[20] Thus, start-up and run-in can affect performance during four-ball tests and compromise test results.
Fig. 5 Friction data (kg) during D2266 for two samples of control grease.
To reduce damage during start-up and run-in, grease could be reformulated with EP additives. However, those additives could have unanticipated effects on testing PTFE. Instead, the four-ball test procedure was modified to reduce the severity of start-up and run-in. The load was increased gradually with a ramp. This approach resembles gradually polarizing a working electrode and measuring current flow to perform a potentiodynamic scan, which is an electrochemical technique.
Fig. 6 Four-ball friction and wear machine (circa 1982) used in this study.
In these four-ball tests, friction was measured with a load cell and force gauge, and temperature was measured with a thermocouple at the perimeter of the cup. Time series were collected at intervals of 2 using an AD converter and data acquisition software. The laboratory was maintained at 21-23°C (70-74°F). Wear scars were measured and photographed with commercial light microscopes and cameras or calipers. The sample cup was loaded with a consistent mass of grease or volume of liquid. A torque wrench (54.2 N·m or 40 lb-ft) was used to lock balls in the cup.
To develop a load ramp procedure, simple lithium grease formulated with PTFE-3 was tested in four consecutive stages, Table 1. Friction fluctuations were not observed at the start of this test (Fig. 7). Start-up and run-in effects were significantly smaller with load ramps than D2266 Friction increased with load and possibly plateaued, corresponding to mixed and boundary lubrication, respectively. Temperature increased smoothly. The steepness of these load ramps did not affect friction or temperature.
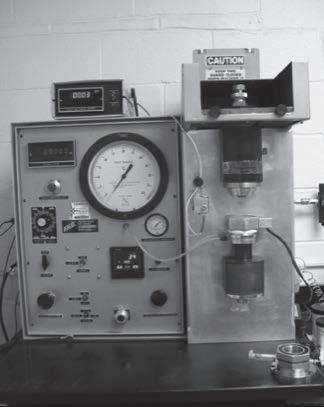
Table 1 Load ramp stages in the initial four-ball friction and wear test
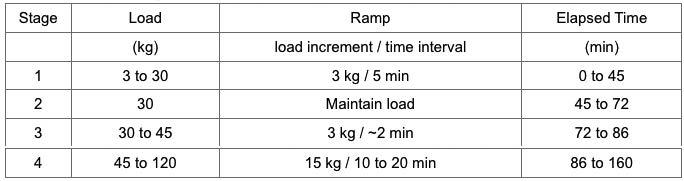
Simple statistics were calculated from data at each load, excluding two features discussed below. Average (mean) friction and temperature trended with load, Fig. 8. Friction fluctuations increased during the test, possibly due to wear or more asperity contacts at higher loads, Fig. 7.
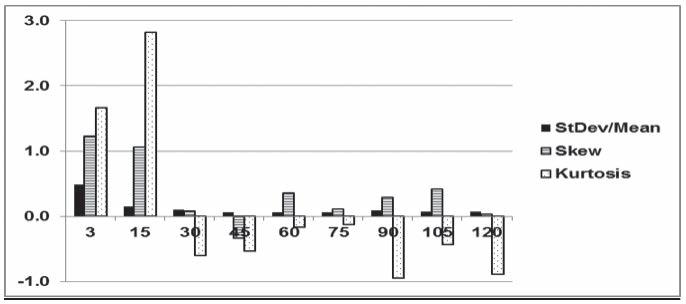
Three more statistics were calculated: standard deviation divided by the mean, skew and kurtosis. The statistics showed that friction fluctuations were large (relative to the mean) and not random during run-in up to a 15 kg load, Fig. 9. These results are consistent with shearing individual asperities [21], churning grease [20], etc. during run-in. Also, sounds were shrill up to 15 kg and then less shrill at higher loads. After run-in, friction fluctuations were relatively small (<10% of mean) and random up to 120 kg load. There was no statistical evidence that friction fluctuations changed after run-in, i.e., PTFE-lithium grease performed consistently (during abrasive wear, see below). [Note: Skew and kurtosis were statistically significant and not random (|skew| > 0.4 and |kurtosis| > 0.8 for 150 data) below 15 kg but not at higher loads.]
Much larger friction fluctuations were observed at loads of 27 and 90 kg. Temperature was steady, and welding did not occur during these events.
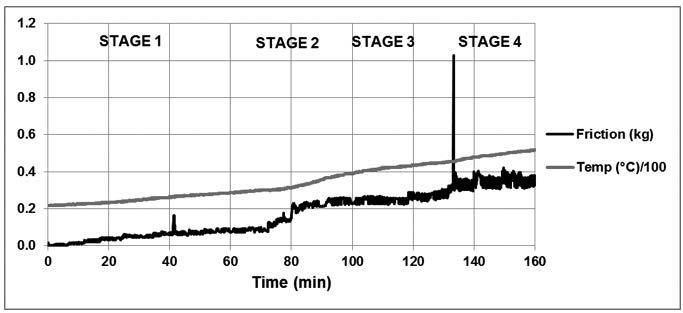
Fig. 7 Four-ball friction and temperature data for simple lithium grease formulated with PTFE-3
Fig. 8 Load ramp and average friction and temperature for lithium grease formulated with PTFE-3
Fig. 9 Statistics calculated from friction data for lithium grease with PTFE-3 versus load (kg)
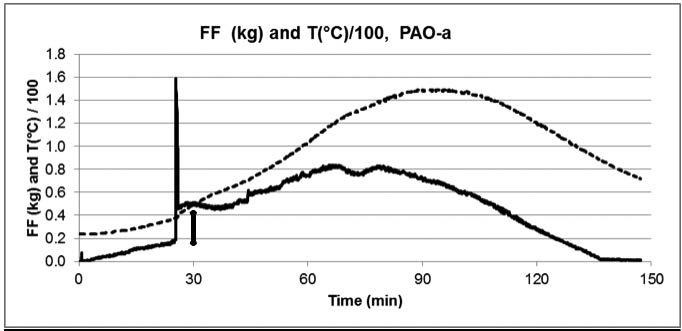
In this study, four-ball tests with load ramps were applied to PAO base oil used to formulate greases. In test PAO-a, the load was ramped from 3 to 180 kg at 3 kg/ min, held for 15 min and ramped down at the same rate. Friction and temperature initially increased smoothly with load, Fig. 10. At 72 kg load, friction increased from 0.19 to 1.59 kg and then decreased to 0.52 kg. After this event, the friction shift (friction after – friction before event) was 0.52 - 0.19 kg or 0.33 kg. The friction ratio (friction after/friction before) was 0.52/0.19 or 2.7. Ten minutes later, the temperature was 10°C above the temperature projected from data prior to the event, Fig. 12. PAO continued to lubricate these contacts after the friction event. FTIR spectra of tested and untested oil were nominally identical (not shown), i.e., PAO did not oxidize. The average wear scar diameter was 2.70 mm, and wear particles were visible in the oil.
The duration of this friction event for PAO was approximately 36 s. Friction events lasted longer in some replicate tests, e.g., PAO-j shown in Figs. 15 and 16. In some cases, tests were stopped when friction was near the load cell limit (2.27 kg or 5 pounds) or welding occurred.
Fig. 10 Friction (FF, kg, ____) and temperature (T, °C/100, - - -) for test PAO-a. The arrow indicates the friction shift (0.33 kg) after the event.
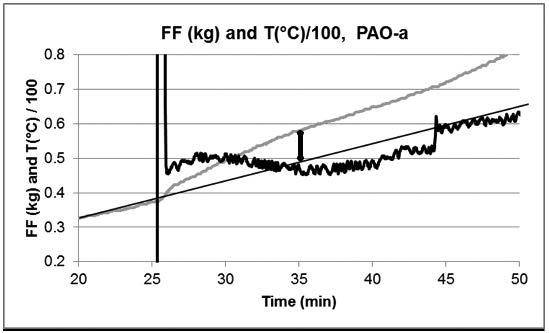
Fig. 11 The arrow indicates the shift in PAO temperature (grey line) ten minutes after the event, which was 10°C above the projection from data prior to the event (straight black line).
PTFE-3 Grease
Grease prepared with sub-micron PTFE-3 was tested with a load ramp at 3 kg/min. In test PTFE-3-a (Fig. 12), the load was ramped up to 150 kg (50 min), maintained for 10 min and ramped down to 3 kg (110 min total). At first, friction and temperature trended smoothly with load. When the applied load was 66 kg (21 - 22 min), friction increased from 0.19 to 1.06 kg and then decreased to 0.25 kg during 20 s. The friction shift was only 0.25 - 0.19 = 0.06 kg, the friction ratio was 0.25/0.19 = 1.3, and no temperature shift was observed. A sequence of additional friction events took place on the up ramp and at 150 kg, but not on the down ramp. The average wear scar diameter was 1.41 mm, and the scar appearance was consistent with abrasive wear (see below). Some wear particles in oil were observed at the bottom of the cup. Grease was in good condition, although perhaps slightly softer.
In Fig. 13, data from the down ramp are plotted in reverse order and compared with data from the up ramp. Temperature was higher on the down ramp due to heat stored by the grease and apparatus. As the load was reduced on the down ramp, friction decreased and approached data on the up ramp. This behavior (plus wear scars, below) suggested that these friction events were related to solids entrained in contacts [5-7] and not adhesive wear [21] or starvation of contacts [20].
Fig. 12 Friction (FF, kg, ____) and temperature (T, °C/100, - - -) for test PTFE-3-a. The load was increased from 3 to 150 kg at 3 kg/min, maintained for 10 min and decreased to 3 kg.
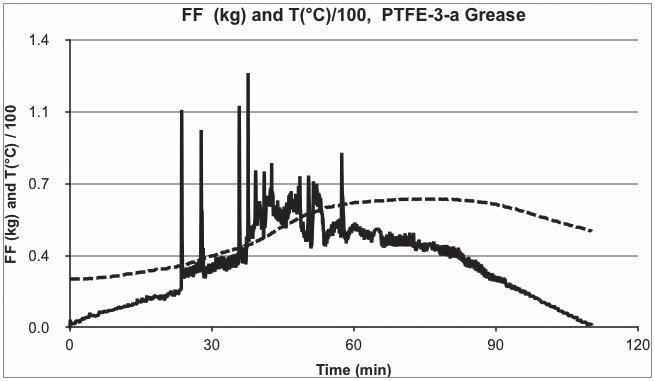
Fig.13 Friction (FF, kg) and temperature (T, °C/100) for test PTFE-3-a during up (black) and down (grey) ramps. Data from the down ramp were plotted in reverse order for comparison.
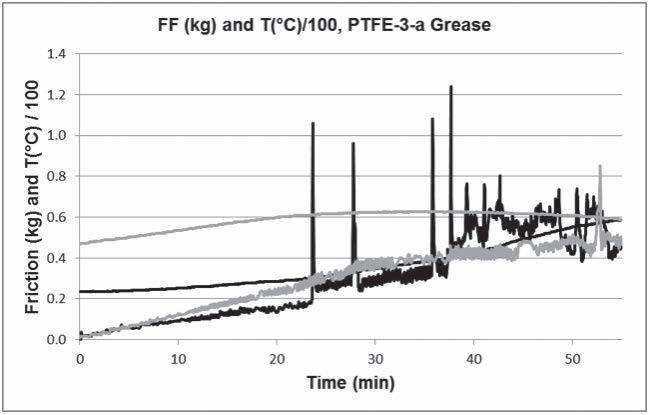
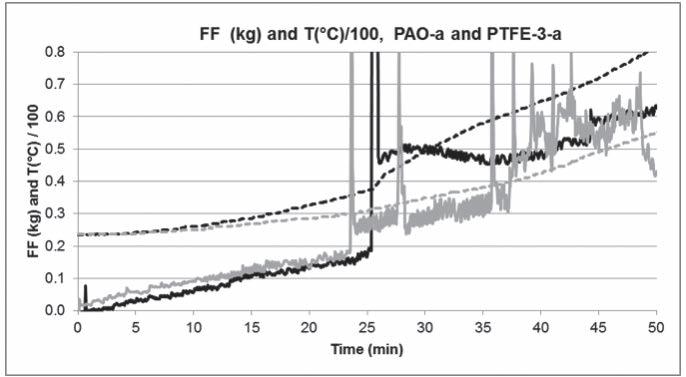
Figure 14 shows that friction data for PAO and PTFE-3 grease initially were very similar. This similarity indicated that PAO bled from PTFE-3 grease. As the load was increased, friction became higher for grease than oil. This difference may be the result of resistance from entrained solids or an artifact. Friction events occurred at 66 and 72 kg loads for grease and PAO, respectively.
A single friction event in the case of PAO was more influential than a sequence of events for PTFE-3 grease, Fig. 14. Maximum values of friction (excluding event peaks) and temperature for PAO-a were 0.84 kg and 149°C, respectively, versus 0.75 kg and 63°C for PTFE3-a. The Li12OHSt and/or PTFE solids were responsible for overall lower friction and temperature (excluding event peaks) during four-ball tests and prevented shifts in friction and temperature. Control grease was tested to identify contributions from Li12OHSt thickener in absence of PTFE.
Fig. 14 Friction (FF, kg, ____) and temperature (T, °C/100, - - -) data for PAO-a (black) and PTFE-3-a grease (grey).
Control Grease
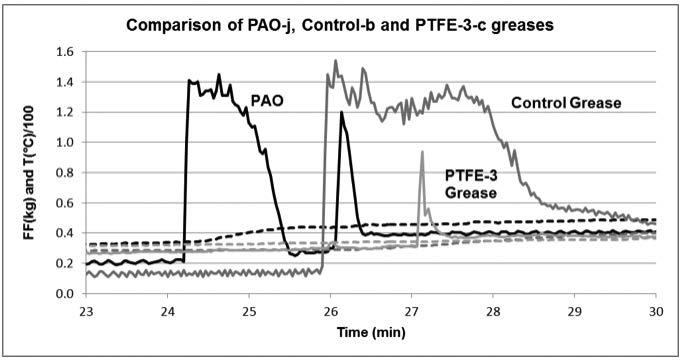
Control grease, 8/92 Li12OHSt/PAO, was tested with increasing load ramps (where significant features were observed for PTFE-3 and PAO). Figure 15 shows data for test Control-b, where the first friction event occurred at a 75 kg load. Friction increased from 0.18 to 1.54 kg, stayed high for over 2 min, and then decreased to 0.47 kg. This friction shift was 0.47 - 0.18 = 0.29 kg, and the friction ratio was 0.47/0.18 = 2.6. Approximately 5 min after the start of this event, the temperature was almost 10°C higher than projected from data before the event, Fig. 16. This temperature shift was similar to the temperature shift observed for PAO, Fig. 11. The average wear scar diameter was 3.31 mm.
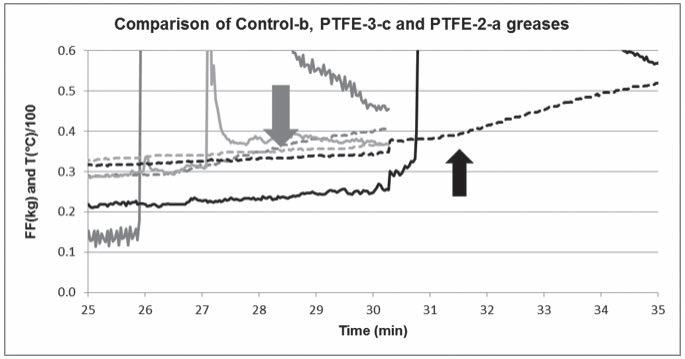
Figure 16 compares four-ball data for Control-b grease, PTFE-3-c grease and PAO-j. The dominant features – friction event peaks and duration, and friction and temperature shifts – were similar for control grease and PAO. In contrast, these features were much smaller for PTFE-3 grease. Thus, PTFE-3 powder (and not Li12OHSt) was primarily responsible for less friction, temperature and wear observed for PTFE-3 grease.
Fig. 16 Friction (FF, kg, ____) and temperature (T, °C/100, - - -) data for (left to right): PAO-j (black), Control-b grease (dark grey), and PTFE-3-c grease (light grey). Arrows indicate temperature shifts.

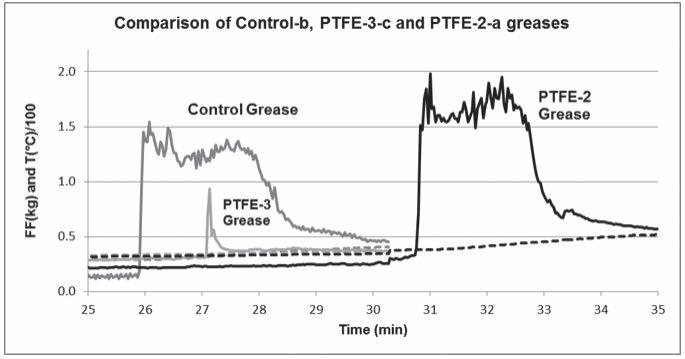
PTFE-2 grease was formulated with sub-micron PTFE-2, suitable for HX-1 registration and food grade applications. Figure 17 shows data from test PTFE-2-a where friction increased from 0.30 to 1.98 kg, remained above 1.50 for 5 min, and decreased to 0.57 kg. The friction shift was 0.57 – 0.30 = 0.27 kg, and the friction ratio was 0.57/0.30 = 1.9. The temperature shift was similar to those for PAO and control grease, Fig. 18. The average wear scar diameter was 2.90 mm, comparable to control grease.
In test PTFE-2-a, the friction event occurred at a 90 kg load, which was higher than Control-a (51 kg) and Control-b (75 kg). This suggested that PTFE-2 powder somewhat improved the load-carrying capacity relative to control grease. However, friction and temperature shifts were larger for PTFE-2 grease than PTFE-3 grease. Only one four-ball test was performed with PTFE-2 grease in this study.
Overall, these results for PTFE-2 and PTFE-3 greases are consistent with other results from the literature where specific PTFE powders significantly enhanced loadcarrying capacity of certain greases. [3-5]
Fig. 18 Friction (FF, kg, ____) and temperature (T, °C/100, - - -) data for (left to right): Control-b grease (dark grey), PTFE-3-c grease (light grey) and PTFE2-a (black) greases. Arrows indicate temperature shifts.
Wear Scars
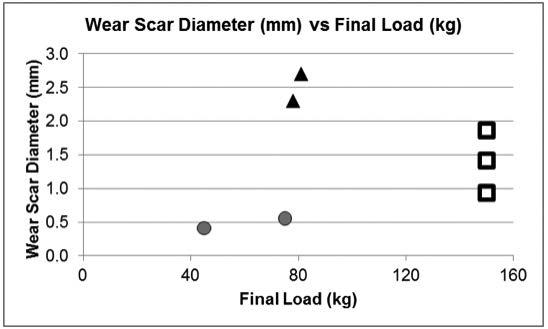
A simple experiment was performed to identify wear mechanisms during these tests. Four-ball tests with 3 kg/min load ramps were stopped at 45, 75, 78 and 81 kg loads. Wear scars were measured and photographed under a light microscope at 5x magnification, and photographs were enlarged to examine the appearance of the scars. Figure 19 shows a representative scar from PAO-f (final load 45 kg, average scar diameter 0.41 mm). These scars were round with smooth edges. For PAO-g (75 kg, 0.55 mm), scars were similar but larger than PAOf. Both tests PAO-f and –g were stopped before friction events occurred, and the appearance of these scars was consistent with abrasive wear. [21]
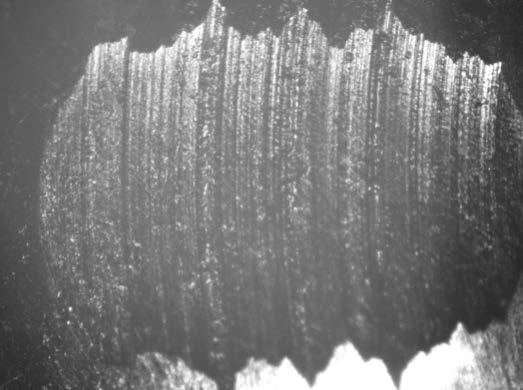
Figure 20 shows a representative wear scar from PAO-h (78 kg, 2.3 mm), which was stopped immediately after the first friction event occurred. PAO-h scars were larger and more irregular and "rugged" than PAO-f and PAO-g scars. Scars for PAO-h and -i (81 kg, 2.7 mm) were similar in appearance. Black solids were observed on one side of each scar. It appeared that these deposits were metal that softened and was displaced by the rotating ball during the test. These observations were consistent with temperature shifts following friction events for PAO and adhesive wear. [21]
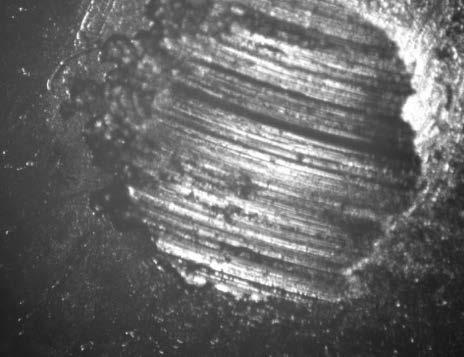
In test PTFE-3-a, the load was ramped up to 150 kg and back down to 3 kg; this test was longer (2 h) than PAO-f through –i. For scars from PTFE-3-a, there was no visual evidence of softened metal or adhesive wear, Fig. 20. The average wear scar diameter was 1.41 mm. In the direction parallel to sliding, scar size (0.93 mm) was similar to abrasive wear in PAO-f and -g, Fig.21.
The oval shape and uneven edges of PTFE-3-a scars suggested that pressure and stress concentrations may have redistributed (and/or contacts may have shifted) during this test. PTFE particles, aggregates or agglomerates can produce effects that are more localized than films. For example, Palios et al. [4] studied two types of PTFE particles (diameters ~1 and 5 μm) in EHD (elastohydrodynamic) lubrication test rigs. They observed individual PTFE particles in contacts and elastic impressions made by particles on contact surfaces, and they concluded that PTFE particles helped support applied loads.
In the present study of PAO, a single friction event corresponded to adhesive wear and failure of the oil film to support the applied load. Before an event occurred, abrasive wear gradually increased diameters of round scars, Fig. 21. A friction event corresponded to adhesive wear, which was relatively brief (~30 s) but substantially increased scar diameters. For PTFE-3 grease, wear scars and no temperature shifts showed that PTFE-3 powder prevented adhesive wear and helped support loads. A reasonable explanation for friction events is that PTFE-3 was entrained in contacts on up ramps (as loads increased and gaps narrowed) but not down ramps, consistent with observations.
Fig. 19 Enlarged photograph of a magnified scar from four-ball test PAO-f. This test was stopped before the first friction event. Average wear scar diameter was 0.41 mm.
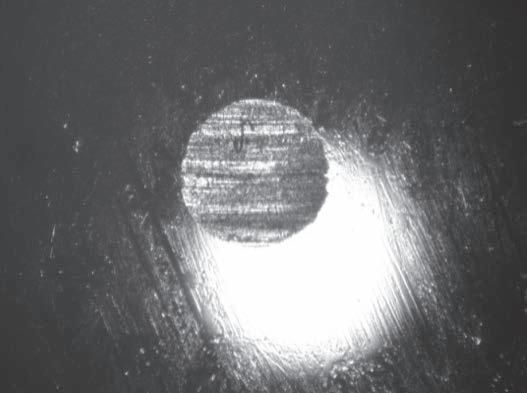
Fig. 20 Enlarged photograph of a magnified wear scar from four-ball test PAO-h. This test was stopped immediately after the first friction event. Average wear scar diameter was 2.4 mm.
Fig. 21 Enlarged photograph of a magnified wear scar from PTFE3-a (grease). Load was ramped up to 150 kg, maintained and ramped back down (about 2 h). A sequence of friction events occurred, which caused small friction shifts but no observable temperature shifts. Average wear scar diameter was 1.41 mm.
Fig. 22 Average wear scar diameter (mm) versus final load for PAO before (PAO-f and –g , grey circles) and after (PAO –h and –i, black triangles) the first friction event (adhesive wear). For PTFE-3-A grease, squares are average scar diameter (middle) and components perpendicular (top) and parallel to sliding (bottom) after a longer, more severe four-ball test (2 h, maximum load 150 kg).
PTFE-2 Liquid Dispersion
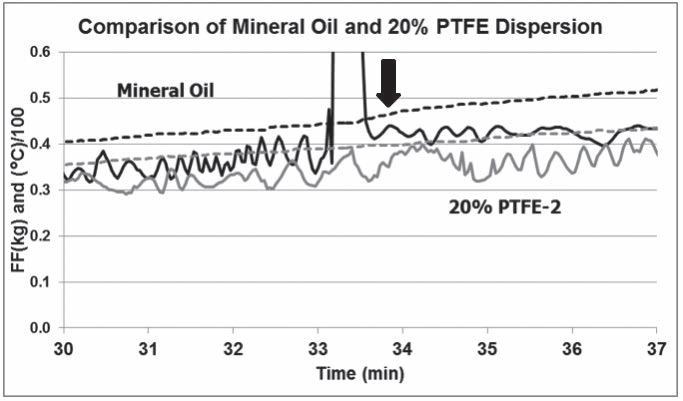
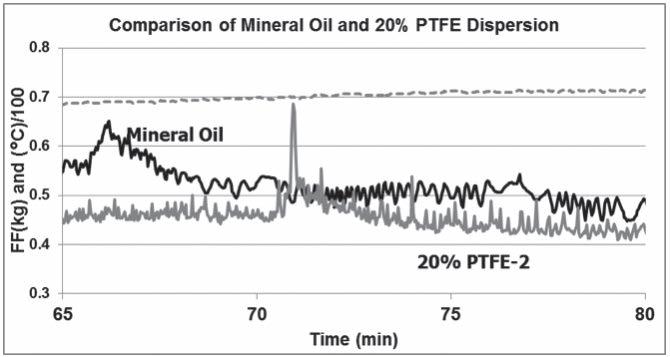
Food grade PTFE-2 powder was dispersed (20 wt.%) in white mineral oil with a polymeric dispersant. Samples from a stability test at room temperature (after approximately 6 m) and base oil were evaluated with the four-ball procedure used for greases and PAO.
For test Mineral oil-A, Fig. 23, a friction event was observed at a 99 kg load. Friction increased from 0.37 to 2.13 kg and then decreased to 0.42 kg. The friction shift was 0.42 – 0.37 = 0.05 kg, and the friction ratio was 0.42/0.37 = 1.1. A temperature shift was observed, Fig. 24. This event plus friction and temperature shifts resembled data for PAO that were caused by adhesive wear.
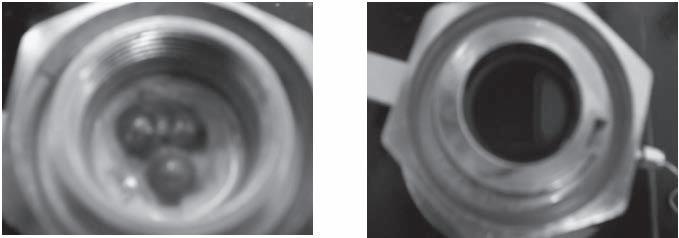
In test 20% PTFE-2 dispersion-A, no events were observed on the up ramp, Fig. 23. The largest fluctuation occurred on the down ramp, and it did not shift friction or temperature, Fig. 25. The average scar diameter was 1.04 mm, and scars resembled abrasive wear. There was no evidence of adhesive wear. Photographs in Fig. 26 show that wear particles blackened mineral oil but not PTFE-2 dispersion. According to FTIR data (not shown), mineral oil did not oxidize during this test.
In this liquid dispersion, PTFE-2 prevented adhesive wear and helped support applied loads.PTFE-2 did not provide these benefits in grease, Figs. 17 and 18. A reasonable explanation is that the dispersion and mobility of PTFE-2 were better in the liquid than in the grease. Better PTFE-2 dispersion and fewer solids entrained in contacts could also explain observations of friction fluctuations instead of events, Fig. 23. Different results for PTFE-2 in these liquid and grease formulations demonstrate that dispersion is critical to performance of PTFE additives in lubricants and greases.
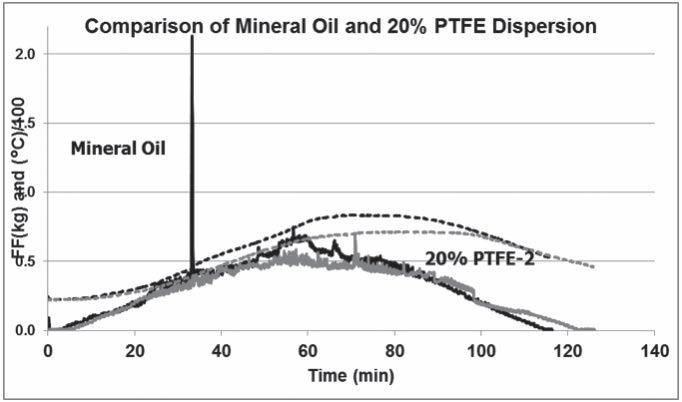
Fig. 26 Wear particles blackened mineral oil (right) but not PTFE-2 liquid dispersion (left).
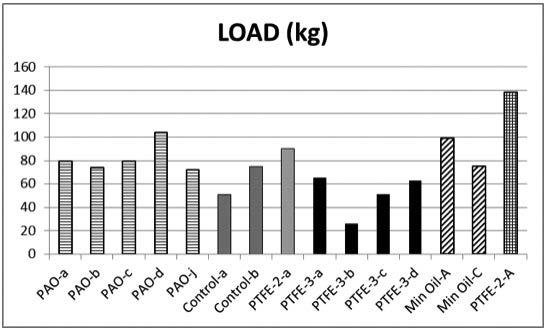
Friction events for PTFE and control greases, a liquid dispersion and two base oils differed clearly from artifacts of start-up and run-in (from 3 to 15 kg load). Figure 27 shows the applied load at the start of each event. Loads were smaller (26 – 90 kg) for PTFE-3 grease than for PAO (72 – 104 kg). In the case of PTFE-3 grease, events were caused by entrained PTFE that helped support loads. For PAO, events corresponded to film failure and adhesive wear.
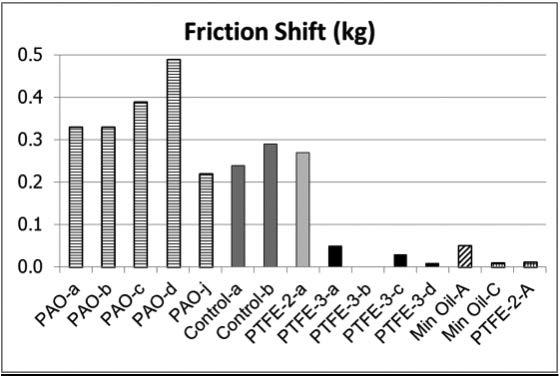
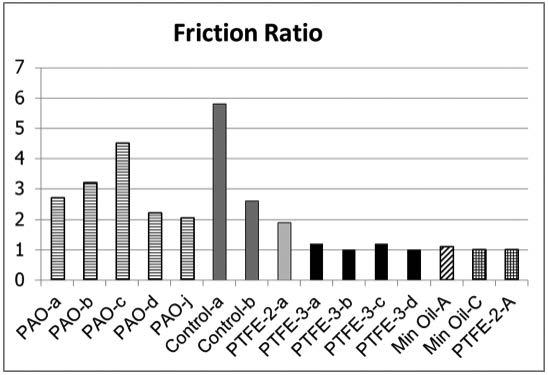
Values of the friction shift (friction after – friction before an event) in Fig. 28 show benefits of PTFE. For PAO, friction shifts were between 0.3 and 0.5 kg because adhesive wear damaged contact surfaces. For PTFE-3 grease, friction shifts were much smaller because PTFE protected contacts from damage. Values of the friction ratio (friction after/friction before) convey the same information, Fig. 29. Results for control grease and PTFE2 grease were similar to PAO and not PTFE-3 grease. Additional replicate tests are needed to better compare mineral oil with this PTFE-2 liquid dispersion.
Fig. 27 Applied load (kg) that coincided with the first friction event in each test
Conclusions
PTFE is useful as an anti-wear additive in grease provided it is dispersed adequately. Performance depends on PTFE grade, grease formulation, milling and tribology test procedures. In four-ball friction and wear tests, benefits of PTFE were most easily observed when run-in effects were avoided by gradually applying the load.
Seven experimental PTFE powders were formulated and milled in simple lithium greases based on PAO oil. All seven powders (4% by weight) slightly softened grease relative to control grease but did not alter NLGI grade (2) or detract from storage stability.
Sub-micron PTFE powder significantly improved lithium grease lubrication by preventing adhesive wear and limiting friction, temperature and abrasive wear at loads up to 180 kg. Results indicated that PTFE was entrained in contacts and helped support applied loads.
Food grade PTFE powder improved friction, temperature and wear in a liquid dispersion in mineral oil. In simple lithium grease based on PAO, this particular grade of PTFE was less effective, possibly due to dispersion. Specific PTFE powders provide significant lubrication benefits that depend upon dispersion as well as lubricant formulation.
Four-ball friction and wear tests provided useful information about grease lubrication. The most meaningful results were obtained using load ramps to avoid run-in effects. Monitoring friction and temperature data was used to distinguish between abrasive and adhesive wear, and between film failure versus entrainment of solids in sliding contacts.
Acknowledgements
The author gratefully acknowledges Shamrock Technologies, Inc. for supporting this experimental project and providing the opportunity to present this paper at NLGI’s 81st Annual Meeting, June 14-17, 2014, Palm Beach Gardens, FL.
References
[1] NLGI, Lubricating Grease Guide, Fourth and Fifth
Editions, National Lubricating Grease Institute, Lee’s
Summit, MO, USA, 1996 and 2009.
[2] ASTM D2266 Standard Test Method for Wear
Preventive Characteristics of Lubricating Grease (Four-Ball Method), ASTM International, West
Conshohocken, PA, USA.
[3] ASTM D1894, Standard Test Method for Static and Kinetic Coefficients of Friction of Plastic Film and
Sheeting, ASTM International, West Conshohocken, PA, USA.
[4] Rudnick, L.R., Ed., Lubricant Additives: Chemistry and Applications, Second edition, CRC Press, Taylor and Francis Group, Boca Raton, FL, USA, pp. 181-2.
[5] Palios, S., Cann, P. M. and Spikes, H. A., Behaviour of PTFE Suspensions in Rolling/Sliding Contacts,
The Third Body Concept, D. Dowson et al., Editors,
Elsevier Science B.V., 1996.
[6] Wan, G.T.Y. and Spikes, H.A., The Behaviour of Suspended Solid Particles in Rolling Sliding
Elastohydrodynamic Contacts, STLE Transactions, 31, pp. 12-24, 1987.
[7] Jia, Z. and Yang, Y., Composites Part B:Engineering,
Vol 43, Issue 4, June 2012, pp. 2072-2078.
[8] International Organization for Standardization,
ISO 4406:1999(E) Hydraulic fluid power – Fluids – Method for coding the level of contamination by solid particles.
[9] Aswath, P., Patel, K., Munot, S. and Elsenbaumer,
R.L., Development of a High Performance Low
Molybdenum Disulfide Grease, Paper #0530,
Presented at the NLGI 72nd Annual Meeting, San
Antonio, TX, USA, 2005.
[10] Krawiec, ST., The influence of polymers fillers in a grease lubricant, Archives of Civil and Mechanical
Engineering, Vol. VII, No. 4, pp. 121-128, 2007.
[11] Fish, G. and Ward Jr., W.C., Extreme Pressure
Performance of Greases: Testing and Additive
Solutions, Paper #1002, Presented at the NLGI 77nd Annual Meeting, Bonita Springs, FL, USA, 2010.
[12] Herrero, F., Fish, G. and Ward Jr., W.C., Extreme
Pressure Performance of Greases: Testing and
Additive Solutions, Presented at the 23rd ELGI Annual General Meeting, Paris, France, 2011 and published in Eurogrease 1, 36-48, 2012.
[13] ASTM D2596 Standard Test Method for
Measurement of Extreme-Pressure Properties of
Lubricating Grease (Four-Ball Method), ASTM
International, West Conshohocken, PA, USA.
[14] Ballester, E., Sui, Manshi and Fillion, C., Effect of PTFE Particle Size on Wear and Coefficient of
Friction, Paper #0025, Presented at the NLGI 68th
Annual Meeting, Asheville, NC, USA, 2000.
[15] Moon, M., PTFE for Lubricating Grease, Extended
Abstract, Presented at the Society of Tribologists and Lubrication Engineers National Meeting,
Orlando, FL, USA, May, 2014.
[16] NSF International, Ann Arbor, MI, USA, www.nsf. org.
[17] ASTM D217 Standard Test Methods for Cone
Penetration of Lubricating Grease, ASTM
International, West Conshohocken, PA, USA.
[18] Sayles, R. S. and Macpherson, P. B., Influence of
Wear Debris on Rolling Contact Fatigue, in Rolling
Contact Fatigue Testing of Bearing Steels, STP771,
J. J. C. Hoo, Editor, ASTM International, West
Conshohocken, PA, USA, 1982.
[19] Moon, M., Taking Lubricant Cleanliness to the
Next Level, Gear Solutions Magazine, June, 2009. (available at www.gearsolutionsonline.com)
[20] Lugt, P.M., Grease Lubrication in Rolling Bearings, John Wiley & Sons Ltd, West Sussex, UK, 2013.
[21] Bayer, R. G., Mechanical Wear Fundamentals and
Testing, Second edition, Marcel Dekker, Inc., New
York, NY, USA, 2004.


