20 minute read
Grease Color Properties - HunterLab ColorFlex Testing


Andrew Heimer Chemtool Inc. - A Division of Lubrizol, a Berkshire Hathaway Company Rockton, Illinois 61072 USA | NLGI Technical Paper #1803
Abstract
Color contributes to the first impression upon viewing a grease product or sample. Although grease color does not provide specific technical benefits, it is an important indicator of grease quality from the perspective of many customers. Off-colored products typically lead to customer complaints and loss of confidence in the manufacturer/supplier. Currently, grease color is evaluated in a subjective manner by a simple visual appearance test. Due to the subjective nature of human vision and various light sources, grease color is perceived differently by each observer.
This subjectivity leads to inconsistent approval or rejection of products during manufacturing. This study evaluated the Hunter ColorFlex instrument as a means to quantitatively measure grease color and replace subjective visual appearance tests for quality control of product color. This instrument measures color based on 3 parameters: light vs dark (L), red vs green (a), and blue vs yellow (b). These color data points are utilized to set up quality control standard parameters that allow for simple pass/fail testing of grease color. Implementation of quantitative grease color testing removes subjectivity, increases efficiency in matching product color, and eliminates product color concerns.
“If one says ‘red’ - the name of color - and there are fifty people listening, it can be expected that there will be fifty reds in their minds. And one can be sure that all these reds will be very different.” Josef Albers
Introduction to Color
Color is an important feature of any product in the marketplace. A product’s color delivers the first impression of that product to an existing or potential customer. Although a product’s color does not typically impart any performance properties, it is used frequently as an indicator of product quality by end users. Off-color products are deemed not fit-for-purpose causing customer concern. A grease falls prey to the same color concerns as any other product in the marketplace. When a grease is off-color, it is viewed as potentially contaminated or missing a component in the formulation, thus driving the decision to reject the product. For the grease industry, finding a method and instrument that can consistently determine product color can eliminate customer concerns based upon color.
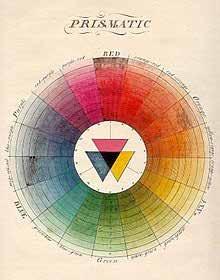
Prior to discussing how to test a product’s color, we first need to establish a basis of how color is perceived. Color theory has developed substantially over the years. Dating back to Pythagoras, Aristotle, and Plato, color has been a topic of discussion and research for a long time. In the 18th century, Moses Harris proposed the Color Wheel as an attempt to demonstrate how all colors are composed of the “primary” colors: red, yellow, and blue (RYB). RYB theory proposed that different mixtures of these 3 primary colors result in all other possible color variations. This became the basis for color vision theories, which were an attempt to explain the fundamental principle of sight. The RYB color vision theory was refined further to include “complementary” colors or contrasting blends of primary colors towards the middle of the 18th century (Figure 1).
In the early 19th century, explanations of how human eyesight functioned began to reshape color theory. The trichromatic theory, or YoungHelmholtz theory of color vision, stated that there are 3 color receptors in the human eye that are responsible for producing color and therefore eyesight. This idea was proposed initially by Thomas Young in 1802 and stated that the eye contained photoreceptor cells. These photoreceptor cells were sensitive to different wavelengths of light in the visible spectrum (400700 nm). Hermann von Helmholtz expanded this idea in the mid-1800’s to state that photoreceptor cells are sensitive to different wavelengths of light: short-wavelength (blue), medium-wavelength (green), and long-wavelength (red). The brain interprets color based upon the strength of each wavelength that contacts the photoreceptor cells. Through experimentation, Helmholtz showed that humans can match colors when adjusting 3 wavelengths of light (red, green, blue), but they cannot match colors with only 2 wavelengths of light.
Researchers did not discover the 3 photoreceptors responsible for vision until more than 70 years after the Young-Helmholtz theory was proposed. These receptors are more commonly referred to as short-wavelength cones, middle-wavelength cones, and long-wavelength cones.
Alongside the trichromatic theory, the opponentprocess theory was proposed by Ewald Hering in 1878. The opponent process theory states that vision is produced by 3 different receptor complexes in the eye: red-green, blue-yellow, and black-white complexes. Hering proposed this theory as he noted that there are colors the human eye does not perceive. Stated differently, the eye cannot see a bluish-yellow color as only blue would be detected and not yellow. The opponent-process theory functions through positive or negative neurological responses. Blue creates a positive response, whereas yellow produces a negative response on opponent neurons. These responses are produced by the various wavelengths of light. Although each theory appears to contradict the other, both theories are utilized to explain human vision. The trichromatic theory is the response to color at the receptor level in the eye, whereas, Hunter Color theory was developed by Richard Hunter in 1938. This theory provided the basis for the Hunter L a b color space proposed in 1948, which was later refined to become the standardized CIE L*a*b* color space in 1976. Hunter color theory was developed based upon the principles of the opponent-process theory. The Hunter L a b and CIE L*a*b* color spaces are 3-axis graphs with the red-green complex on the x-axis, blue-yellow complex on the z-axis, and black-white complex on the y-axis (Figure 2).

Figure 2 Image courtesy of HunterLab
The L*a*b* color space utilizes L* for the lightness/ darkness value, a* for the red/green value, and b* for the blue/yellow value. An L* value of 100 is perfectly white, whereas an L* value of 0 is perfectly black. Positive a* values refer to red, and negative a* values refer to green. Positive b* values are in the yellow region, and negative b* values are in the blue region of the color space.
This color space allows for perceived color to be converted to numerical values. Measuring color with a colorimeter relies on 3 requirements: a white light source (standard illuminant), an object to be measured, and a human observer (standard observer). Quantifying color in a consistent and accurate manner requires all 3 to be standardized.
The International Commission on Illumination (CIE) introduced the A, B, C, D, E, and F standard illuminants in 1931. The purpose of these standard illuminants is to provide a means of representing different light sources using a table of numbers of energy vs wavelength. A, B, and C represent average incandescent light, direct sunlight, and average daylight, respectively. Illuminant D represents a different phase of daylight, E is an equal energy illuminant, and F represents different fluorescent light sources (Figure 3). CIE advises that all colorimetric calculations requiring representative daylight utilize Illuminant D65, which is a standard light source developed by CIE. The standard illuminants allow for the white light source to be standardized across colorimetric calculations.
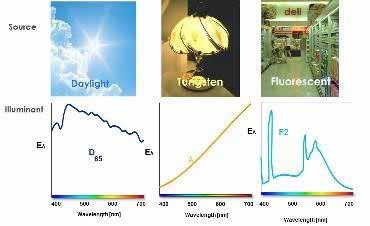
Figure 3 Image courtesy of HunterLab
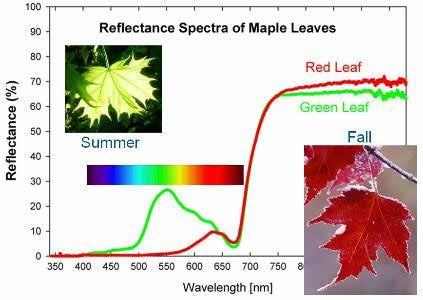
Quantifying an object to be measured isa relatively simple task, as humans use a diffraction grating within spectrophotometers to separate light into its individual wavelengths. Objects will modify light by absorbing or reflecting various wavelengths of light. Humans perceive the reflected light as the color of the object. A colorimeter operates in the same manner and uses reflected light to produce a reflectance spectrum. The reflectance spectrum can then be utilized in colorimetric calculations. Figure 4 shows an example of a reflectance spectrum of leaves during different seasons of the year. During summer, the leaves reflect more light in the 500-600 nm wavelength range, making them appear green. In the fall season, leaves begin to reflect light in the 600-700 nm range and reflect almost zero wavelengths below 550 nm, making them appear red. The reflectance spectrum makes it possible to quantitatively measure the color of an object based on calculations using the wavelengths of reflected light.
The final requirement for colorimetric calculations was the standard human observer. Some experimentation was necessary to determine how to accurately standardize human observers. In 1931, CIE developed the so-called 2° standard observer. When developing the 2° standard observer, CIE conducted experiments to quantify the ability of the human eye to perceive color. A participant was asked to look at a white screen through a hole allowing for a 2° field of view (Figure 5).
Figure 5 Image courtesy of HunterLab
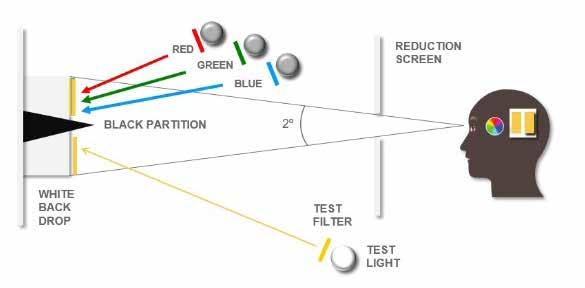
A black partition was placed in the middle of the screen and ½ of the screen was illuminated by a test light. The test light included a filter so that the screen would show a certain color. The participants adjusted 3 primary colored lights, red, green, and blue, to match the test light color. The 2° field of view was chosen as it was understood, although incorrectly, that the response of a human eye to color was contained within a 2° arc inside the fovea. The fovea (part of the retina) has the highest concentration of photoreceptor cones in the human eye.
Once it became known that receptor cones extended further than a 2° arc, the standard observer experimentation was repeated with a 10° field of view in 1964. Color perception with a 10° field of view showed higher intensity across all three primary colors, red, green, and blue (Figure 6). In the figure below, the dotted lines show the 10° standard observer color perception in comparison to the 2° standard observer depicted by the solid lines. CIE recommends the 10° standard observer for colorimetric calculations as it closely correlates to average human visual perception.
ColorFlex colorimeters from Hunter Associates Laboratory, Inc. (HunterLab), Reston, VA, USA utilize all three of the above standards, the white light source, object to be measured, and the standard observer, as a means of measuring color and calculating numerical values. The numerical calculation produces CIE tristimulus color values of x, y, and z (Figure 7).
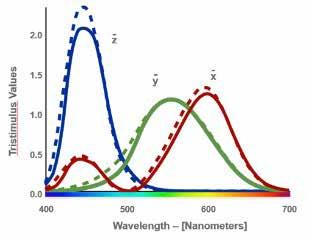
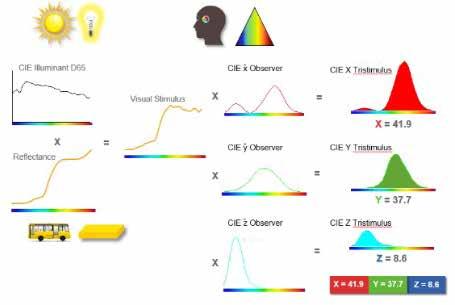
Figure 7 Image courtesy of HunterLab
The tristimulus values are calculated by multiplying the standard illuminant by the reflectance spectrum, which produces the average visual stimulus. The visual stimulus is then multiplied by each of the red (x), green (y), and blue (z) standard observers producing the CIE tristimulus x, y, and z color values. The tristimulus values can be converted to either Hunter L a b or CIE L*a*b* values with simple mathematics. The reasoning behind moving from x, y, z color values to L*a*b* is due to the simplicity of understanding the color scale and to better represent color differences in terms of saturation and hue. The CIE tristimulus values do not capture saturation or brightness. Utilizing L*a*b* allows for the calculation to provide values that simulate human vision on a scale that is easily understood. Figure 8 compares the tristimulus scale to the L a b scale.
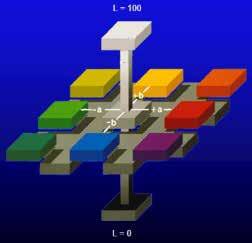
Figure 8 Image courtesy of HunterLab
Grease Color Measurement
The grease industry is currently without any quantitative method for determining the color of a grease. The oil industry relies on ASTM D1500 Standard Test Method for ASTM Color of Petroleum Products. D1500 provides an ASTM Standard color scale with a rating scale of 0.5-8 in 0.5 increments. The observer compares the sample versus the standard in a two-field or thee-field viewing instrument. This method works well for oil samples that range from colorless to dark brown; however, it does not address the multitude of available grease colors. ASTM D1500 also requires that the sample be translucent, so that light can illuminate the sample for the observer. This causes a concern for greases as some products are not translucent due to the thickener system and/or solid additives such as graphite or molybdenum disulfide.
For grease, the only method available is a qualitative appearance test which requires storing physical color standards of each product. The NLGI Lubricating Grease Guide Sixth Edition states “that a lubricating grease in an opaque container can be observed under reflected light from a position approximately perpendicular to the surface. Colors of lubricating greases are best described in terms of the predominant hue such as amber, brown, green, red with a qualifying adjective describing intensity in terms of light, medium, or dark.” But this qualitative color test is too subjective for lot to lot comparisons. Variations in raw materials, QC technicians, lighting, age of color standards, and grease containers all play a role in how the color of a grease is observed visually. Humans also perceive color differently based upon age, gender, stress, fatigue, and mood. These variations can cause the color of a grease to drift away from the true standard color of the product. Removing the subjectivity in color testing is the goal behind ColorFlex testing and equipment.
The ColorFlex produces color values using either Hunter L a b or CIE L*a*b* units. The instrument allows for different standard illuminants and either the 2° or 10° standard observer. The recommendation for testing greases with a ColorFlex is to use standard Illuminant D65 and the 10° standard observer. Figure 9 shows the ColorFlex screen as seen in the Chemtool QC lab setup for D65/10° and reporting values in L*a*b*. The instrument does allow for either the illuminant or the observer to change; however, these test conditions are optimal for the closest match to human color perception.
The ColorFlex instrument operates by emitting a flash of white light onto the sample’s surface. The sample reflects light back to the spectrophotometer, which generates the reflectance spectrum. The recommended ColorFlex setup is either a 45°/0° or 0°/45° directional geometry. Directional 45°/0° geometry is illuminated at a 45° angle to the sample and the spectrophotometer is at 0° or perpendicular to the sample surface. Directional 0°/45° geometry is the exact opposite. Illumination occurs at 0° or perpendicular to the sample surface and the spectrophotometer is at a 45° angle to the sample surface. Figure 10 displays the directional geometries.
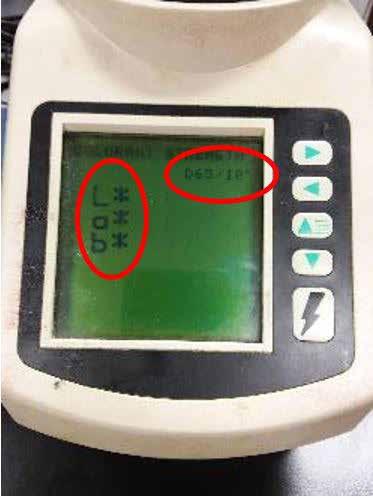
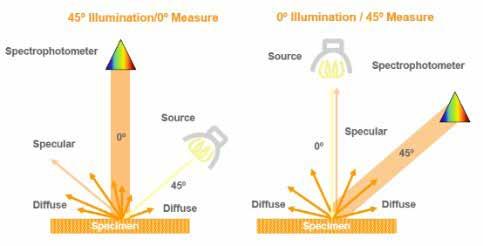
Figure 10 Image courtesy of HunterLab
The directional geometry is critical to proper color measurements as this geometry avoids the specular reflection from the sample surface. Specular reflection is more commonly referred to as gloss. When shining a light onto any surface, specular reflection causes a glossy sheen that distorts color for the observer. Most observers tilt the surface or the light source to eliminate this specular reflection and observe the true surface color. The 45°/0° and 0°/45° directional geometries are purposefully designed so that the specular reflection is not included in the colorimetric measurements. The ColorFlex test can be described as a QuEChERS method or quick, easy, cheap, effective, rugged, and safe. ColorFlex testing requires a sample size of 25-30 grams of grease when using disposable Petri dishes as sample containers (Figure 11). The test is non-destructive, and test time is approximately 2-3 minutes including sample preparation.
Calibration
Any piece of lab equipment is useless without proper calibration. The ColorFlex instrument calibration is quite simple. The instrument is supplied with 2 NIST traceable standard tiles: white and black. These white and black tiles have specific L*a*b* values and are used as references when the instrument is recalibrated. Calibration is a straightforward process that takes approximately 1-2 minutes. Instrument calibration frequency can be done on a time schedule or after a set number of samples are analyzed. Between calibrations, the instrument is also supplied with a green tile that can be used to check that it is within specification.
Sample Preparation
After calibrating the instrument, the sample must be prepared for measurement. Preparing a sample for measurement requires that the sample be: • Prepared in the same, repeatable manner • Representative of the entire product • Placed into a clear and colorless container, free from scratches or surface obtrusions • Between 76-78°F (25°C +/-0.5°C) • Free from entrapped air
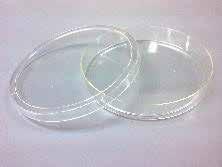
Figure 11
Disposable Petri dishes are suitable sample containers due to being clear and colorless. A round, flat Petri dish measures 60 mm x 15 mm and is composed of polyethylene, which allows for optical clarity. Petri dishes with other diameters can be used so long as the sample viewing port on the instrument is fully covered by the sample.
Depth of the sample container should be a minimum of 10 mm. The test requires that light be reflected from the sample and back to the detector. A sample container that is thinner than 10 mm allows light to pass through the sample, which produces inconsistent measurements. Petri dishes deeper than 10 mm allow for enough sample to reduce the light escaping through the grease. Exceptional care should be taken when storing Petri dishes as their surfaces can become scratched. Once its surface has become scratched, a Petri dish can no longer be used as a sample container because the scratches will distort light, thus invalidating the test results.

The simplest means of filling a Petri dish with grease is to use a small, flat bladed spatula. Similar to filling an ASTM D217 worker cup, care must be taken when

Measuring Color
The sample in a Petri dish is centered over the sample viewing port so that the test can begin. The sample viewing port must be completely covered by the Petri dish in order to obtain valid test results. After running the test, a report (Figure 12) is generated. Figure 12 contains multiple elements that can be evaluated after completing a test. The ColorFlex report contains the L*a*b* color space in the top right, data table with L*a*b* values in the top center, the sample name on the far left, and the reflectance spectrum at the bottom. As previously stated, physical grease color standards are typically required to be maintained for qualitative color tests. In Figure 12, a red rectangle is placed over the L*a*b* color space. The rectangle represents the minimum/maximum a*b* values that a sample can be within and still meet the intended color specifications. Again, the a* value represents the red/green axis, and the b* values represents blue/ yellow axis. The L* value parameter is represented by the black/white bar to the right of the color space. Minimum/maximum L* values are shown as red lines on the black/white bar. The physical color standard can be replaced by the L*a*b* specifications, ensuring the batch meets the intended color parameters every time. Individual sample test runs are depicted by a small red or green dot.
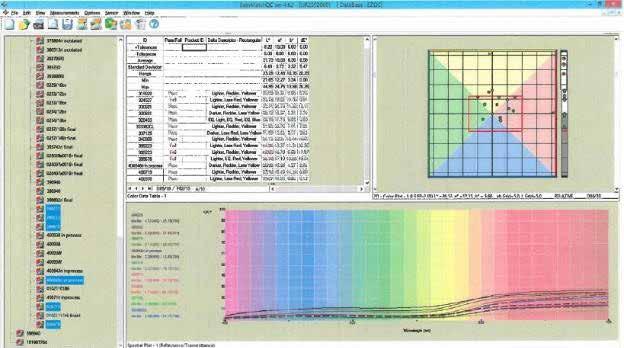
Figure 12 Image courtesy of HunterLab
Effect of Air on Grease Color
Figure 13 compares a sample with minimal air (left) and a sample that was purposefully aerated (right) to show the effects of entrapped air on color. The entrapped air sample has a significantly higher L* value showing that air causes the sample to become much lighter in color. Along with a higher L* value, the a* and b* values also increase, making the aerated sample appear in the yellow region of the color space while the sample without air is in the blue color space. Likewise, the air pockets increased the a* value and moved the sample color towards the red region of the color space.
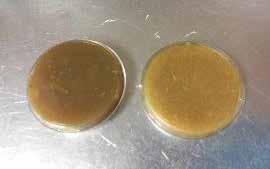
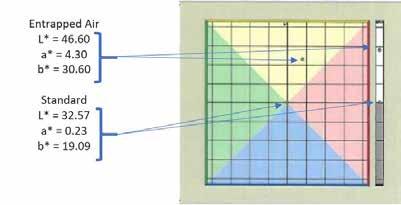
Figure 13
Effect of Temperature
When testing grease color, samples should all be held at the same temperature. The color of a grease typically becomes darker as it cools. This appears to be a function of the grease’s density. Cooler grease has a slightly higher density than warmer grease. As the density of the grease increases, its color becomes more concentrated, and it is darker. Following ASTM D217, it is recommended to test all grease samples for color at 76-78°F (25°C +/-0.5°C). This allows for simplicity in testing because as a grease is cooled prior to performing ASTM D217, a small amount of cooled grease can also be utilized for color testing. Figure 14 shows the difference in L*a*b* values of a grease at 77°F (right) and at 180°F (left). In this study, 180°F (82°C) was chosen as an example test temperature simply to showcase the effect temperature has on grease color.
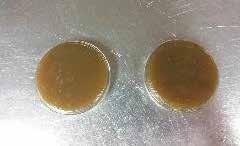
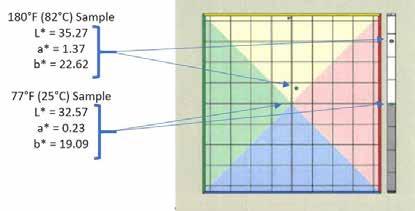
Figure 14
Quality Control
The standard for this product has the following QC specification ranges: L* 0-18.26, a* 4.25-28.59, and b* -4.64 – 4.86. For a sample to pass the ColorFlex test, every value must be within these specified ranges. If a value falls outside of a range, the sample fails the test and does not match the intended standard color. Figure 15 displays two red greases that appear to the eye to match in color. When tested on the ColorFlex instrument, the sample on the left (Sample 1) failed the L* value by being too light. The small dot placed in the ColorFlex color space turns red upon measuring a result outside the standard specifications.
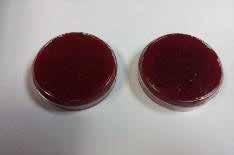
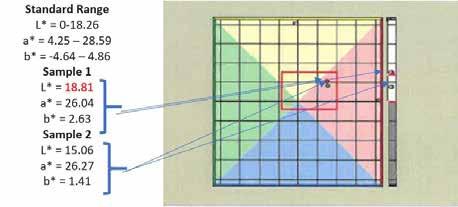
Figure 15
Figure 15 displays a scenario that has a high likelihood of occurring in grease production. A batch of grease is produced and is measured to be too light in color. With this information, the manufacturer can adjust the color of the batch prior to packaging. In the above case with Sample 1, the manufacturer would add an extra, small portion of red dye. The extra red dye treat would bring the batch further down into the red region of the color space. Extra dye would also darken the batch, bringing the L* value within the standard specifications. After the addition of the extra dye, the batch would be sampled and tested again with the ColorFlex. If the batch passes, it would be approved. The above scenario works well when a grease is too light in color. If a product is too dark due to processing or raw material issues, another approach may be necessary.
Conclusions
This study delivers reasons for the grease industry to adopt the ColorFlex as a standard method for testing grease color. ColorFlex instruments are simple to set up, run, and calibrate, relatively maintenance free, and low cost. This system is currently in use by Quality Control at Chemtool, Inc.
A ColorFlex has been used to adjust the color of in-process production batches to meet the required color specifications at Chemtool. Utilization of this equipment has reduced customer color concerns and cases where product was returned simply based on color issues.
When a color concern arises, it can be handled using objective L*a*b* data rather than subjective visual data provided by the customer. The L*a*b* report can be shared with a customer, outlining the product meeting the standard color specifications. Objective measurements with the Colorflex system remove the ambiguity a customer may have when viewing products.
When an entire portfolio of products has objective L*a*b* specifications, customer color concerns should become nonexistent. Eliminating concerns based upon color would allow the grease manufacturer to focus on other processes without having to use resources to resolve quality concerns based on product color.
Acknowledgements
The author gratefully acknowledges Saurabh Lawate and Jeff St. Aubin for their help and support of this study.
Works Cited
Harris, Moses. The Natural System of Colours. Edited by Faber Birren, Whitney Library of Design, 1963.
HunterLab Associates. “Hunter ColorFlex Basic of Color Theory.” 2015.
HunterLab Associates. “Application Note 1002.01 Standard Observer.” 2015
HunterLab Associates. “Application Note 1005.00 Hunter L,a,b versus CIE 1976 L*a*b*.” 2012
International Commission on Illumination. ISO 11664-4:2008( E )/CIE S014-4/E:2007 Colorimetry – Part 4: CIE 1976 L*a*b* Colour Space. Edition 1. November, 2018. International Commission on Illumination. ISO 11664-2:2007( E )/CIE S014-2:2006 Colorimetry – Part 2: CIE Standard Illuminants for Colorimetry. Edition 1. October, 2007.
Nave, Carl R. “ The C.I.E. Color Space.” HyperPhysics, Georgia State University, 2017, hyperphysics.phy-astr.gsu.edu/ hbase/vision/cie.html#c2.