

(Joint NLGI/ELGI Working Group)

2025

Contributing Members:
Andreas Dodos, Eldon’s SA
Anuj Mistry, Fuchs Lubricants Co
Chris Pether, Afton Chemical Ltd
Faizan Rabbani, SKF
Melissa Quinn, Castrol Germany GmbH
Olav Hoeger, Shell Global Solutions Deutschland GmbH
The members of the aforementioned working group have realised that the presence of particles in a formulated grease can affects its performance. These particles are not always deleterious and in some cases are desirable for enhancing the performance of the lubrication product.
The presence of particles in a grease is also important for bearing manufacturers (industry end users) as it has been documented that they will affect the noise level of a bearing as well as the effective service life.
There are a number of existing methods used by grease manufacturers as well as end users that are summarised in this paper. Some of these methods consider the particle count and/or size and some evaluate the potential of particles to cause harm to a lubrication system.
It is important to be able to quantify the number of particles in a lubricating grease so as to be able to evaluate the performance of the said grease in a given application. Regardless, if the particles are qualitatively characterised as deleterious based on proven methods, the total amount of particles and particle sizes could affect operational parameters such as filterability of the product. Even softer particles that do not cause damage in a say metal to metal contact application could potentially create build up in system elements, such as filters, that can potentially lead to a forced starvation of lubrication and potential failure. The prevention of such failures is critical in large scale industrial applications as for example surface mining, where external contamination can be a major cause of concern.
The source of particles in a formulated grease will vary from raw material or environmental contamination, process equipment wear, specific process parameters and in some cases these can be part of the thickener system used or part of the additive system used to enhance performance characteristics. During the studies carried out by the working group thickener systems such as polyurea or calcium sulphonate exhibited larger and more frequent particle encounters than lithium thickened greases. Also heavily compounded formulations containing MoS2, graphite or other solid particles again were found to contain more particles.
METHOD METHOD DESCRIPTION PRINCIPLE
ASTM D1210 Standard Test Method for Fineness of Dispersion of PigmentVehicle Systems by Hegman-Type Gauge”
ASTM D1404 / D1404M Standard Test Method for Estimation of Deleterious Particles in Lubricating Grease
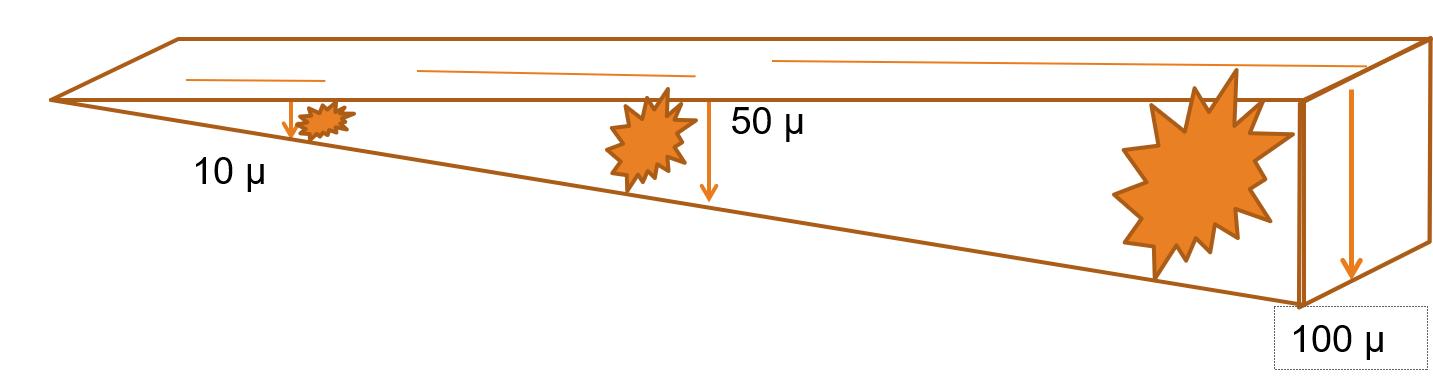
The procedure used in the paint industry to measure pigment distribution starts with a narrow trough precisionmilled from 0 to 100 microns. A small amount of grease is forced into the length of the trough using a stainless-steel gauge held at a 45˚ angle. If particles in grease are larger than the depth of the trough at any given point, they are caught by the gauge and dragged along leaving a track in the grease.
The number of arcshaped scratches are counted that appear on highly polished acrylic plates when 0.25 g of grease is forced between the two plates and stressed under 200 PSI pressure in a circular motion for 30° relative to each other.
ASTM D7918 Standard Test Method for Measurement of Flow Properties and Evaluation of Wear, Contaminants, and Oxidative Properties of Lubricating Grease by Die Extrusion Method
Involves FTIR, RDE Metals Spectroscopy, RULER, Analytical Ferrography, Rheology, Colorimetry, moisture, microbial content and particle counting. Most recent additions to the ASTM standard include moisture by ppm utilizing the VaporPro® Technology and grease particle counting.
FTM 3005 (FEDSTD-791 Method 3005)
Dirt Count of Greases
A microscope slide coated with test grease at a specified uniform thickness is covered with a cover glass and examined under a microscope. Particles are measured and counted.
SUMMARY
Size of the particle is determined by where the track stops. The total number of tracks correlate to the total number of particles. Particles will leave tracks behind in the grease until they can roll under the straight edge of the gauge. Due to differing widths of the troughs, the results need to be normalized to the width of the trough or the volume of the grease. This test method has a potential for quality control and transferring clean greases into application grease holding tanks.
Number of scratches obtained cannot be used to draw fine differences between greases, but rather, to group them into two or three general classes; sample size = 20 g This test method is used for quality control and specification purpose
This test method covers the determination and evaluation of flow properties, wear levels, contaminants, and oxidative condition of new and in-service lubricating grease. This test method provides guidance on evaluating in-service grease samples, NLGI grades 00 to 3, for wear, consistency, contamination, and oxidation; Sample size= 1 g Multiple areas of application and condition monitoring
Number of particles from 25 to 75 micrometers, 75 to 125 micrometers and greater than 125 micrometers per ml of grease. Method determines the size and concentration of opaque, or dark body, particles in grease. (Translucent and other semi-opaque particles
DIN 51813 Determination of Solid Matter Content of Lubricating Greases (particle sizes above 25 micrometers)
Def Stan 05-50 (Part 39) Used to measure graphite particles present in grease
500 grams of grease are passed through a 25 micron mesh. The residue is collected from the screen and the grease portion is dissolved. The remaining portion is passed through a filter and particles of 25 microns and larger are weighed and reported.
A sample of the grease is boiled under reflux with a solvent. The mixture is then filtered through a sintered glass crucible and the solids retained are weighed. Sintered glass crucibles are available (to BS 1752) in a range of pore sizestypically from 160μm to 5μm.
cannot be distinguished from the structure of the grease)
Sample size=5 g. Environmental contamination, raw materials, debris.
A passing result is less than 20 mg of particles greater than 25 microns per kilogram of grease. The weight of solid particles per kilogram is reported. Sample size = 2000 g Mechanical engineering, Commercial vehicle/agricultural/construction machinery industry, Automotive and automotive supply industry.
Only suitable for graphite particles
SKF BeQuiet+ Hardness and size of particles is such that over-rolling leads to permanent damage, resulting in increased overall noise and reduced bearing fatigue life. The rig is able to measure the specific disturbances caused by over-rolling of particles, called vibration peaks
Analytical Ferrography Solid debris suspended in a lubricant is separated and systematically deposited onto a glass slide.
This is an automated test stand that injects grease in a deep groove ball bearing (type 608 at 1800 RPM). The bearing is run in for 15 seconds, and then tested with an acceleration transducer measuring three energy ranges. High bands (1,800 – 10,000 Hz) are the best measure of disturbances which may be caused by particles in the grease.
The slide is examined under a microscope to distinguish particle size, concentration, composition, morphology and surface condition of the ferrous and non-ferrous wear particles.
Table 1 existing methods
The BeQuiet+ is also recommended to bearing producers as a means of selecting the best lubricant on the market and for incoming batch control, and to end-users as a way to verify the lubrication quality in service
No particle size or metallurgy limitations. Wear can be documented by digital photography.
To the knowledge of the working group members all currently available methods are quite time consuming, analytically intensive and difficult to use as a quality control method during production or application of the grease.
ASTM D1210 examines the number and size of solid particles in a sample using a Hegman Gauge, but the procedure is based on experience from the paints industry and it does not specifically consider the needs of grease manufacturers.
As discussed previously, ASTM D1404 exists to examine the ability of particles to do damage and gives the operator some guidance of categorising greases into bands according to the number of particles detected. This procedure requires minimal set up cost, is quick to run, but gives little in the way of insight.
The ASTM D7918 test method covers the determination and evaluation of flow properties, wear levels, contaminants, and oxidative condition of new and in-service lubricating grease using a die extruder. Although giving lots of insightful information, this procedure is more costly to set up and run and does not give the quick results that the Hegman and deleterious materials procedures offer.
The FTM 3005 method is a microscopic method that counts particles of different sizes. This can be challenging to the operator and some particles can be missed if they are translucent or similar colour to the grease.
DIN 51813 measures the mass of particles greater than 25 microns in a sample of grease, by passing it through a 25 micron sieve. This procedure offers us a pass/fail threshold (<20mg of particles in 2000g grease) but offers no further insight into the size distribution or nature of the particles.
Similarly, Def Stan 05-50 (Part 39) filters the grease, but this time through a sintered glass crucible following solvent reflux. Unlike DIN 51813, the crucibles are available in a range of pore sizes, and so can be dialled in to look at particles of desired size. Ultimately this procedure is limited as it only looks at Graphite particle content.
One standout test, the SKF BeQuiet+ offers a close to real-life measurement of noise reduction through grease cleanliness. It achieves this by running the grease in a bearing and measuring noise outputs between 20 and 10,000Hz. Although not directly measuring the size and number of solid particles in the grease, this test measures the noise reduction benefits of a cleaner grease which readily translates into both bearing life improvement, and operator environment improvements.
Lastly, the Analytical Ferrography procedure looks at both ferrous and non-ferrous particles that have been separated from the grease medium. This procedure offers no pass/fail criteria but can be useful as the operator can target the types of particles that they are looking to examine.
Although all the above procedures have a valuable position in the grease industry, in the view of the grease producer looking for a quick quality control check that determines whether they should release a grease batch or put it through further milling, it is the opinion of this group that the ASTM D1210 Hegman Guage procedure could be expanded and shaped into a procedure more specific to greases. The benefits would be that it is low cost to set up, low cost and quick to run, and offers enough insight to serve its purpose as a quality check procedure. Such a procedure could also offer similar benefits as a pre-use quality check for lubrication engineers prior to grease application.
Test Method Description
ASTM D1210 Hegman Gauge
ASTM D1404/D1404M
Estimation of Deleterious Particles
ASTM D7918 Die Extrusion Method
FTM 3005
(FED-STD-791 Method 3005) Dirt Count of Greases
DIN 51813
Determination of Solid Matter Content
Def Stan 05-50 (Part 39) Graphite Particles
SKF BeQuiet+ SKF BeQuiet+
Analytical Ferrography
Table 2 comparison of existing methods
Hegman Gauge – New Method Creation
A survey was conducted in 2022 gathering feedback from NLGI and ELGI members to see if the topic of grease particle evaluation was of interest. The answer was a resounding yes. The top concerns highlighted were the size and number of particles present as well as the ability to do damage. The latter is covered by ASTM D1404, however a quick, easy and cheap method for determining the size and number of particles is still needed.
The members of the Joint NLGI/ELGI Working Group started discussing the Hegman gauge as a potential method for use with greases circa 2004. Prior to this, it had mostly been used in the paint industry under test method ASTM D1210 as well as finding use in the food and cosmetics industry. Many grease manufacturers are already using the Hegman gauge for internal quality control despite the lack of an official method to date.
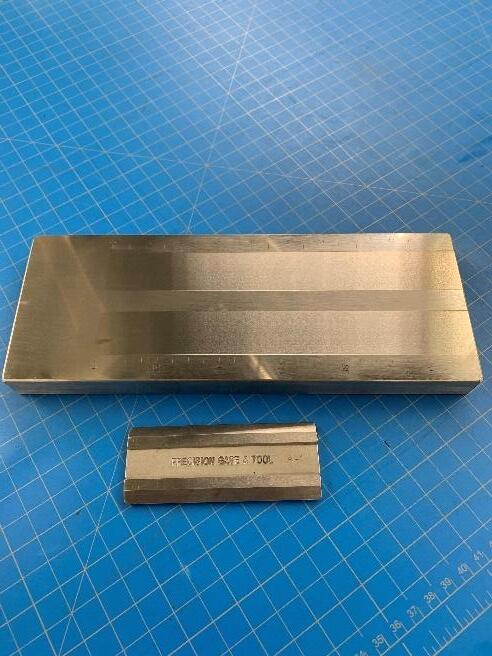
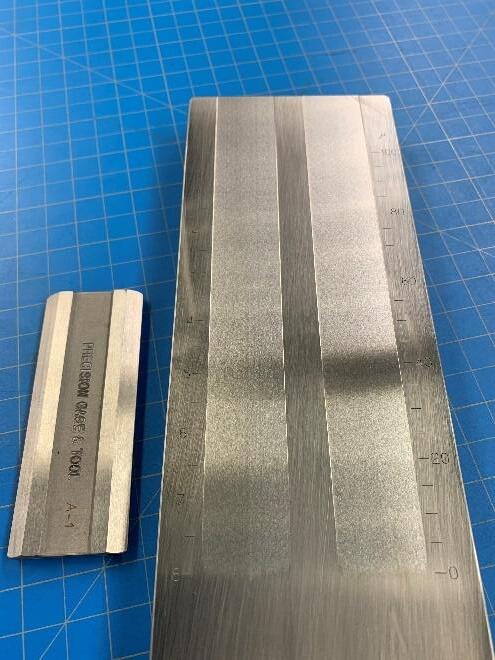
The concept is that as grease is drawn along the troughs of the Hegman gauge, particles leave tracks behind in the grease until they can roll under the straight edge of the gauge corresponding to their size. These tracks or scratches can then be counted at the various increments on the gauge to determine the size and quantity.
Multiple round robin testing programs have been run over the years which has led to the firming up of the criteria for running the test. The round robins have been made up of NLGI and ELGI member companies and have shown that repeatability is strong, however there are still issues with reproducibility. Commercially available grease samples are used, with some then spiked with “Arizona Test Dust” to accentuate the particles for the purpose of the trial only. One of the common problems to come out of the round robins is agreeing on what scratches look like and how to count them.
In these earlier round robins, the way of reporting the results was to count scratches that end in each size range. The size of the particle is determined by where the scratch ends, so this made sense. The numbers were then converted to a rating – A, B or C depending on the number of scratches.
This process was done at the size ranges 15 – 25-microns, 26 – 50-microns, 51 – 80-microns and >80-microns to give a four-letter code. In earlier RRs, 26 – 80-microns was one range however it was deemed to be too broad and split into two. <15-microns is also not included after feedback from OEMs.
In the final round robin run in 2024, participants reported the "break" in density of scratches rather than where they exactly stop (ie look at 20-micron line and count how many scratches cross that line).
To run the test, a dollop of grease is put on the shallow end of the trough and drawn along by a metal scraper held at an 80-to-90-degree angle working towards the deep end. The draw should be done smoothly and without stopping. The grease can be pulled toward the operator or pushed away but always starting at the shallow end. To evaluate the grease, starting at the shallow end, the number of scratches that are visible in the surface of the grease are counted at each of the increments of 20, 40, 60, 80 and 100-micron. The test is run in triplicate.
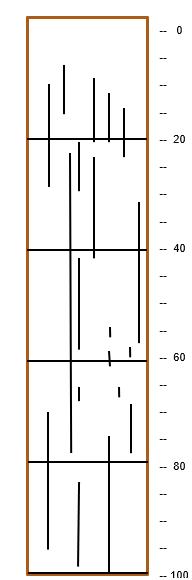
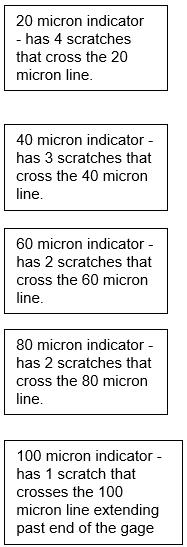
Figure 3: example of how scratches are reported
The number of scratches was reported as opposed to converting to a letter rating as done previously. Discussions within the working group concluded that the use of a letter code could led to a drive for “A” greases and that the method could be misinterpreted and added to specifications for cleanliness. That’s not the aim of this method – it is designed to be a quick and easy way determine the size and quantity of particles in the grease some of which may be in the grease by design.
Outcomes of these round robins include:
• The standardisation of the test equipment to be used:
o Gage No. 6254
§ 1 x 6.25 inches, 0 to 100 microns, 2 tracks
§ Other models okay as long as dimensions are identical.
o A-1 Scraper
§ 1/4 x 1-1/2 x 3-3/4"
§ Two edges with .015" radius making line contact. For 1-1/2" through 31/2" gages.
• Identification of the best way to conduct the test – direction of use (start at shallow end) and optimal angle for the scrapper (80-to-90-degree angle).
• What does and doesn’t qualify as a scratch – the bottom of the trough should be visible in a scratch as well as have some finite length
• What is counted – scratches that cross the increment lines
Each of the methods which were mentioned earlier describes in one way or another the possibility to determine particles in lubricating greases and some of their properties. Some of the methods are time-consuming, requiring a larger amount of grease, some of the test devises are expensive to purchase and maintain or require a laboratory environment to perform those.
The Hegmann Gauge method for lubricating greases is an alternative, that can be carried out very easily, no matter where you are, whether it is in a manufacturing plant, grease laboratory or on the customer side e.g. in a factory, in a mine or in a workshop. Very simple with a small amount of grease and this is the nice feature, only a couple of grams, sufficient to get a first impression of the grease.
The standard Hegmann Gauge which is recommended in the evaluated methodology measures between 0 and 100 µm with the dimensions 1 inch x 6.25 inches and has 2 tracks.
A bigger gap size up to 250µm is commercially available and can be adjusted on purpose, depending on the application and the information you are looking for. Feedback from users, such as the bearing industry, indicated particle sizes above 100 µm are not for big interest, so it is important to select the right range.
Regarding particle sizes, the laboratory studies have shown that the interpretation of the scratches can end in misleading conclusions. Particles leave tracks behind in the grease until they can roll under the straight edge of the gauge. Due to differing widths of the troughs, need to normalize results to width of trough or volume of grease. Very short scratches, which are looking like a spot, are an indication for air in the grease. The working group has decided
that only scratches with a length >1mm are counted as a particle. Repeatability was good: ~62% among the participating labs got identical result on blind duplicate samples. Reproducibility was not good, varied from sample to sample.
In several laboratory studies it was observed that some greases were difficult to count, the high number of scratches and color of the greases were identified as a possible route cause for a poor repeatability or even worser in reproducibility, problems showed up more with white and darker color greases. E.g. black or white greases showed reflections on the surface and the greases with a high content of solid particles were extremely hard to count. Statistical statements on the quantity of particles and their sizes were hard to make. The round robin results showed unsatisfying data on reproducibility.
Evaluation of executed laboratory studies has shown that the technique and the way you do the test, can have an impact on the test result. Angle of the scraper, technique of scraping and the speed can have an impact. The best practice is now shared with the community in a you tube video link on the NLGI webpage https://www.youtube.com/watch?v=Rh5xIPrSyIw
The working group has decided to continue with the work, completing the final lab round robin and based on the results a recommended practice or an ASTM standard will be published.
Despite some limitations of the Hegman Gauge method, the potential user could use a simple, fast and inexpensive method. Simple statements about the size and number of particles can be made. Unfortunately, it is not possible to make any statements about the type and properties of the particles.
The adoption of the Hegman gauge method previously described as a standard test for the grease industry depends on the level of accuracy (repeatability and reproducibility) of the grading system mentioned earlier. If future findings suggest that the accuracy falls within the acceptable limits for the standardisation of the method, it is the opinion of the authors that the members of ASTM subcommittee D.02 should consider developing a standard, based on the aforementioned findings.
Alternatively, since the Working Group has, over a number of years, identified a field of applicability for this method as an internal and external quality control method, it would be in the best interest of the industry to develop an official recommended practice so that there can be common consensus regarding the use outside any commonly agreed precision statement.
In either case, the members recognise that the aim of the said Working Group has been achieved and any further work in terms of standardisation should be carried out within the scope of the subcommittee D.02 of ASTM. To all extent and purposes, the members managed to identify and document a usable methodology, fit for purpose that is generally accepted by the industry representatives participating.
All available sources for evaluating the effects of particles in grease have been documented and examined thoroughly both through literature studies as well as a number of round robin exercises covering the required amounts of freedom specified by international standards and have documented a substantial correlation between samples analysed.
Grease particle analysis is an important area of lubricant technology, contributing significantly to the quality control and optimization of industrial processes and machinery. While there are many methods available for evaluating grease particles in a sample, the Hegman gauge method is one of the most commonly used. However, this method lacks reproducibility due
to the subjectivity of human observations and interpretations. There is, therefore, a need to improve the accuracy and objectivity of grease particle analysis methods to ensure reliable and standardized results.
In response to this need, we propose a novel image processing technique to detect grease particles in a way that is more standardized and reproducible. This method involves taking a picture of the sample that has been tested through the Hegman gauge, which can be done using a standard camera. The resolution of the picture can be set to a specific standard. This image is then processed using edge detection techniques in the Python programming language to create an accurate outline of the grease particle track.
The edge detection algorithm
Suppose you have an image of a tiger, and you want to detect the edges in the image using edge detection algorithms. The edge detection algorithm will identify the pixels where a significant change in color or brightness occurs and will create a binary image. The binary image will have white pixels representing the edges and black pixels representing the background.
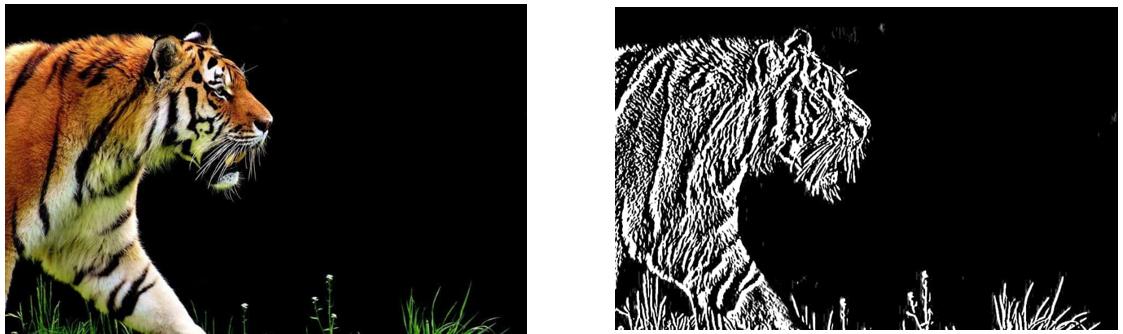
Figure 4 An example of edge detection of the image using open CV image processing library [credits: https://learnopencv.com/edge-detection-using-opencv/]
In the first image, the tiger is realistic and high-contrast that displays color values ranging from light to dark. There are no specific edges that stand out in the image, and the image looks smooth.
In the second image, we have applied the edge detection algorithm to the original tiger image in a grayscale format. The algorithm detects the edges using the change in luminosity between pixels by creating a binary image. The binary image is darker with jagged edges that show where the changes in color and brightness occur. These regions include lines along the tiger's fur, whiskers, eyes, and nose, representing the edges in the original image.
The second image, with the detected edges, is less smooth since the algorithm highlighted the areas where the image's color or intensity varies. By processing the image using edge detection techniques the data in the image can be extracted to provide further analysis such as tracking of features and boundaries for future implementation.
Overall, edge detection algorithms are useful tools that can help to extract critical information from images. By detecting edges and creating binary images, patterns can be extracted from seemingly random noise in the picture, and more information can be extracted for further analysis.
Extending image processing to grease particle analysis
The example of edge detection applied to the tiger image can be related to edge detection as a method for detecting grease particles in lubricant samples. Just as the tiger image has features with varying densities and luminosities that can be detected and extracted using edge detection algorithms, grease particles embedded in a lubricant sample will have variations in density, luminosity, and shape that can be similarly detected and extracted using edge detection. The resulting binary image created after applying the edge detection algorithm to the sample will clearly display the grease particle tracks and their physical details, such as width, depth, and distribution, just as the second image showed the edges of the tiger features. By using edge detection as a grease particle analysis method, the extracted information can be used for lubricant optimization and quality control purposes. It will also eliminate potential subjective variations across observer in traditional analysis techniques.
Advantages of using image processing for grease particle evaluation
There are several advantages of using such a method if combined with the existing methods that are being used in the industry. If combined with a quick method, such as Hegman Gauge,
it would instil concrete objectivity into delivering the results that are need of the grease industry across all usage platforms.
• Objective Analysis Results: Image processing techniques eliminate subjective human observations or interpretations, ensuring the analysis results are more standardized and reliable, regardless of who performs the analysis.
• Improved Quantification and Detail: Image processing techniques offer the potential for more in-depth analysis of grease particles, providing detailed information about particle width, track depth, and the distribution of widths and lengths of the tracks. This level of detail can help optimize lubricant formulations and improve overall product performance.
• Mobile Use: Image processing techniques can be integrated into a mobile app, making it easy to utilize in the field and allowing for speedy and convenient grease particle analysis, without the need for specialized equipment or laboratory facilities.
• Consistency: Image processing techniques, if calibrated correctly, can provide consistent and reproducible results across test sectors, enabling better understanding and consistency of the analyzed grease samples.
• Improved Analysis Efficiency: By providing standardized and objective results, image processing techniques can significantly reduce the analysis time and increase the efficiency of the analysis process, reducing overall cost and improving quality control measures.
Challenges of using image processing for grease particle analysis
While image processing techniques offer significant benefits for grease particle analysis, there are also several challenges associated with using these techniques, particularly with respect to variations in color, texture, and composition of grease samples. Here are some challenges that can arise when using image processing techniques for grease particle analysis:
• Texture variation: Grease samples can have varying textures that may make it difficult to obtain a consistent, uniform image suitable for processing. Some textures may mask grease particles, making them less detectable than they would be in a smoother surface.
• Color variation: Grease samples may also have varying colors, which can lead to color distortion, making it difficult to achieve color uniformity across images. This may result in inaccurate or inconsistent detection of grease particles.
• Sample size: The size of the grease sample can also pose a challenge when using image processing techniques, as a smaller sample size can result in fewer particles, making it harder to detect and analyze grease particles accurately.
• Interference: Grease samples may contain other particles or impurities that can interfere with the accuracy of the image processing technique if they are not recognized accurately. This can lead to false readings of the grease particles.
• Resolution: Low or variable resolution of images is another challenge that can affect the accuracy of the image processing techniques. It can lead to variations in the levels of noise and details captured in the images making it difficult to extract meaningful particle data.
Despite these challenges, with appropriate resolution standards and well-crafted algorithms the image processing technique can be an objective and standardized method that allows for particle analysis across the industry. Interference with particle detection could potentially be eliminated by using image classification models that can recognize and differentiate outer impurities from particles of interest. Texture and color variations can be managed by applying uniform constants across the extracted data for every particle analysis. Therefore, careful calibration of algorithms and the use of appropriate statistical analysis will improve the accuracy of image processing techniques in grease particle analysis.
In summary, the proposed image processing technique for grease particle analysis offers a standardized and reproducible method that eliminates the inconsistencies associated with traditional methods. It also offers increased quantification and can be easily used on mobile devices, making it more accessible and convenient for lubricant professionals. Overall, we believe that this new method holds great potential for advancing grease particle analysis and optimizing lubrication processes in a wide range of industries.