The LSESU Actuarial Society is the largest actuarial student society in London. Throughout the years, our society has built upon its successes and advanced our mission to educate the actuaries of tomorrow Education and connection are the key value proposition that the LSESU Actuarial Society brings to its members As part of our broader strategy of looking into the future, we strive towards providing more professional development resources, opportunities, and actuarial insights for our members. Additionally, we seek to expand our coverage on emerging actuarial trends by hosting diversified events to further extend our reach on topics outside of the traditional actuarial professions.
We organise talks and workshops to raise commercial awareness among our members about pensions and insurance while exploring the way actuaries respond to challenges in this ever-evolving world with endless possibilities. There are various opportunities to ask seniors and alumni about their experiences working in actuarial placements, and providing members with advice about internships is also one of the great services our society can offer
Additionally, we host networking events that connect students directly with industry professionals, providing them with the opportunity to foster relationships that are essential for career development We are committed to providing our members with memorable experiences and insights about Actuarial Science, and most importantly, ‘Equipping the Actuaries of Tomorrow’.
To highlight some key successes from the 2024-2025 academic year, we proudly hosted our 12th annual Actuarial Conference at LSE, featuring the President of the Institute and Faculty of Actuaries (IFoA) as a distinguished guest. Additionally, we successfully organised our 3rd Actuarial Case Competition, supported by our sponsors and partners.
This academic year, the research division will be responsible for releasing a newsletter to members and non-members of the society Our members will get exclusive access to the newsletter a few days before public release and access to exclusive stories
Our newsletter aims to accomplish the following:
1
2 Keep readers up to date with industry changes
Our newsletter is mainly targeted towards undergraduates and postgraduates looking to join the actuarial field, but even if you don’t fall into these categories please feel free to give our newsletter a read out of personal interest.
For DC members, the rapid rate rises inflicted significant losses on the bond portions of supposedly safer lifecycle funds, a stark lesson that capital preservation is not guaranteed and that their ultimate pension is entirely exposed to market timing risk
This volatility underscores a fundamental flaw in the pure DC model: it individualises systemic financial risk
The member bears the full brunt of market downturns at the point of accumulation and the risk of locking in a pot at a time of low annuity rates at decumulation The quest for stability, therefore, is not merely a technical concern for DB actuaries but the central challenge for 21st-century retirement provision
The Demographic Pressure: The Longevity Dilemma
Simultaneously, the demographic foundation of pensions is shifting Continuous, if recently moderated, increases in life expectancy mean that retirement savings must be spread over longer periods, demanding larger pots or lower annual incomes. This "longevity risk" is particularly problematic. In a DB scheme, this risk is borne by the employer sponsor; in a standard DC scheme, it is borne by the individual, who may outlive their savings The societal dimension, an increasing ratio of retirees to workers, further strains pay-as-you-go systems and makes the cost of providing guaranteed DB pensions prohibitive
One-HitWonder:ExtremeValueTheory
In March 2011, a magnitude 9 0 earthquake struck off the coast of Japan, triggering a tsunami that even overwhelmed the Fukushima Daiichi nuclear plant. Insured losses reached a staggering amount of $35 to $40 billion, but the true shock was how these risks (earthquake, tsunami, and nuclear meltdown), which were modelled as being independent, have compounded into a single catastrophic event Fast forward to March 2023, Silicon Valley Bank (SVB), the second-largest US Bank at the time, collapsed in a matter of days. A rapid rise in interest rates eroded SVB’s bond portfolio, triggering a bank run amplified by social media and digital banking. Regulators and risk analysts failed to anticipate how quickly confidence could fall.
These are two completely different events that happened a decade apart and in different sectors. However, both share the similarity of being extreme, rare, and devastating; exposing the inadequacy of models built around averages and “normal assumption” Classical statistics involving theorems like the Law of Large Numbers and the Central Limit Theorem may tell us in detail what usually happens, but for actuaries and risk managers, it is not the average that threatens solvency but the tail. One catastrophic event is enough to truly put companies in a bind Extreme Value theory (EVT) aims to tackle this issue by implementing a rigorous mathematical framework for understanding such events.
PREDICTIVE ANALYTICS IN INSURANCE
Types of predictive analytical models
Time series models analyse data collected over time (daily, monthly, or yearly) to identify trends, seasonality, and patterns In insurance, this can help predict claim frequency during certain seasons, for example, increased motor claims in winter, or forecast demand for specific types of cover. Regression is commonly used to identify relationships between variables Insurers use regression to understand how factors such as age, location, driving history, or property value influence the likelihood and cost of claims This supports accurate pricing and underwriting decisions
What is it?
Predictive analytics is the use of statistical techniques and modelling to forecast future outcomes based on historical and current data. By analysing patterns and trends, organisations can estimate the likelihood of future events and make informed decisions In the insurance industry, predictive analytics is widely used to assess risk, price policies, manage claims, and improve customer service
What are its uses?
1 Fraud Detection
Financial institutions use predictive analytics and artificial intelligence to detect fraud by analysing historical data and patterns to identify suspicious activity. Because modern businesses generate large volumes of data, traditional analytics tools are often insufficient, making advanced predictive methods essential for accurate detection and prevention Effective fraud analytics depend on high-quality data, such as transaction records, customer demographics, and behaviour logs, which support the creation of reliable predictive models By selecting suitable machine-learning algorithms, incorporating relevant features, and monitoring models in real time, organisations can identify risks early and take proactive steps to prevent fraud
2 Pricing
In the insurance industry, predictive analytic encompasses a wide variety of technique including statistics, modelling, optimisatio clustering, and market research, to he businesses and organisations forecast futu events Actuaries working with predictiv analytics use data science tools and method to describe, predict, and recommend course of action that take into account the behaviou of consumers, providers, and distributors The are responsible for building tools for insuranc underwriters and claim reviewers, ensuring th insurance companies can meet the obligations to consumers, and maintainin public confidence in financial institutions b helping ensure that firms do not tak unnecessary risks with individuals’ savings
Benefits of Predictive Analytics
It produces more accurate risk assessment and pricing, reduces fraud and claim leakage, improves operational efficiency, better capital management and reserving, and enhances customer segmentation and personalised products. By anticipating future risks, insurers can remain financially stable while meeting policyholder obligations. For example, in 2024, Aviva detected over 12,700 fraudulent claims worth £127 million, marking a 14% increase from the previous year. The insurer also identified more than 98,000 fraudulent policy applications, nearly double the number from 2023
Drawbacks of Predictive Analytics
Despite its benefits, predictive analytics in insurance raises ethical and regulatory concerns. Some models may unintentionally lead to discrimination if they rely on biased data, particularly in pricing or underwriting decisions. Regulators closely monitor insurers to ensure fairness, transparency, and compliance with anti-discrimination laws Additionally, predictive models depend heavily on data quality and governance Poor or incomplete data can lead to inaccurate predictions and flawed decision-making. For instance, in 2022, a class-action suit brought by homeowners in Illinois who claimed that State Farm’s use of algorithms in its claims-processing methods disproportionately impacted Black policyholders, causing delays in repairs and the payment of benefits.
Conclusion
Predictive analytics has become an essential tool in the insurance industry, helping companies assess risk, detect fraud, and set fair prices. By analysing large amounts of data, insurers can make better decisions, improve efficiency, and provide better services to customers. However, it is important to use these models responsibly to ensure fairness, accuracy, and compliance with regulation.
Rising PMI Claims and Shifting Condition Profiles
What This Means for the Future of Health Insurance
The UK’s private medical insurance (PMI) market is undergoing a notable shift, driven by rising claim volumes, changes in healthcare demand, and increasing pressure on the National Health Service (NHS) As with other insurance sectors experiencing systemic strain, these developments reveal deeper structural changes in how health risks materialise, how they are financed, and how insurers must adapt PMI is no longer a peripheral benefit but is becoming increasingly central to how individuals access timely treatment With this rise, actuaries must consider how evolving utilisation patterns and condition mixes shape risk assessment in ways that traditional models may not fully capture
In 2024, insurers processed £4 billion in PMI claims, representing a 13% increase from 2023 Claims volumes continued rising into 2025, with 11.8 million invoices processed mostly from employersponsored policies, which is nearly a 4% year on year increase By 2024, 4 8 million people were covered by workplace PMI, marking the second consecutive record high and reflecting employers’ growing recognition of health cover as a strategic workforce tool
The composition of these insured groups, which are typically younger and more actively employed, has had a noticeable influence on claim patterns and utilisation behaviours across the sector
THE CHANGING CONDITION LANDSCAPE: MENTAL HEALTH, MSK, AND HIGH-SEVERITY ILLNESS
Meanwhile, cancer remains the most consequential high severity risk within PMI as it continues to be the primary cost driver in age rated schemes While clinically beneficial, advances in diagnostics and treatments are increasing claim severity and the cost of long-term care. Moreover, cardiovascular activity is also rising, with 160,000 cardiology invoices recorded in 2025, an 8% increase from 2024 These conditions require extensive diagnostics and repeated interventions, introducing further volatility to claim costs, which pose further modelling difficulties
NHS BACKLOGS AND THE SHIFT IN HEALTHCARE DEMAND
A defining driver of increased PMI usage is the sustained backlog within the NHS Elective care waiting lists in England surpassed 7.4 million people in 2025, limiting access to procedures and diagnostics for millions. As patients face prolonged delays, PMI has increasingly served as a pathway to faster diagnosis and treatment This behavioural shift is reflected in activity data: PMI funded admissions reached 171,000 in the first quarter of 2025, one of the highest quarterly totals on record
Government policy has further strengthened the link between public sector pressures and private sector utilisation To alleviate waiting lists, the NHS has expanded its reliance on independent sector capacity, which has blurred the boundary between public and private healthcare and made PMI an increasingly integral part of the UK’s health ecosystem, rather than a complementary one Simultaneously, people who have PMI are using it more frequently In 2024, 1 8 million people made a claim with workplace schemes acting as the primary driver of this 10% increase from the previous year Considering all of these factors indicates that utilisation is no longer just a function of benefit availability but increasingly of healthcare necessity
The UK’s private medical insurance (PMI) market is undergoing a notable shift, driven by rising claim volumes, changes in healthcare demand, and increasing pressure on the National Health Service (NHS) As with other insurance sectors experiencing systemic strain, these developments reveal deeper structural changes in how health risks materialise, how they are financed, and how insurers must adapt PMI is no longer a peripheral benefit but is becoming increasingly central to how individuals access timely treatment With this rise, actuaries must consider how evolving utilisation patterns and condition mixes shape risk assessment in ways that traditional models may not fully capture In 2024, insurers processed £4 billion in PMI claims, representing a 13% increase from 2023 Claims volumes continued rising into 2025, with 11 8 million invoices processed mostly from employer-sponsored policies, which is nearly a 4% year on year increase By 2024, 4 8 million people were covered by workplace PMI, marking the second consecutive record high and reflecting employers’ growing recognition of health cover as a strategic workforce tool
Preventative health initiatives are also taking greater prominence Corporate cash plans saw 14.8% growth in employee coverage, and employers offering onsite health screenings increased from 7% to 10% The long term objective is to reduce future claim severity through earlier detection, though in the short term, these benefits can increase routine claim activity
At the same time, medical inflation continues to drive up the cost of treatment, with claim severity rising across cancer, cardiovascular and digestive conditions Provider fees have also increased, with private dental fees alone rising by 9% The resulting cost pressure is feeding directly into premiums, affecting both individuals and employers and altering the affordability landscape of PMI
As PMI utilisation evolves, several actuarial considerations are becoming increasingly important
The first is the need to reassess morbidity trends: mental health, MSK and orthopaedic conditions now account for a growing share of claims affecting claim volume, while cancer remains a major driver of high severity costs affecting claim severity Data from 2025 only further underscores how changes in lifestyle, such as working patterns, are influencing morbidity in ways that traditional datasets may not capture
The second is the need to consider the relationship between PMI and the NHS As private capacity fills gaps left by the public system, such as increasingly long waiting lists, actuaries must account for drivers for PMI utilisation which originate outside the insurer’s own portfolio Product changes, including digital GP access and expanded preventative benefits, further reshape expected claim pathways
As a result, developing fluency with key healthcare datasets will be essential to tackling such challenges Sources such as the Office for National Statistics (ONS), the Association of British Insurers (ABI) and the Private Healthcare Information Network (PHIN) offer valuable insight into morbidity trends, treatment patterns and waiting time dynamics Understanding condition severity distributions, especially for high cost areas such as cancer and cardiovascular disease, as well as considering medical innovation, will be increasingly important as claims severity rises.
Additionally, the equity dimension of PMI is becoming more pronounced PMI covers approximately 14% of UK adults, rising from 6 7 million to 7 6 million between 2020 and 2024, yet most policyholders around four in five access cover through employers For individuals outside employer schemes, affordability is increasingly constrained by rising premiums and medical inflation. As these pressures continue, actuaries may contribute not only to pricing and reserving decisions but also to the development of benefit structures that balance risk based pricing with accessibility and broader societal fairness
The ongoing shifts within the UK PMI market, namely rising utilisation, changing condition mixes, and the intensifying dependence on private pathways due to NHS pressures, represent more than a temporary fluctuation. They signal a structural transformation in how healthcare is accessed and funded, which presents both challenges and opportunities for current and future actuaries. The changing morbidity landscape, the interdependence of public and private systems, and the growing complexity of benefit designs will require adaptable thinking, stronger data literacy, and a broader perspective on how insurance functions within the healthcare ecosystem
As these trends continue, actuaries will play an increasingly central role in shaping sustainable, equitable and resilient health insurance models for the future
The development of modern derivatives markets required more than trading institutions and legal contracts; it required a coherent mathematical theory of risk Prior to the 1970s, options were priced by intuition and negotiation Without a universal valuation principle, identical contracts could trade at inconsistent prices, preventing large scale participation and making systematic hedging impossible The Black–Scholes model provided a theoretical foundation by connecting stochastic processes, arbitrage theory, and partial differential equations (Black and Scholes, 1973; Merton, 1973) The model does not predict prices; it constrains them Its central contribution is to determine the only price consistent with continuous trading and the absence of riskless profit opportunities
[2] Mathematical Architecture
The Black-Scholes model represents a paradigm shift in financial economics, transforming the valuation of derivative securities from a practice of subjective intuition into a rigorous branch of mathematical physics At its core, the model’s mathematical construction is an exercise in “risk-neutralisation” the process of proving that the fair price of an option is not determined by an investor’s expectations of future growth, but by the structural requirement to prevent arbitrage in a continuous market.
[3] Limitations and Model Risk
Volatility Assumptions and Distributional Limitations
Despite its profound influence on modern financial theory, the Black–Scholes model rests upon a set of restrictive assumptions that limit its descriptive accuracy when applied to real-world markets One of the most widely criticised assumptions is that volatility remains constant over time and across all strike prices. In reality, financial markets exhibit significant variation in implied volatility, giving rise to phenomena such as the volatility smile and volatility skew. These patterns indicate that market participants assign different levels of risk to options depending on their moneyness, contradicting the model’s assumption of a single, constant volatility parameter. The inadequacy of this assumption became especially apparent following the 1987 Black Monday crash, after which deep out-of-the-money put options were priced with substantially higher implied volatilities, reflecting an increased demand for protection against extreme downside risk. This suggests that volatility is not only time-varying but also sensitive to market conditions and investor sentiment
Closely related to this issue is the assumption that asset prices follow a geometric Brownian motion, implying that log returns are normally distributed Empirical evidence, however, consistently demonstrates that financial returns exhibit fat tails and skewness, meaning that extreme events occur with greater frequency than predicted by a normal distribution Events such as the COVID-19 market crash in 2020 highlight the limitations of the normality assumption, as markets experienced rapid and substantial declines that were far more severe than the model would suggest As a result, the Black–Scholes framework tends to underestimate the probability and impact of extreme price movements, particularly in the tails of the distribution, leading to systematic mispricing of options that are sensitive to tail risk
Hedging Assumptions and Market Frictions
A further limitation arises from the model’s reliance on continuous trading as a mechanism for achieving perfect hedging. The theoretical construction of a riskless portfolio depends on the ability to adjust the hedge ratio instantaneously and continuously in response to changes in the underlying asset price However, in practice, trading occurs at discrete intervals and is subject to delays, transaction costs, and market frictions As a result, the idealised concept of a perfectly hedged position cannot be realised, and traders instead face residual risk due to imperfect hedging, commonly referred to as hedging error
This discrepancy becomes more significant in volatile markets, where rapid price movements can render previously calculated hedge positions obsolete before adjustments can be implemented Moreover, frequent rebalancing incurs transaction costs that are entirely absent from the Black–Scholes formulation, further reducing the practical feasibility of continuous hedging strategies Consequently, the model underestimates both the cost and the risk associated with maintaining hedged positions in real financial markets
The Black–Scholes model transformed finance by proving that risk can be priced through mathematical consistency Even where unrealistic, it serves as a benchmark from which more realistic models evolve (Hull, 2018). Every modern derivative model is either an extension or relaxation of its assumptions
Liquidity, Market Impact, and Overall Evaluation
In addition to the unrealistic assumption of continuous trading, the model presumes the existence of perfectly liquid markets in which assets can be bought or sold in unlimited quantities without affecting their prices This assumption neglects the role of market impact and liquidity constraints, both of which are central features of real financial systems. During periods of market stress, liquidity can deteriorate rapidly, leading to wider bid-ask spreads and significant deviations from theoretical prices The 2008 Financial Crisis provides a clear illustration of these dynamics, as large-scale deleveraging and forced asset sales contributed to sharp price declines and heightened volatility In such environments, trading activity itself can influence prices, creating feedback loops that amplify market movements.
Taken together, these limitations do not render the Black–Scholes model obsolete, but rather emphasise its role as a foundational benchmark rather than a complete representation of financial reality. In practice, the model is often extended or adjusted to address its shortcomings, for example through the incorporation of stochastic volatility or jump-diffusion processes. Nonetheless, its enduring significance lies in its conceptual contribution to financial economics, as it demonstrates that derivative prices can be derived from arbitrage principles rather than subjective expectations. Its limitations therefore serve not only as weaknesses, but also as a foundation for the continued development of more advanced and realistic financial models.
The CAPM Model
1 INTRODUCTION: THE PROBLEM OF PRICING RISKY ASSETS
When investors allocate wealth to risky assets, they do so with the expectation of receiving future returns. Since these returns are uncertain, a fundamental question in financial mathematics is: How much additional return, or risk premium, should an investor require for bearing risk?
Not all sources of risk are equally important, and therefore should not all be accounted for when determining the expected return on an asset, and consequently its price There are two fundamental ways of measuring the risks associated with an asset, which are the variance (σ ) in the asset’s returns over time; and beta (β) 2
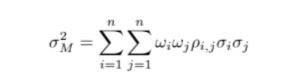
The variance captures the risk unique to an individual asset, and this risk can be diversified away through holding a sufficiently broad portfolio If we consider a portfolio with n individual assets, the formula for finding its variance, σ is given by: 2 P
2 CAPM: HOW THE MODEL IS DERIVED
Which we can then rewrite as:
where ω is the weight of asset i in the portfolio, σ is its corresponding i 2 i variance in returns, and ρ is the correlation coefficient between the returns of assets i and j Noting that Cov(R , R ) = ρ σσ , we can see that we can construct a portfolio which reduces the idiosyncratic risk. This means that we are only left with the systematic risk, which reflects economy-wide fluctuations and cannot be diversified away i,j i j i,j i j
In order to answer the above question the Capital Asset Pricing Model (CAPM) provides a precise mathematical relationship between an asset’s expected return and its exposure to systematic risk, measured by its β. We will develop the intuition behind this model and present its main equation, together with a worked example
The CAPM rests on a number of simplifying assumptions about investors and markets:
• Investors are rational and mean-variance optimisers, meaning they care only about the expected return and variance of their portfolio
• All investors share identical beliefs about expected returns, variances, and correlations
• Markets are perfectly efficient: there are no transaction costs, taxes, or restrictions on short selling.
• All assets are publicly traded and perfectly divisible
• Investors can borrow and lend unlimited amounts at the risk-free rate rf
These assumptions are strong, and their relaxation motivates many of the extensions to the CAPM discussed in Section 4.
2.2 THE MARKET PORTFOLIO IN EQUILIBRIUM
Consider a financial market consisting of a risk-free asset with return r and a large number of risky assets
In equilibrium, investors will hold some combination of the risky-free asset with returns r , and the market portfolio with returns R This market portfolio will be the same for all investors, as this will be the portfolio which is in the portfolio frontier, the set of all portfolios that have minimal risk for their level of expected return, as well as the set of possible returns from all combinations of risky assets and the risk-free asset
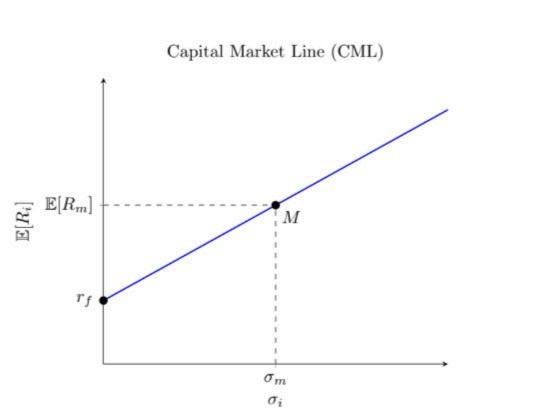
The market portfolio is also referred to as the tangency portfolio in equilibrium, since this will be where the curve for the portfolio frontier is tangent to the straight line through the risk free rate when plotting E[R ] against σ , as seen below. The precise measure of an asset’s sensitivity to the market portfolio, beta, is defined formally in the following subsection
2.3 BETA: THE MEASURE OF SYSTEMATIC RISK
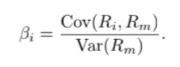
The beta coefficient is defined mathematically by:
The key properties of β are as follows:
• β = 1: the asset moves onefor-one with the market. This means that the i market portfolio has a beta of 1 by definition.
• β > 1: the asset amplifies market movements (more risky than the mari ket)
• 0 < β < 1: the asset is less sensitive to the market. i
• β < 0: the asset moves opposite the market and may act as a hedge. i Beta therefore measures only the non-diversifiable component of risk, which is the only type of risk associated with an asset or portfolio that is considered in the CAPM.
2.4 THE MAIN EQUATION
The market risk premium is the additional required return on the market portfolio as a result of bearing risk, given by E[R ] r . Since all investors will hold some weight of the market portfolio, we take this quantity, as well as the m f risk-free rate r to be constant in the following equation: f
From this, we can see that the CAPM states that the expected return for asset i is linear in the asset’s β
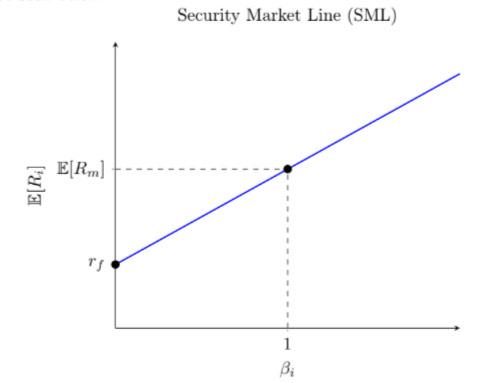
2.5 THE SECURITY MARKET
Since the SML is the graphical representation of equation (3), any deviation from it represents a mispricing relative to what the CAPM predicts, which can be seen below:
In reality, not all assets will lie on the SML, meaning they will not generate the expected return based on the CAPM We can then define the alpha for an asset i to be the extra expected return, ie, α = E[R ] ECAPM[R ]. Using this, an asset is whose expected return lies: i i i
• Above the SML is undervalued, ie. generates excess positive return and has a positive α,
• Below the SML is overvalued, ie generates excess negative return and has a negative α , From this, we can see that there would exist an arbitrage strategy for a non-zero α, so investors would adjust the weight of such asset in their portfolio in order to earn extra expected return without bearing the appropriate level of risk according to CAPM
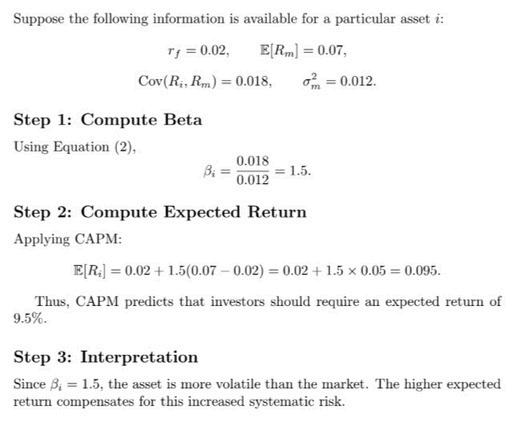
3 WORKED EXAMPLE
4 EVALUATING THE CAPM
5 CONCLUSION
The CAPM remains one of the most influential models in financial mathematics By linking expected return to covariance with the market, it establishes a mathematically elegant foundation for pricing risky assets Although empirical limitations motivate more sophisticated models, CAPM continues to serve as a benchmark in theoretical and applied finance.
• Provides a clear, linear relationship between expected return and systematic risk
• Identifies beta as the key risk measure
• Simple and widely used in corporate finance, investment analysis, and actuarial valuation
• Grounded in equilibrium arguments rather than purely statistical correlations.
• Relies on strong assumptions: identical investor beliefs, perfectly efficient markets, and mean-variance preferences.
• Empirical evidence suggests that beta alone does not capture all variation in returns.
Please take a moment to fill in the short anonymous feedback form below. It will help us improve future editions of our newsletter and tailor our content better to you. Thank you! Click here for feedback form