Connswater Community Greenway Research Toolkit: Research, Monitoring and Evaluation
Connswater Community Greenway Research Toolkit
Research, Monitoring and Evaluation
A practical guide to evaluating long-term community impact of green and blue spaces.
Acknowledgements
The research on the Connswater Community Greenway that underpins this toolkit was led by Queen’s University Belfast as part of the Groundswell consortium
The Groundswell consortium was supported by the UK Prevention Research Partnership (MR/V049704/1).
The work on Connswater Community Greenway is also supported by the HSC Research and Development Office Northern Ireland (COM/5634/20). The PARC study was supported by a grant from the National Prevention Research Initiative.
Special thanks to the EastSide Greenways charity, founded by EastSide Partnership, the vehicle for the delivery of the Connswater Community Greenway.
Fundin g statement
This work was conducted by Queen’s University Belfast. This work is supported by the UK Prevention Research Partnership GroundsWell consortium (MR/V049704/1).
Authors
Ruth Hunter, Selin Akaraci, Natalie Clewley, Tim Forsyth, Leandro Garcia, Sophie Jones, Praveena Menon, Duyen Nguyen, Niamh O’Kane, Chris Tate, Ruoyu Wang
How to cite this toolkit
Queen’s University Belfast. Connswater Community Greenway Research Toolkit: Research, Monitoring and Evaluation. A practical guide to evaluating community impact of green and blue spaces.
ISBN: 978-1-913643-43-0
Copyright statement
This toolkit was created by Ruth Hunter (Queen’s University Belfast) and Nifty Fox Creative in 2026, as part of a project which was funded by UK Prevention Research Partnership (MR/V049704/1). The copyright in this toolkit belongs to Queen’s University Belfast and it can be used under the Creative Commons CC BY-NC-ND license. If you wish to modify this toolkit or use this toolkit for commercial purposes, please get in touch with ruth.hunter@qub.ac.uk to discuss the terms of a license.
Introduction
Welcome to the Connswater Community GreenwayResearch, Monitoring and Evaluation Toolkit.
This toolkit provides a practical guide for anyone completing an interdisciplinary, long-term evaluation of multifunctional green and blue spaces.
There is no need to start from scratch. We want to help you successfully research and evaluate your space. Use our toolkit to benefit from 15 years of practical insights gained from our community embedded work in the UK.
Find out about the research methods we successfully applied.
The Connswater Community Greenway has become a living laboratory for co-production, where residents, policymakers, designers, and researchers have shaped a landscape together through dialogue, experimentation, and care.
“ We are committed to ensuring green and blue spaces are safe, accessible, and inclusive. Having the ability to spend time in outdoor public spaces has direct and indirect benefits on physical and mental health such as increased physical activity, access to nature, and social connectedness. Enjoying green and blue space is part of being human.”
Researchers from Queen’s University Belfast (QUB) developed this toolkit.
Effective evaluation of urban green and blue spaces relies on strong partnerships and co-production with local communities. The Connswater Community Greenway (CCG) research programme that underpins the toolkit involved collaboration between QUB, EastSide Partnership, Belfast City Council, academic institutions, funders, and community organisations.
The Connswater Community Greenway
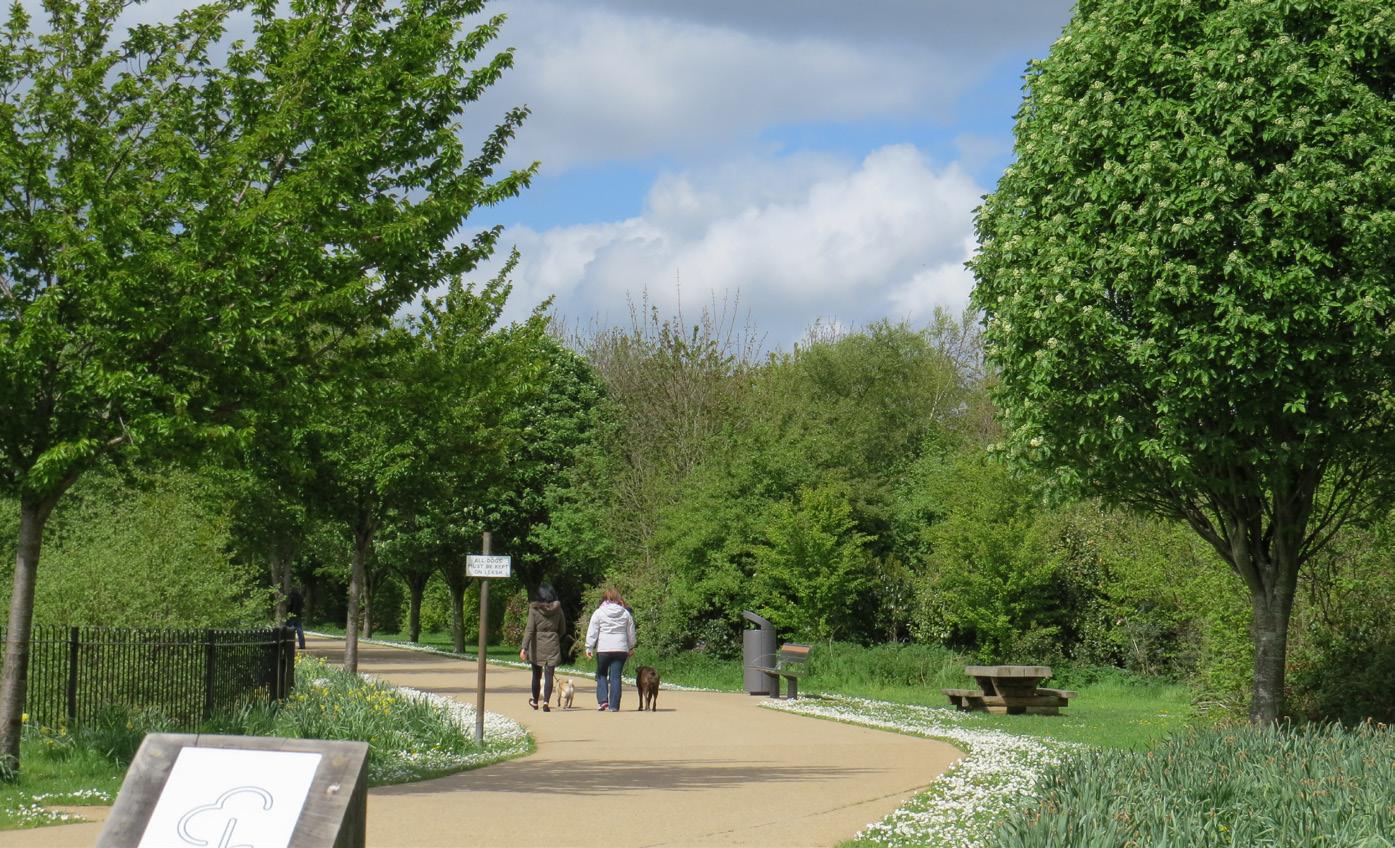
The CCG is a 16-kilometre urban greenway in Belfast, Northern Ireland that follows the concourse of three rivers. It is designed to improve environmental quality, public health, social cohesion, and local economic opportunity while reducing inequalities. Over the past 15 years, a suite of research studies has evaluated its impacts across health, environment, social and economic outcomes. This toolkit distils these experiences into practical guidance, methods, and resources to support researchers, practitioners, and community organisations in evaluating urban green and blue space projects.
The purpose of the toolkit is to provide a practical, adaptable resource for planning evaluations , collecting and analysing data, embedding co-production and inclusion, linking and triangulating data, and generating evidence to inform policy and practice.
Underpinning research
The toolkit draws on the CCG’s long-term research and evaluation programme which integrated three research approaches:
॰ Quantitative
॰ Qualitative
॰ Participatory
Theory of Change Framework
Our Theory of Change Framework guided the selection of indicators, data collection strategies, and the methods used to assess both short-term and long-term impacts. This shows how investment in green and blue spaces can influence:
॰ Health behaviours and health outcomes
॰ Environmental restoration
॰ Social cohesion
॰ Economic opportunities
॰ Inequalities
Explore our Theor y of Change Evaluation Framework
A Systems Map, developed with stakeholders and local residents also informed outcomes and the CCG Research Programme’s focus on long-term follow-up.
Explore our Systems Map published online in the BMJ Open
Before you start
Before you read the 9 Key Research and Evaluation Approaches in this toolkit, learn more about how Co-production is the foundation upon which our work has been built.
Co-production
Community co-production is core to all the research and evaluation methods presented in this toolkit.
The toolkit is based on research that is:
॰ Community-informed
॰ Embedded in the community
॰ Ethically designed
॰ Embraced a co-produced model
Successful and meaningful research and evaluation is driven by applying these values.
Community-informed
Community co-production is central: residents and local organisations contribute to research design, data collection, interpretation, and dissemination. Principles include shared decision-making, mutual benefit, and transparency.
To help guide your work, resources that support community co-production are sign-posted throughout the toolkit.
Embedded in the community
We encourage you to embed your research activity in the community.
The QUB research team used a Researcher-in-Residence model to embed a researcher within the partnership. This model is used to facilitate knowledge exchange, build capacity, and ensure the research is responsive to community and stakeholder needs. Responsibilities include attending planning meetings and community workshops and events, maintaining reflective logs, supporting data interpretation, and liaising between researchers and community members.
Templates for role descriptions, diaries, and reporting are signposted below.
Ethically designed
Ethical considerations include informed consent for surveys, focus groups and community engagement workshops, managing power dynamics, and ensuring data governance and confidentiality.
Sample participant information sheets and consent forms are signposted in the toolkit.
Embraced a co-produced research model
The QUB research team has embedded a co-produced research model linking community insight, academic rigour, and policy relevance.
Co-produced evidence is richer, more legitimate, and more sustainable because communities help define what success means.
This toolkit shows you how to apply a co-produced research model. We encourage you to embed a co-production strategy into your research planning from the outset, and to develop this alongside research funding applications.
The Case Study Guide - Community in Action: Co-producing the Connswater Community Greenway is a rich resource which provides more details about how the CCG is a living demonstration of civic co-production.
Researcher-in-Residence templates can help you embed a researcher within your community partnership network.
9 Key research and evaluation approaches
When evaluating multifunctional spaces it is essential to:
Look at a range of outcomes across health, social, economic, environment, and inequalities.
Consider mechanisms of action to: a) understand how green and blue spaces generate impacts; and b) identify mediators of change.
Evidence for the health benefits of urban green and blue spaces typically comes from small, short-term quasiexperimental or cross-sectional observational research, whilst evidence from intervention studies and long-term evaluations are sparse. The development of the CCG provided the opportunity to conduct a long-term natural experiment evaluation.
Design a long-term evaluation framework to better understand sustained impacts on chronic diseases and inequalities that may take many years to see.
Toolkit navigation
This toolkit is a starter kit. It curates top level information about the research methods the Research Programme used to give you ideas and direction for your own research and evaluation. Where you are interested in learning more, the toolkit signposts where you can find more specific details.
We cover 9 Key Research and Evaluation Approaches used by the QUB research team. The sections are presented in the following sequence:
Sections 1-3
The what Allowing you to explore outcomes and record the impact of the green and blue space intervention.
Section 4-6
The why Understanding the reasons that underpin why you discovered what you did.
Section 7-9
The impact Understanding the bigger picture and modelling the future.
Each section follows an easy to navigate 9-point format:
Section title
Overview
Questions we set out to answer
Key learnings
How to do it
CCG case study
The toolkit is designed so you can dip in and out of each section as needed or read in order.
Our website, and the read more and resources tables at the end of each section are a repository of helpful documents. If you would like to discuss the use of the resources in detail or partner with the researchers involved in the Research Programme, please contact us.
We are happy to collaborate and extend the reach of our work.
Investigating outcomes, including economic impacts and processes.
O ur research objectives were grounded in the following foundations and underlying assumptions: Understanding systems: the CCG and its impacts are bounded by, and dynamically interact with, the systems of which it is a part of or links to.
Synthesising and triangulating the evidence from a range of data sources and findings from multiple strands of analysis.
Household survey
Understanding what difference the green and blue space intervention made
Overview
The team investigated the public health impact of the CCG on a range of outcomes by implementing a quasi-experimental design in a representative household survey of adult residents living near the Greenway.
Questions we set out to answer
What are the changes in levels of physical activity?
Using the Global Physical Activity Questionnaire (GPAQ).
Does mental wellbeing change?
Using the WarwickEdinburgh Mental Wellbeing (WEMWBS).scale
Does quality of life change?
Using the EuroQol (EQ-5D) health measurement.
Does general health change?
Using the Short Form 8 (SF-8) questionnaire.
What are the changes in psychosocial measures of physical activity behaviour?
Using validated instruments for motivation, self-efficacy, intention, readiness to change.
Does social capital change?
Using a validated survey instrument that measure civic engagement, neighbourliness, social networks and support, perceptions of the local area, and sense of community pride.
Does perceptions of environment change?
Using a validated survey instrument that measures perceptions of aesthetics, green space, access to amenities, convenience, traffic and safety.
Do people engage with the natural environment?
Using a validated instrument rating connectedness with different aspects of nature.
Do people use the CCG?
Using questions exploring frequency of use and how they use the CCG.
Key Learnings
A repeated cross-sectional survey with quasi-experimental design allows capture of population-level change rather than individual-level change.
Capture a range of outcomes across health, social, and environmental domains, as well as Greenway usage patterns.
Me asure plausible mediators of behaviour change and Greenway use. Use of validated measurement instruments aligned with measures used in national population surveys to facilitate comparisons.
3 5 4 7 1 2 6
Use a range of comparator groups to account for possible biases.
O pt-in consent to d ata linkage with administrative data (see Approach 2Administrative Data). Repeated follow-ups are highly recommended for better capture of intervention impacts.
How we do it
A repeated cross-sectional household survey
Compare adult residents at baseline, short-term follow-up (6 months to 1 year after the Greenway opened to the public) and long-term follow-up (>5 years after the Greenway opened to the public).
Post-implementation timelines need to be longer to capture long-term impacts.
A repeated cross-sectional household survey
Regression-based modelling used to calculate the mean difference between postintervention and baseline measures adjusting for age, season, education, car ownership and deprivation.
Multi-level mixed effects models fitted using a random intercept at the super output area (smallest geographical unit) to account for clustering within areas.
Difference-in-differences approach employed to investigate the changes in intervention group that are attributable to the intervention.
Analyses stratified by distance from the Greenway and deprivation.
॰ Psychosocial measures of behaviour change (intention, readiness, motivation)
॰ Mental wellbeing (WEMWBS)
॰ Social capital (social networks, cohesion, trust, engagement)
॰ Perceptions of the built environment
॰ Usage of the Greenway
M ultiple comparator groups to account for a range of potential biases
॰ Distance decay analysis:
stratified by people living within certain buffers from the Greenway (e.g. <400m; 400-800m; 800-1200m; >1200m)
॰ Control area: electoral wards >1 mile from the CCG
॰ Population comparator surveys with similar measurement instruments (e.g. Northern Ireland Health and Wellbeing Survey)
Sampling strategy
Our evaluation primarily focused on adults aged ≥16 years living in the electoral wards whose geographical centroid is within a 1-mile radius of the CCG (as intervention group) and adjacent wards as control group.
Random household survey of ~1200 adults living within the sampling area.
Households in the sampling area were randomly selected from the Land and Property Services list. ‘Next birthday rule’ was used to identify who in the household completes the survey.
Apply methodology to understand inequalities
Assess change in the social patterning of outcomes over time using an ordered logistic regression model to make model-based outcome predictions across strata.
Concentration index was used to quantify the magnitude of health inequality and how it changed over time. Decomposition of concentration index was also employed to provide further insights into the main drivers of health inequality before and after the presence of the CCG.
Case Study: Key findings from household survey
At six years post-intervention, our research showed an overall positive impact of the Greenway intervention across all domains of physical activity, health,and other social co-benefits.
For physical activity, the intervention showed a protective effect lowering the decline of physical activity over time. A similar protective effect was found for self-rated health relative to that observed in control areas, in the context of worsening health overall in the Northern Ireland population. Effects were strongest for perceived safety and neighbourhood trust, and these benefits persisted for six years post-implementation. This is the strongest long-term evidence to date that large-scale urban green and blue space investments can maintain population physical activity and general health, and strengthen social capital even years after opening to the public.
Stakeholder and resident workshops informed the outcomes measured.
Measurement instrument piloted with local residents.
Resources
Example surveys and questionnaires
Sample code for analyses
Sampling strategy and ethical considerations
Other analyses undertaken using the household survey data for ideas of what else you can do with the data:
Measurement validation
Correlational study - example 1
Correlational study - example 2
Corre lational study - example 3
Read more
Long-term Impact P rotocol in BMJ Open
Household survey short-term findings in the International Journal of Behavioral Nutrition and Physical Activity
Short-term Impact Protocol in BMC Public Health
Risk of bias in the International Journal of Behavioral Nutrition and Physical Activity
Inequalities Long-term outcomes
Administrative data
Linking data for health and co-benefit insights
Overview
Administrative datasets allow evaluation of population-level outcomes over time (i.e. longitudinally).
Examples of useful datasets include:
॰ Hospital admissions and emergency department presentations
॰ Primary care data
॰ Medication prescriptions, such as antidepressants, antibiotic use and cardiovascular medications
॰ Maternal and birth outcomes data
In the CCG Research Programme these administrative data sources were linked with spatial data on Greenway proximity to assess differential exposure and impacts across populations. We also linked these administrative datasets to the household survey (see Approach 1).
Questions we set out to answer
Given the 14-year follow-up timeframe (>5 years post-implementation of the CCG), the administrative data enabled us to investigate the impact of the CCG on outcomes which require time to occur.
What is the impact of the CCG on Non-Communicable Diseases (NCDs)?
॰ Preventable deaths, and infection (bacterial and viral) rates
What is the impact of the CCG on birth outcomes and maternal health outcomes?
Key Learnings
Data governance involves ethics approvals, data protection impact assessments, and secure storage in trusted research environments (TREs).
Consent and governance is key when using administrative data.
Methods for working with administrative data while maintaining participant privacy are essential.
Participant consent for data linkage should be obtained
3 5 4 1 2
Researchers need to understand the process for data linkage and the anonymisation element to boost agreement for consent to linkage.
How we do it
Methodological considerations
॰ Cohort definition.
॰ How to handle people moving in and out of the intervention area in the analysis.
॰ Comparator groups (matched and unmatched controls; matching on deprivation; rural-urban status).
Analytic al methods
॰ Regression analyses.
॰ Difference-in-differences (DiD).
॰ Controlled interrupted time series (ITS).
To assess whether routine longitudinal and repeated cross-sectional indicators demonstrated statistically significant changes post-CCG completion.
Health outcomes
Unique Property Reference Numbers (UPRN) were used to securely link multiple administrative datasets at the individual and household level, enabling integration of health, demographic, and environmental data while maintaining consistent geographic identifiers across sources.
Use opt-in consent for data linkage to household survey.
Sensitivity analyses examining the impact of the COVID-19 period and alternative intervention periods.
Stratified and interaction analyses assessing the effects of PROGRESS-Plus factors including gender, age, and socioeconomic status.
- Including deaths (measured by all-cause mortality)
Birth outcomes measured by prenatal and neonatal health outcomes for both the mother and the newborn. These included birthweight, low birthweight, small for gestational age, pre-term birth, head circumference.
Maternal outcomes such as postpartum depression, hypertension and eclampsia, gestational weight gain, gestational age at delivery.
Maternal characteristics and health behaviours, including smoking during pregnancy, dietary factors, and breastfeeding practices.
Chronic respiratory diseases such as asthma measured using medication prescriptions, admissions to emergency department, deaths.
Bacterial and viral infections measured by medication prescriptions (e.g. antibiotics), including COVID-19 infection rates.
Cardiovascular disease measured by medication prescriptions (e.g. aspirin, ACEs, beta blockers, glyceryl trinitrate, statins), admissions to emergency department, deaths.
Type II diabetes mellitus measured by medication prescriptions, admissions to emergency department, deaths.
Mental ill-health measured by medication prescriptions (e.g. antidepressants, anxiolytics), admissions to the emergency department, deaths.
Case Study: Key Findings from Administrative Data Analysis
We used difference-in-difference and multilevel linear regression models to investigate the short and long-term impact of the CCG on mental health related prescriptions such as anti-depressants. We found a significant intervention effect across multiple categories of prescription for mental health conditions compared to our comparator areas. The largest effect was seen for anti-depressant related prescriptions.
The effect of the CCG was more pronounced in females, middle-aged and older adults, and those living in the most deprived neighbourhoods showing an impact on addressing inequalities.
Opt-in consent process and forms co-designed and piloted with local residents prior to use to discuss issues around privacy, data protection and appropriate use of data.
Resou rces
Data linkage methods
Code book for ICD-10 and BNF
Example code for analytical strategies
Opt-in consent to data linkage ethics guidance
Read more
Protocol in BMJ Open
Keep up to date with our Administrative Data publications
Economic evaluation
Determining the economic impacts of the green and blue space intervention
We employed a suite of economic evaluation methods to assess green and blue space interventions.
Questions we set out to answer
What is the incremental cost-effectiveness of the CCG from a healthcare service perspective?
What is the net social value of the CCG over the short- and long-term?
Under what conditions is the CCG likely to be cost-effective or costbeneficial?
What are urban residents willing to pay for green and blue space interventions, and what trade-offs do they make when choosing between different intervention attributes?
Key Learnings
U rban green and blue space interventions can generate a range of social, economic, environmental and health benefits. These benefits can be captured and analysed in a variety of ways, using different data sources (e.g. surveys, administrative data) and statistical methods (e.g. differencein-difference, time series analysis).
Aligning the needs of communities with investment decisions to improve the quality and provision of urban green and blue spaces requires an understanding of local residents’ preferences for such improvements. It is important to gauge public support for interventions that vary in terms of their scale, cost, and intended function. Stated preference methods such as discrete choice experiments are used to directly elicit willingness-to-pay for such interventions.
Urban green and blue space interventions create value through direct and indirect mechanisms. Some improvements can be observed directly (e.g. modifications to paths). Other improvements are not immediately obvious, but accrue over time and generate indirect non-use benefits for local communities (e.g. better air quality, increased biodiversity). Social Return on Investment (SROI) is a valuable tool to assess the social value of these improvements.
3 5 1 2 4
Intervention effects are not experienced equally across communities. It is important to understand both the total health gains and how these gains are distributed across socioeconomic groups. Distributional costeffectiveness analysis can be used to jointly assess efficiency and equity. Decision-analytic approaches can help examine uncertainty and support judgement on whether the intervention produces fair and worthwhile gains.
To justify future investment decisions, the benefits generated by an intervention should generally outweigh the costs. This can be evaluated through the use of cost-benefit analysis, which involves calculating the net present value of an intervention by subtracting the total costs from the total discounted stream of benefits that are expected to be realised over a pre-defined period of time. Cost-effectiveness analysis is also used to model expected benchmarks, thresholds for comparison, and areas where impacts are most likely to occur over time.
How we do it
1. Examination of health impacts: diversity in data sources
Using linked administrative data, we examined the impact of the CCG on various health-related outcomes by drawing comparisons with control groups in other areas of Belfast. This comparative approach evaluates trends in different health outcomes over time to assess whether the CCG has had a positive influence on health. This was supported by a repeated cross-sectional household survey. Generalised linear modelling and differencein-differences were used to identify the intervention effect, and interrupted time series analysis was also used to adjust for temporal trends in each outcome.
4. DCEA using household survey data
Following recent NICE guidance, a Distributional Cost-Effectiveness Analysis (DCEA) approach was employed to examine overall health gains of the CCG, and how these gains were distributed across socioeconomic groups. Using household survey data and intervention cost data, the analysis assessed the trade-off between improving total population health and reducing health inequalities. This allowed the equity impact of the intervention to be considered alongside its overall cost-effectiveness.
2. Cost-benefit analysis
Cost-benefit analysis can be used to express relevant intervention outcomes in monetary terms, including changes in morbidity and mortality risk where appropriate. This allows estimation of net present value and supported assessment of whether the benefits of the intervention outweighed the costs.
5. Willingness-to-pay
We used a discrete choice experiment to elicit residents’ willingness-to-pay for hypothetical improvements to green and blue spaces in Belfast. We gauged public preferences for specific intervention components (e.g. improved accessibility, public toilets, better signage), and identified the amount that respondents were willing to pay in additional taxes, on average, for each.
6. SROI
We used Social Return on Investment (SROI) to estimate the monetary value of the health and co-benefits of the CCG. By summing the discounted stream of benefits and subtracting the costs of construction and maintenance, we obtained the net present social value of the CCG. We assigned monetary values to a range of outcomes (e.g. physical activity, health and wellbeing, flood alleviation, crime, biodiversity, urban heat island, personal, social, and civic development, and tourism).
3. Cost-effectiveness analysis (CEA)
We adapted the PREVENT model to estimate the potential cost-effectiveness of the CCG based on household survey data, intervention costs, and modelled changes in physical activity. This provided expected benchmarks and thresholds for comparison before long-term follow-up data became available. At a later stage conventional cost-effectiveness analysis was conducted using observed changes in costs and outcomes to derive incremental costeffectiveness ratios from an NHS perspective.
7. Decision-analytic approach
We used a decision-analytic framework to support intervention appraisal under uncertainty. This included non-parametric methods, sensitivity analysis, and threshold analysis to examine joint cost-outcome uncertainty and assess whether the intervention is likely to be cost-effective under different assumptions. For the CCG evaluation, a 40-year time horizon was adopted reflecting the expected lifespan of the CCG infrastructure and maintenance plan, although shorter horizons such as 10, 20, and 30 years can also be applied for sensitivity analysis.
Case Study: Social Return on Investment Findings
We estimated the value of the CCG over a 40-year horizon. The total value was estimated to be between £56.8m and £67m .
After subtracting the costs (£42.2m), the net present value of the Connswater Community Greenway was £14.6m - £24.8m. The benefit-cost ratio was 1.34 – 1.59, meaning that for every £1 invested in the Connswater Community Greenway, the local economy gains between £1.34 and £1.59.
Overall, the Connswater Community Greenway will provide a positive return on investment which will be realised after 40 years.
Domains explored in the SROI were informed by stakeholder workshops, consultations and the causal loop diagram co-developed with local residents.
Resources
SROI code/method
Discrete choice experiment survey and method
Read more
Contingent valuation in Social Science and Medicine
DCEA Analysis Template/code
Contingent valuation survey
Cost effectiveness modelling in European Journal of Public Health
Different methods for economic evaluations in Ecological Economics
SROI 1 (baseline) in Cities and Health
SROI 2 (short-term) in Cities and Health
Keep up to date with our Economic Evaluation publications
Qualitative exploration
Understanding the ‘how’, ‘why’, and ‘for whom’ the green and blue space intervention made a difference, and capturing the ‘unmeasurable’
Overview
The evaluation of the CCG reflected lived experience, local priorities , and community values.
A suite of participatory and qualitative methods was used to understand stakeholder perspectives, mechanisms, and intervention design. Together, these methods can provide in-depth understanding of how interventions operate and how they can be optimised.
Questions we set out to answer
What are the health, social, economic and environmental impacts (including those that we could not measure using surveys and administrative data) and mechanistic pathways (i.e. how it worked) of the CCG using rich pictures, multiperspective diagrams, causal loop diagrams and focus group discussions?
How can we co-design physical activity interventions to ensure that the Greenway infrastructure changes are coupled with social programmes and events for the local community to use the Greenway?
Key Learnings
The CCG transformed evaluation into a shared civic enterprise where residents, practitioners, and researchers co-produced knowledge.
1
2
Participatory approaches provided insights into experiences, perceptions, and social mechanisms that quantitative data could not capture.
Co-design sessions allowed teams to involve under-represented groups in planning, implementation, and evaluation.
3
4
Inclusion strategies ensured engagement of disabled people, older adults, women, ethnic minorities, and low-income residents.
How we do it
Data collection: Community focus groups
Analysis: Network analysis and issue webs
Community workshops and focus groups with local residents and users of the CCG employed structured discussion and system-thinking tools to explore perceived health, social, and environmental impacts, unmeasurable (from the survey/administrative data) impacts and how the Greenway made a difference.
Data from these sessions were analysed using thematic content analysis to identify recurrent patterns, meanings, and explanatory themes, alongside network analysis techniques to examine the structure, connectivity, and complexity of relationships mapped within discussions and diagrams.
Dat a collection: Stakeholder interviews
Analysis: Thematic content analysis
Stakeholder interviews were conducted to inform the design and refinement of physical activity interventions, ensuring that implementation strategies are context-sensitive, feasible, and aligned with community priorities.
Data collection: Rich pictures
Analysis: Concept mapping
Participatory workshops incorporated rich pictures and concept mapping to facilitate collective sense-making and visualise causal pathways, feedback loops, and interdependencies within the system. These visual and structured mapping approaches support identification of mechanisms underpinning observed outcomes.
Case Study: Network Analysis of Qualitative Data
We examined the views of 113 people on how to increase rates of physical activity in a deprived area using the Greenway.
The results of the analysis suggest that physical activity is rarely considered as a discrete issue, or one that centres on individuals and their motivation, but rather as one component in a complex web of concerns, processes and events that include such things as the actions of neighbours and relatives, material and political environments, vandalism, violence, and the weather.
Our results support those who argue that interventions to increase rates of physical activity need to move beyond behavioural approaches that focus on individuals and consider the environmental, social, political and material contexts in which ‘activity’ occurs.
The topics explored in the focus groups and workshops were informed by the group model building workshop with stakeholders and local residents that led to the development of a causal loop diagram conducted before wave 3 (long-term follow-up) data collection.
Resour ces
Stakeholder interviews and focus group guide
Consent forms
Rich pictures mapping causal mechanisms guide
Concept mapping methods
Read more
Qualitative exploration in BMJ Open
Community views on physical activity in Social Science and Medicine
Interviews and focus group methods in International Journal of Behavioral Nutrition and Physical Activity
Mechanisms
Exploring the mechanistic pathways to understand how urban green and blue space interventions work
Overview
Evidence
on the effectiveness of urban green and blue space interventions is growing, but there remains limited understanding of how and why these interventions generate health and wellbeing impacts.
In particular, the mechanisms linking environmental change to behavioural, social, and health outcomes are often under-specified. To address this gap, we used a complementary set of approaches, including structural equation modelling (SEM) to test hypothesised pathways quantitatively, and group model building workshops and focus groups with causal loop diagrams (CLDs) to explore perceived mechanisms and feedback processes qualitatively, enabling a more comprehensive understanding of intervention dynamics within complex systems.
Questions we set out to answer
What mechanisms and causal pathways do stakeholders and local residents identify as linking the intervention to observed health, social, economic and environmental outcomes, and how are these relationships structured within the wider system?
What are the direct and indirect mechanistic pathways between urban green and blue space and mental wellbeing before vs. after the intervention?
Key Learnings
Combining quantitative and qualitative approaches strengthens causal insight. Structural equation modelling (SEM) enabled formal testing of hypothesised pathways, while focus groups and causal loop diagrams (CLDs) helped surface mechanisms, feedback loops, and contextual influences that were not captured in routine datasets.
CLDs revealed reinforcing and balancing loops that helped explain why impacts varied across groups or over time-dynamics that would not be visible in cross-sectional analyses alone.
Both SEM and CLDs highlighted that impacts operate through intermediary factors (e.g. perceptions of safety, social connectedness, nature engagement), rather than through simple linear cause–effect relationships.
3
5 4 1 2
SEM results helped identify which proposed pathways were empirically supported, which were weak, and where additional data or theoretical refinement was needed.
Moving iteratively between stakeholder insights and statistical modelling enhanced confidence in the plausibility of identified mechanisms and strengthened the overall explanatory narrative.
How we do it
Structured equation modelling
॰ Mental wellbeing was assessed using the Warwick-Edinburgh Mental Wellbeing Scale (WEMWBS).
॰ Urban green and blue space exposure, measured as the distance from the home address to the nearest CCG access point.
॰ Structural equation models assess the differential pathways between exposure and mental wellbeing.
॰ Also include subjective environment perceptions, e.g. attractiveness, traffic, amenities, and perceived safety.
॰ Select instoration (i.e. the enhancement of mental wellbeing) indicators (e.g. physical activity, social trust, and social networks).
Refer to Approach 4: Qualitative Exploration , and Approach 8: Evidence and Knowledge Synthesis for more detail on focus group and Causal Loop Diagram methodology.
Case Study: Mediation Analysis Findings
The CCG Research Team assessed the mediating roles of subjective perceptions of the environment and instoration indicators (social capital and physical activity).
After the intervention, distance to the CCG was indirectly and directly associated with mental wellbeing. Mediating pathways included amenities positively impacting physical activity, and perceived safety positively impacting social trust.
These findings provide evidence that urban green and blue spaces influence mental wellbeing through multiple mechanistic pathways, including changing people’s subjective perceptions and promoting instoration after the development of a new urban greenway.
Insights from participatory systems mapping informed the selection of variables and pathway structures tested in SEM, reducing reliance on purely theory-driven assumptions. Stakeholder-generated CLDs improve model specification.
Resourc es
CLD
Mediation analysis methods
Mapping causal mechanisms guide in the focus groups
Code/script from SEM
Read more
Understanding mechanisms in The Lancet Public Health
Explore mechanistic pathways in Landscape and Urban Planning
Discussion of mechanistic pathways in Environmental Research: Health
Process evaluation
Understanding who uses the green and blue space, and how that changes over time
Overview
To assess how the CCG is used in practice we applied a process evaluation that combined structured intercept surveys with systematic observational methods.
Questions we set out to answer
How does the usage of the CCG change over time?
What do we know about the people using the CCG (e.g. their gender, age group), what they use the space for (e.g. walking, cycling)?
How does usage of the CCG change by time of day, by day of the week and by season?
What environmental improvements (e.g. lighting, connectivity) have led to the greatest change in use?
How feasible is it to involve members of the local community in collecting these data?
Key Learnings
Pairing systematic observation (e.g. Systems for Observing Play and Recreation in Communities - SOPARC) with intercept surveys improves validity by triangulating behavioural counts with self-reported motivations, perceptions, and wellbeing.
1
2
Observational methods capture actual use, while intercept surveys explain why and how spaces are used.
Usage patterns vary substantially by weekday/weekend, school term versus holiday, and season.
3
Supplementing observational data with intercept survey questions about perceived safety and accessibility reveals barriers not visible in counts alone.
Discrepancies between observed physical activity levels and selfreported behaviour can provide important analytic insights.
4
Mapping user travel origins/ destinations strengthens interpretation of catchment and equity effects.
5
6
Sampling across different temporal conditions prevents biased estimates of reach and activity.
Disaggregating by gender, age group, and physical activity intensity enables equity analysis.
How we do it
Intercept surveys
Conducted at four locations along the CCG over 16 survey days, spanning term-time and non-term-time weekdays and weekends (07:00–19:00). Surveyors record all users passing predefined points, including cyclists, e-bike users, pedestrians, horse riders, roller skaters, and wheelchair users, across all travel directions. In addition to user counts, short surveys capture route choice, distance travelled, perceptions of safety, and self-reported physical activity and mental wellbeing, local versus visitor use. This approach provides detailed data on usage patterns, user characteristics, and travel behaviours.
SOPARC (System for Observing Play and Recreation in Communities)
A validated observational tool used to assess park and green space utilisation.
Trained community volunteers collect data across eight green space areas during winter and summer observation periods (7 days per season). SOPARC captures information on user demographics, activity type and intensity, and spatial patterns of use. Analysis enables comparison of green space use before and after CCG implementation, and examines how the space supports different forms of recreation and physical activity.
Case Study: SOPARC
Findings
Using the System for Observing Play and Recreation in Communities (SOPARC) method, data were collected at baseline (2010/11), short-term follow-up (~6 months post-implementation of the CCG; 2017/18), and long-term (7 years post-implementation of the CCG; 2025) follow-up (each in summer and winter), to assess how patterns of green space use and physical activity changed following the Greenway’s development.
Key findings:
॰ The total number of CCG users increased by 114% between baseline and long-term follow-up.
॰ The proportion of users engaged in moderate-to-vigorous physical activity increased by 153%.
॰ Green spaces with new paths and improved accessibility (e.g. Dixon Playing Fields and Cregagh Glen) showed the large gains in user numbers.
॰ Women and girls participation increased 203% from baseline to long-term follow up.
॰ Winter use rose by 140%, suggesting better year-round accessibility and lighting.
Implications: These findings demonstrate how investment in high-quality, connected green infrastructure can support physical activity, and community wellbeing, particularly when local residents are engaged as partners in evidence generation .
Greenways
Co-production highlight
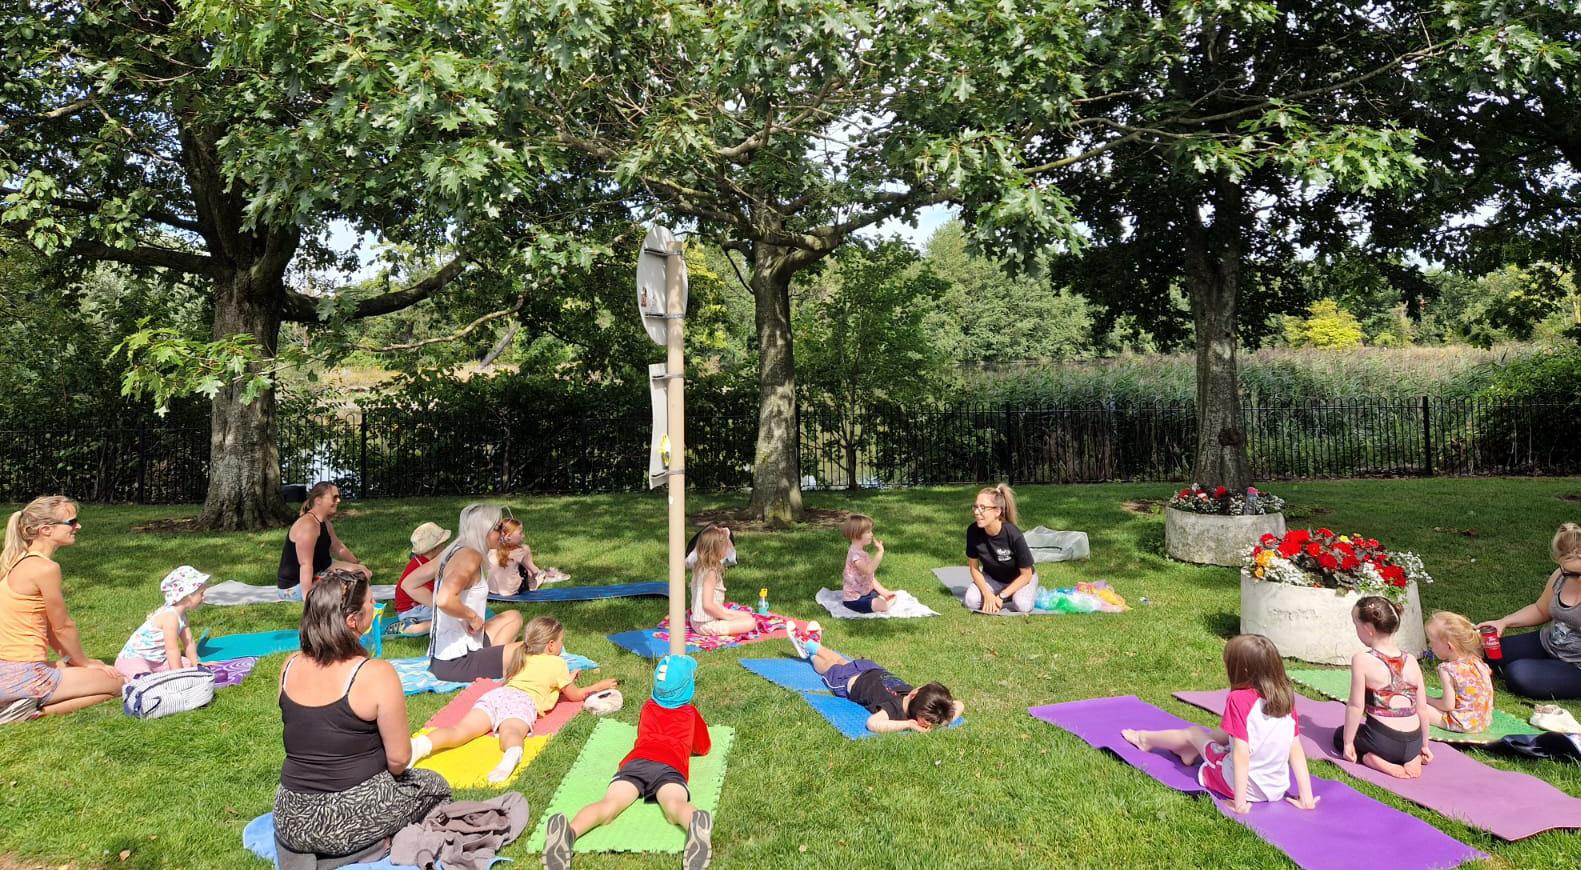
The SOPARC study was delivered as a citizen science project, with 22 trained community researchers contributing over 1,500 hours of systematic observation.
Community volunteers can successfully implement SOPARC protocols.
Structured training and inter-rater reliability checks are essential to ensure data consistency. Clear operational definitions of activity intensity and user categories reduce measurement error.
Resour ces
Intercept survey method
Intercept survey data collection template
SOPARC method and training
SOPARC data collection template
Read more
SOPARC Report
Intercept Survey Report
Explore the SOPARC and Intercept Survey
Dashboard for the Connswater Community Greenway
Systems science
Exploring the context in which the green and blue space intervention is implemented
The Systems Sciences work was led by colleagues at Cranfield University in collaboration with the QUB team.
Overview
Urban green and blue space interventions are increasingly perceived as complex systems requiring investigation and planning through a system lens. System-thinking techniques can be used to understand the complex system governing the development, implementation, management and maintenance of an urban green and blue space.
The research team used a series of systems-based methods to represent the complex system governing the CCG from differing stakeholder perspectives. Our approach used three systems science approaches:
॰ Soft systems methodology (SSM)
॰ Viable systems modelling (VSM)
॰ Stakeholder network analysis (SNA)
Questions we set out to answer
What wider systems does the CCG interact with, and how do these system dynamics influence its implementation and impacts?
Who are the key organisations and stakeholders involved in the CCG, how are they connected, and how has the collaboration evolved over time?
How do stakeholders understand the broader system context surrounding the CCG?
This will be explored using systems science methods including Stakeholder Network Analysis (SNA), Soft Systems Methodology (SSM), Causal Loop Diagrams (CLDs) (see Approaches 5 and 8) and Viable Systems Modelling (VSM) to identify key stakeholders, relationships, feedback processes, and structural influences shaping outcomes.
Key Learnings
1
Methods for stakeholder engagement include: rich pictures, multiperspective diagrams, context diagrams, root definitions, SNA survey and the development of CLDs based on group model building methods.
2
O ur systems approach explored three phases of the CCG:
1. development; 2. implementation; 3. management and maintenance.
3
Systems science approaches can help decision-makers and planners identify the stakeholders required for each phase, their roles and responsibilities and build capacity in local communities to develop amenities to meet their needs.
How we do it
Stakeholder network analysis (SNA)
SNA was used to map who was involved in the CCG and how organisations and individuals were connected.
Data was collected through a structured stakeholder network survey, asking participants to identify key collaborators, the nature of their relationships (e.g. information sharing, funding, joint delivery), and the frequency or strength of interaction.
Network analysis methods were applied to examine network size, density, central actors, and patterns of collaboration. Repeating the survey over time enabled assessment of how the network evolved, identify emerging or declining connections, and understand how partnership structures shifted across implementation phases.
Sof t systems methodology (SSM)
SS M was used to map purpose and purposeful activities of stakeholders across the different phases of the project.
Specifically, rich pictures were used to initially bring a diverse group of stakeholders together, capture lived experience and identify successes, challenges and priorities.
Root definitions were developed to help define the purpose or intention for each phase, with conceptual models used to define a set of activities needed to achieve this purpose. The culmination of these three tools, along with integration with the VSM and CLD modelling and analysis, has identified elements of best practice from the CCG project that could be used to improve the success of similar projects in the wider public health space.
Viable systems modelling (VSM)
VSM was used to model the organisational structure, coordination and management activities across the three phases (i.e. development; implementation; management and maintenance) of the CCG.
A series of interviews with key project stakeholders helped kick start the analysis, which then enabled the team to map out the complex network of stakeholders, organisations and decision makers in the environment. Additionally, VSM helped to identify key areas of structure, coordination, engagement and cohering values as indicators of best practice and sustainability for similar projects.
Case Study: Integrated Systems Model Findings
An integrated systems model was developed for the CCG, which involved three dimensions. Firstly, CLDs were developed through a group model building workshop, which helped to identify the causal relationships (the WHYs) between elements in the system. Secondly, SSM was used to identify purpose and the activities (the WHATs) needed to achieve that purpose across the project phases. Finally, VSM was used to map out the complex network of stakeholders, organisations and decision makers in the environment (the HOWs). Each dimension overlapped to address distinct questions, acting as a form of triangulation.
Key findings:
॰ VSM and SSM corroborate values and purpose in terms of ‘WHAT’ questions (e.g. what are we trying to achieve?)
॰ SSM and CLDs corroborate the required activities needed to realise the purpose in terms of ‘HOW’ questions.
॰ VSM and CLDs corroborate system (organisational) behaviours to appreciate ‘WHY’ the system acts as it does.
In the context of the CCG, the implications are threefold.
1. The modelling enabled the team to develop a more holistic appreciation of the CCG ‘system’, including its environment, stakeholders and processes.
2. A selection of critical elements were identified as indicators of best practice and sustainability to improve the success of similar projects in the wider public health space, including: structure, coordination, engagement and cohering values identifying best practice
3. A comprehensive approach to incorporating systems thinking methodologies into public health research .
Co-production highlight
Generate a shared understanding of the context and use of the CCG through formal collaborative conversations, surveys and workshops with stakeholders from local community groups, local authorities, government departments, urban designers, landscape architects and local residents.
Resou rces
Training video: Introduction to Soft Systems Methodology - Session 1
Training video: Applications of SSM in Public HealthSession 2
SSM methods
Training video: Introduction to Viable Systems Modelling - Session 1
Training video: Introduction to Viable Systems Modelling - Session 2
VSM methods
SNA survey Sampling strategy
Visit stakeholdernet.org developed by Queen’s University Belfast, a WHO Collaborating Centre for research and training on systems science. It is a free, web-based tool created to facilitate the design, data collection, and data analysis for stakeholder network surveys. Read more Keep
Evidence & knowledge synthesis
Understanding the ‘full story’ of the impact of the green and blue space intervention
Overview
Robust evaluation of complex interventions requires the integration of evidence from multiple analytical approaches, data sources, and stakeholder perspectives.
No single method fully captures system dynamics, contextual influences, behavioural change, outcomes and economic value. We therefore triangulate methods and findings across quantitative, qualitative, observational, economic and systems analyses to strengthen validity, identify convergent and divergent patterns, and develop a coherent understanding of how and why impacts occur. This structured synthesis approach enables more credible conclusions, supports explanation of mixed findings.
Questions we set out to answer
How can evidence from quantitative, qualitative, observational, economic and systems analyses be synthesised to explain the impacts of the CCG? Specifically, how do these combined findings clarify the causal pathways linking green and blue space interventions to health outcomes and health inequalities?
How can the systems context surrounding the CCG be refined and better understood through iterative development of the Causal Loop Diagram (CLD)?
How can the evidence generated and the interactions within the system be represented in an accessible and meaningful way for stakeholders and practitioners?
Key Learnings
Co-development of a systems map creates a shared and holistic understanding of the current situation and shared vision of what needs to happen next.
1
2
3
A combined approach goes beyond existing frameworks by integrating scientific and practice-informed evidence, systematically analysing underlying values, beliefs and mechanisms and explicitly considering feedback loops.
Triangulation helps surface, test, and refine assumptions about how and why interventions lead to outcomes, increasing transparency and confidence in evaluative judgements.
4
Using multiple evidence sources supports sense -m aking around emergent and unintended effects, helping interventions adapt over time rather than aiming for a single definitive conclusion.
How we do it
CLD
Update and refine the original CLD in synthesis participatory workshops with the aim of integrating perspectives from multiple stakeholders and local residents and findings from multiple analyses. To do so, a combination of the methods below can be used.
Contribution analysis
Combine stakeholders’ perspectives and findings from earlier analyses to make a credible “contribution story” that explains how the greenway plausibly contributed to observed changes, even if it is not the sole cause.
Process tracing
Process tracing explicates the causal chain linking an intervention to outcomes. It “opens the black box” by collecting evidence at each link of the presumed causal pathway.
Participatory weight of evidence approach
The participatory weight of evidence approach helps stakeholders to interpret, expand on and prioritise evidence on explanatory mechanisms linking contributing factors to outcomes.
Realist evaluation
Realist evaluation focuses on explaining how and for whom an intervention works, by uncovering the underlying mechanisms that are triggered in specific contexts.
Thematic analysis from the qualitative data
Thematic analysis helps to identify, examine, and interpret experiences and perspectives from individuals with nuances that are often missing from quantitative data analyses.
Case Study: Causal Loop Diagram Findings
We convened a one-day workshop with 23 stakeholders, including community groups, local authorities, government representatives, designers, and residents, to examine the public health impacts of the CCG five years postimplementation.
Using group model-building techniques, participants co-developed a CLD mapping plausible pathways linking the CCG to health and wider system outcomes. The CLD directly informed the design of our five-year follow-up evaluation, leading to the inclusion of measures such as biodiversity, sense of community pride, and connectedness with nature that were identified as important during the workshop.
A final group model building workshop with stakeholders (local communities, industry, practitioners, researchers, national-level and local-level government agencies) using the community-based system dynamics approach helps resolve divergences or convergences in the findings through shared discussion.
Resources
CLD workshop template Contribution analysis Weight of evidence Process tracing Realist evaluation
Read more
Simulation modelling
Predicting future outcomes
Overview
The impacts of an urban green and blue space intervention can last for decades, if not centuries. Predicting and projecting those benefits can support future policymaking and justify resource expenditure.
But how can you see into the future? Micro-simulation modelling allows researchers to estimate longer-term outcomes (e.g. in 10, 20, 40 years time) when an intervention may likely still be having an impact for the local community. Spatial microsimulation modelling involves simulating “digital” individuals (i.e. informed by population data, but not linked to identifiable real-world individuals) over time to understand long-term population impacts.
Questions we set out to answer
What are the potential long-term (e.g. 40 year) impacts of the CCG on non-communicable diseases (NCDs), economic outcomes, societal benefits and health inequalities?
How do the projected impacts of the CCG differ across population sub-groups, such as gender, age group, and those living in deprived areas?
Key Learnings
Microsimulation enables researchers to translate observed behavioural and health changes into projected morbidity and mortality, economic and social impacts.
1
2
In line with ecological models, the spatial microsimulation model should account for the social environment, urban landscape design and inequalities in access to and quality of urban green and blue spaces, as well as individual residents’ attributes (including demographics and health-related behaviour) that may affect the impact of a given intervention.
Data-informed microsimulation models draw strongly on findings from initial analyses and secondary data analysis (as detailed in previous sections), the strength of the model depends on the strength and depth of original analyses.
3
4
Use locally relevant, broad ranging administrative data to inform the model (i.e. prescribed medications, hospital admissions for targeted NCDs, birth outcomes, and mortality rates). This helps better project NCD, economic, societal and health inequality impacts.
How we do it
Clear intervention timeframe
Example :
Pre-2011
Baseline/ pre-implementation of the CCG
2011-2016
Development of the CCG
2017
Immediately postimplementation of the CCG
2022-23
5 years post-implementation of the CCG
2024–2050
Projections for long-term impact of the CCG (achieved through the microsimulationspatialmodelling)
Administrative data selection
॰ Geographical data on proximity to the CCG
॰ Primary care registration data
॰ Prescription medication data
॰ Hospital admission
॰ Death data
॰ Birth outcomes data
Spatial microsimulation model
Create a digital population (an artificial dataset created informed by population data and that acts as a “digital twin” of a real-world population, but without linking to identifiable real-world individuals) designed to emulate the population in the intervention area for a set period.
Each digital individual is assigned a set of attributes (e.g. gender, age, level of deprivation, distance to CCG). The digital individuals’ disease state (e.g. with or without cardiovascular disease, mental ill health etc.) is updated at each time step in the model (representing, e.g. one month or year in the real world). This allows estimation of the evolution and prevalence of each disease over the period of interest, and then the derivation of social, economic and health inequalities impacts.
Disease states assigned probabilistically to the digital individuals at the start of the simulation and on subsequent time steps using disease prevalence, incidence and remission/recovery (when relevant) rates derived from administrative data.
Case Study: Simulation Modelling Findings
Some health impacts from the CCG may take decades to be accrued, such as changes in rates of NCDs. The spatial microsimulation will help to estimate potential long-term impacts on health outcomes and inequalities, as well their social and economic implications.
Decisions about investing or not in similar green and blue space projects are being made now. Unfortunately, decisions are based on limited information on the potential long-term impacts of these spaces for their communities. Simulation modelling based on the CCG findings helps to bridge that gap by estimating changes in key outcomes in the long-term. Together with empirical evidence from shorter-term evaluations, this provides a more complete picture of the value of green and blue spaces.
Understanding long-term impacts of the CCG is a need raised by local stakeholders and residents, which led the research team to develop the spatial microsimulation.
Resources
Outcomes tracked over time in the simulation were defined according to conversations with local stakeholders and residents on what is important for them.
The STRESS Reporting Protocol
An interactive dashboard will be developed to allow easy access to the simulation results in a user-friendly language and format.
Code and data input files to run the model
Read more
Methods for small area population forecasts in Population Research and Policy Review
Explore spatial microsimulation modelling in Methodology Spatial Microsimulation
Dynamic microsimulation models for health outcome in Society for Medical Decision Making
A synthetic population dataset for estimating small area health and socio-economic outcomes in Scientific Data
Keep up to date with our latest Simulation Modelling publication s
Conclusion
The evaluation of the Connswater Community Greenway (CCG) represents one of the longest and largest natural experiment evaluations of an urban green and blue space intervention undertaken to date.
Spanning more than a decade of follow-up and drawing on population-level data alongside deep community engagement, the research provides rare longitudinal evidence of how sustained investment in high-quality green and blue space can influence health, wellbeing, social connection and local environments. Critically, it moves beyond short-term usage metrics to examine longer-term impacts relevant to NCDs, mental health, physical activity, social cohesion and health inequalities.
The findings demonstrate that urban green and blue space investment can support increased physical activity, improved mental wellbeing, stronger perceptions of neighbourhood quality and enhanced community pride, but that these benefits are neither automatic nor evenly distributed. Outcomes depend on accessibility, connectivity, programming, safety, and trust. The research highlights that reducing health inequalities requires deliberate attention to inclusion, affordability, local participation and sustained community presence. Green and blue space interventions are not solely environmental upgrades; they are social and public health interventions whose equity impacts unfold over time.
A defining strength of the research has been its commitment to co-production. Citizen science approaches, embedded community partnerships, and the Researcher-in-Residence model ensured that local knowledge shaped research questions, methods and interpretation. This approach strengthened both the quality and legitimacy of the evidence, supported local capacity building, and enhanced translation into policy and practice. This work demonstrates that meaningful participation is a core mechanism through which place-based change delivers health benefits.
Methodologically, the research illustrates the importance of multi-methods natural experiment designs in evaluating complex urban systems. No single method can capture the dynamic, spatial and social processes through which green and blue space influences health and co-benefits. By integrating longitudinal survey data, routine health records, environmental monitoring, qualitative research, systems mapping and economic evaluation, the research programme advances methodological innovation in real-world public health evaluation. It also underscores the necessity of long-term investment in monitoring and data linkage to understand pathways to NCD prevention and inequality reduction.
As cities and regions respond to climate change, biodiversity loss and widening health inequalities, the evidence shows that well-designed, co-produced green and blue spaces can form part of a preventative public health strategy. However, achieving sustained and equitable impact requires systems-thinking, cross-sector collaboration and long-term commitment. This toolkit offers a tested model for how to design, evaluate and learn from urban nature-based solutions at scale. We hope you find it useful in your study design.
Good luck with your ongoing research and evaluations.