Market Research Report · 2023 — 2030
Medical Equipment Maintenance Market A global outlook on service demand, capital intensity, and competitive positioning across hospitals, clinics, and diagnostic centres — engineered for investors, BD leads, and B2B decision makers.
Base year · 2023
Forecast · 2030
Annual growth
USD 47.51B
USD 92.36B
10.0%
Global market valuation
CAGR · 2024 — 2030
Projected market value
Executive summary Service demand scales with aging populations, chronic disease prevalence, and increasingly complex medical technology. North America leads with ~40% share; APAC accelerates on public healthcare investment. OEMs hold roughly half the market; AI-driven predictive maintenance is the next margin lever. 28 countries profiled · 10 strategic players benchmarked · 2024 — 2030 forecast.
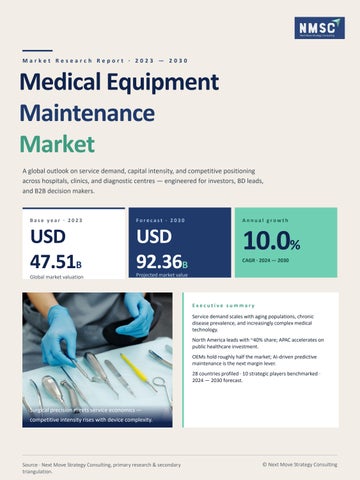
Surgical precision meets service economics —
competitive intensity rises with device complexity.
Source · Next Move Strategy Consulting, primary research & secondary triangulation.
© Next Move Strategy Consulting
Slide 02 · Market Segmentation
Where the dollars actually sit. The market is read across four lenses: the service delivered, the device being maintained, the customer buying it, and the geography consuming it.
01 · By Service Type
02 · By Device Type
Preventive Maintenance
Corrective Maintenance
~ 45%
Imaging · 35% Therapeutic · 25%
~ 28%
Installation & Integration
35%
~ 17%
Patient Monitoring · 18%
Imaging
Surgical · 12%
Training & Compliance
Lab & Other · 10%
~ 10%
Imaging & monitoring combined drive over half the maintenance spend.
Approximate revenue weight · illustrative split for orientation.
03 · By End User
04 · By Region North America
Hospitals
Diagnostic Centres
~ 58%
~ 18%
39.9% Europe
Clinics
Labs & Others
~ 14%
~ 10%
~ 30.4% Asia-Pacific ~ 23.1%
Hospitals anchor the demand; outpatient & ambulatory sites are growing fastest.
Rest of World
~ 6.6%
Sources · Next Move Strategy Consulting · Fortune Business Insights · Polaris Market Research.
© Next Move Strategy Consulting
Slide 03 · Growth Drivers & Opportunities
Five forces pulling demand forward. Where structural pressure meets modernisation capital, the service wallet expands — and where it expands fastest, the highest IRR lives.
01
02
03
Aging populations
Device complexity
Global population 60+ projected to reach 2.1 billion by 2050 — almost half of them will need chronic-care equipment.
MRI, robotic surgery, and connected monitoring demand specialist service contracts – replacing rather than retreading in-house teams.
Chronic disease load CKD alone reaches ~35.5 million Americans and pulls dialysis fleets into the maintenance queue.
04 · HIGHEST GROWTH
05 · MARGIN LEVER
Asia-Pacific infrastructure build-out
AI-driven predictive service
Singapore targets USD 43B national health spend by 2030. China's 60+ population grows from 168M (12.4%) to 402M (28%) by 2040.
Cuts unplanned downtime by 30 — 50%. AI-predictive sub-market ~ USD 1.0B (2026), 12.7% CAGR. Cost-centre to recurring-revenue transition.
11%+ CAGR
Where investors should look first #1
OEM service contracts
#2
#3
Independent service orgs
Imaging & robotics service
#4
Predictive AI platforms
Investor takeaway — highest compounding return sits where aging demographics, chronic disease, and digital service meet in one fleet. Sources · WHO · CDC · Singapore Ministry of Health · NLM · Future Market Insights.
© Next Move Strategy Consulting
Slide 04 · Competitive Scenario
A consolidated battle, loosening at the edges. OEMs dominate the legacy equipment stack; ISOs and AI-native entrants are pulling share at the perimeter.
Leader · GE HealthCare
15%
Siemens Healthineers
Koninklijke Philips
12%
10%
Device + service bundle
ICT-led service portfolios
Estimated global share
Positioning matrix · 10 strategic players
How leaders are playing
AI-native ← Service intensity → High-touch
Legacy OEMs
PARTNERSHIPS
Long-term HTM contracts
Digital Challengers
GE × Advantus — 10-year HTM alliance, recalls, disinfection, distribution.
GE
Siemens
HealthCare
Healthineers
Canon
SERVICE HUBS
Philips
Regional repair centres B. Braun Technical Service Centre, Thailand — public-hospital backbone.
Niche Specialists
Olympus
FUJI
Independent Service Orgs
Hitachi
Dräger
Medtronic
B. Braun
OPTIMISATION
Connected tech programmes Siemens "Technology Optimization Partnerships" — single point of contact.
JOINT R&D
Imaging research centres
Device-focused ← Service breadth → Full-fleet coverage
Canon × Cleveland Clinic — joint imaging & IT, Nov 2023.
Investor takeaway
Concentration snapshot Top 3 OEMs hold an estimated ~37% of the global market. OEMs collectively retain ~50% of provider share. OEMs
ISOs + Others
~ 50%
~ 50%
Sources · ReportPrime · Fortune Business Insights · market.us · NMSC strategic notes.
Top players hold share — the next USD 20B of growth is contested by alliances, integrators, and AI-native entrants.
© Next Move Strategy Consulting
Slide 05 · Future Trends & Investment Outlook
Maintenance goes predictive,connected,outcome-priced. Three shifts reshape the unit economics of service — and a fourth change rewrites who gets paid for uptime.
Trend 02
Trend 01
AI-driven predictive maintenance Sensors + ML models anticipate failures before they
IoT-enabled remote monitoring Equipment becomes addressable; remote service reduces truck-rolls and accelerates parts logistics.
occur. Maintenance contracts evolve toward a recurring software revenue line.
Downtime cut
AI-PdM sub-market
Trend 03
30–50%
1.0B → 3.2B
Outcome-priced contracts
vs unplanned service baseline.
12.7% CAGR
Vendors paid per uptime-hour — incentives aligned with care, not work orders.
2026 — 2036
Uptime → Cash
Investment matrix · where to deploy capital Horizon
Capital intensity
Best fit
Near term · 0 — 24 mo
Moderate
OEM multi-year HTM contracts · ISO consolidation roll-ups.
Mid term · 2 — 5 yrs
High
Imaging fleet retrofits · IoT sensor rollouts · cloud analytics.
Long term · 5 yrs +
Strategic
The thesis — service is the new software.
Sources · Future Market Insights · SNS Insider · IIoT World · NMSC strategic notes.
Outcome-priced uptime SaaS · cyberresilience for connected fleets.
Watch — specialised maintenance cost burden on providers.
© Next Move Strategy Consulting
Slide 06 · Connect
Thank you. Let's open the next chapter together. Reach out for in-depth insights, custom market sizing, and strategic guidance across the medical equipment maintenance value chain.
Official Website
Direct Line
nextmsc.com
+1 857 758 5017
info@nextmsc.com
Reach a research analyst — strategy and BD support.
Custom scopes, sample requests, analyst briefings.
Browse syndicated reports, custom research, and sector coverage.
Call to action
nextmsc.com
Request the full market research report. Free customisation up to 80 analyst-hours · country, region, segment depth on request.
Follow us
in
f
YouTube
Twitter · X
linkedin.com/company/ next-move-strategyconsulting
facebook.com/ Next-Move-StrategyConsulting
youtube.com/channel/ UCJuVRxfBo-Dsog7BgDE4uPQ
twitter.com/ nextmsc
instagram.com/ nextmsc
X
IG
Next Move Strategy Consulting — market intelligence engineered for the next decision, not the last.
Global market intelligence · custom research · sector strategy.
© Next Move Strategy Consulting