RC 14: Machine Learning Urbanism B-Pro Bartlett

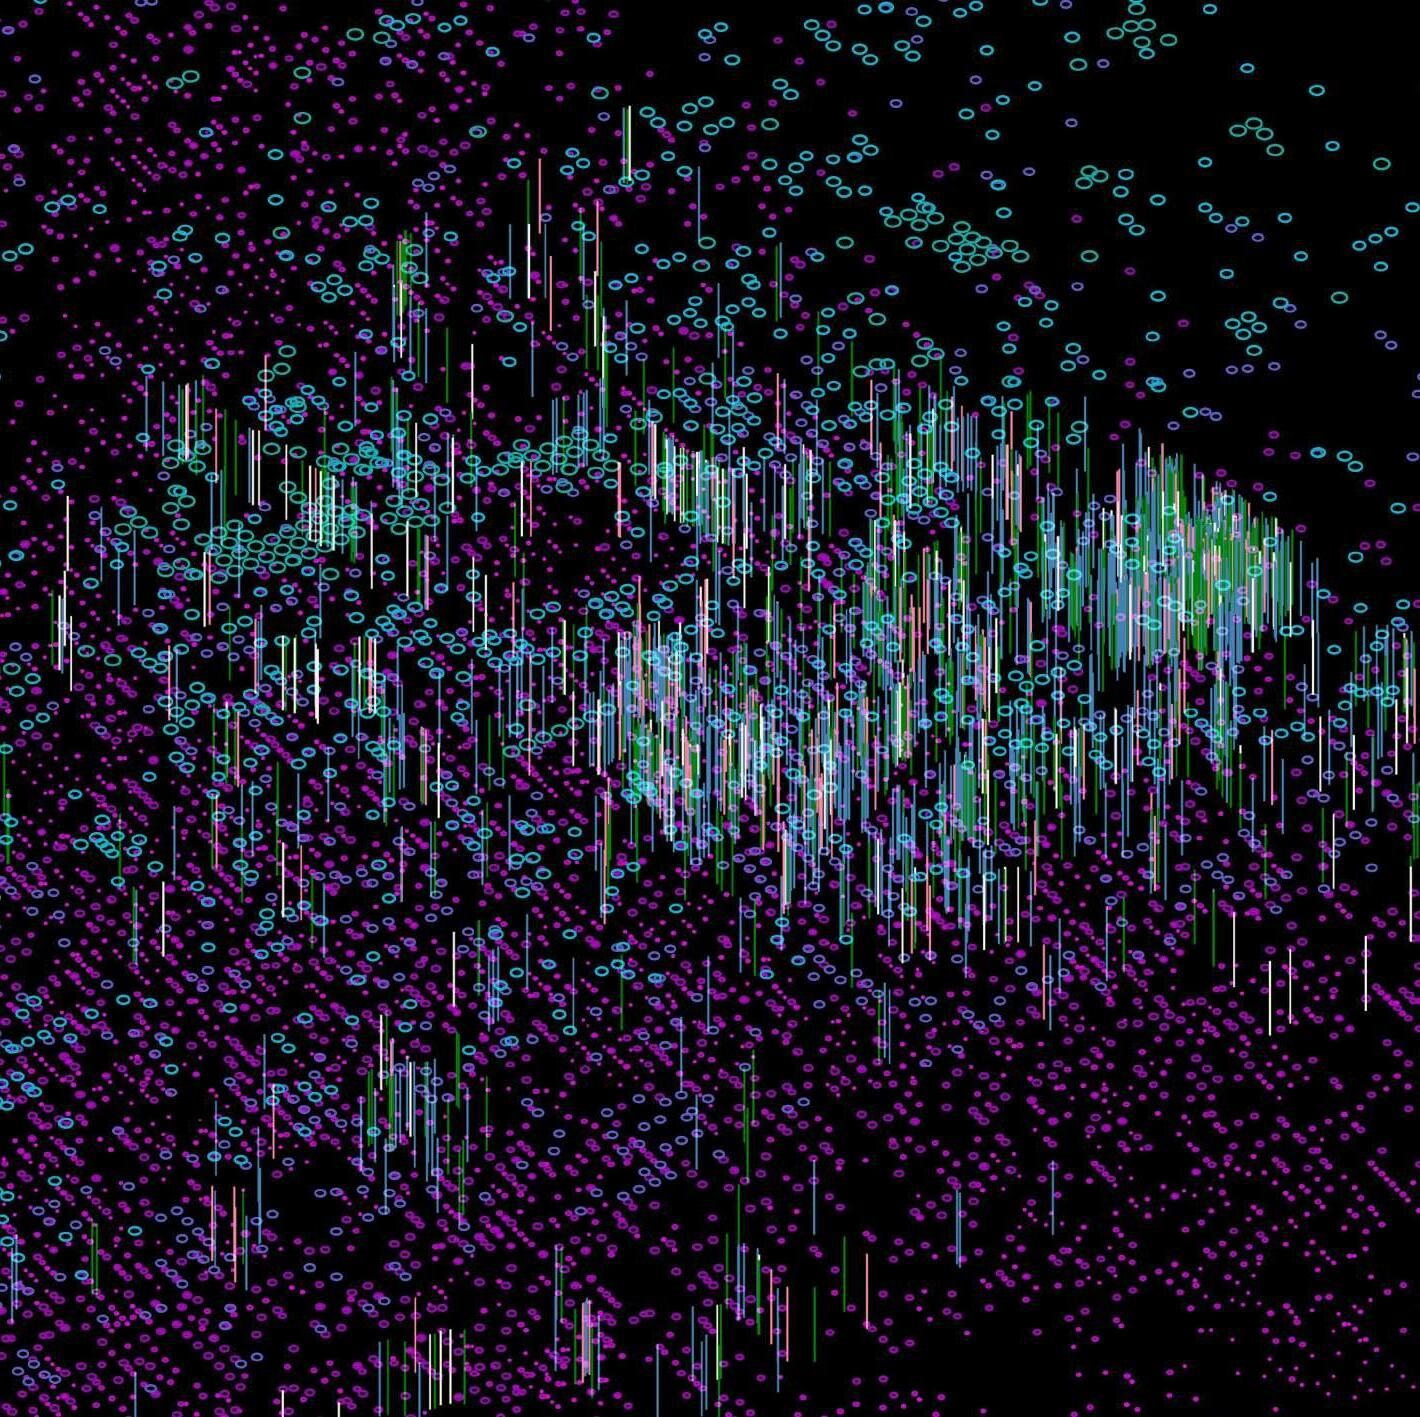 Aashi Mathur Mingze Chen Nermeen Abbas Zaidi Yanqi Zeng Shivani Sathiyamurthy
MARCH URBAN DESIGN, 2022
BARTLETT SCHOOL OF ARCHITECTURE RESEARCH CLUSTER 14, B-PRO
DESIGN TUTORS

ROBERTO BOTTAZZI, TASOS VAROUDIS, EIRINI TSOUKNIDA, VASILEIOS PAPALEXOPOULOS, MARGA RITA CHASKOPOULOU, PROVIDES NG
GROUP MEMBERS
AASHI MATHUR, MINGZE CHEN, NERMEEN ABBAS ZAIDI, YANQI ZENG, SHIVANI SATHIYAMURTHY
AGRO -MATRIX





How can we promote a food-centric lifestyle at a neighbourhood level?
BACKGROUND AND CONCEPT FOOD AND ENVIRONMENT [PART ONE]
This section explains food transportation at different scales, historic timeline of agriculture and concept generation.
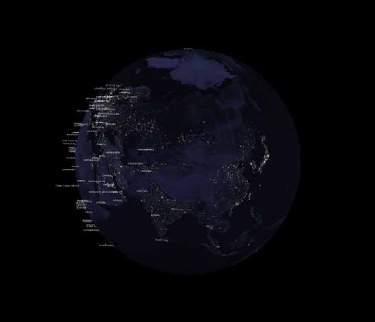
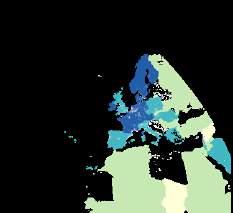
WORLDWIDE ANALYTICS | Food Security of 113 Cities by the United Nations

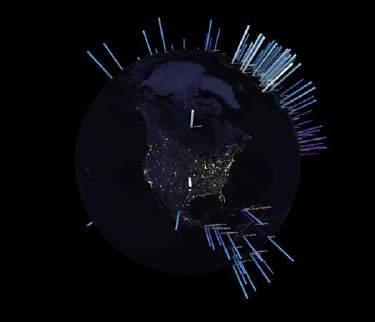
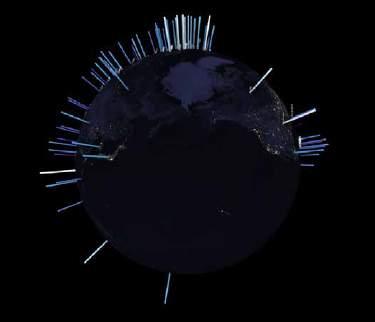
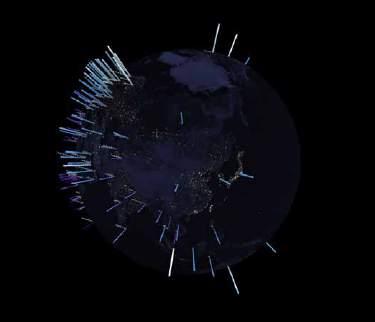
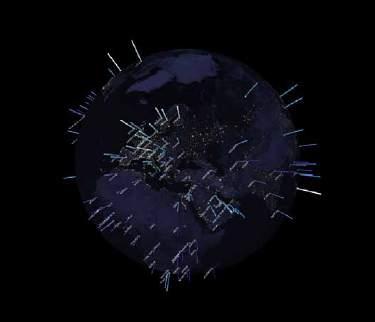
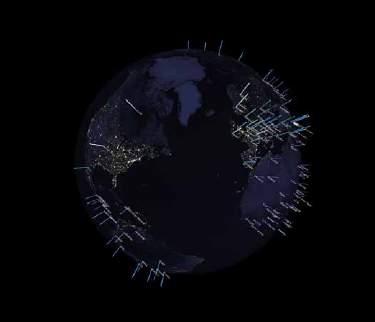

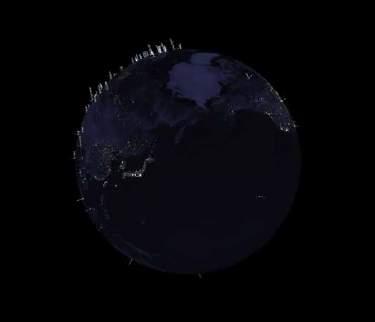
The Global Food Security Index consists of a set of indices from 113 countries. It measures food security across most of the countries of the world. The score includes Affordability, Availability, Quality & Safety.
UK: 79.1 Ranking: 17th
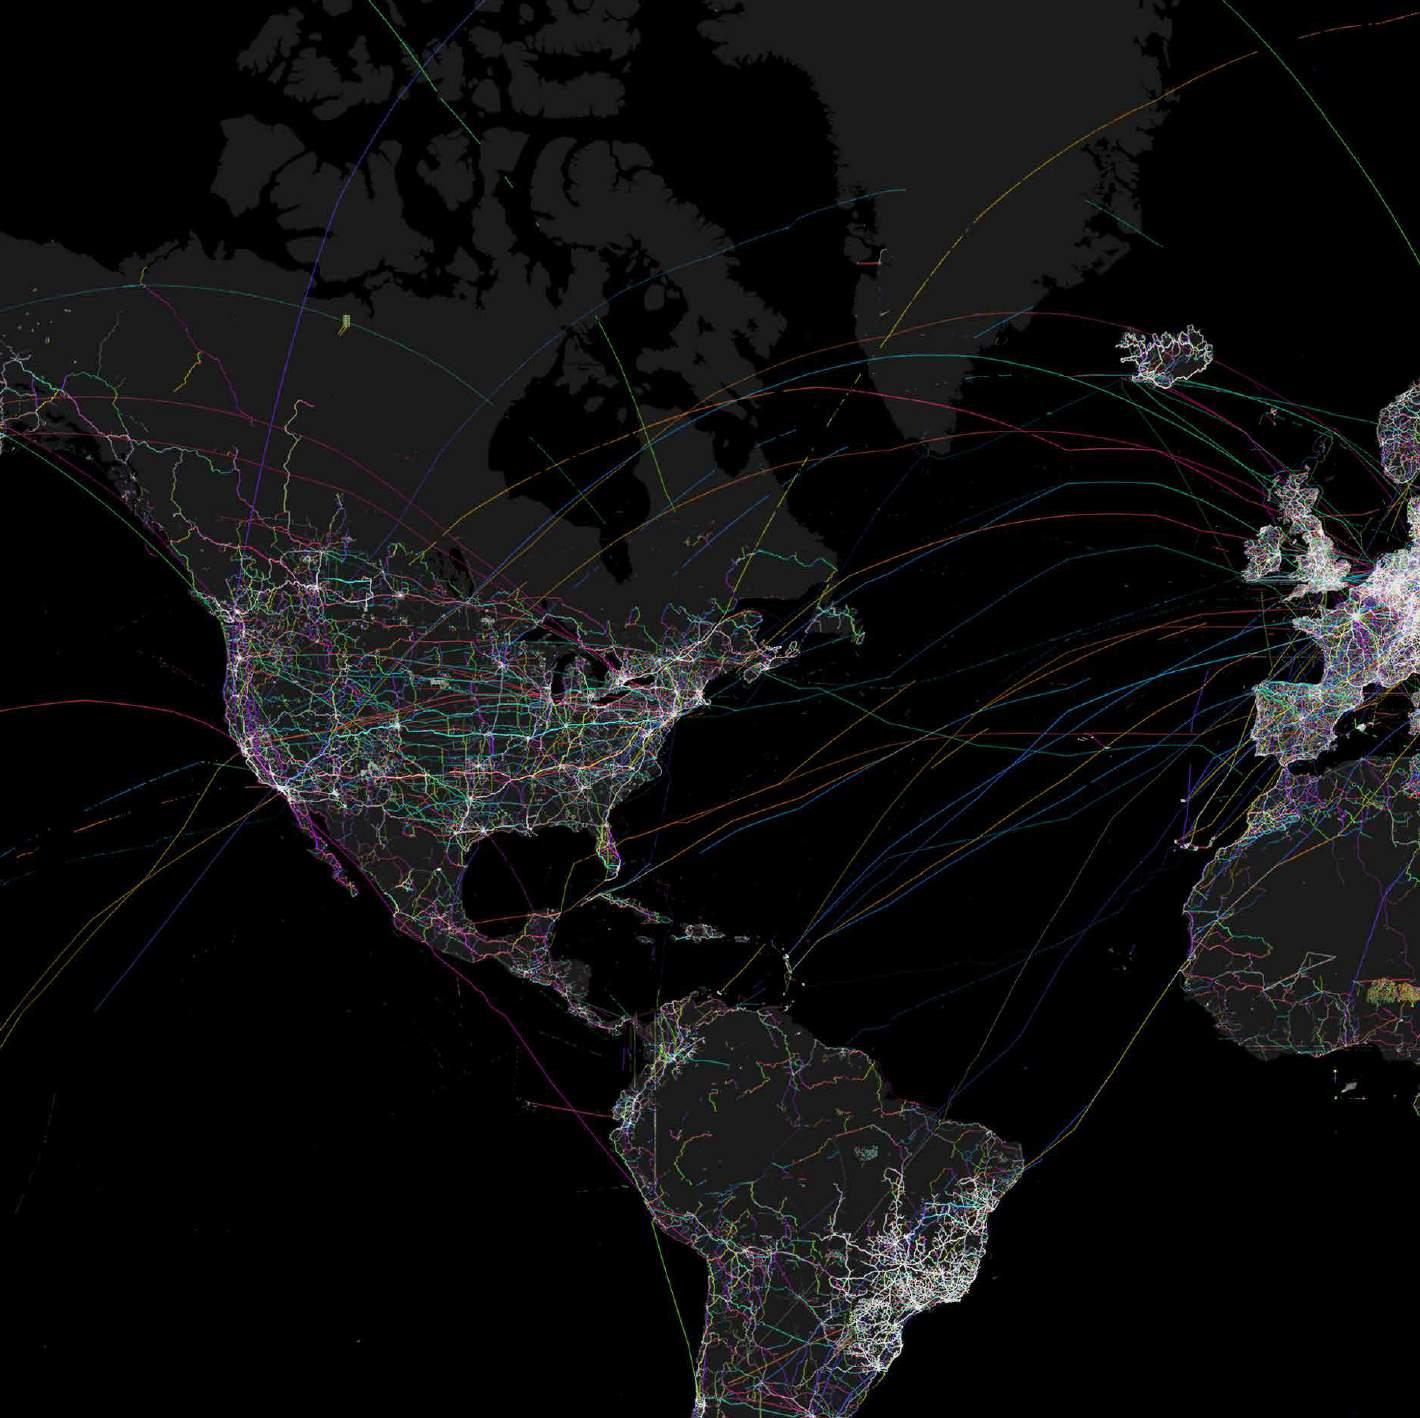
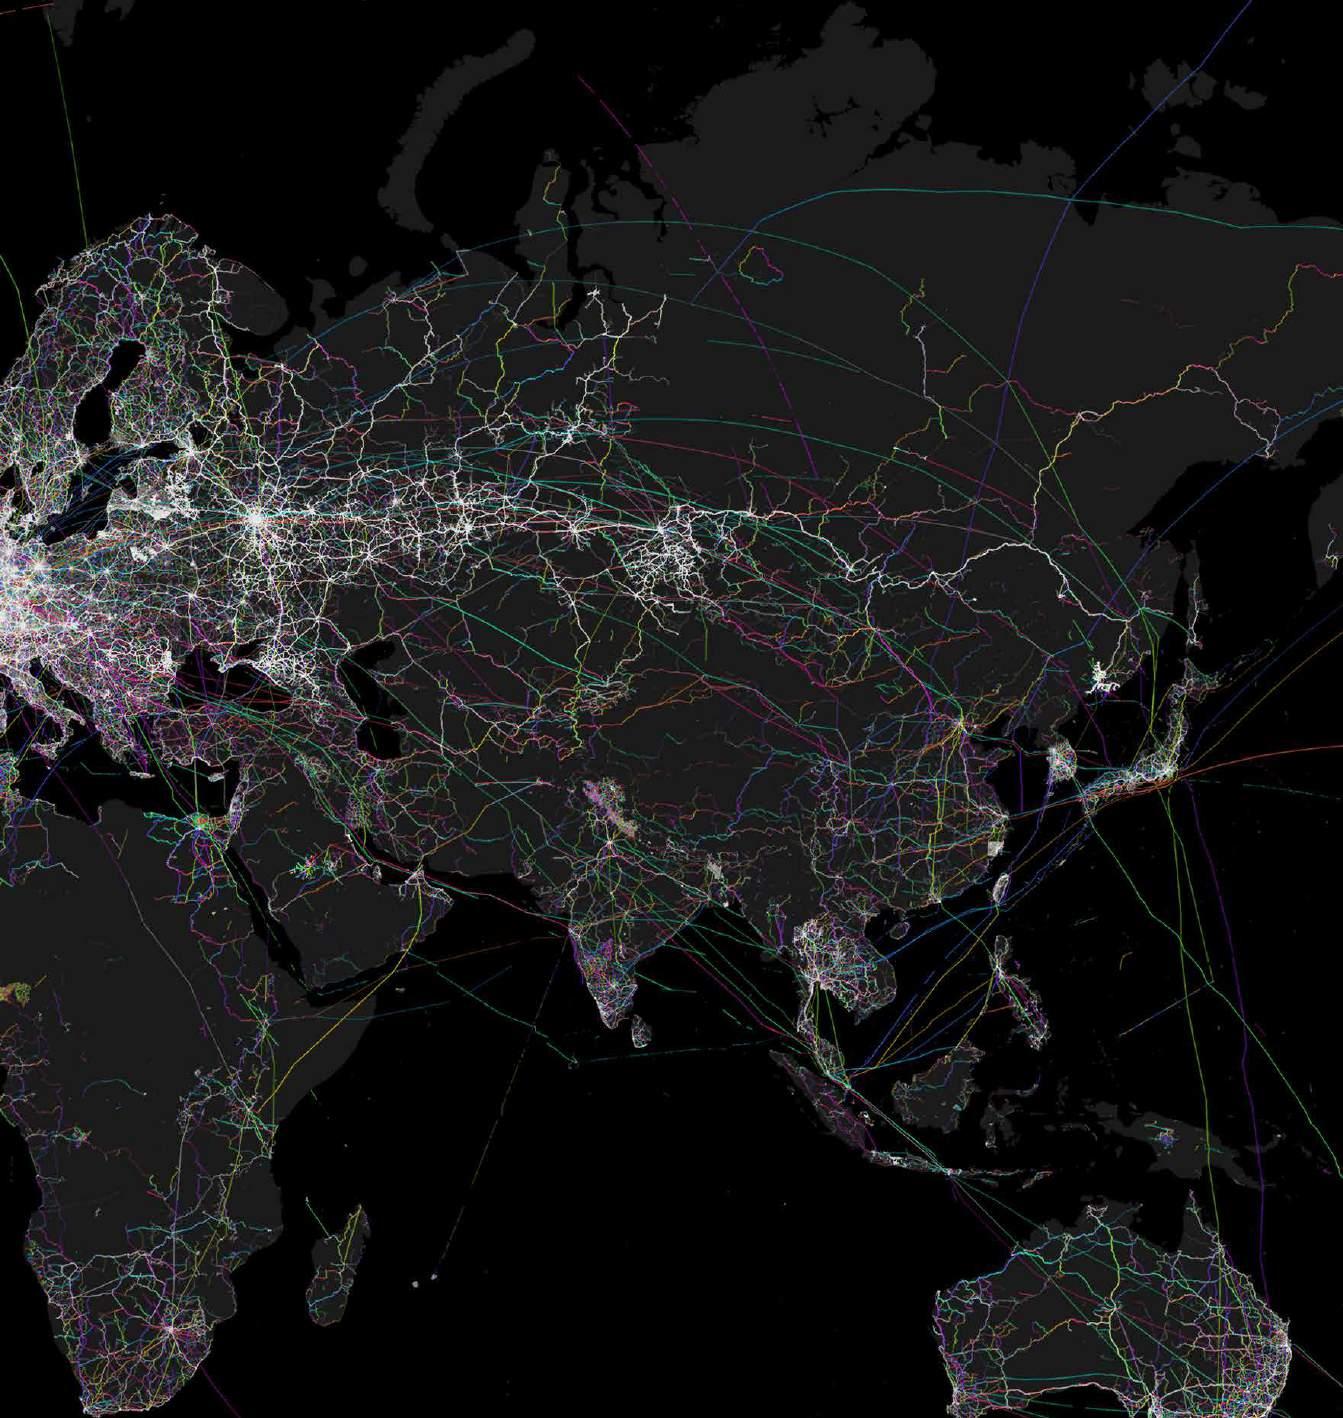
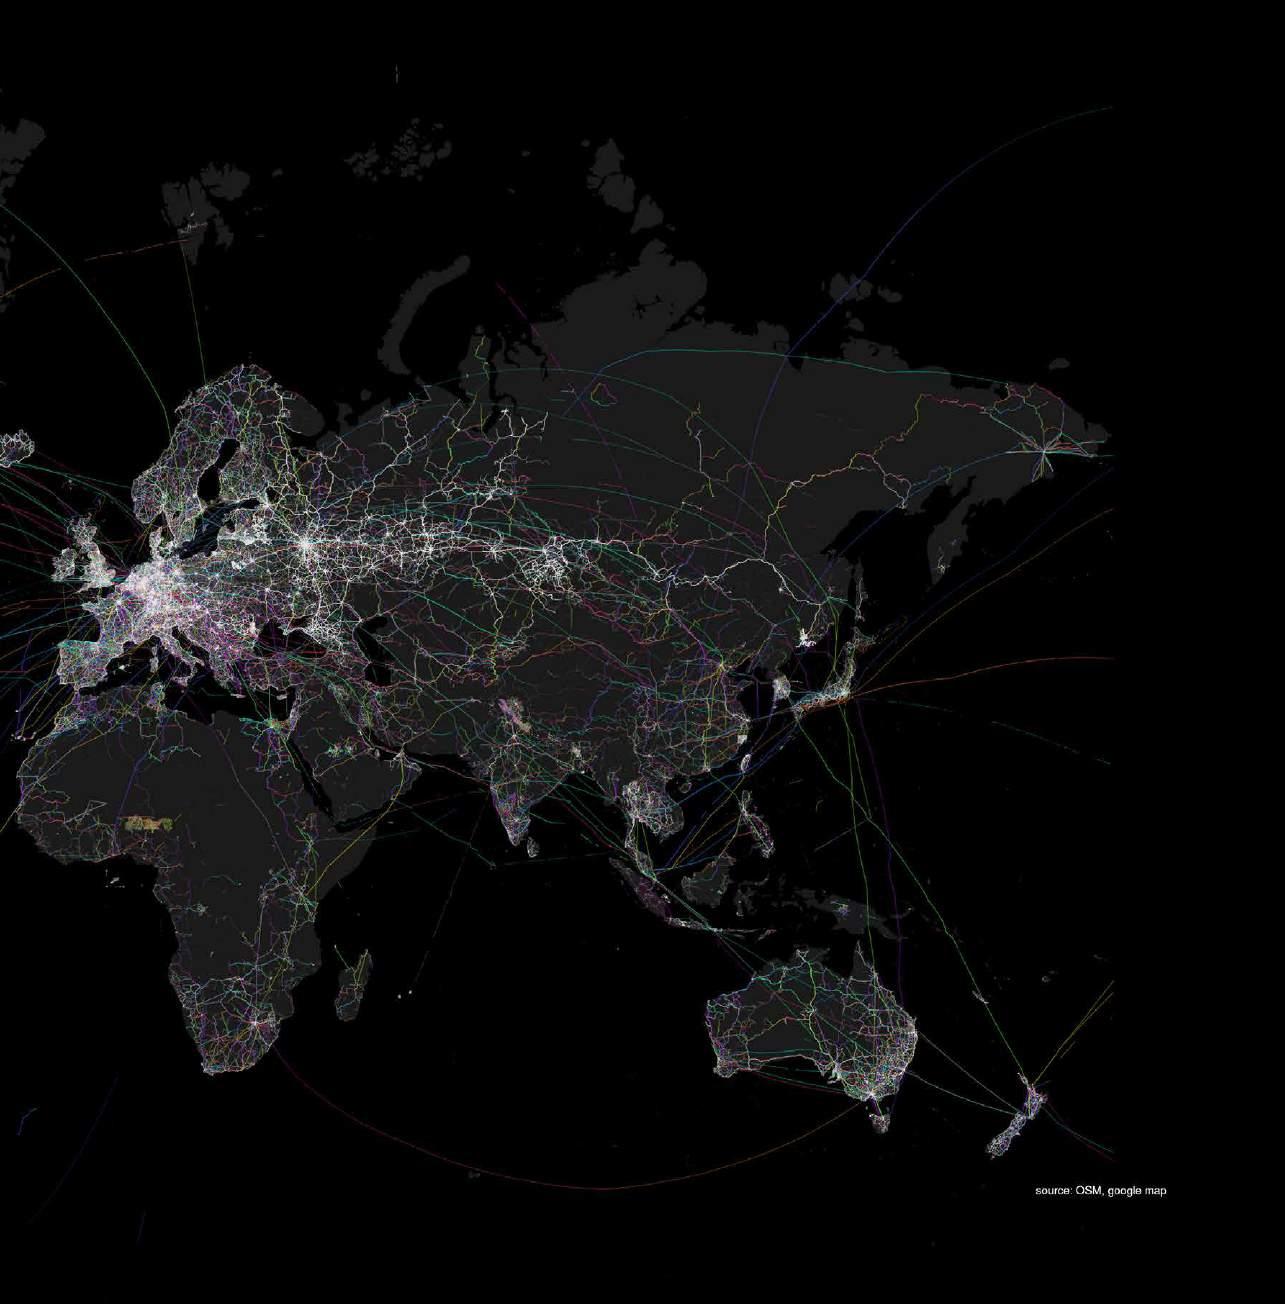
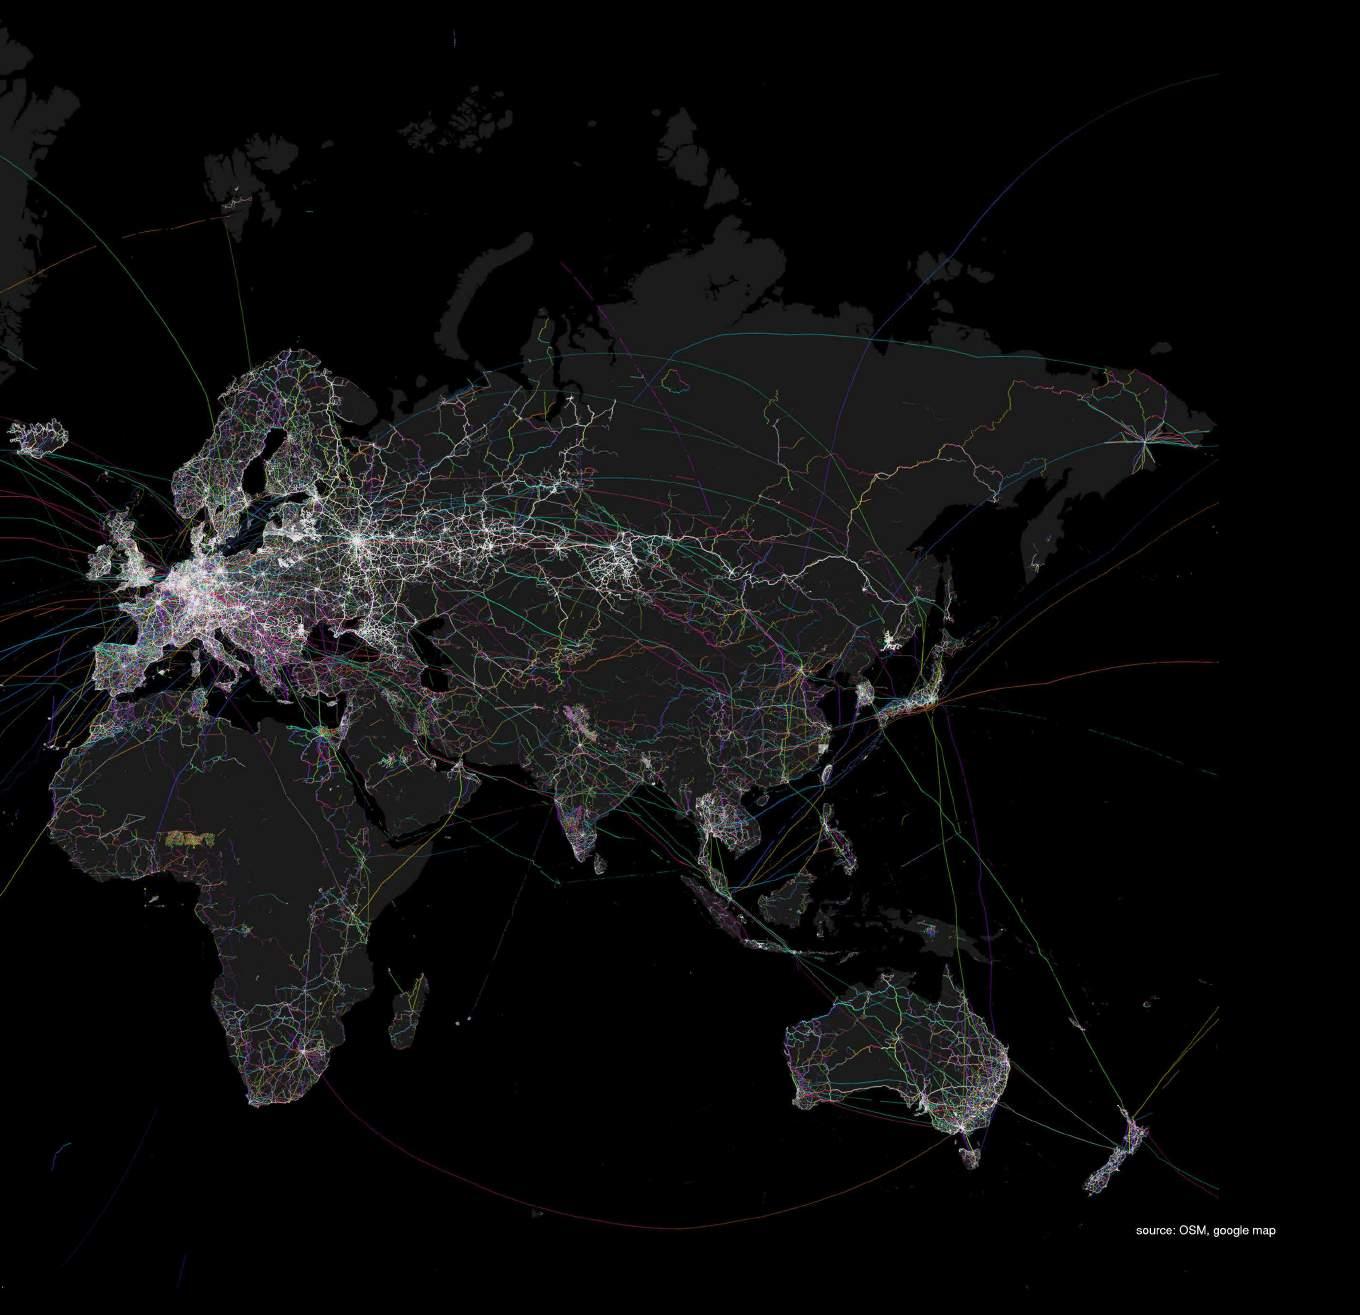
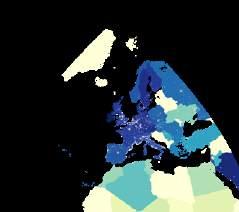
WORLDWIDE ANALYTICS | WORLDWIDE FOOD TRANSPORTATION
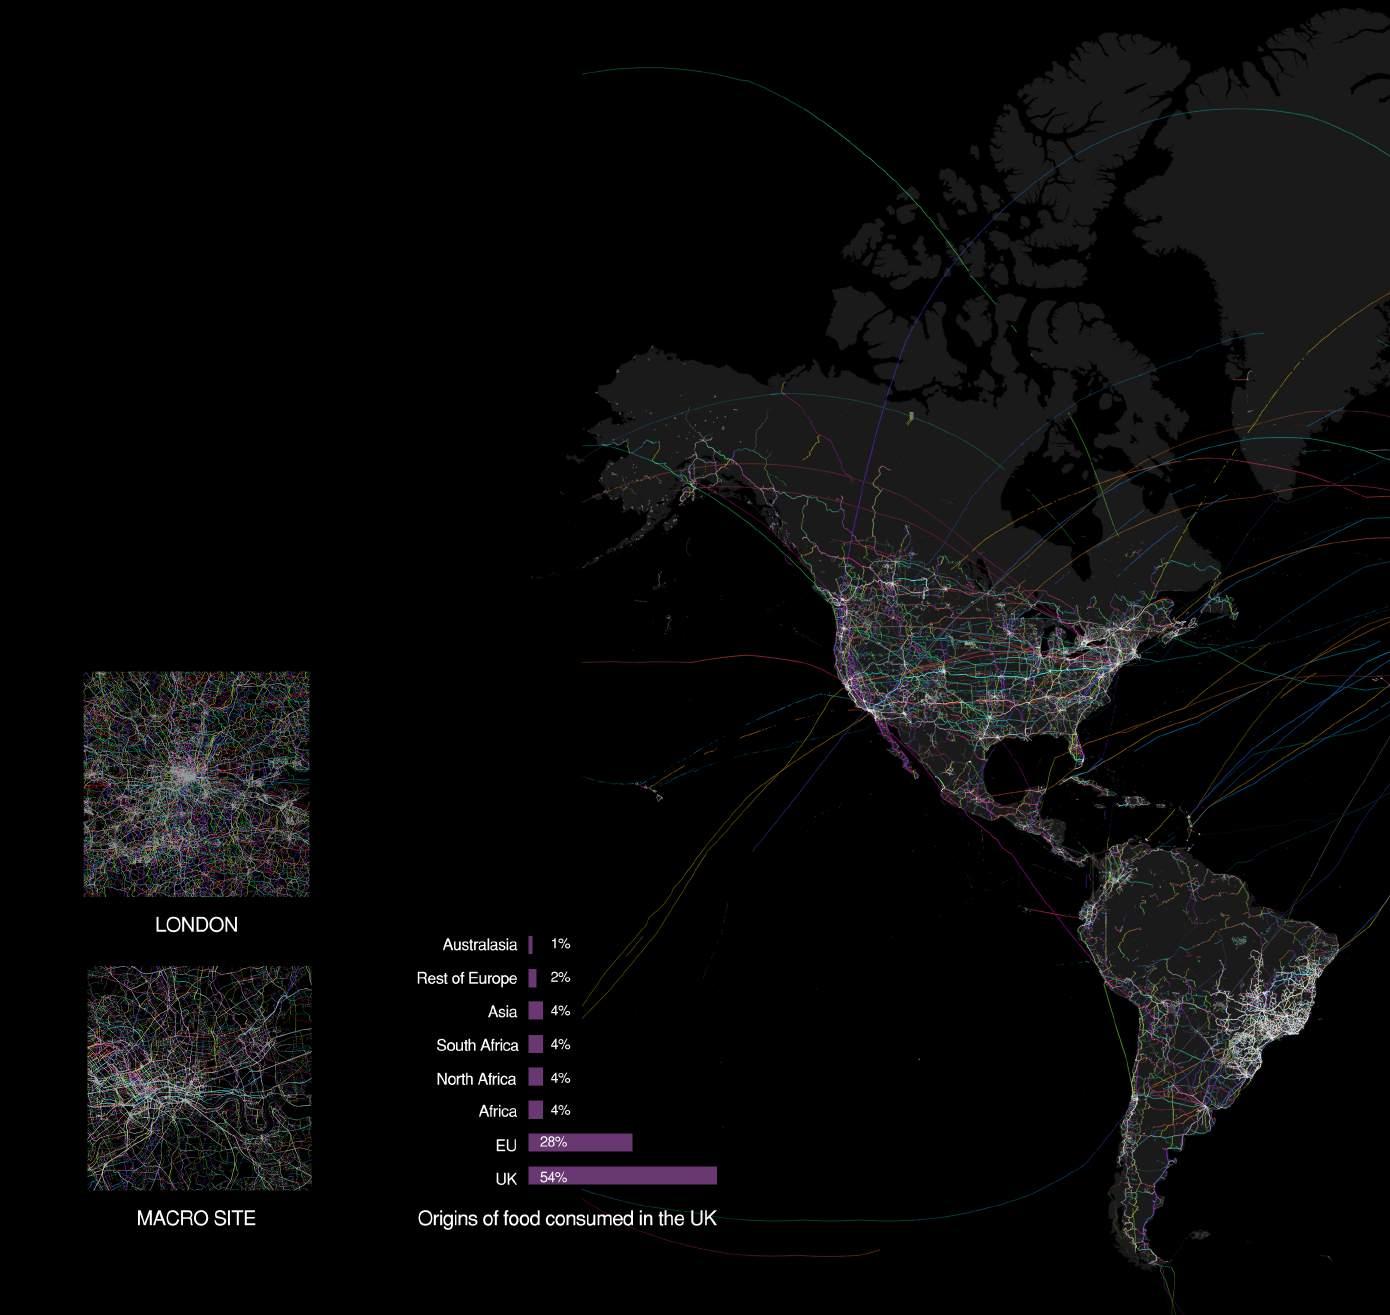
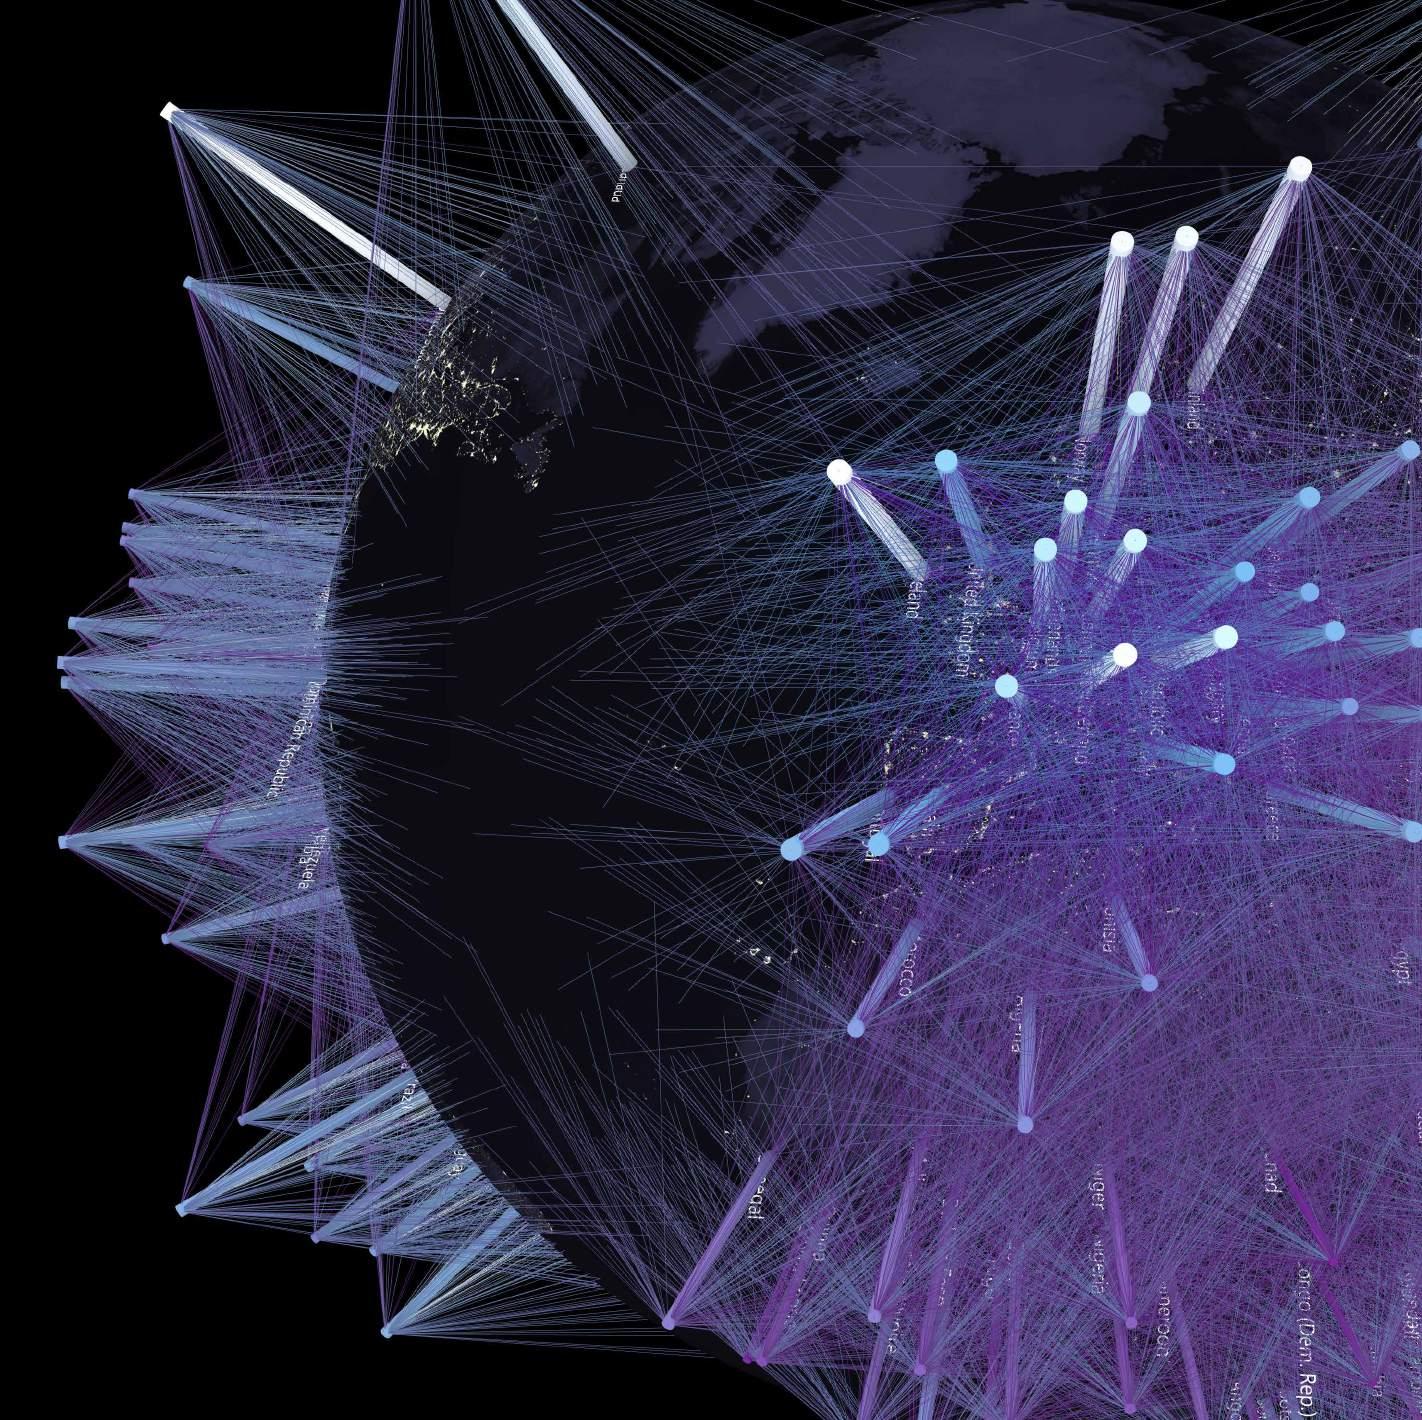
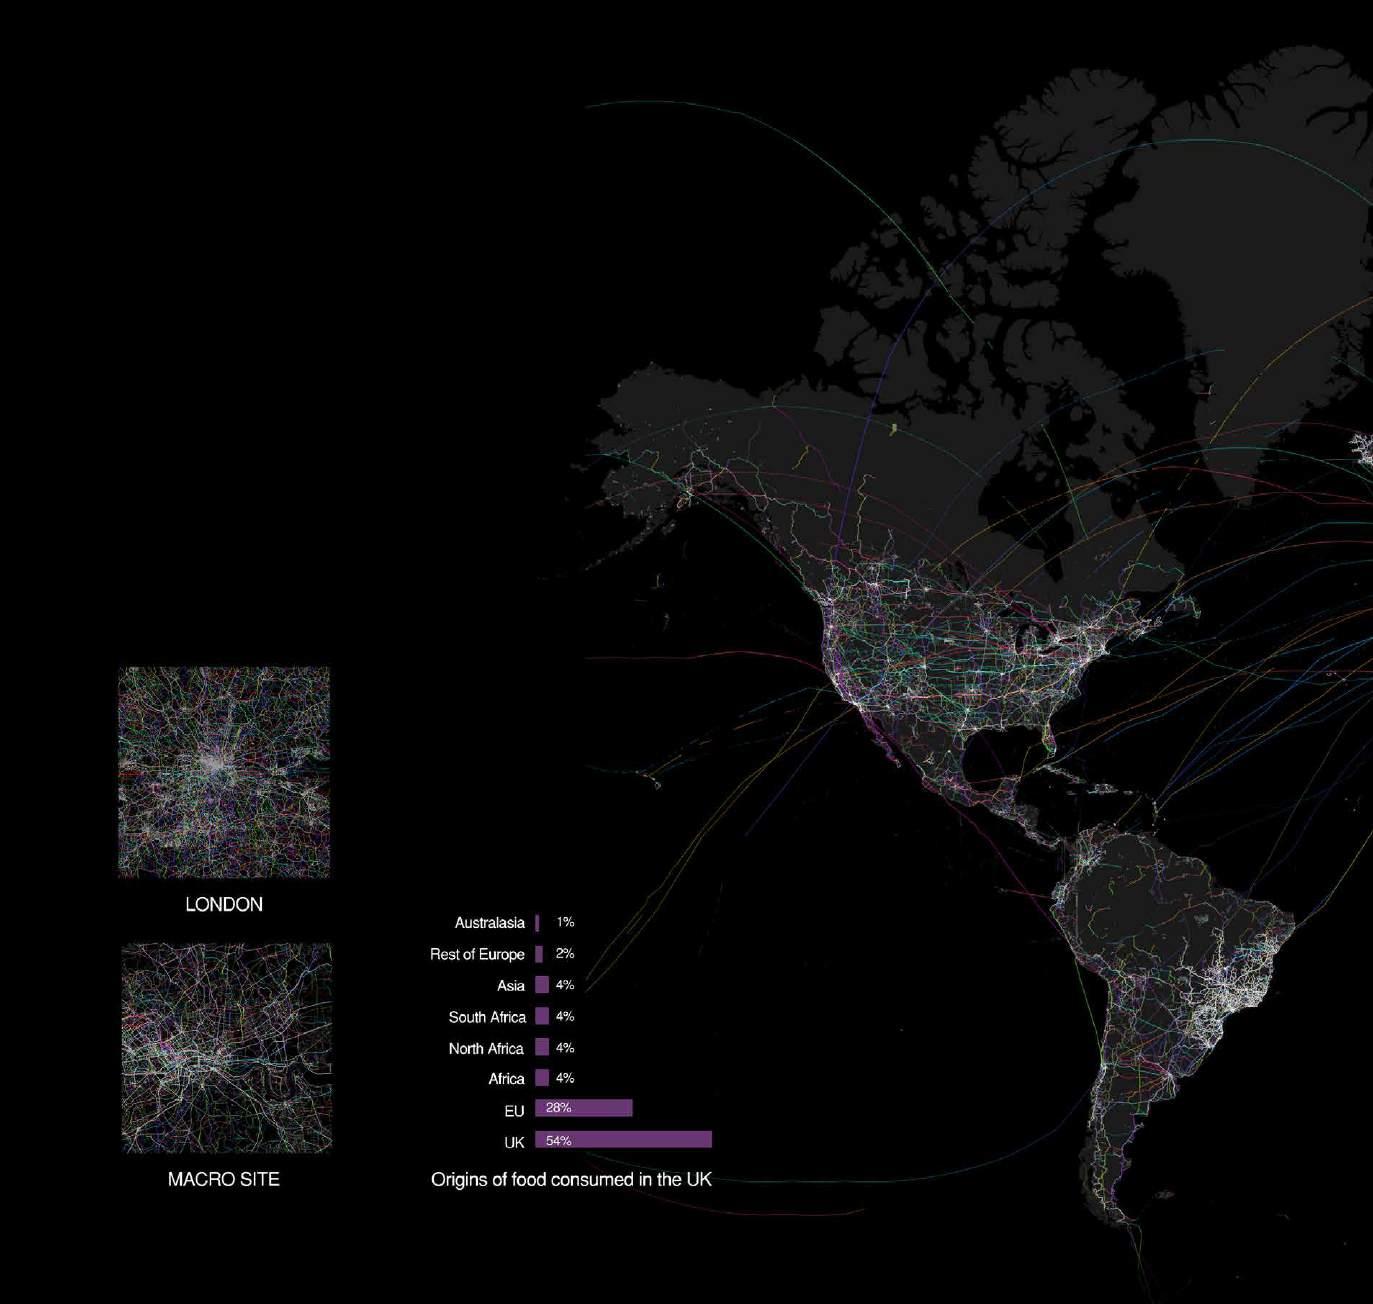
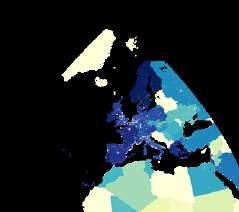
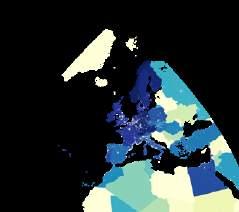
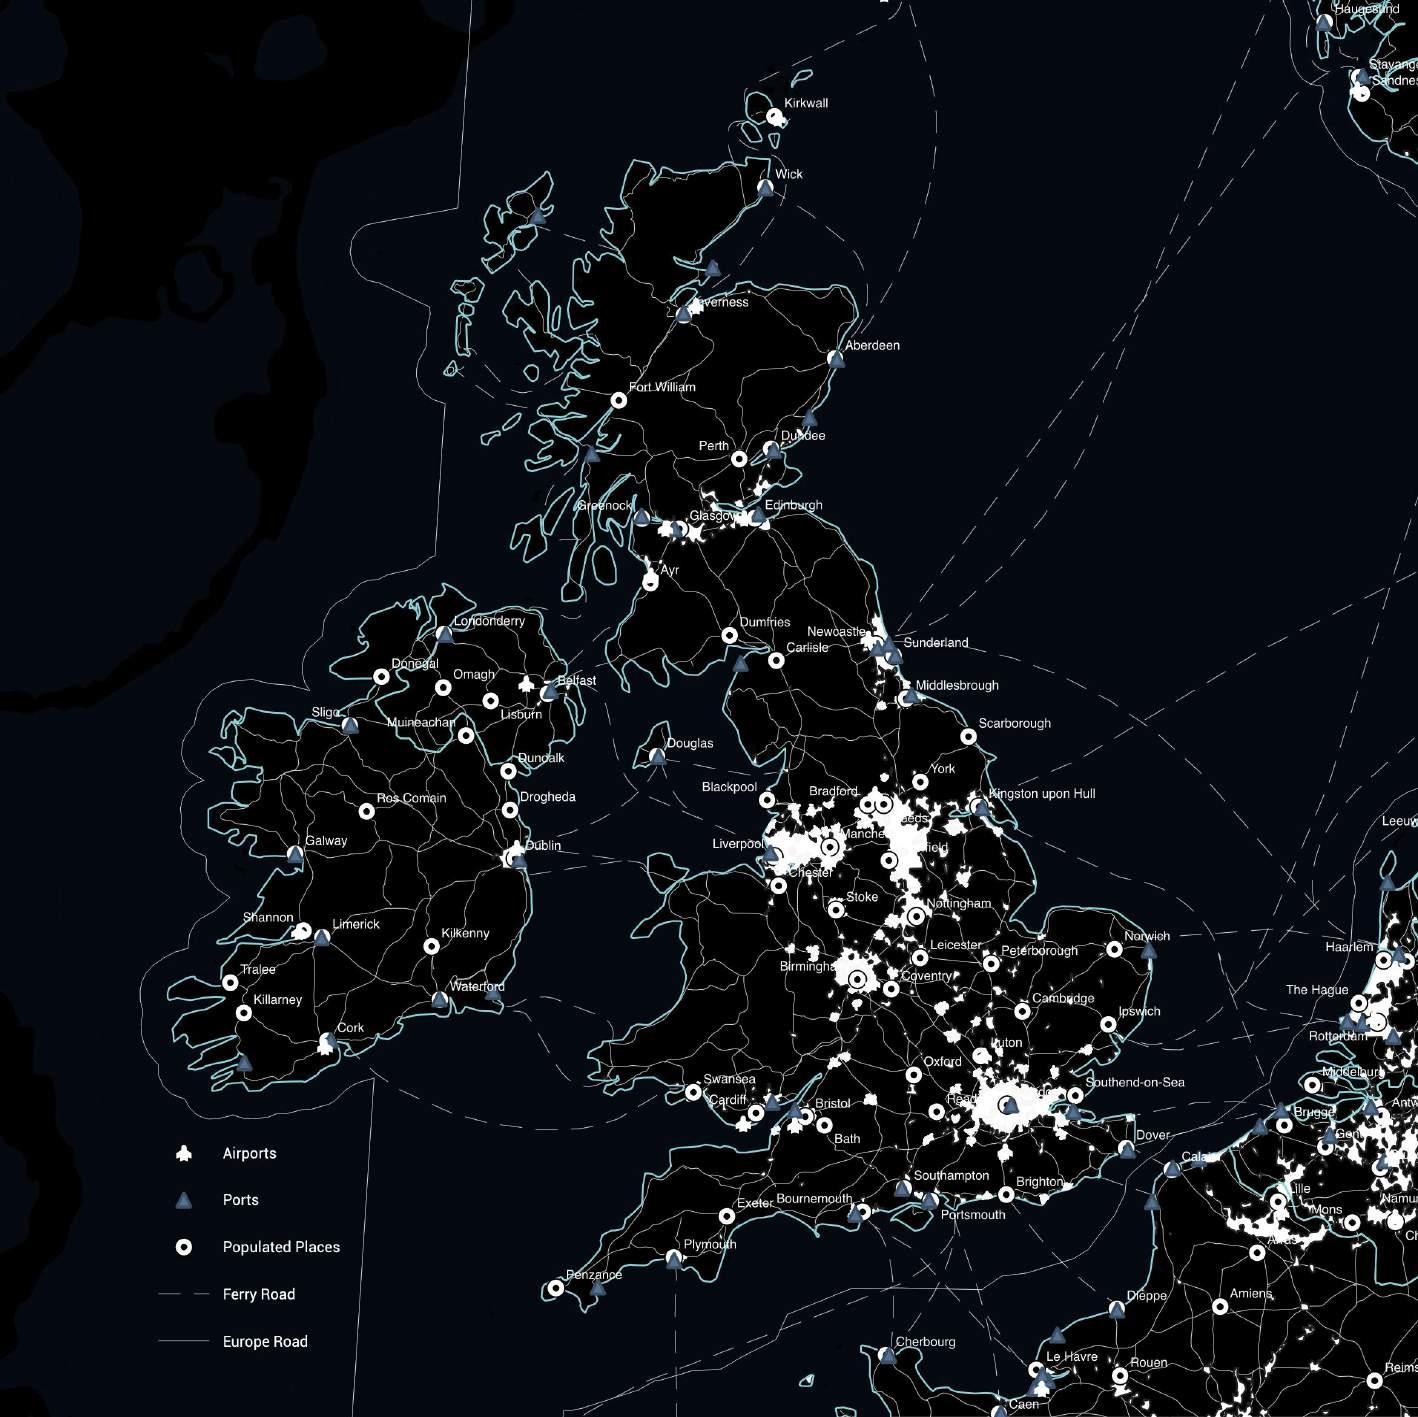
The food transport network depicts the import and export of food on a global scale. As can be seen from this map, Europe has a significant share. According to the relevant data, the UK relies heavily on food imports from the EU, which undoubtedly increases food costs and environmental pollution.
AFFORDABILITY
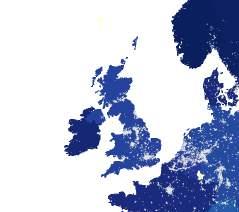
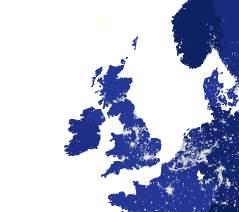
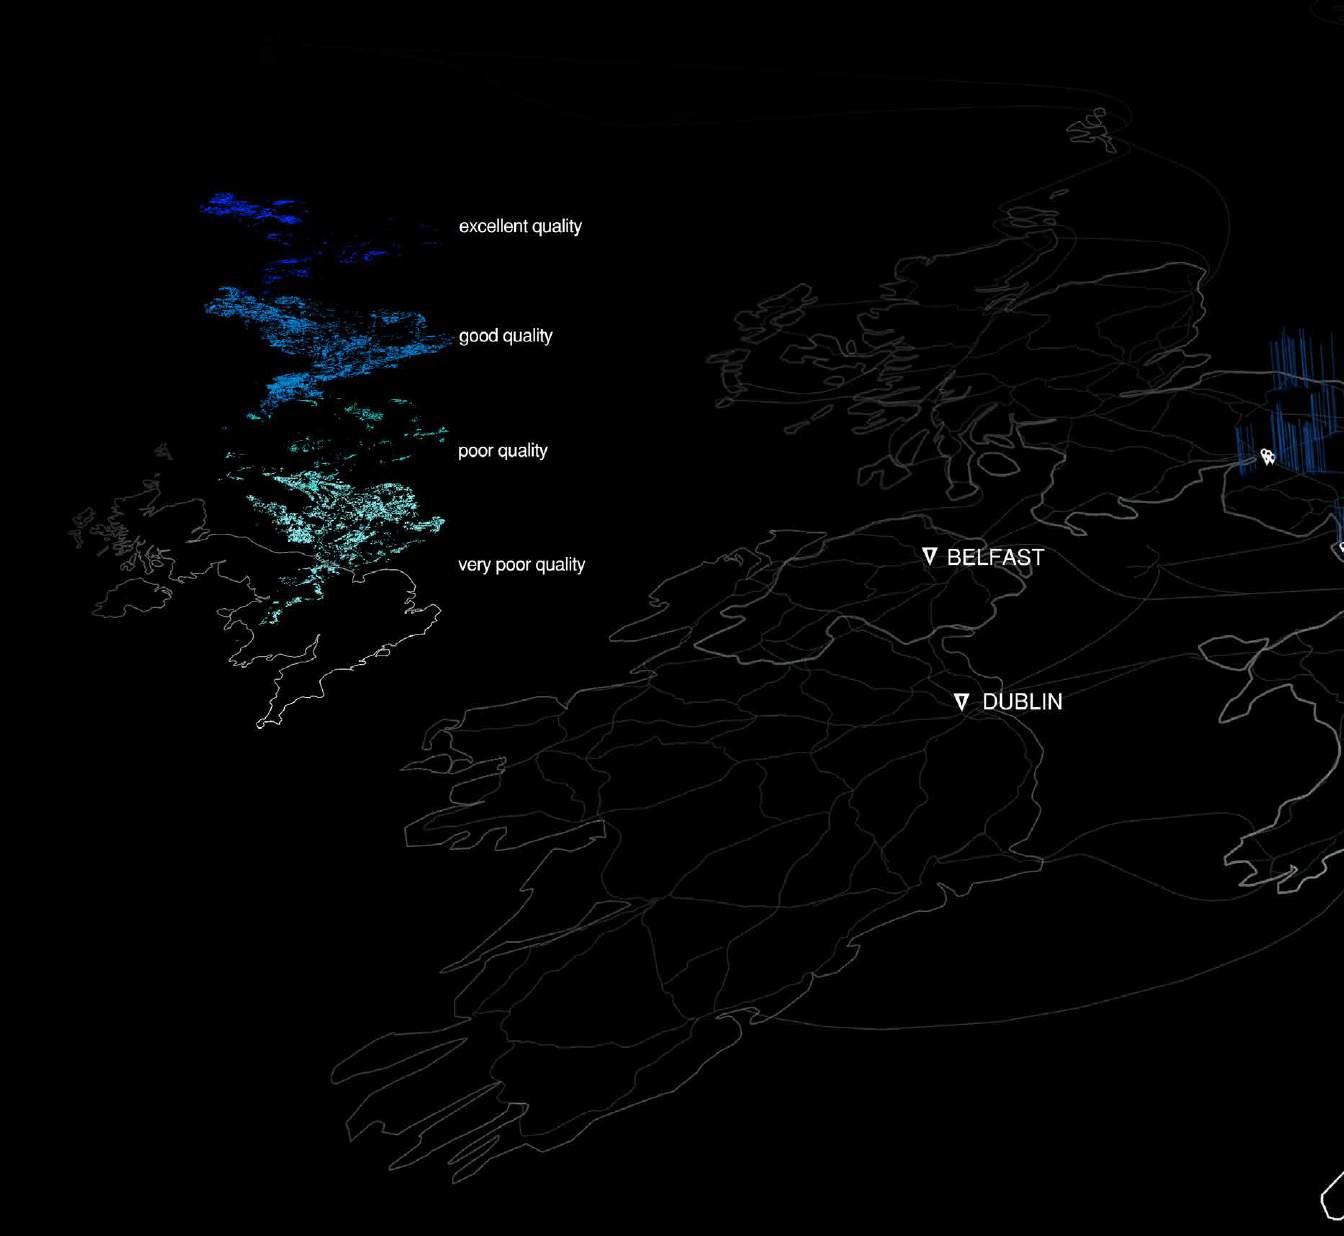
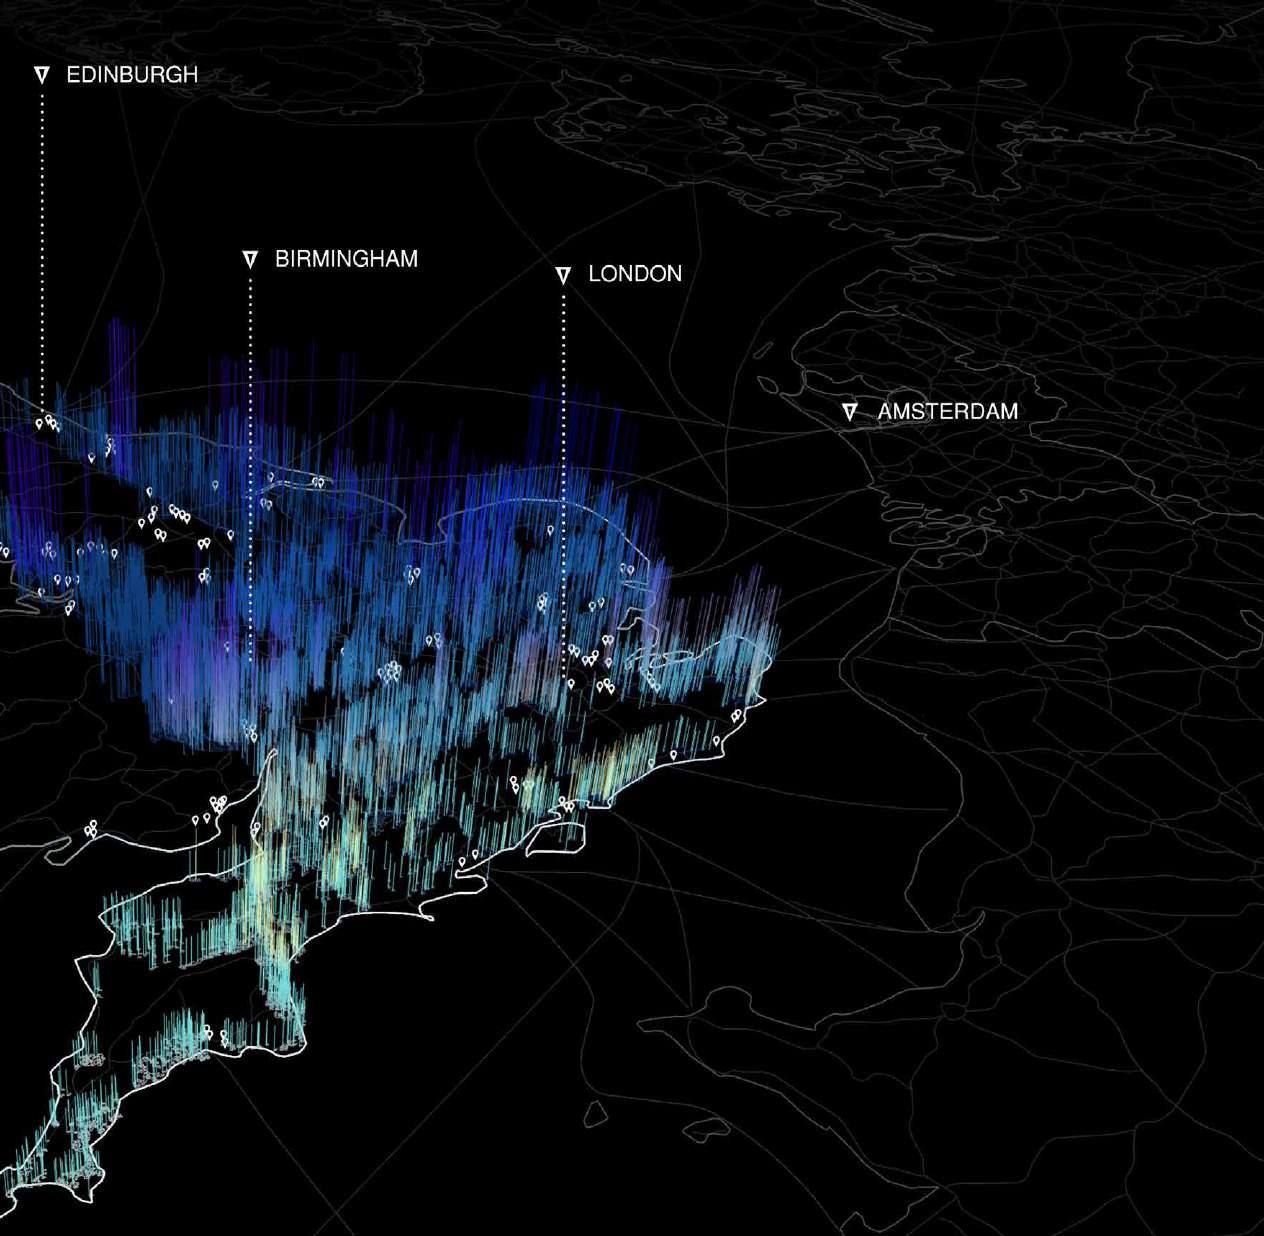
UK SCALE ANALYTICS | Mapping of England Farm Quality
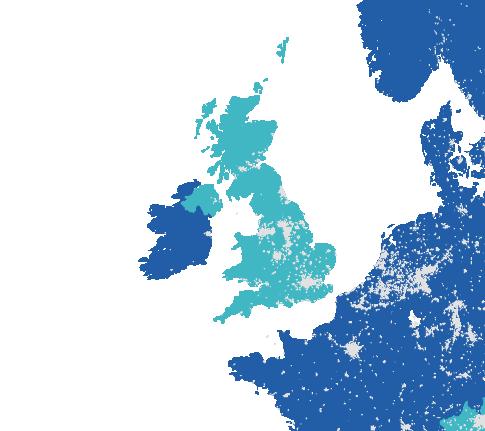
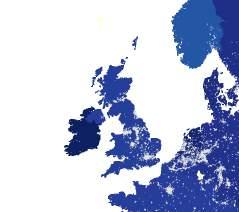
The mapping of UK food print shows the farm quality into 4 classes: excellent quality, good quality, poor quality, very poor quality. As the result shows, the built-up London area's farm quality is low.
UK SCALE ANALYTICS | Historical Timeline
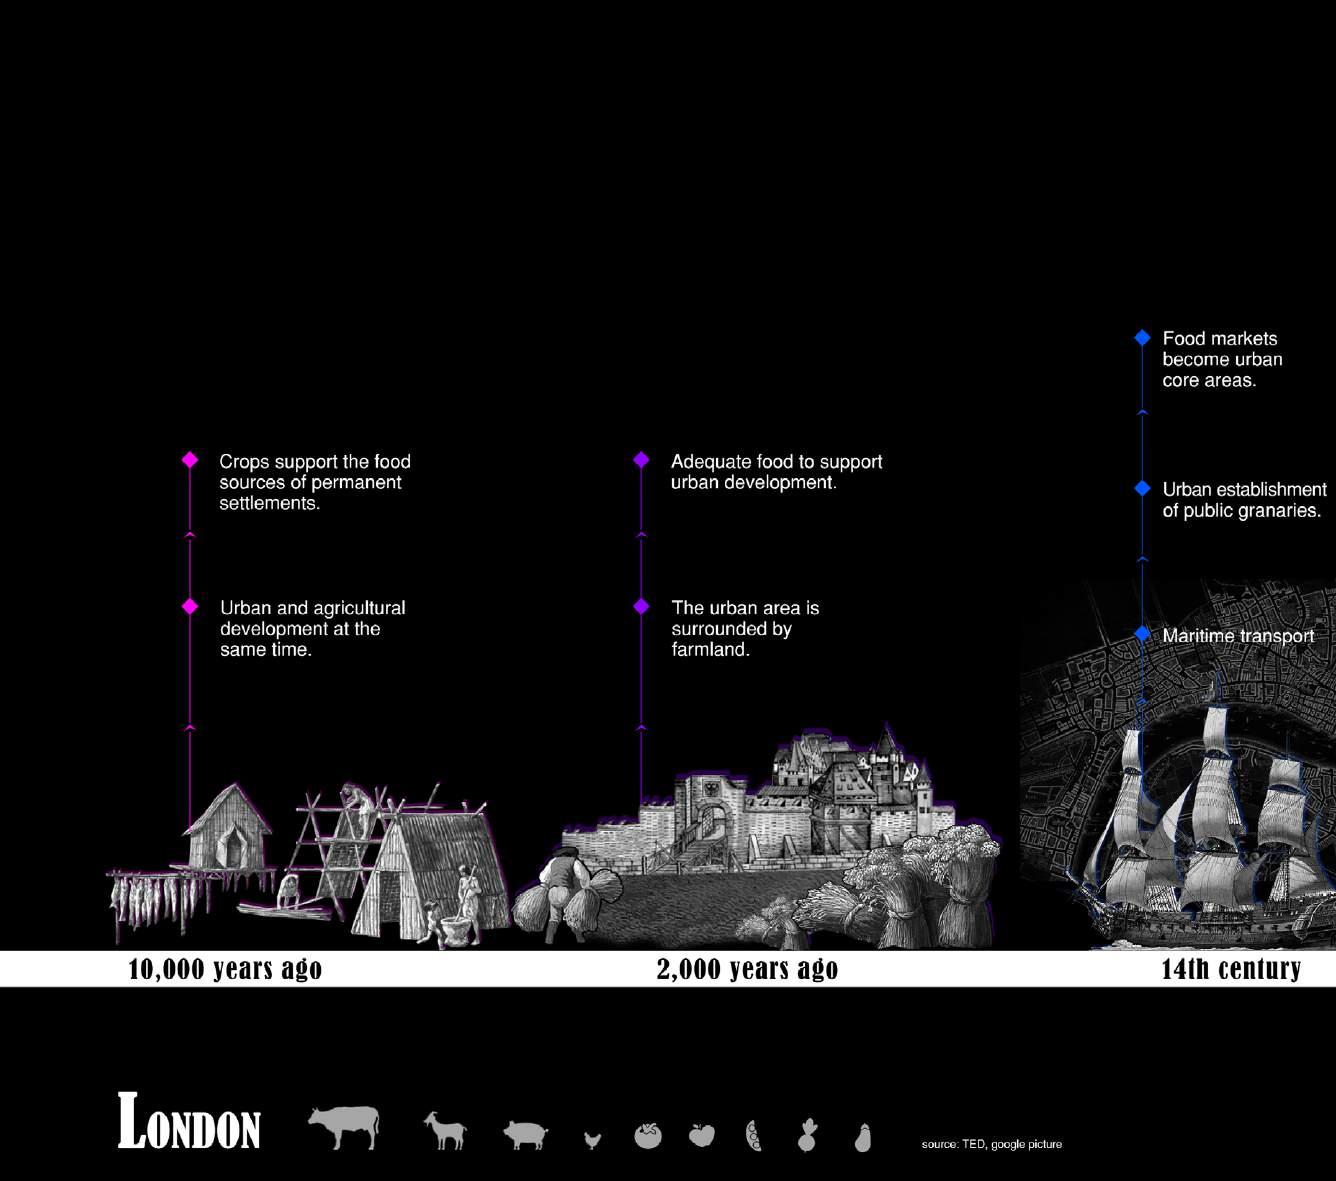
10,000 years ago: Agriculture and cities occurred
14th century: Development of maritime transport
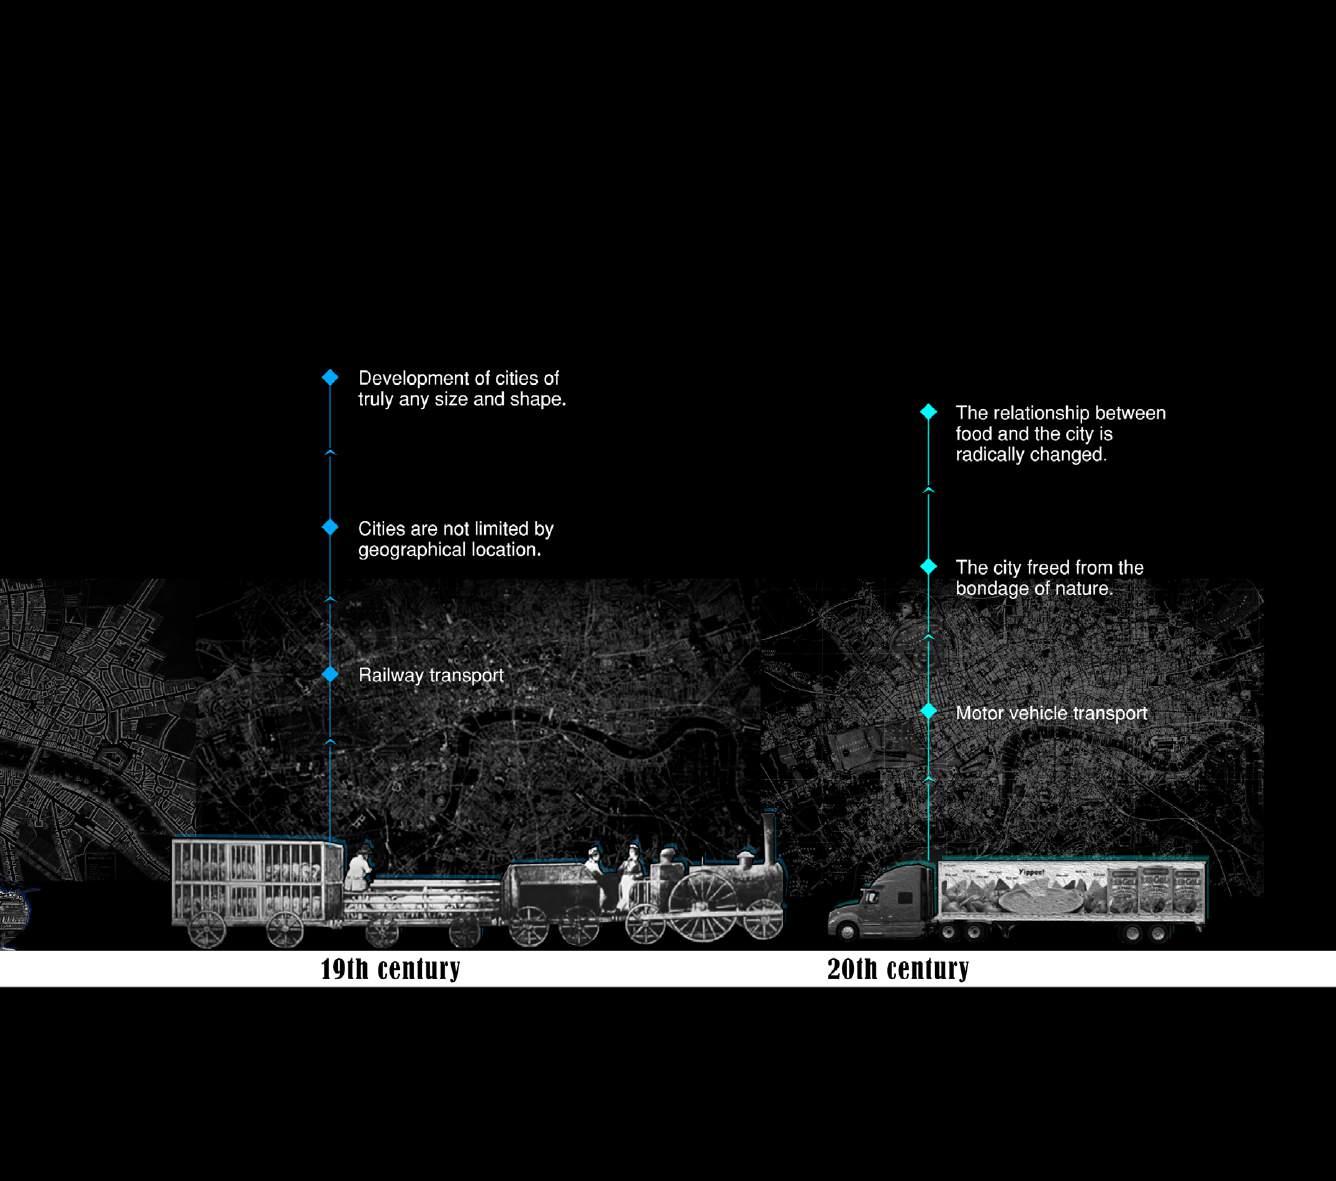
19th century: Train transport-Food transported to the city from rural slaughter
20th century: The car replaces the train for food transportation)
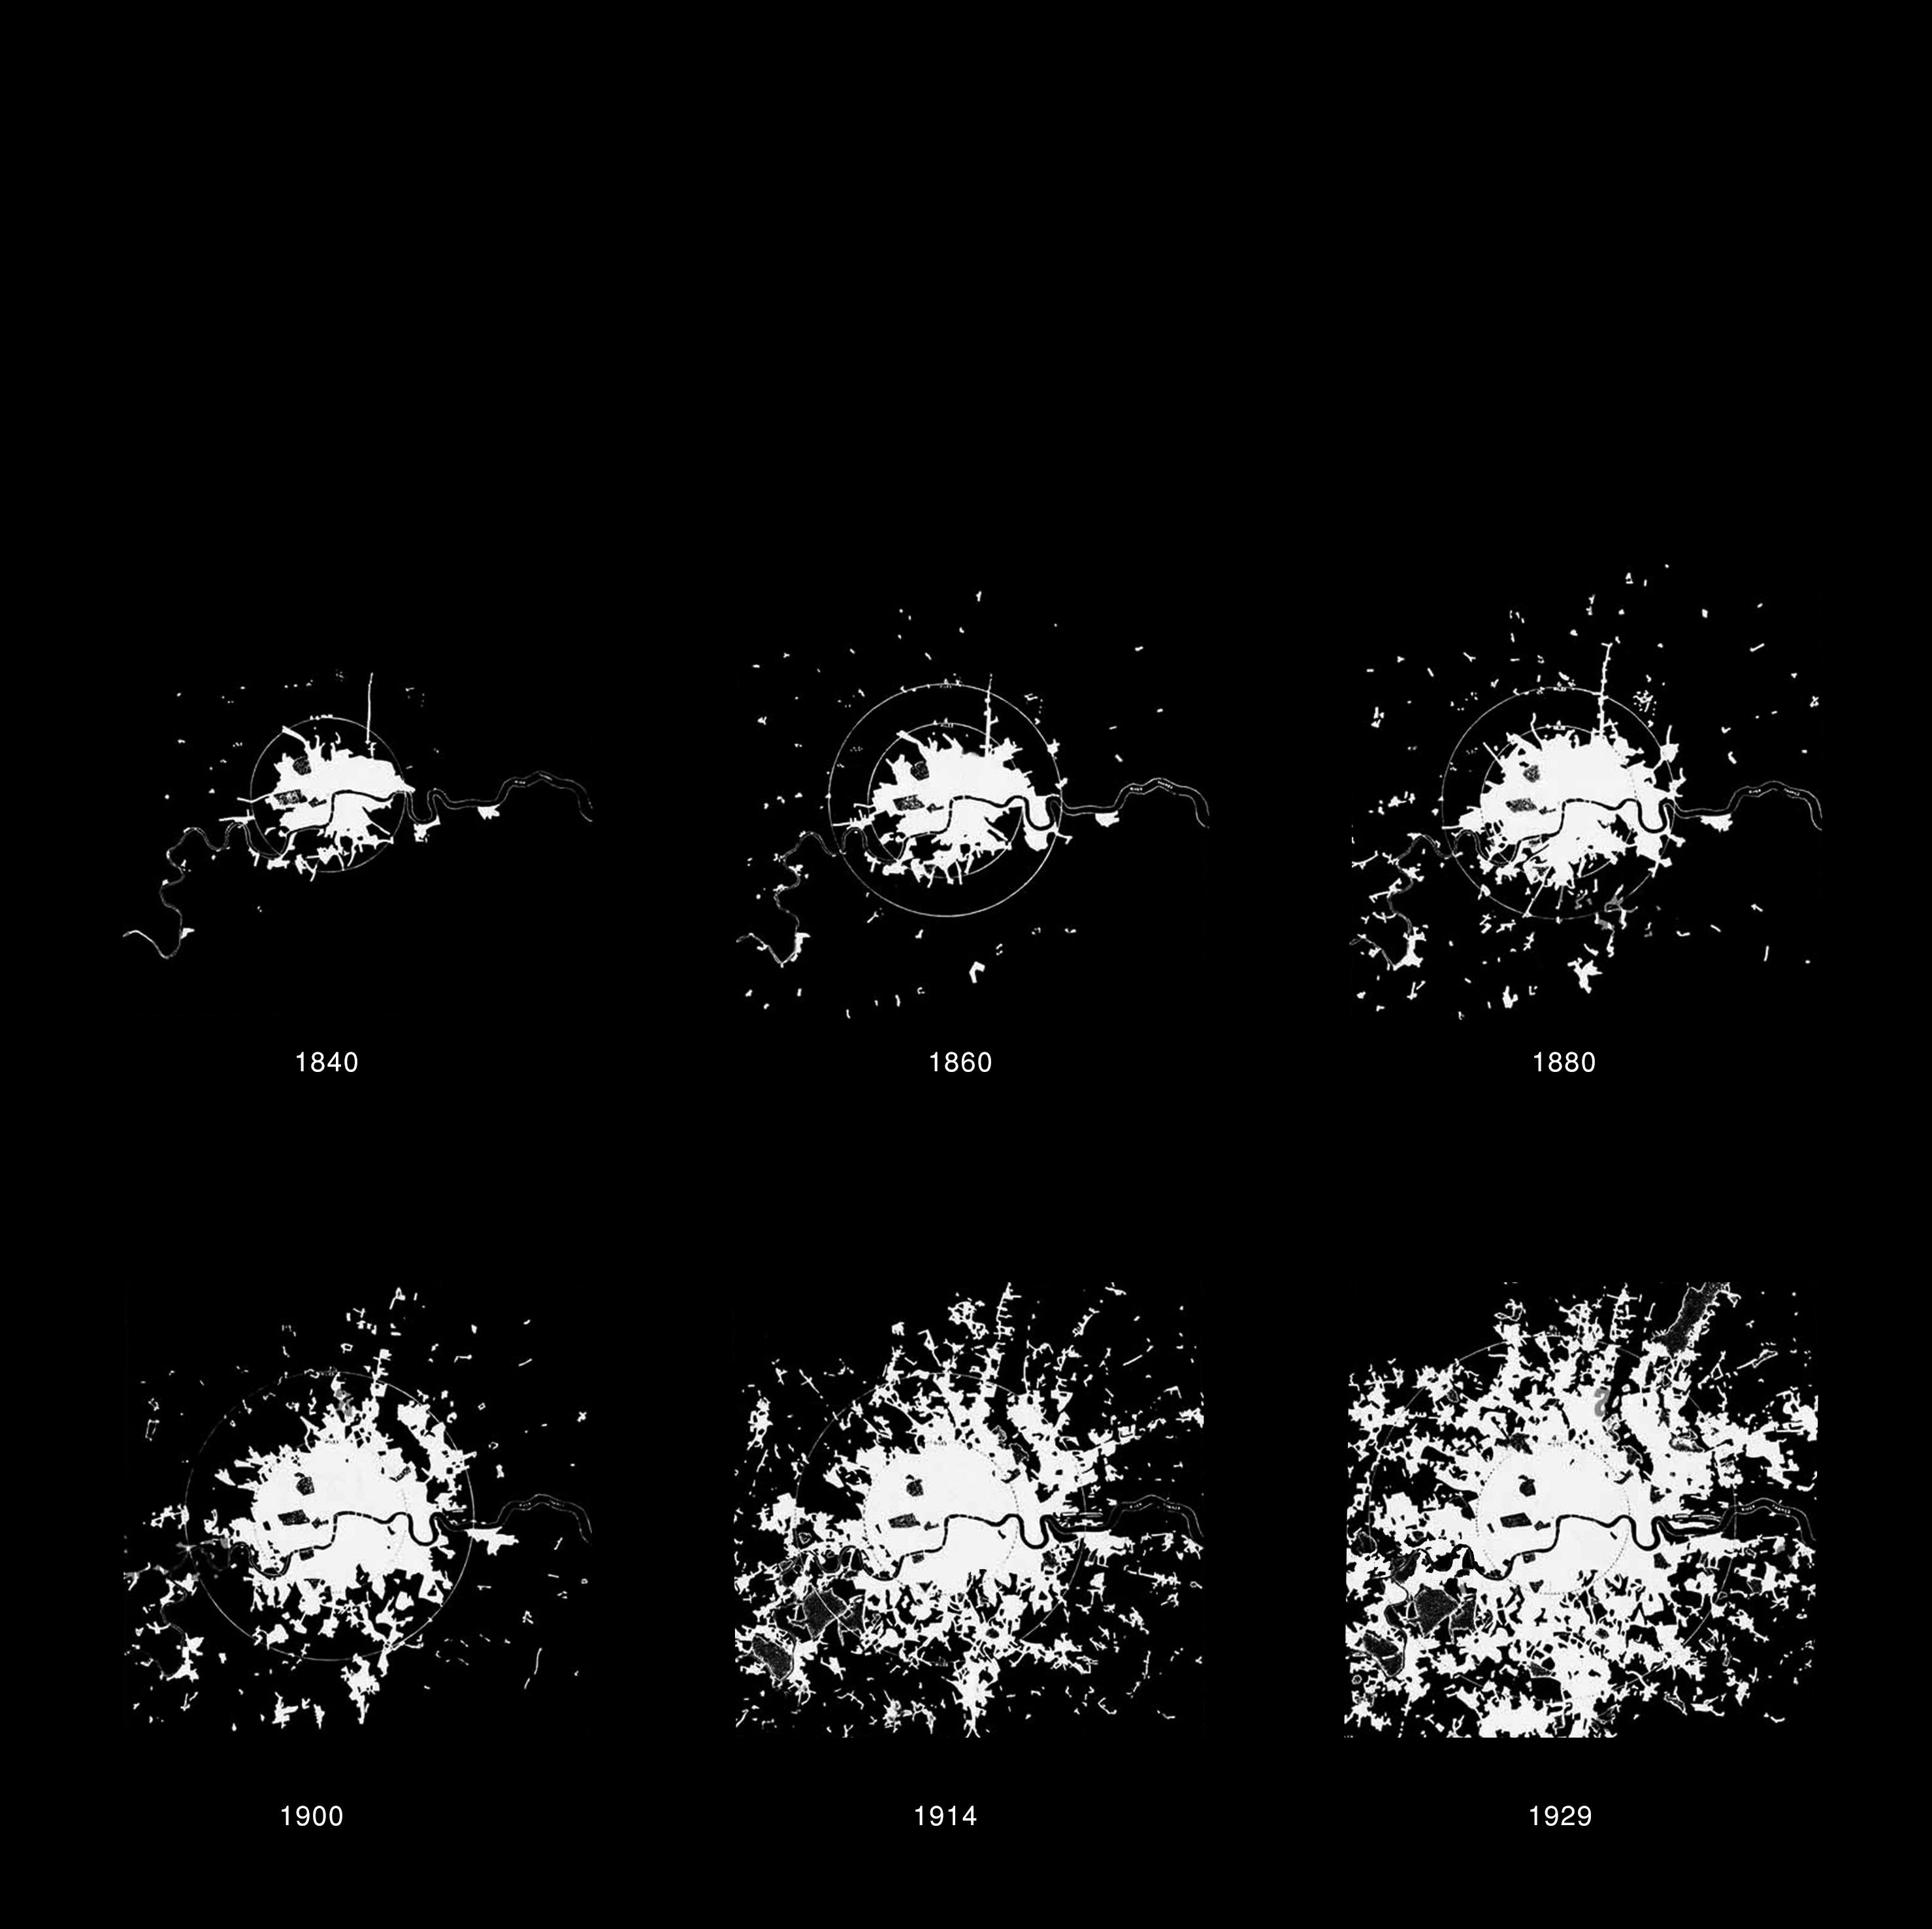
CONCEPT GENERATION | How Food Shapes the City?
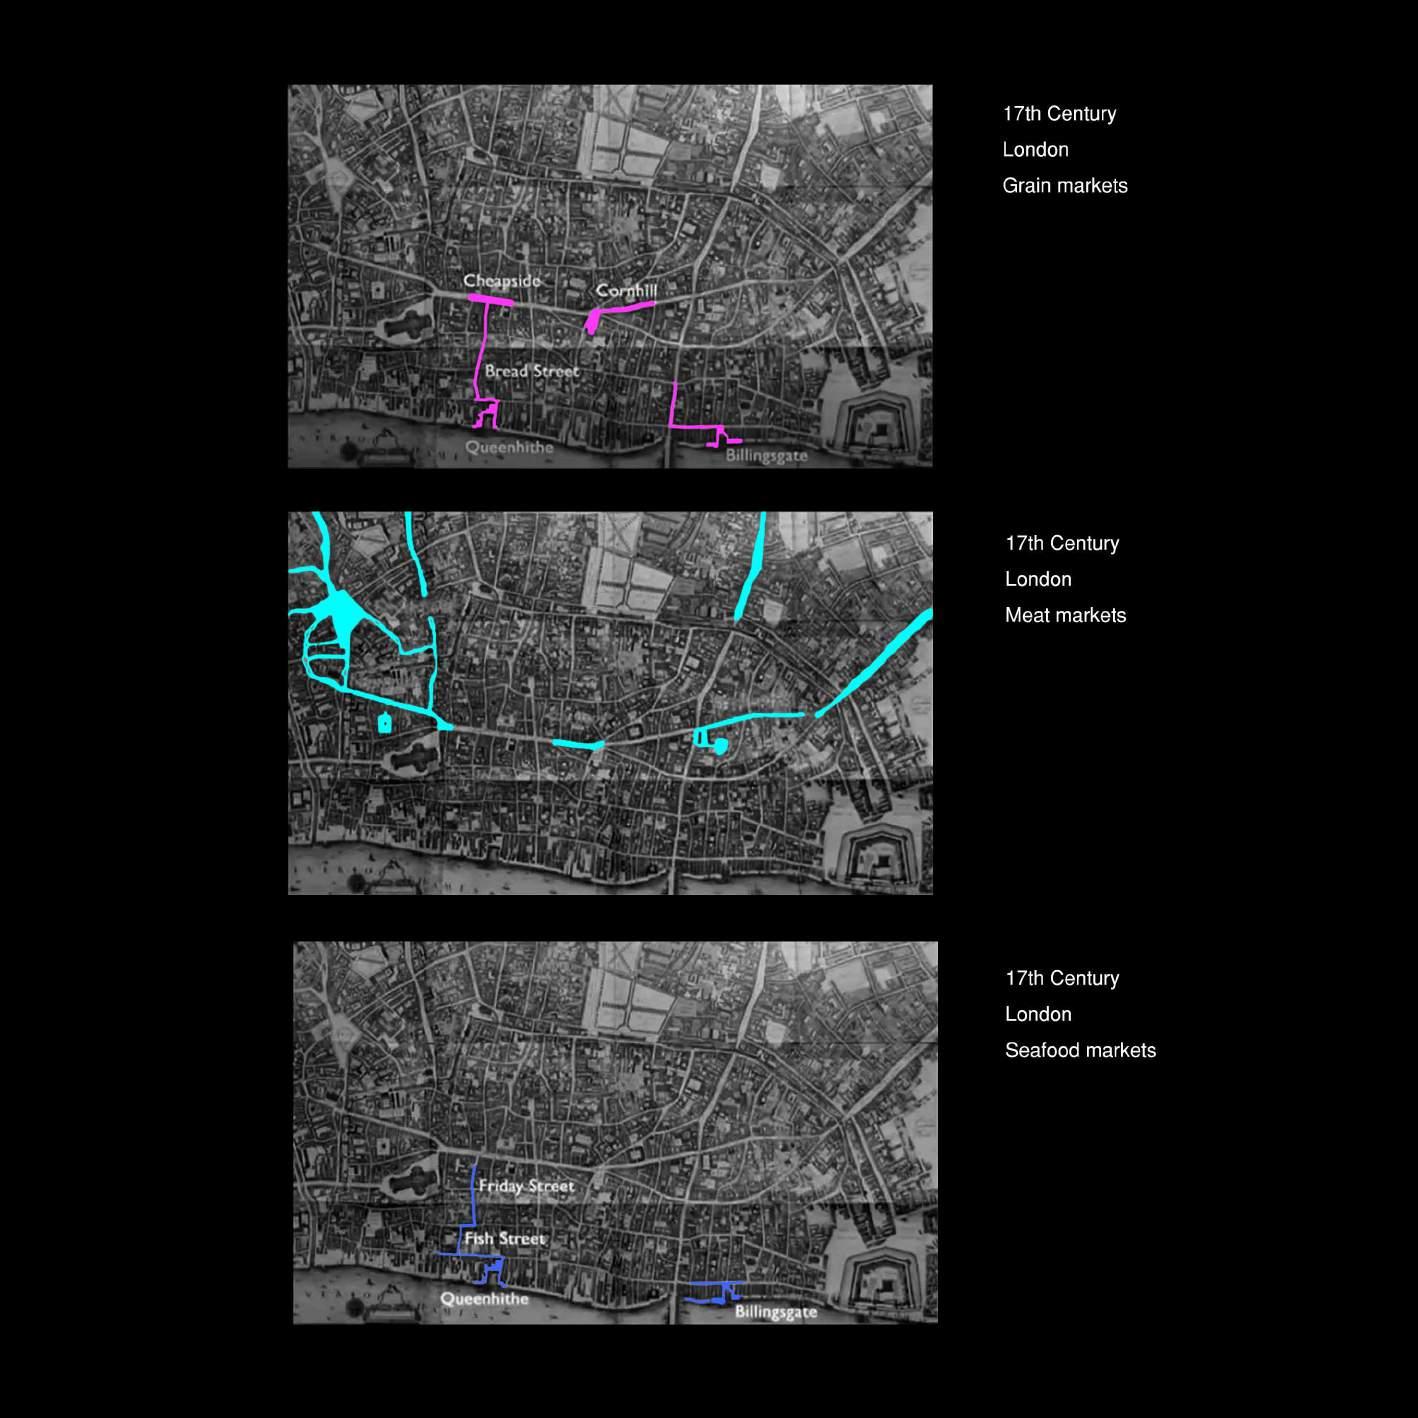
Cities have always revolved and evolved around food. Carolyn Steel in her book Sitopia mentions that people gathered to get and distribute food in the past. London streets have been named after food such as bread, fish poultry, etc. Even the book Food City talks about the rich history of the smell of spices at the Docklands area in London. According to Carolyn Steel, tasting is an act of triangulation in which we experience the flavour, in our orbitofrontal cortex which is responsible for memory and emotion and hence certain tastes can trigger a powerful nostalgia. London has such a rich history of food, it is disappointing to know that this history no longer thrives.
CONCEPT GENERATION | Neighbourhood as Supermarket
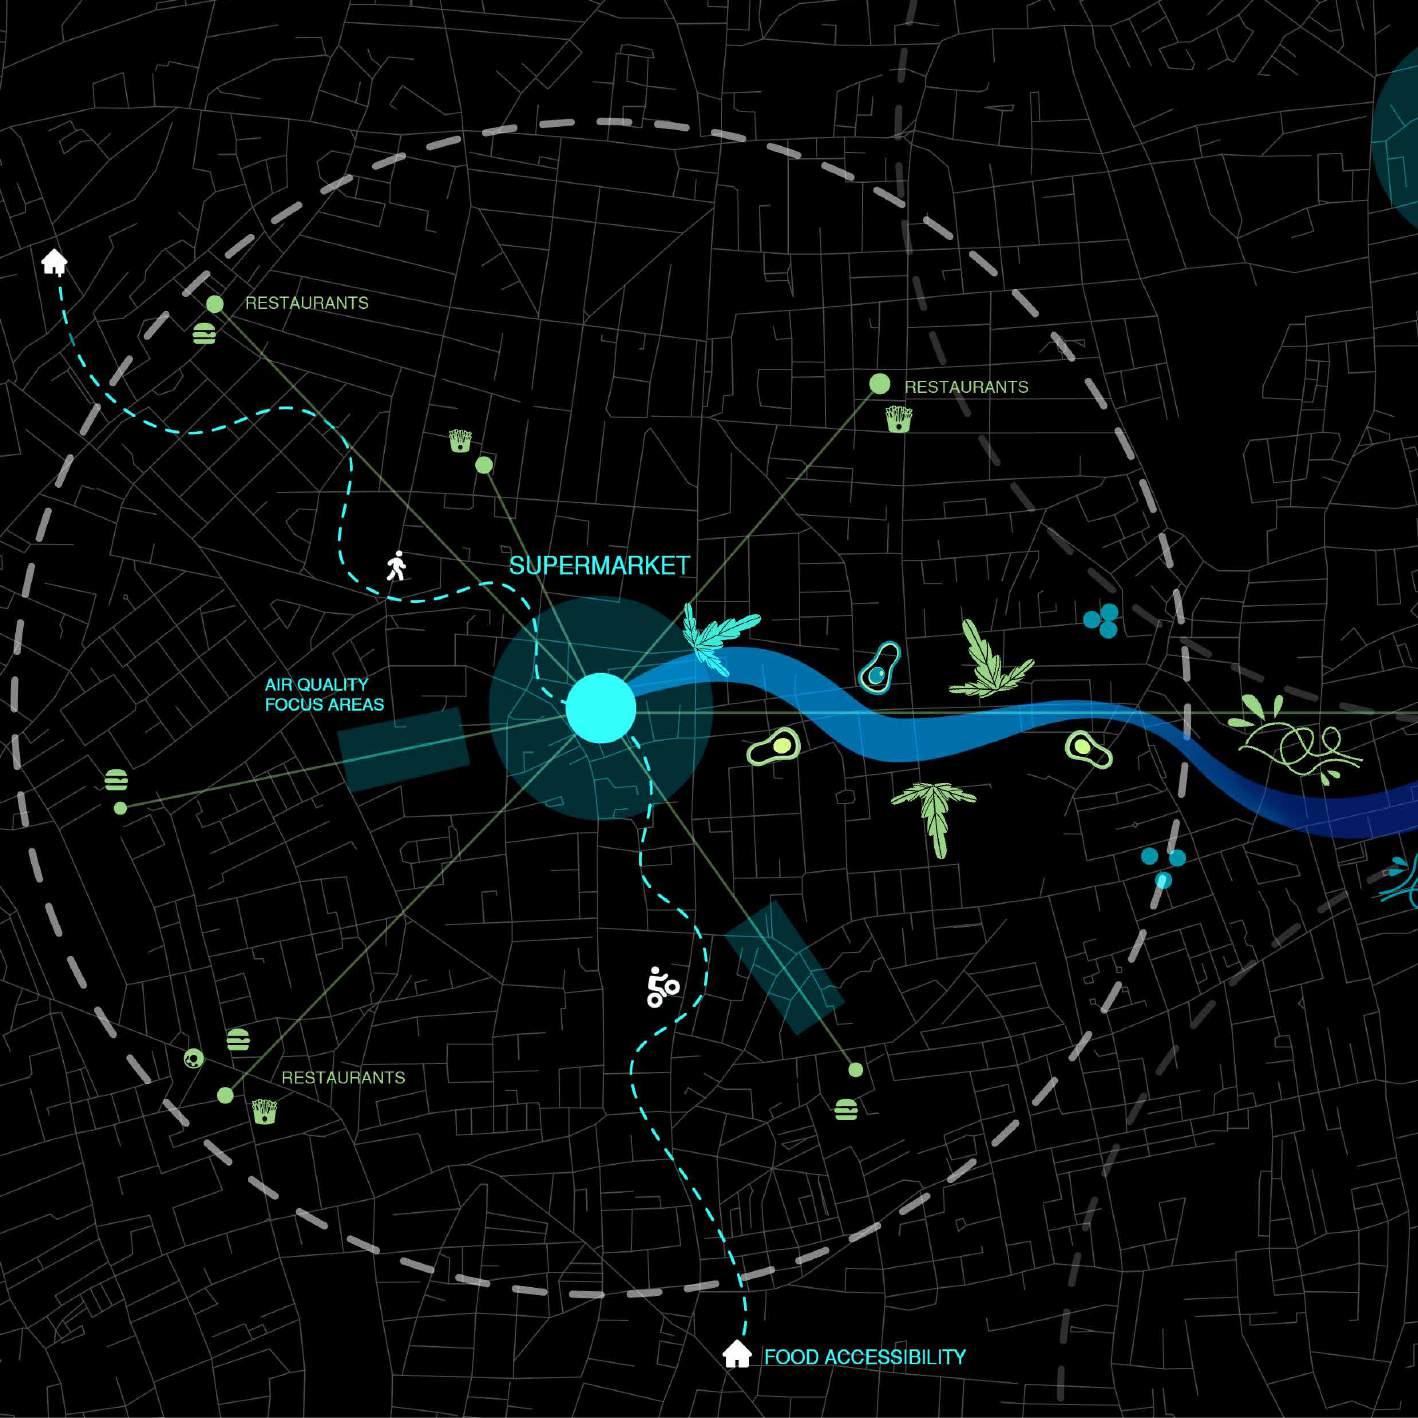
A lot of people in the UK live in food desert neighbourhoods. The scarcity of supermarkets and more fast-food restaurants in neighbourhoods is helping fuel problems like obesity and diabetes.
Keeping in mind the need for supermarkets and fresh food in most neighbourhoods along with food nostalgia we aim to design food-centric communities that transition to a dominant supermarket culture in London which would grow it's own food and infuse well with the restaurant or take-away culture to create a healthy and balanced lifestyle.
We intend to find overlap with polluted areas to grow food and allow participatory design for production, consumption and recycling of food. Creating a food-matrix which we call Agro-Matrix.
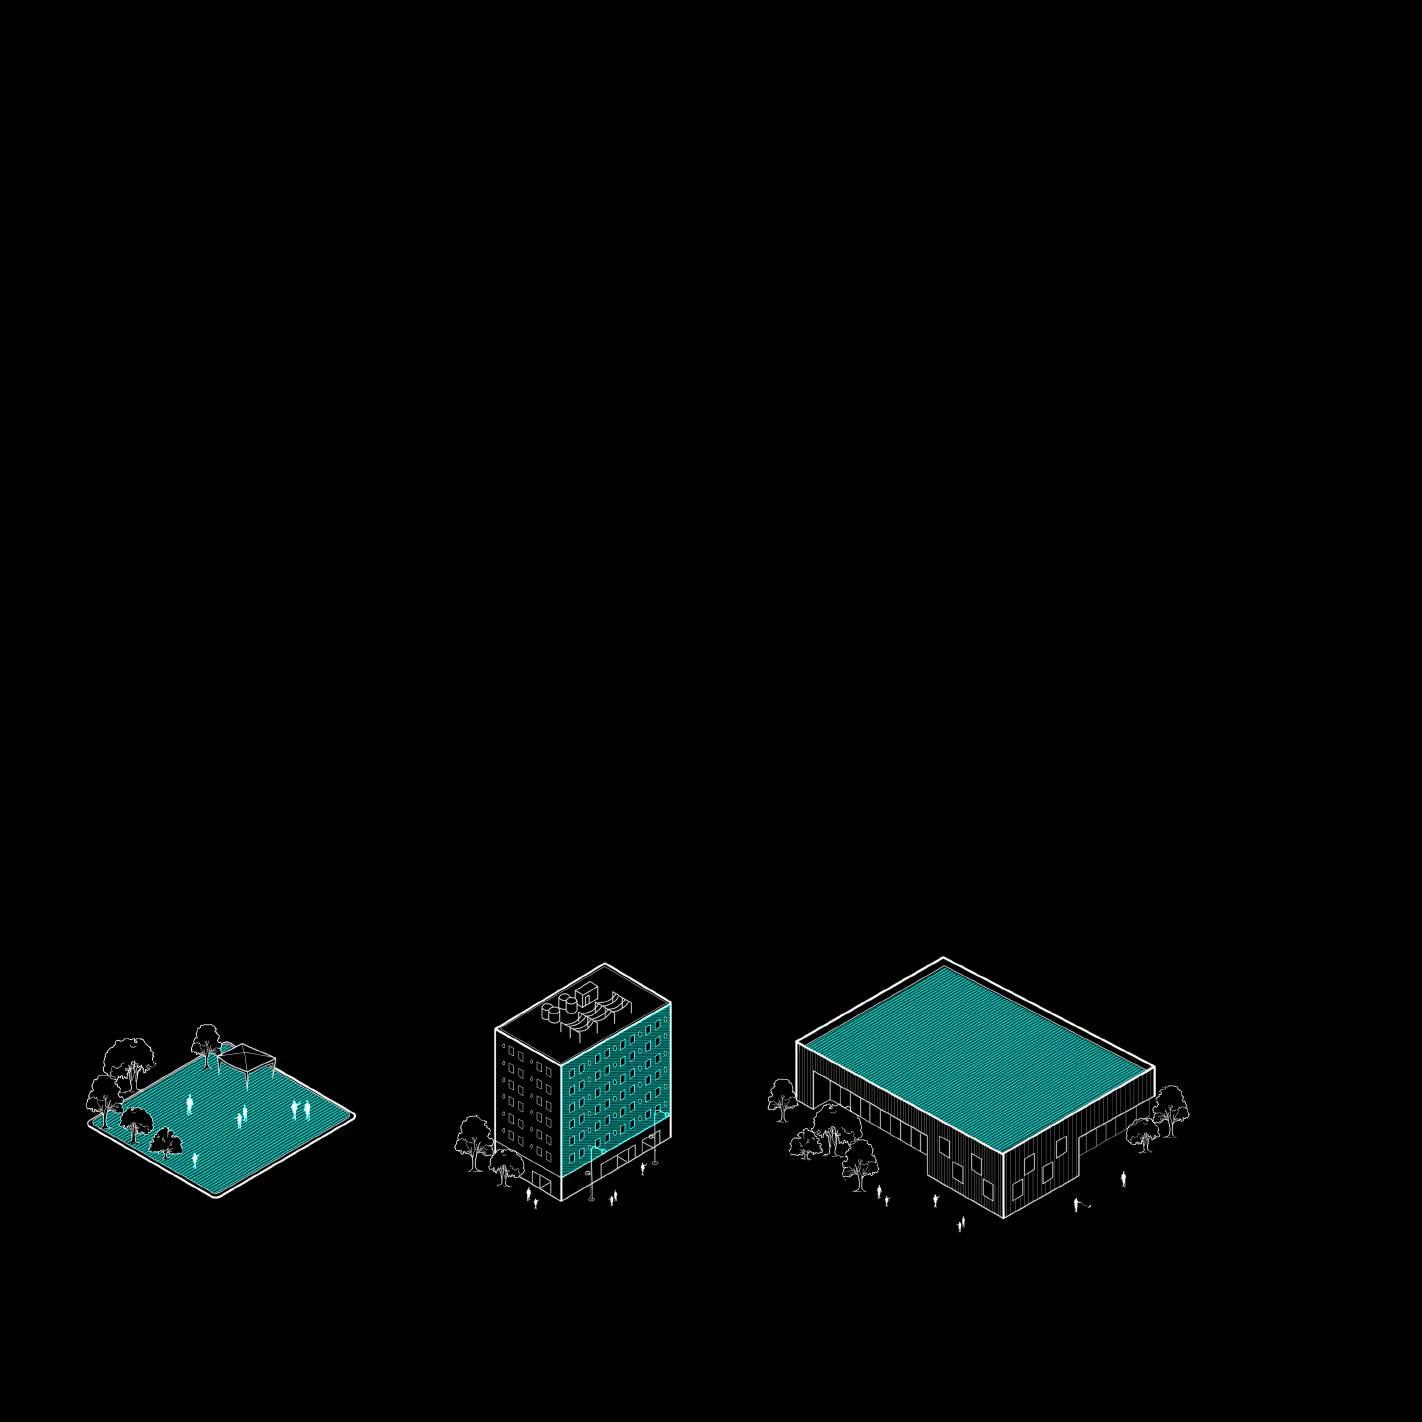
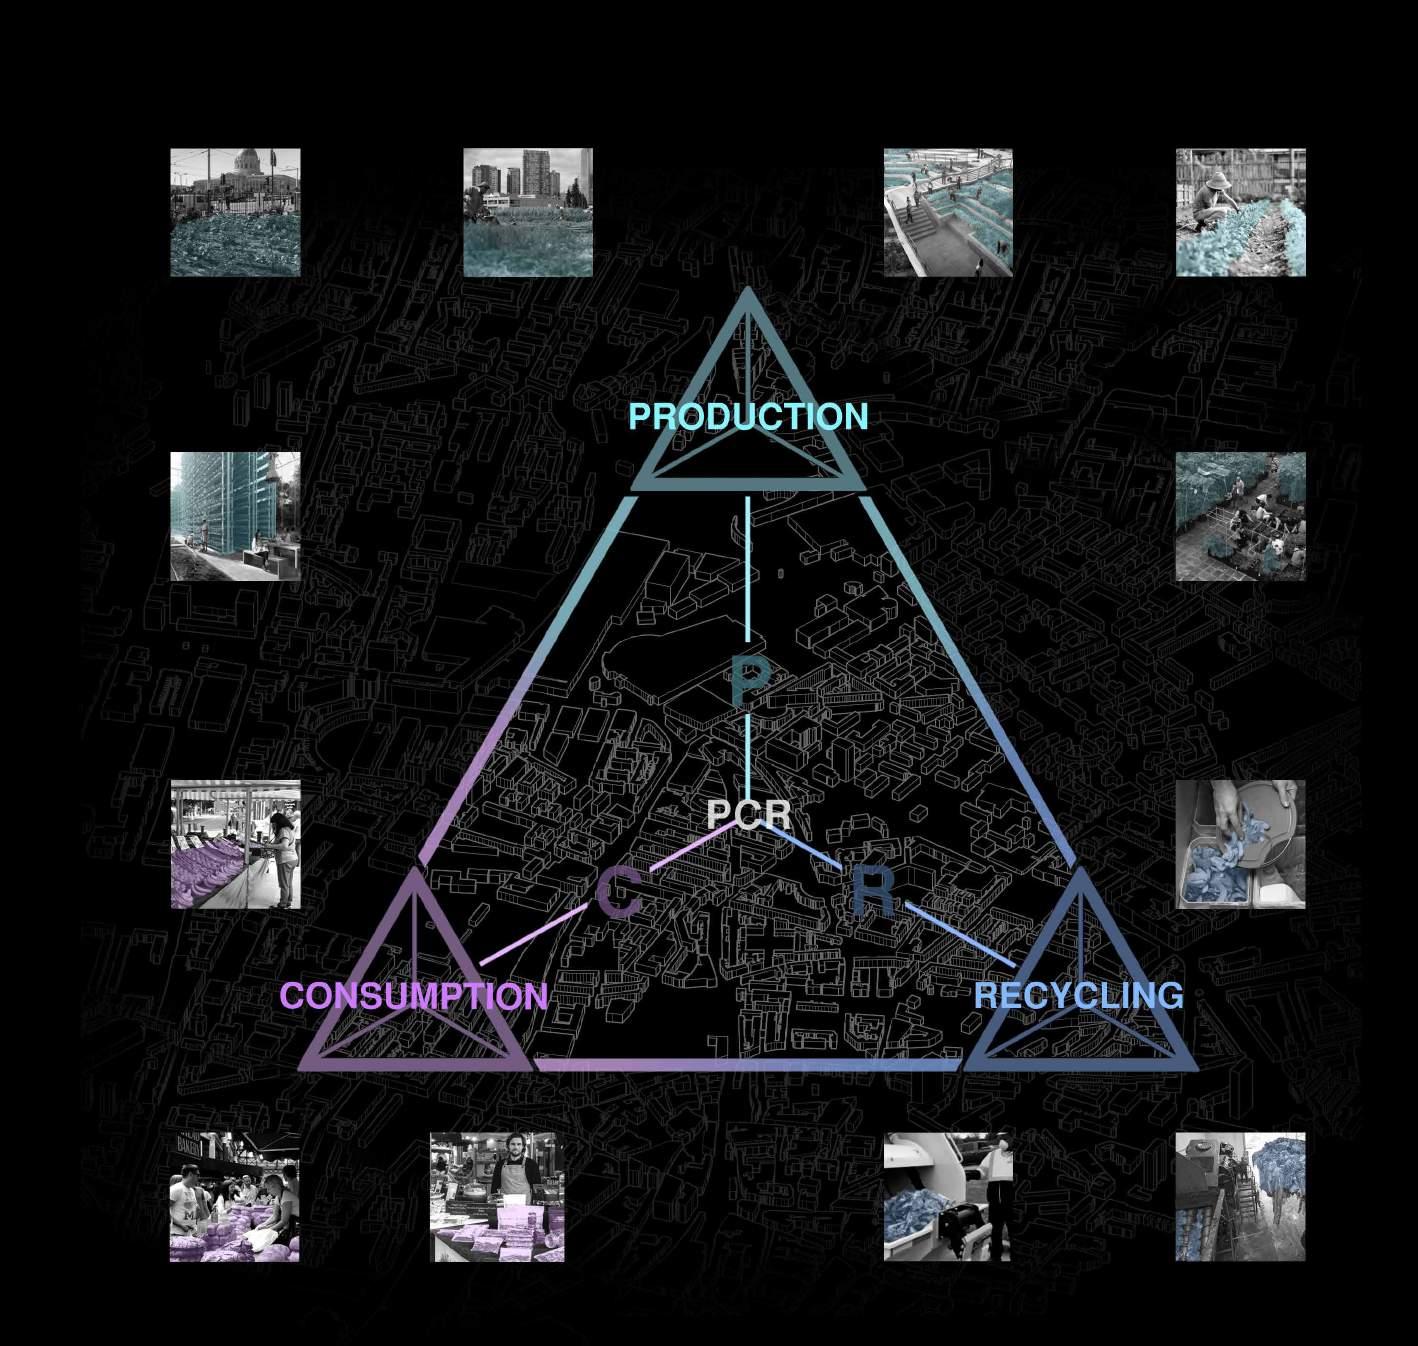
In the Agro-Matrix we aim to connect different urban nodes to apply these different design strategies. We intend to use interconnected Urban agriculture techniques which include Rooftop farming, Vertical farming, street farming and underground farming to grow food at the city level. We would like to propose urban interventions that act as catalysts to pull users of all communities towards supermarkets to promote healthy eating and living.
CONCEPT GENERATION | Production, Consumption, Recycling System
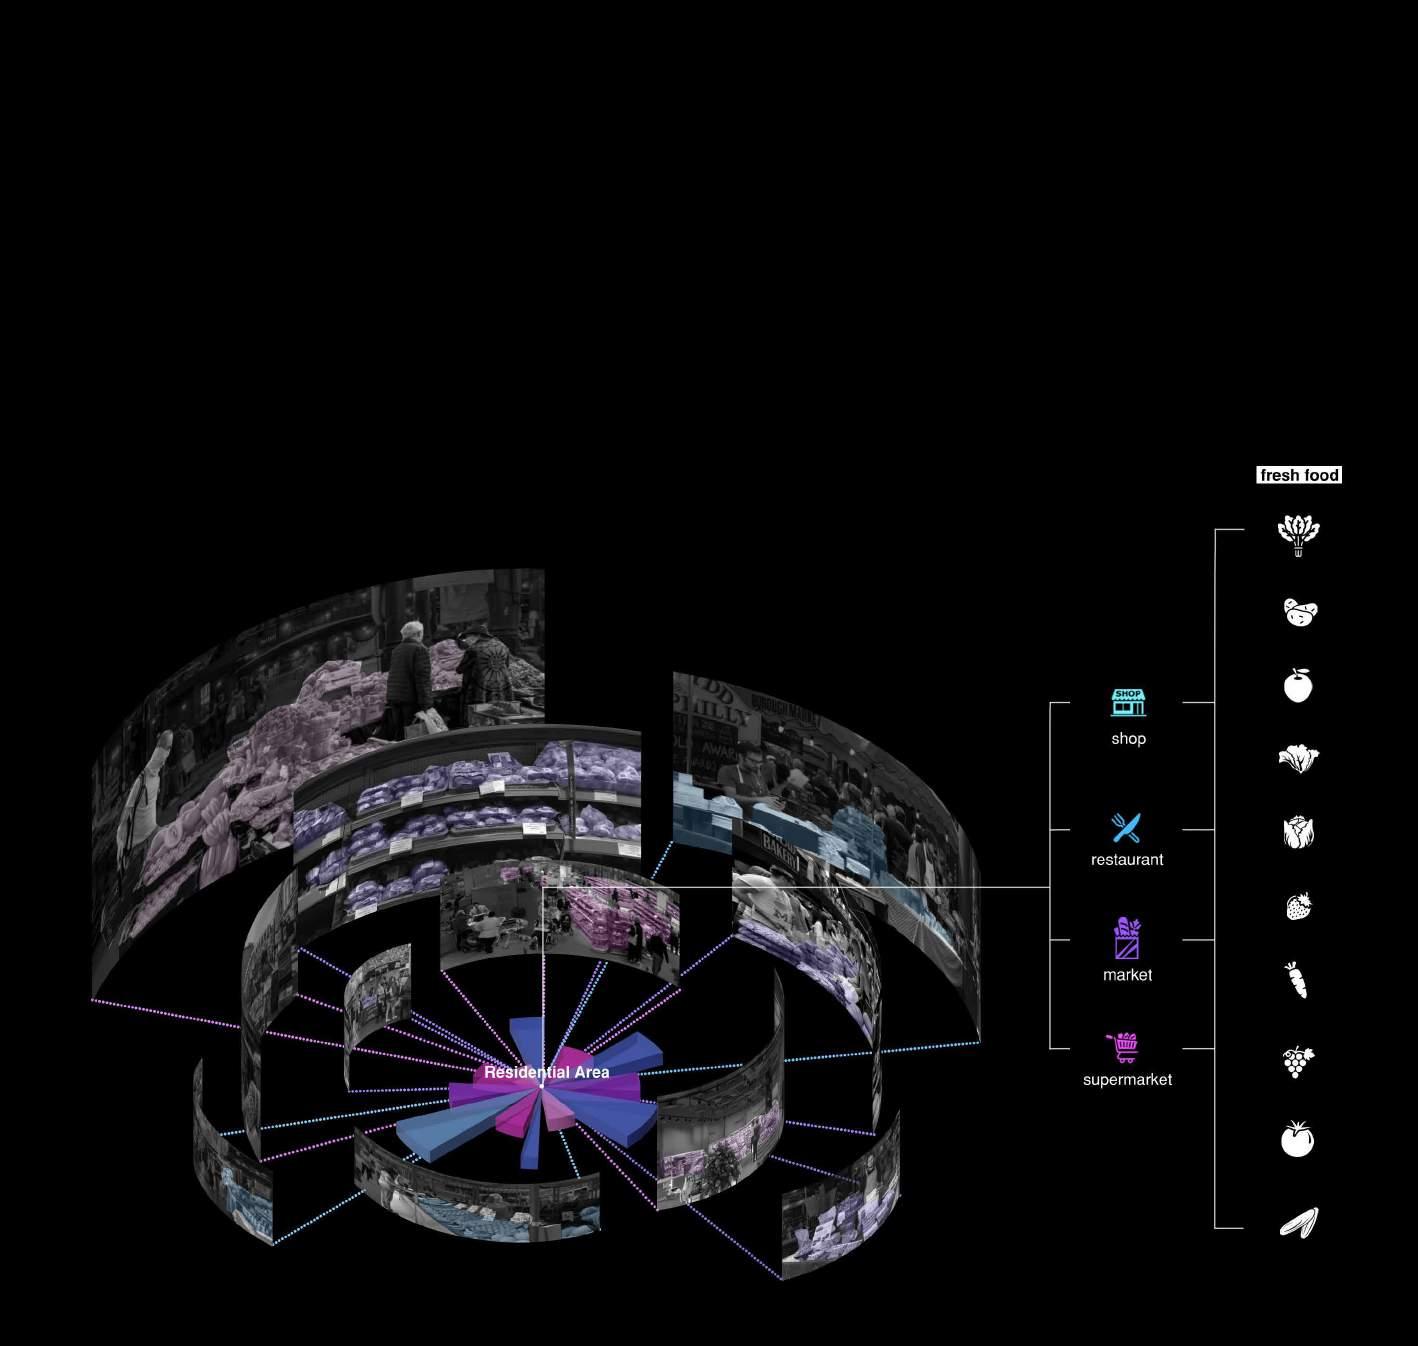
In the Agro-Matrix we aim to connect different urban nodes to apply these different design strategies. We intend to use interconnected Urban agriculture techniques which include Rooftop farming, Vertical farming, street farming and underground farming to grow food at the city level. We would like to propose urban interventions that act as catalysts to pull users of all communities towards supermarkets to promote healthy eating and living.

DATA ANALYTIC AND MACHINE LEARNING SITE SELECTION [PART TWO]
This part shows our research in data including principal component analysis, suitability analysis and represents the method of how we zoom in from macro to micro scale.



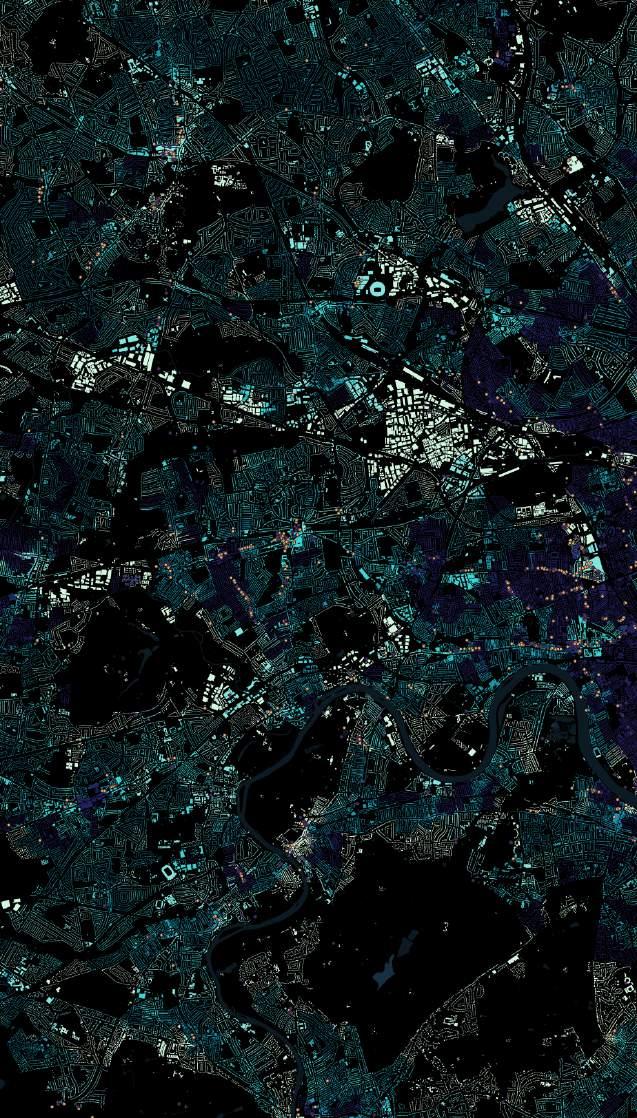



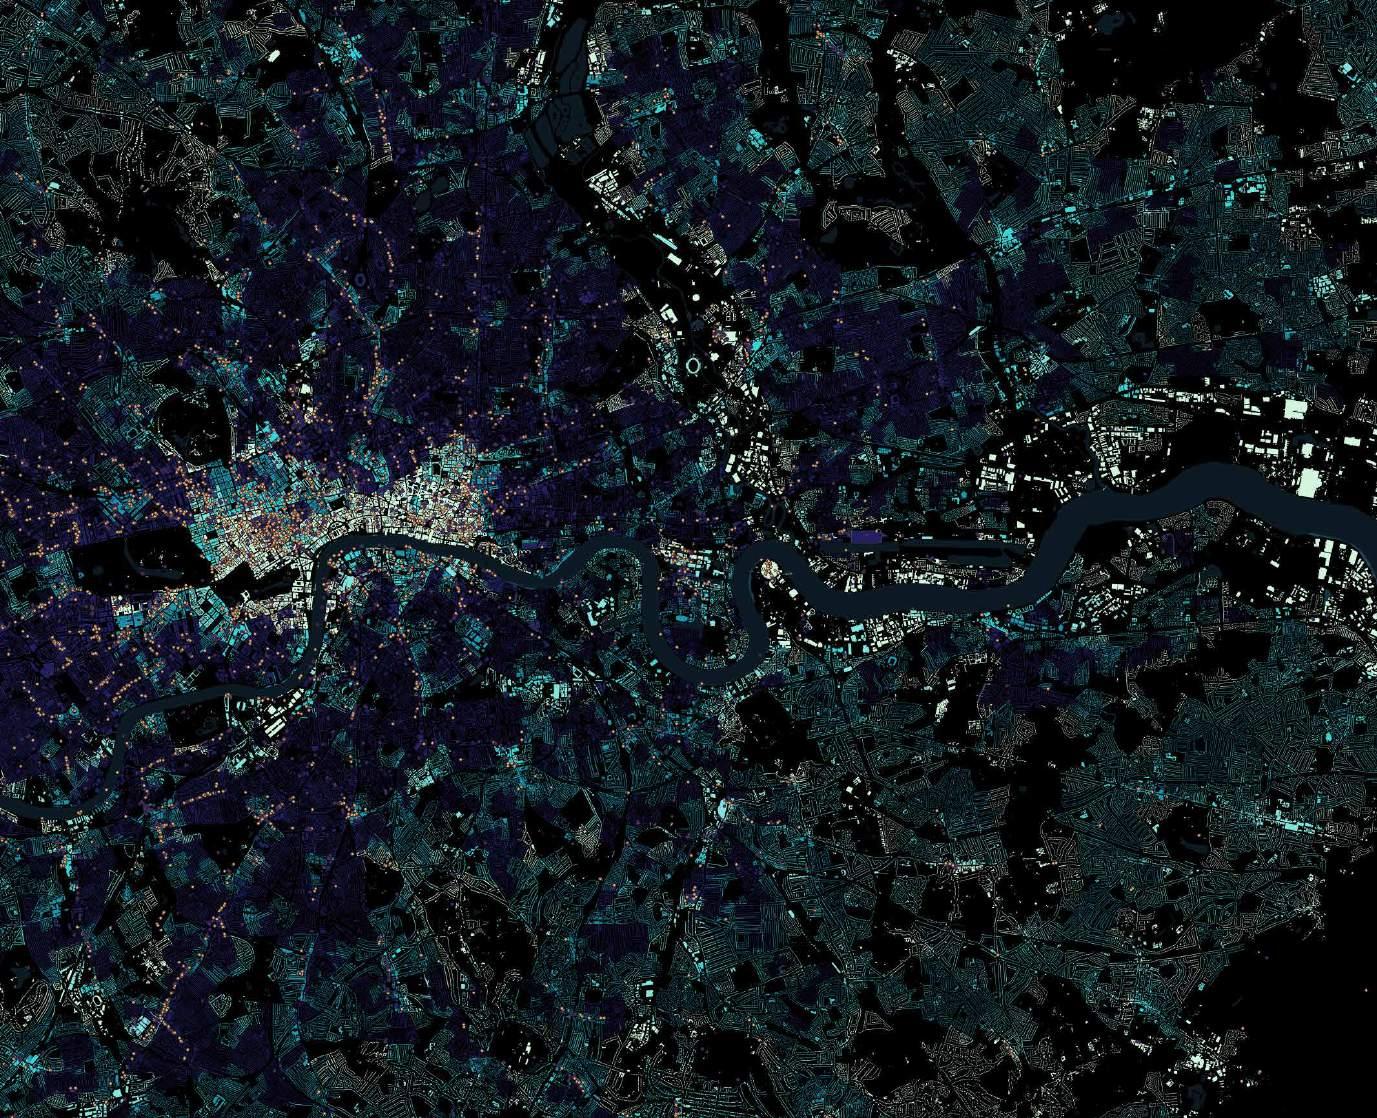


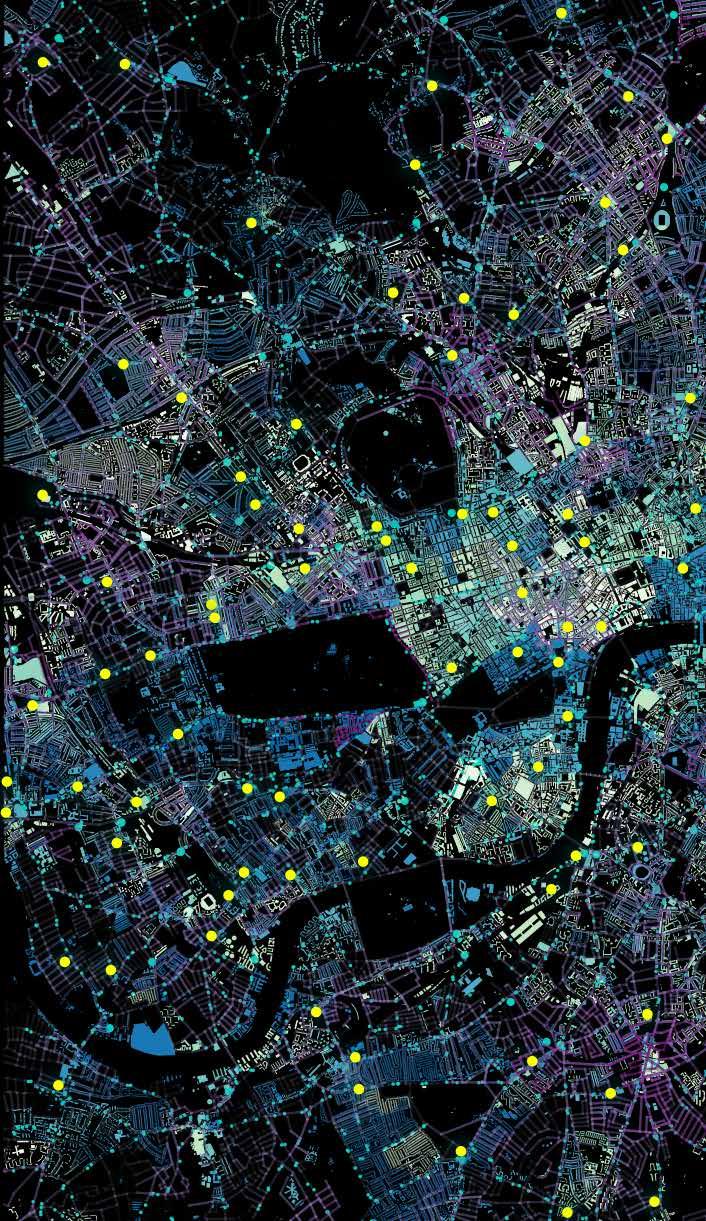
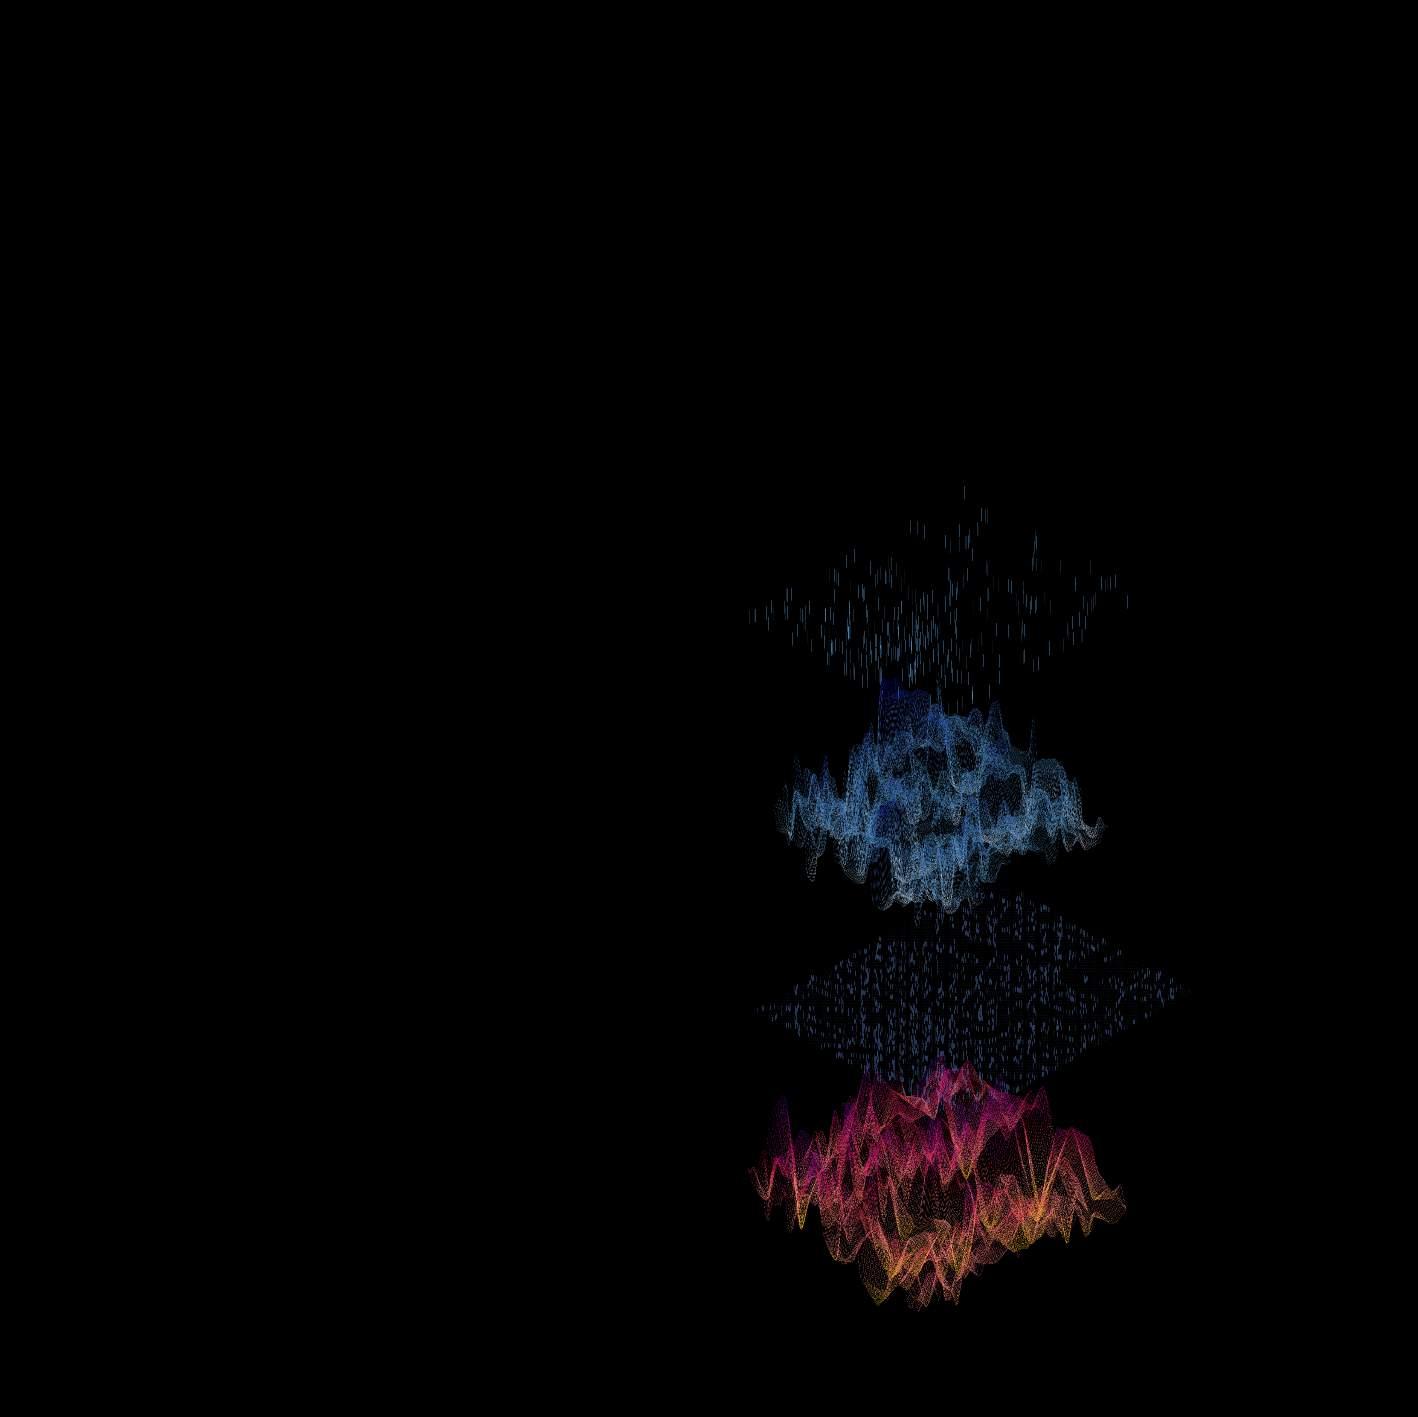
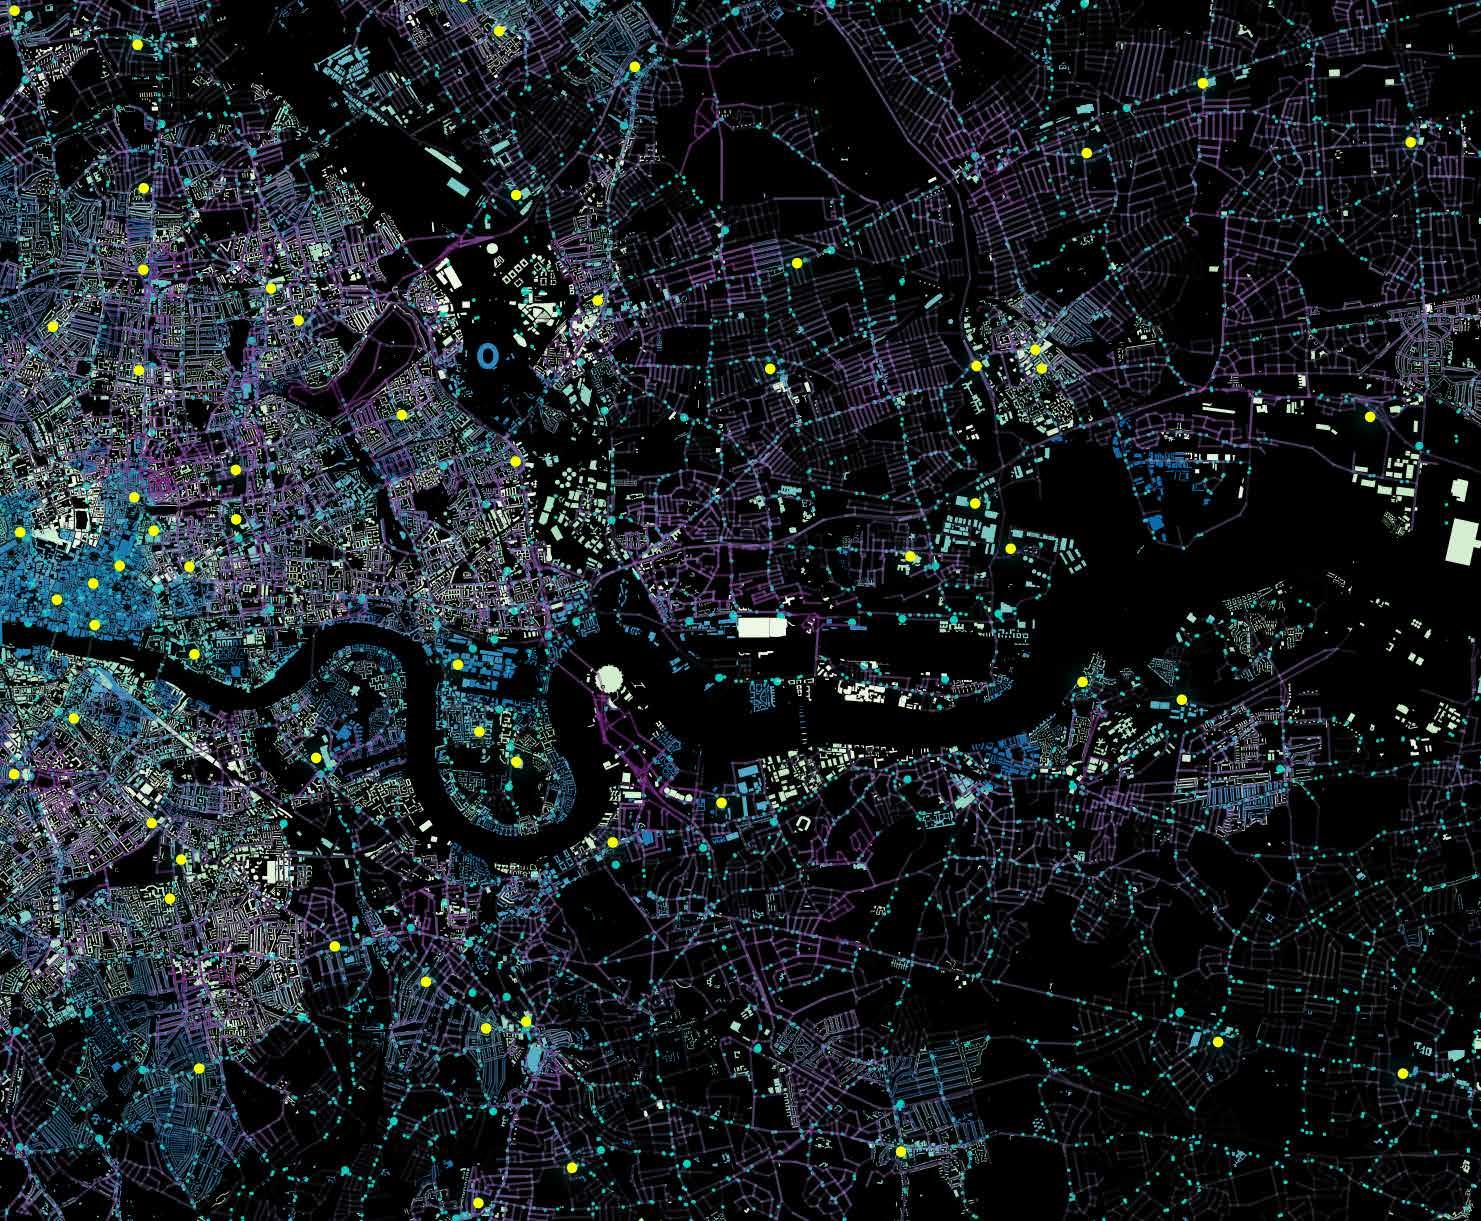
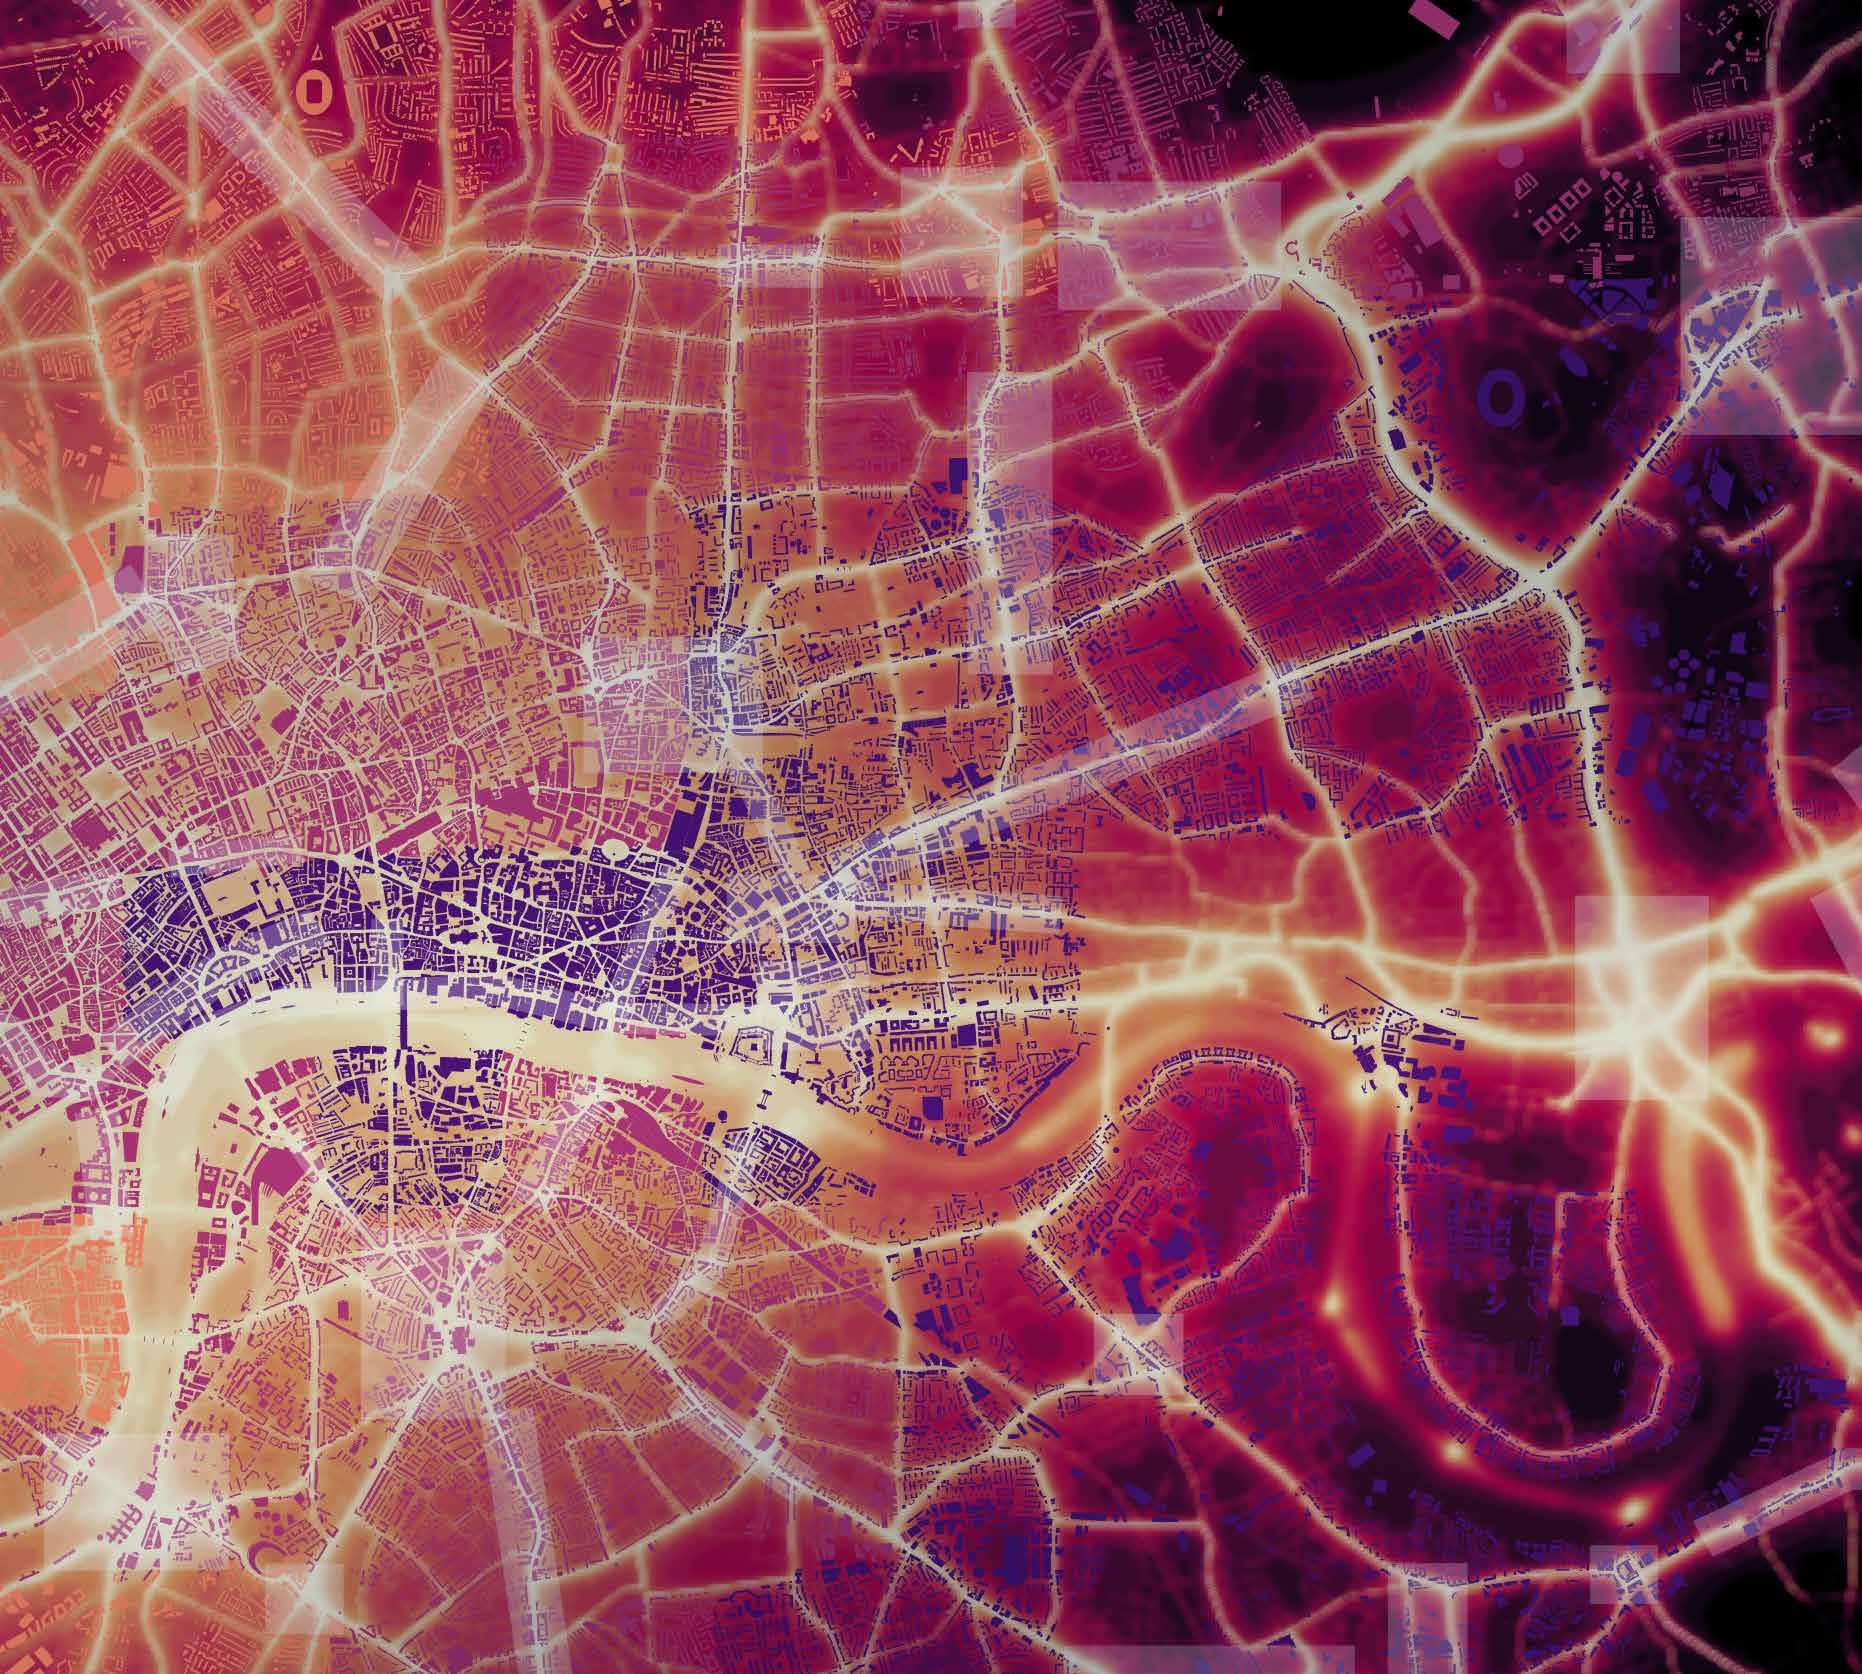
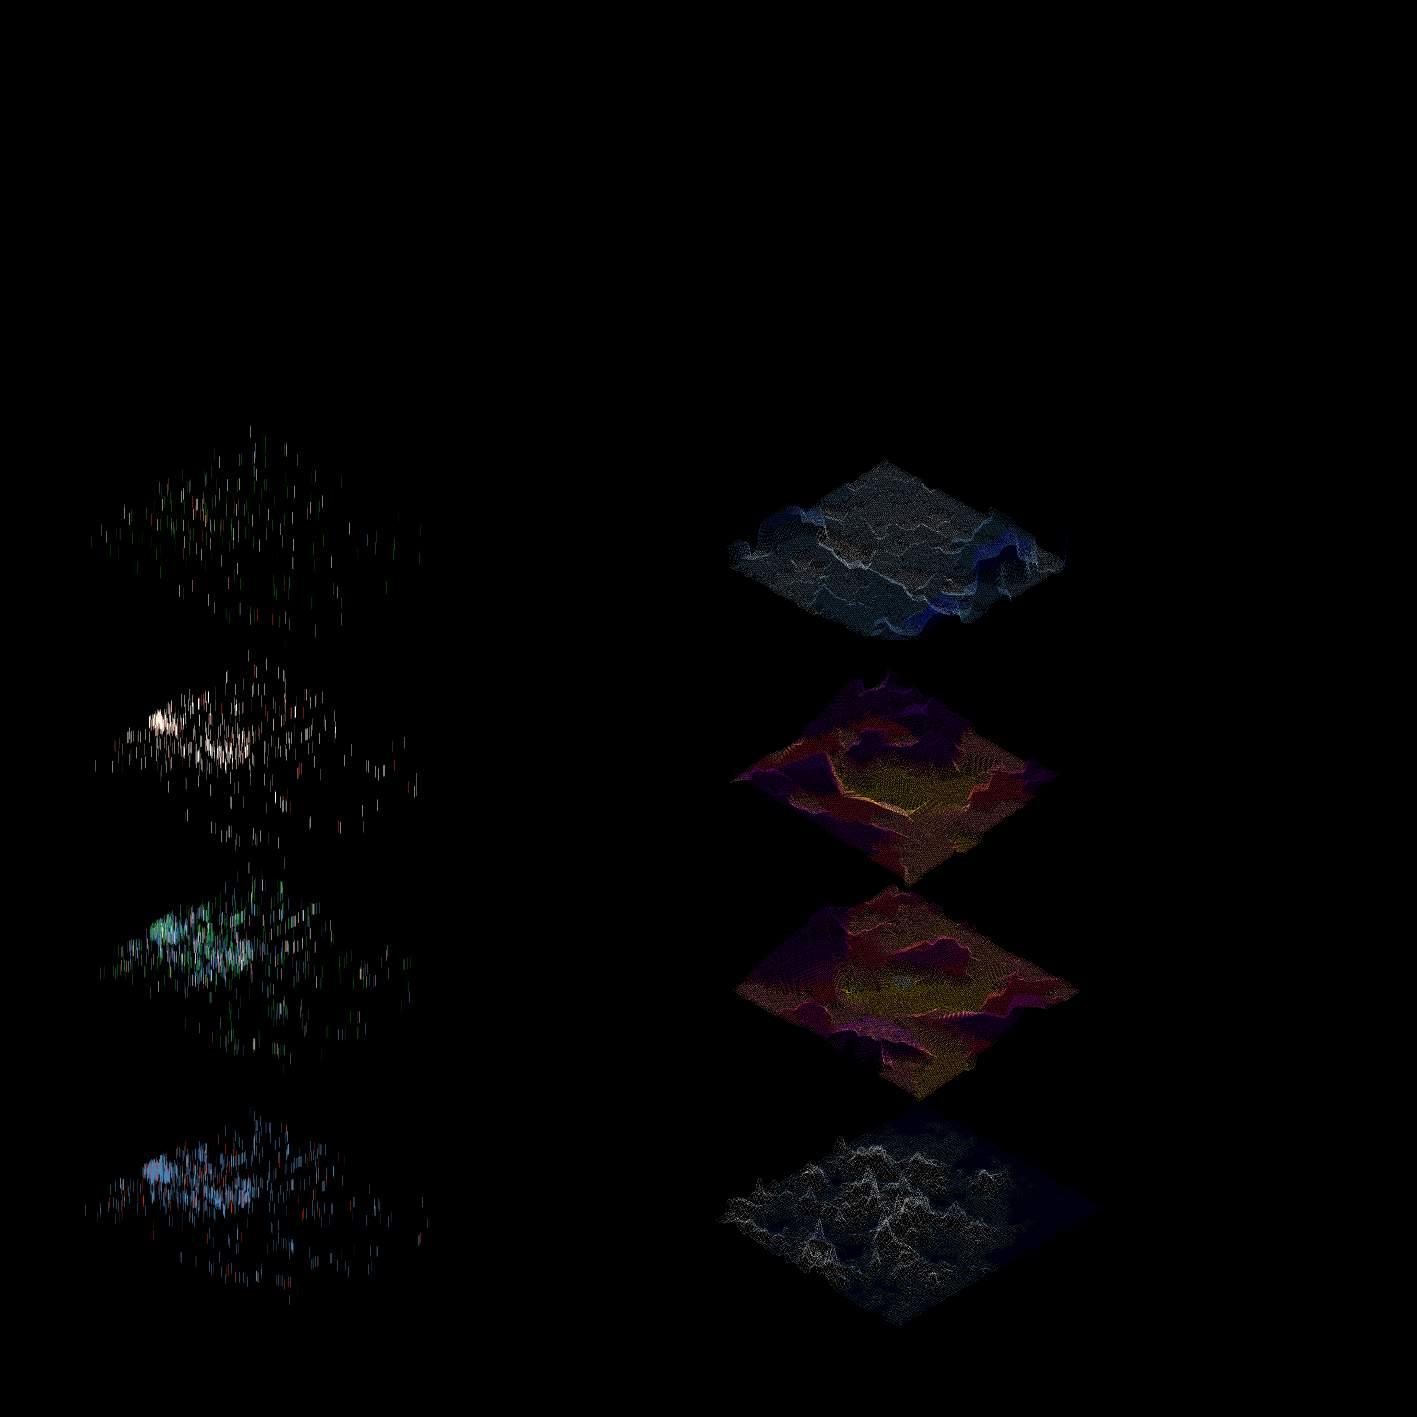
We tried to zoom in the Micro area where we wanted to understand the relationship of food between suburbs and city dwellers. We studied data such as Red meat consumption, Ready made Consumption, Housing Density, Household Income, Food desert, NOX emissions, Urban Heat Islands, Integration R1000, Tesco Transactions, Transport stations. The map on the right represents NOx emissions overlapped with air quality focus areas. The buildings are spatially joined with urban heat islands data. The map suggests that the centre of London is highly polluted and has a maximum heat island.





SITE SELECTION | Agent-based Mobility Simulation
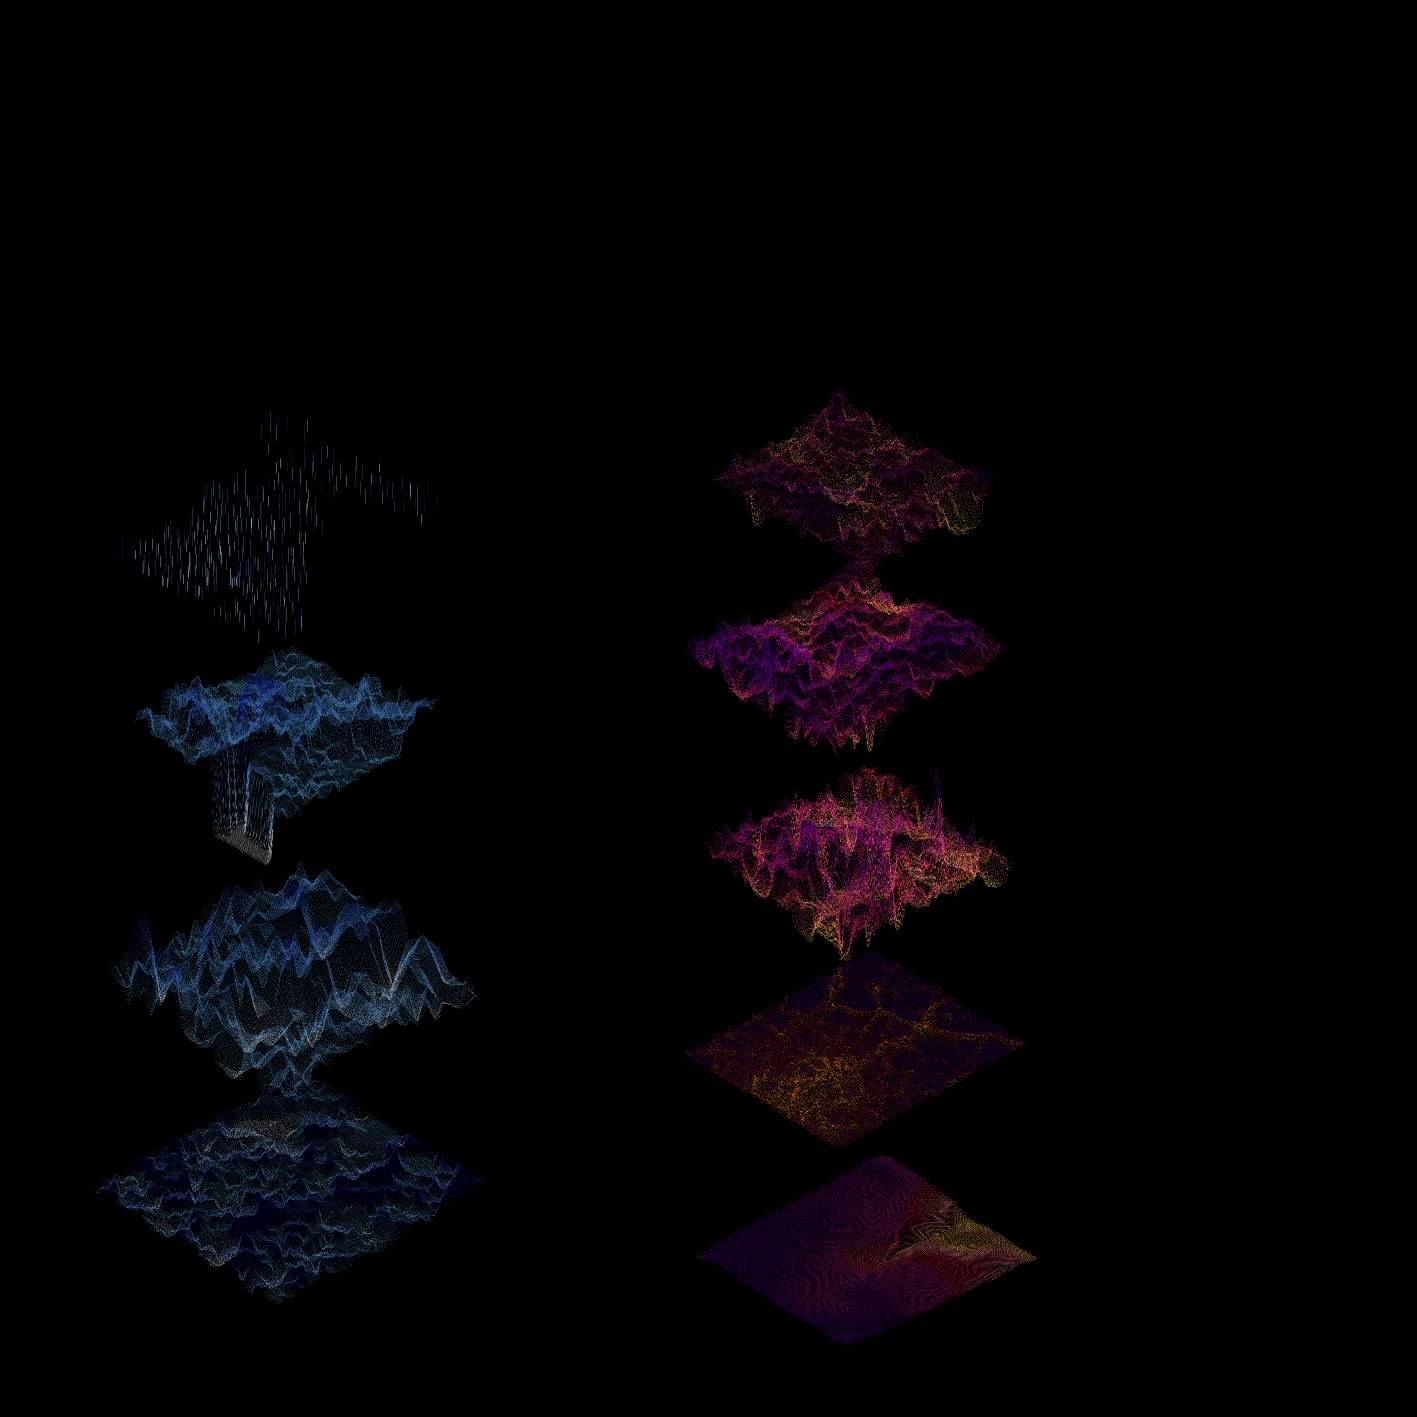
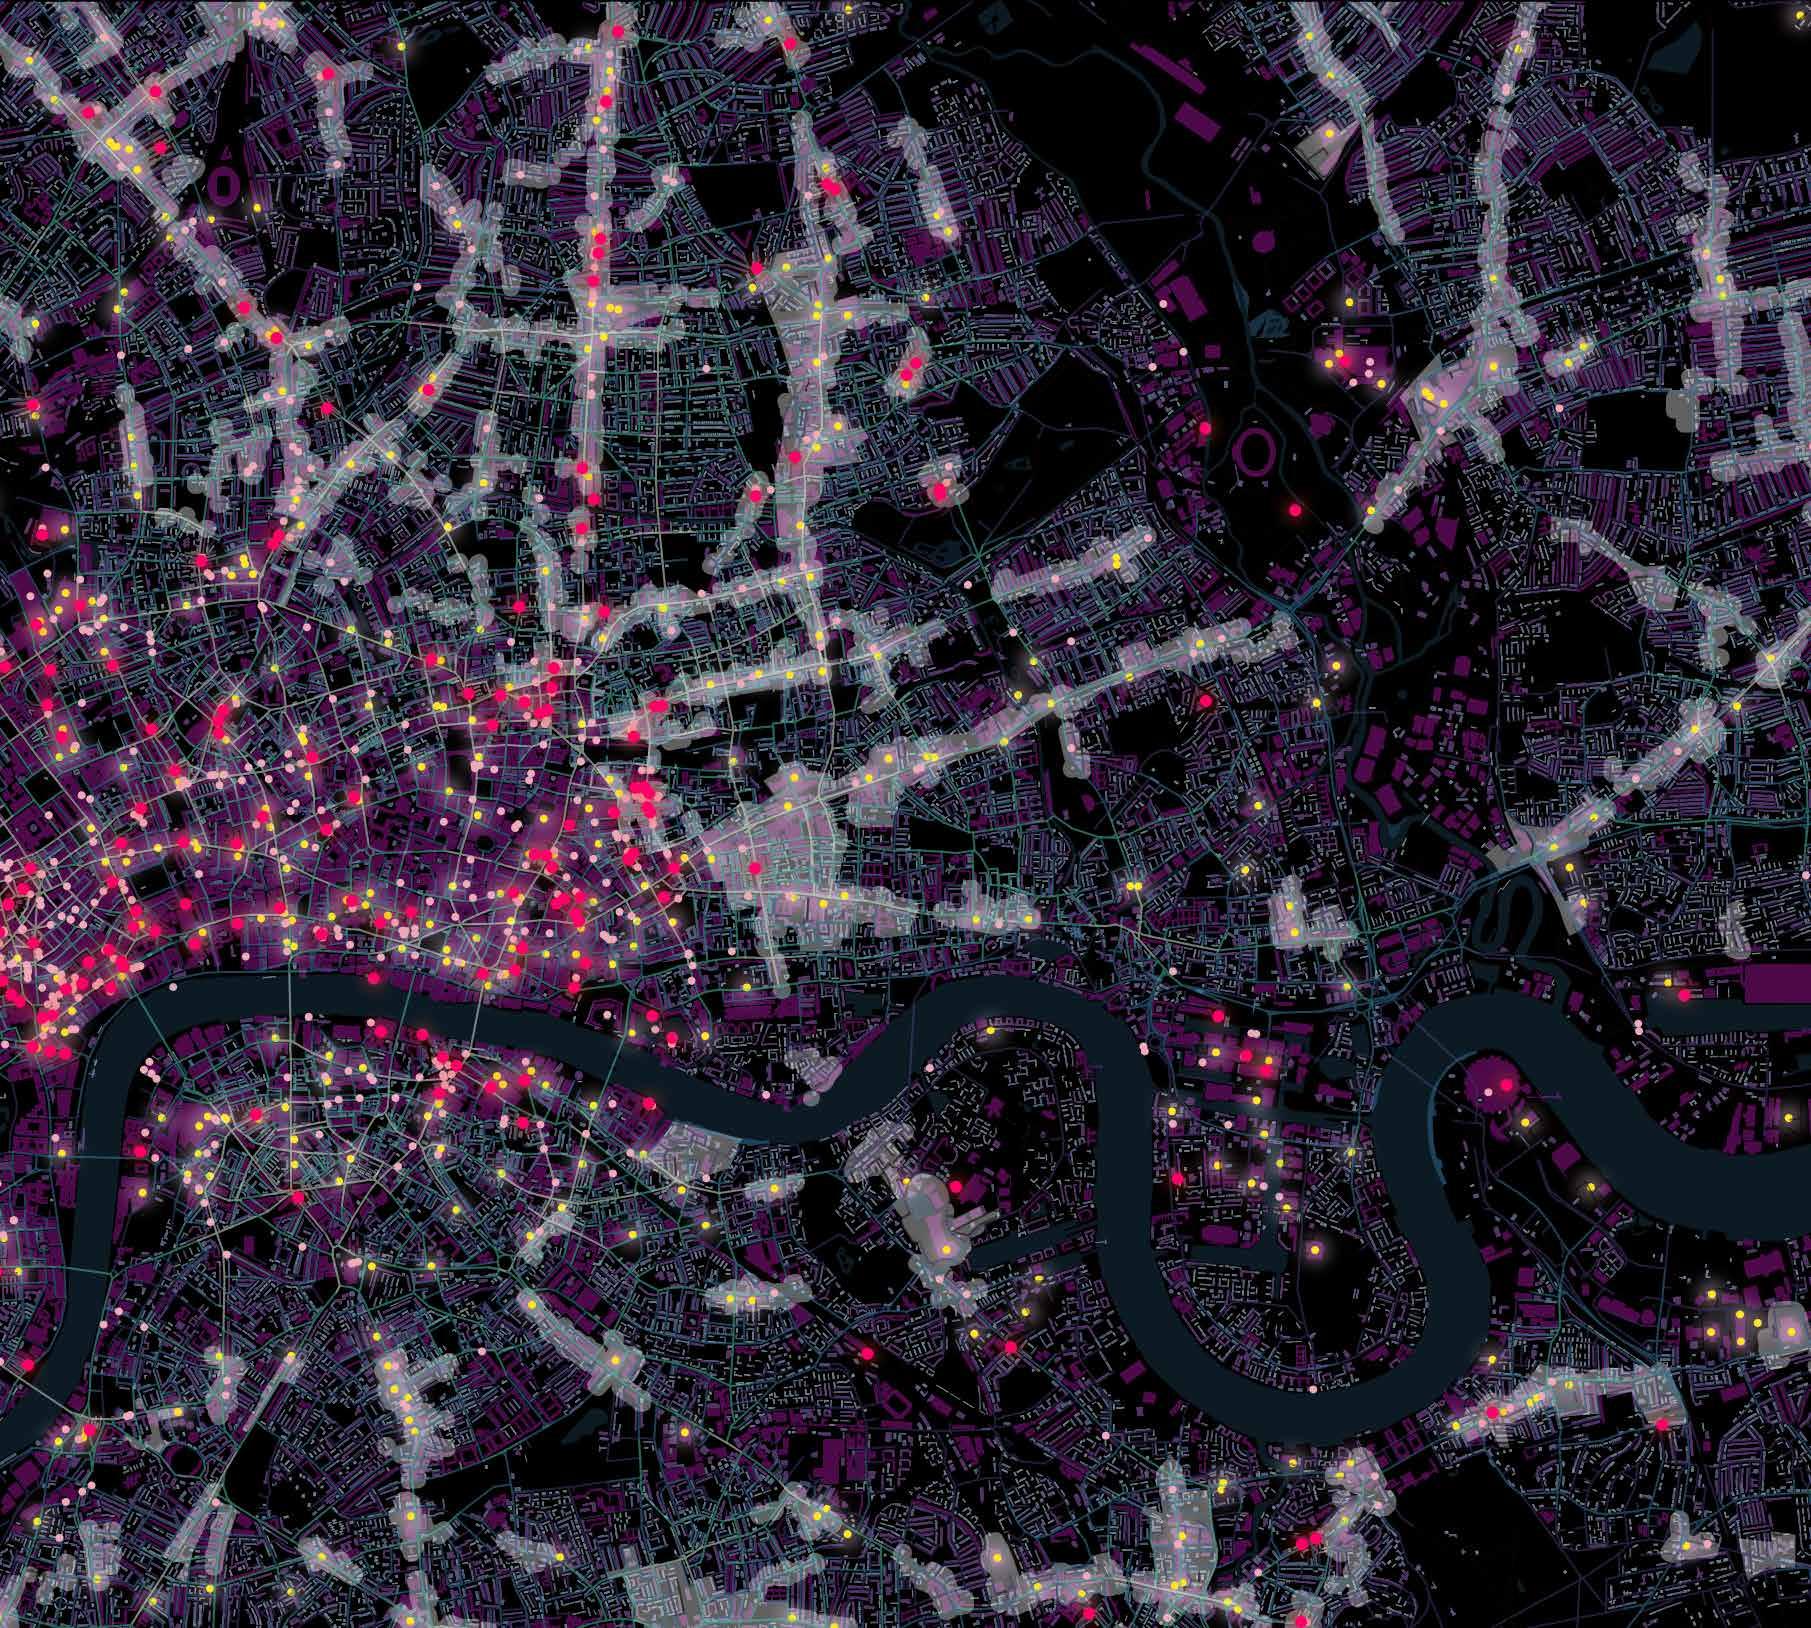
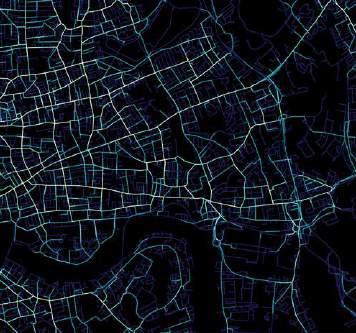
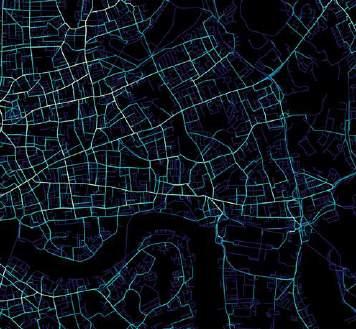
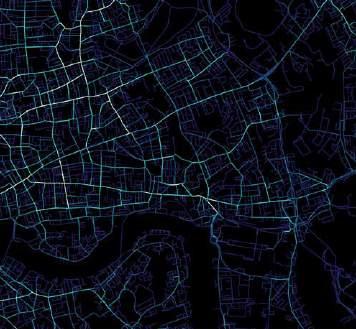
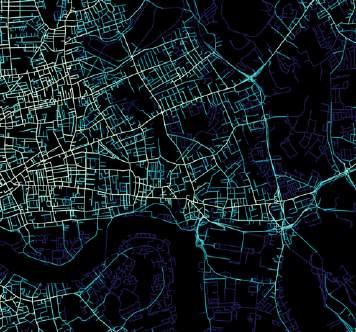
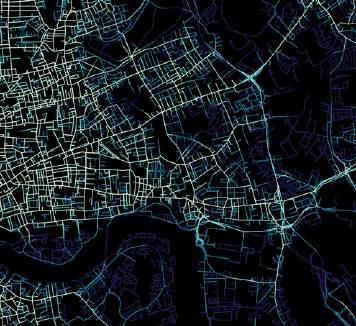
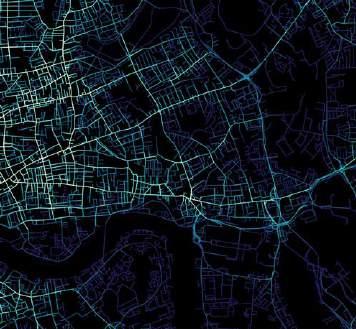
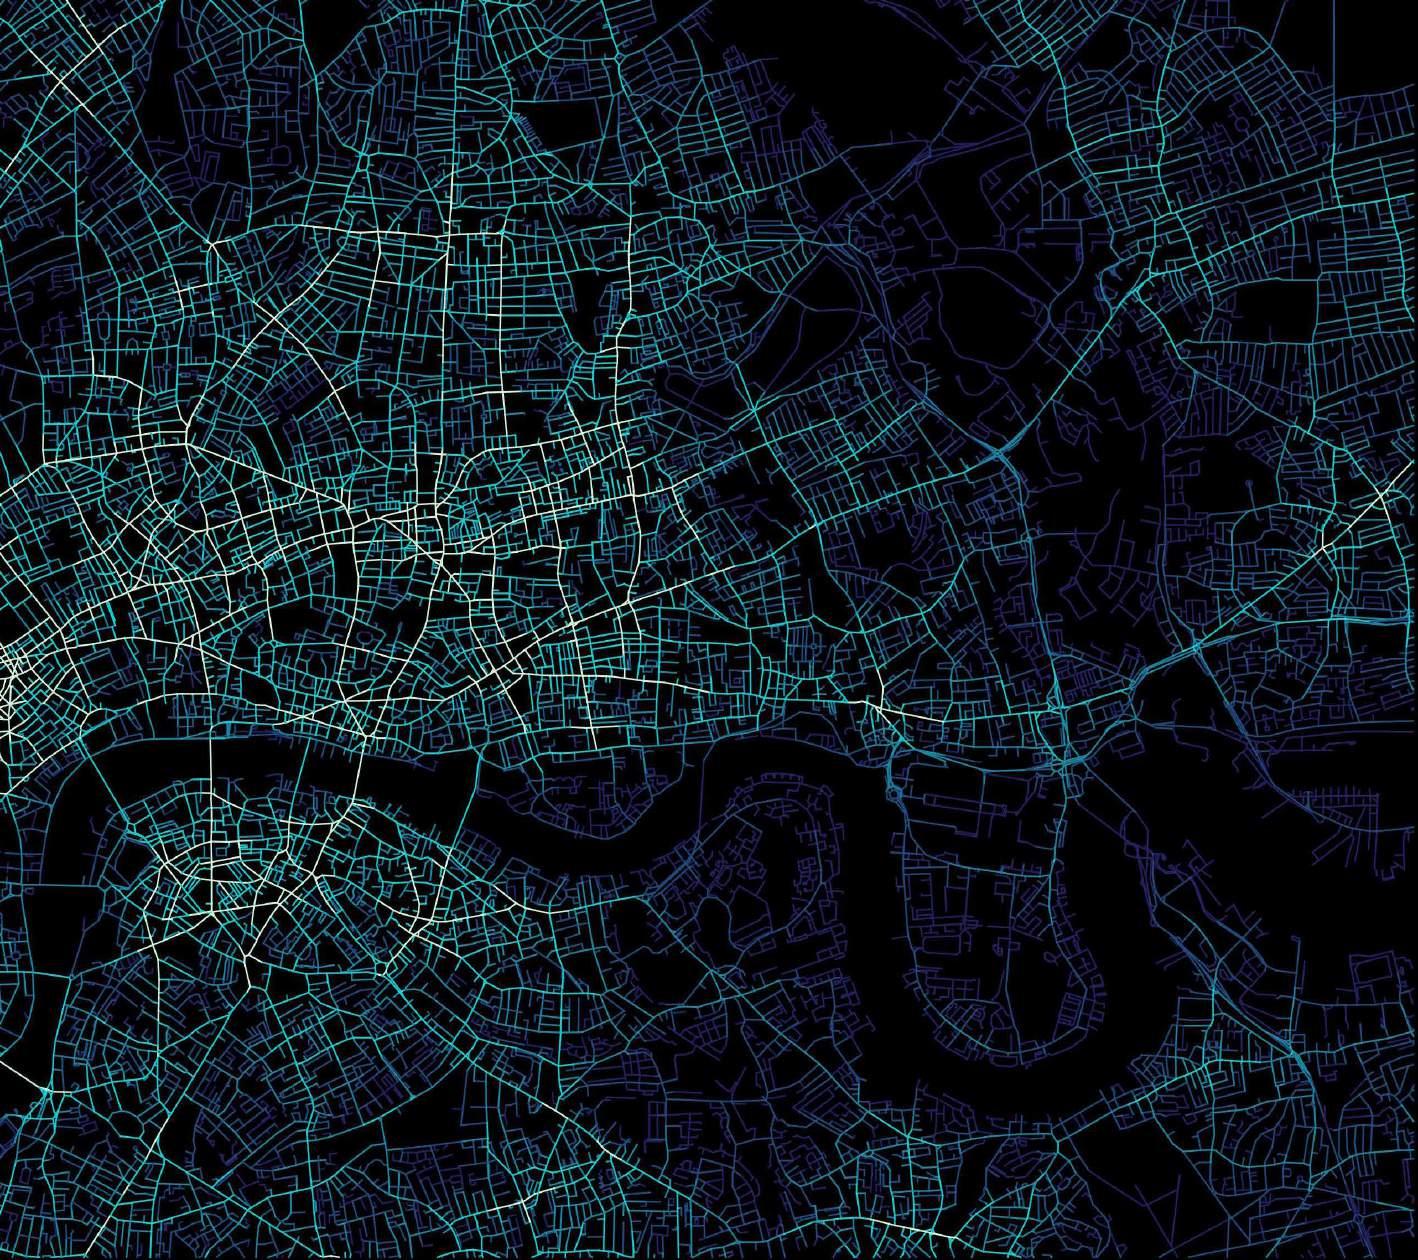
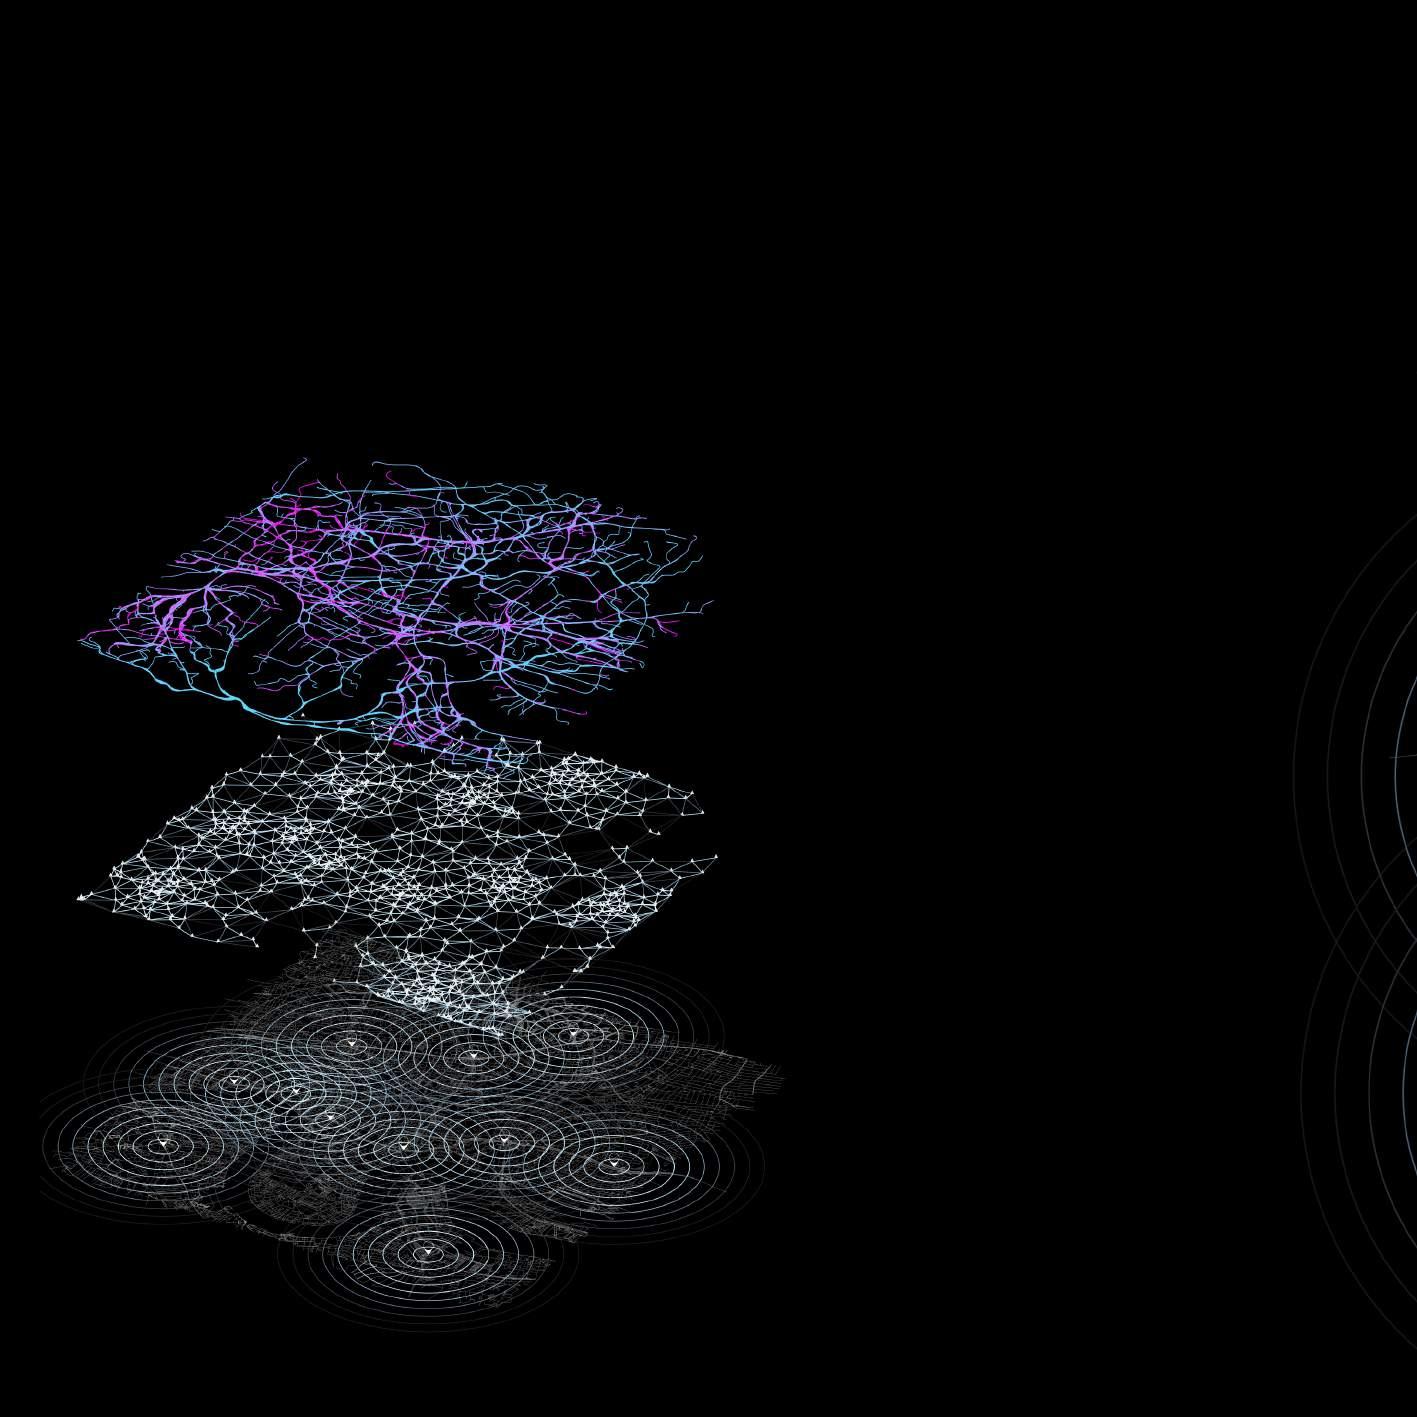
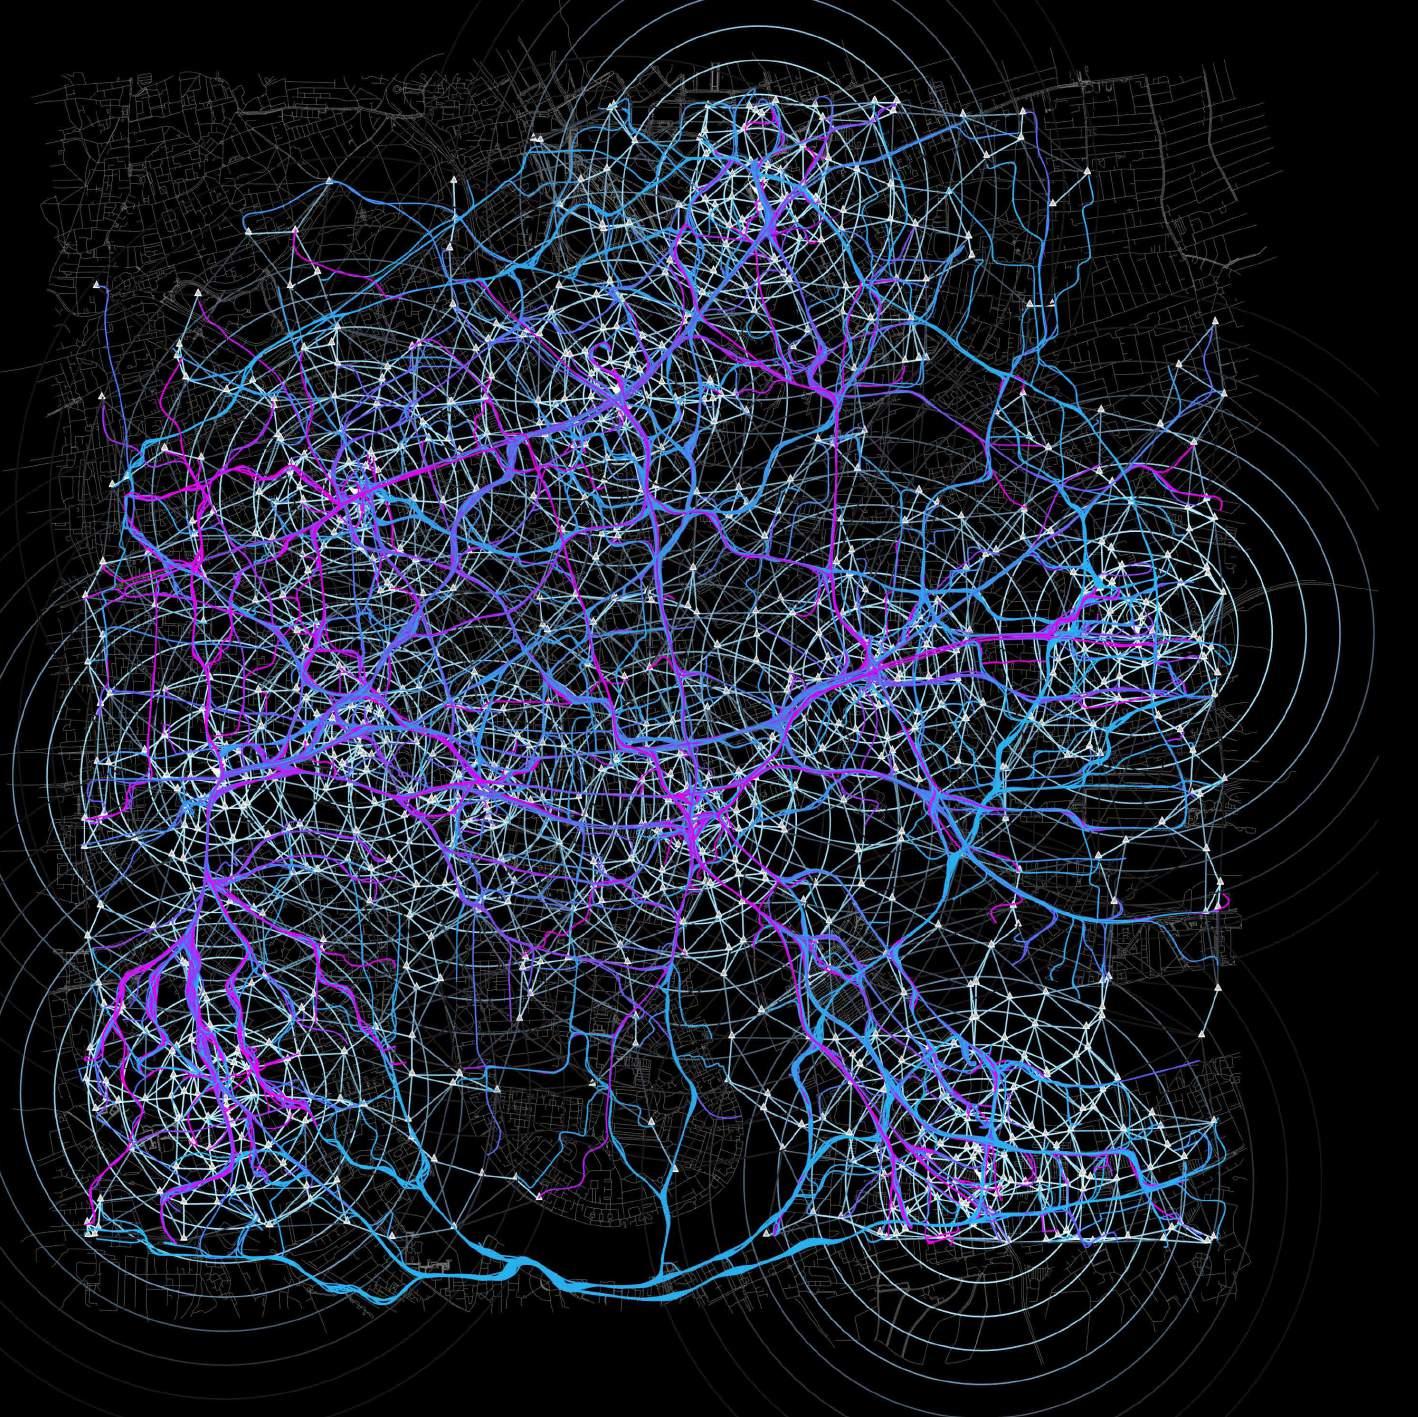
According to the ‘movement.uber.com‘, the data shows the movement data of travel times, speed based on the time change. We simulate the micro scale potential mobility.
FLOW SIMULATION
AGENT-BASED POINT
HIGH DENSITY TRANSPORTATION HUB
SITE SELECTION | Principal Component and K-means Analysis
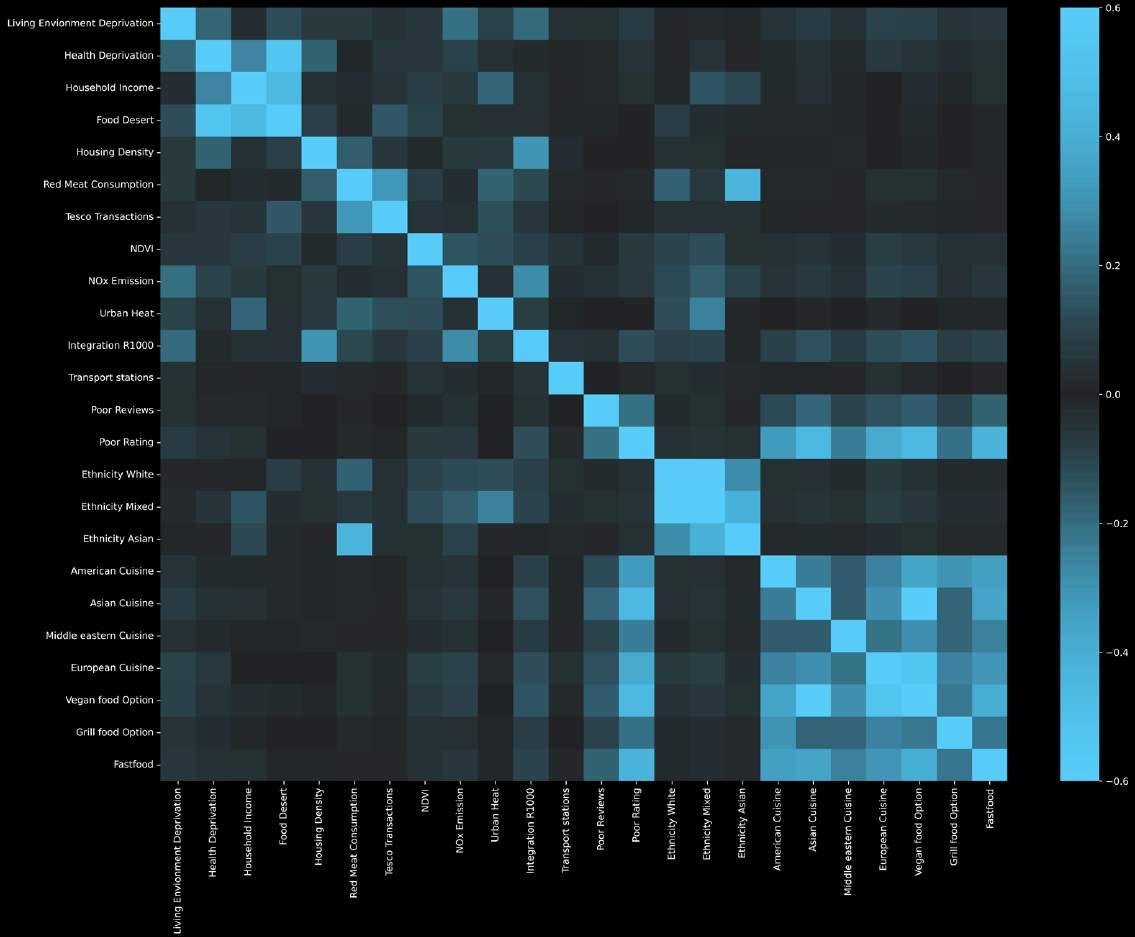
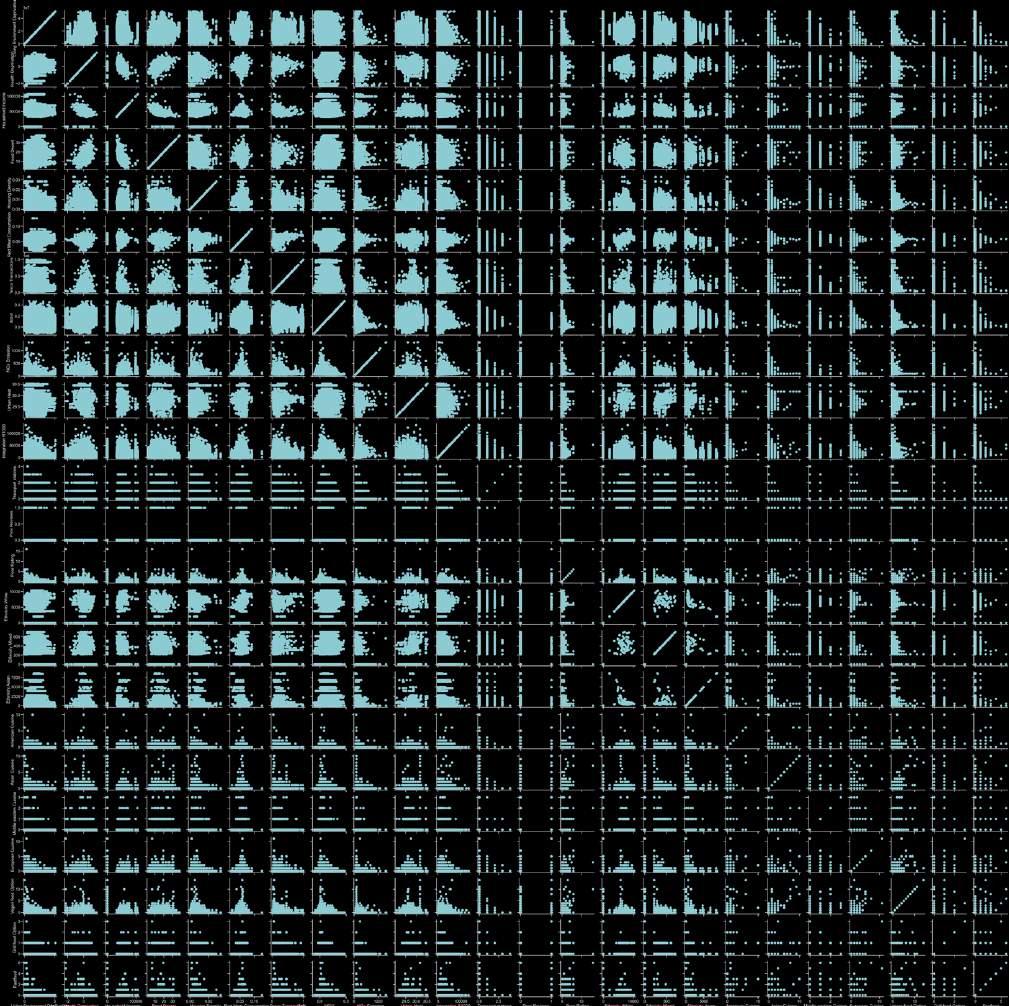
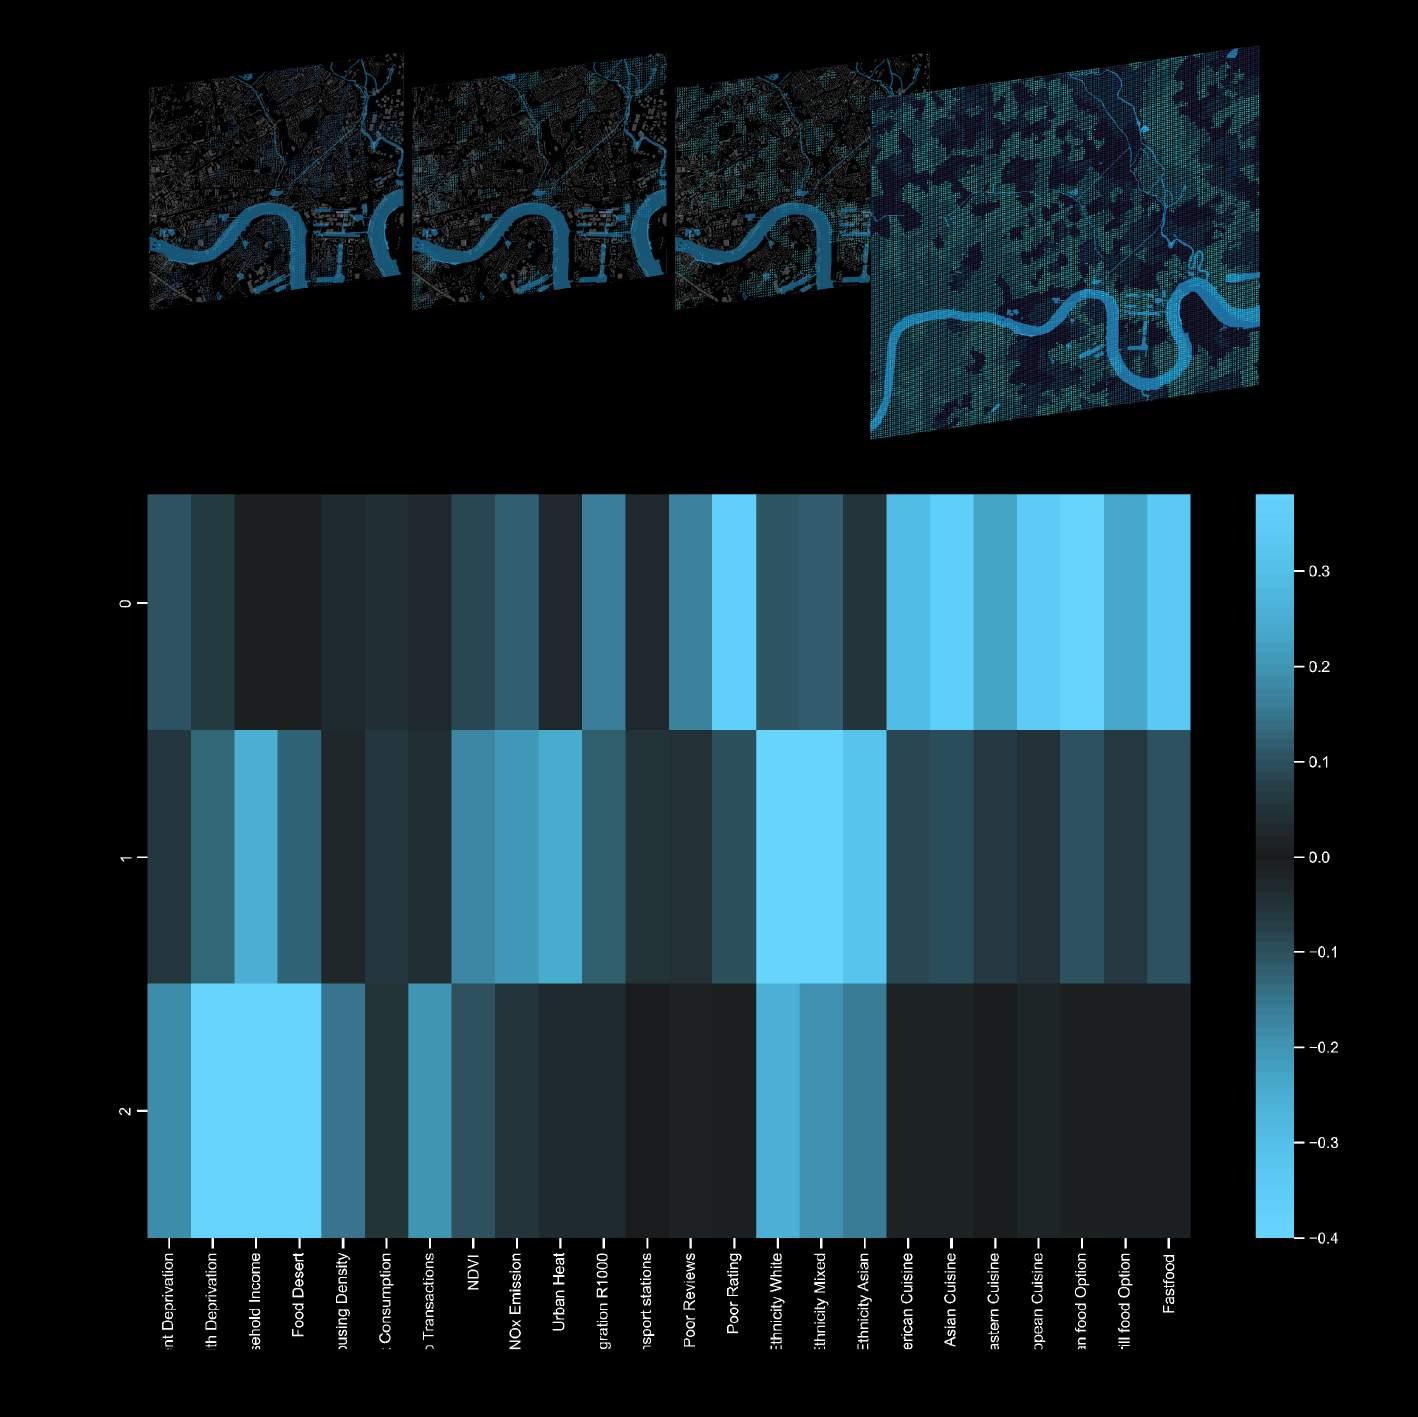
The K-Means cluster heat map shows how distinct data sets are represented inside different clusters. Clusters 1 and 3 best depicted the problematic regions in need of action, after selecting the most relevant components to better illustrate them on the map. As a conclusion from the PCA analysis, the combination of High Food desert and Low Household Income further helps us narrow down the areas for interventions.
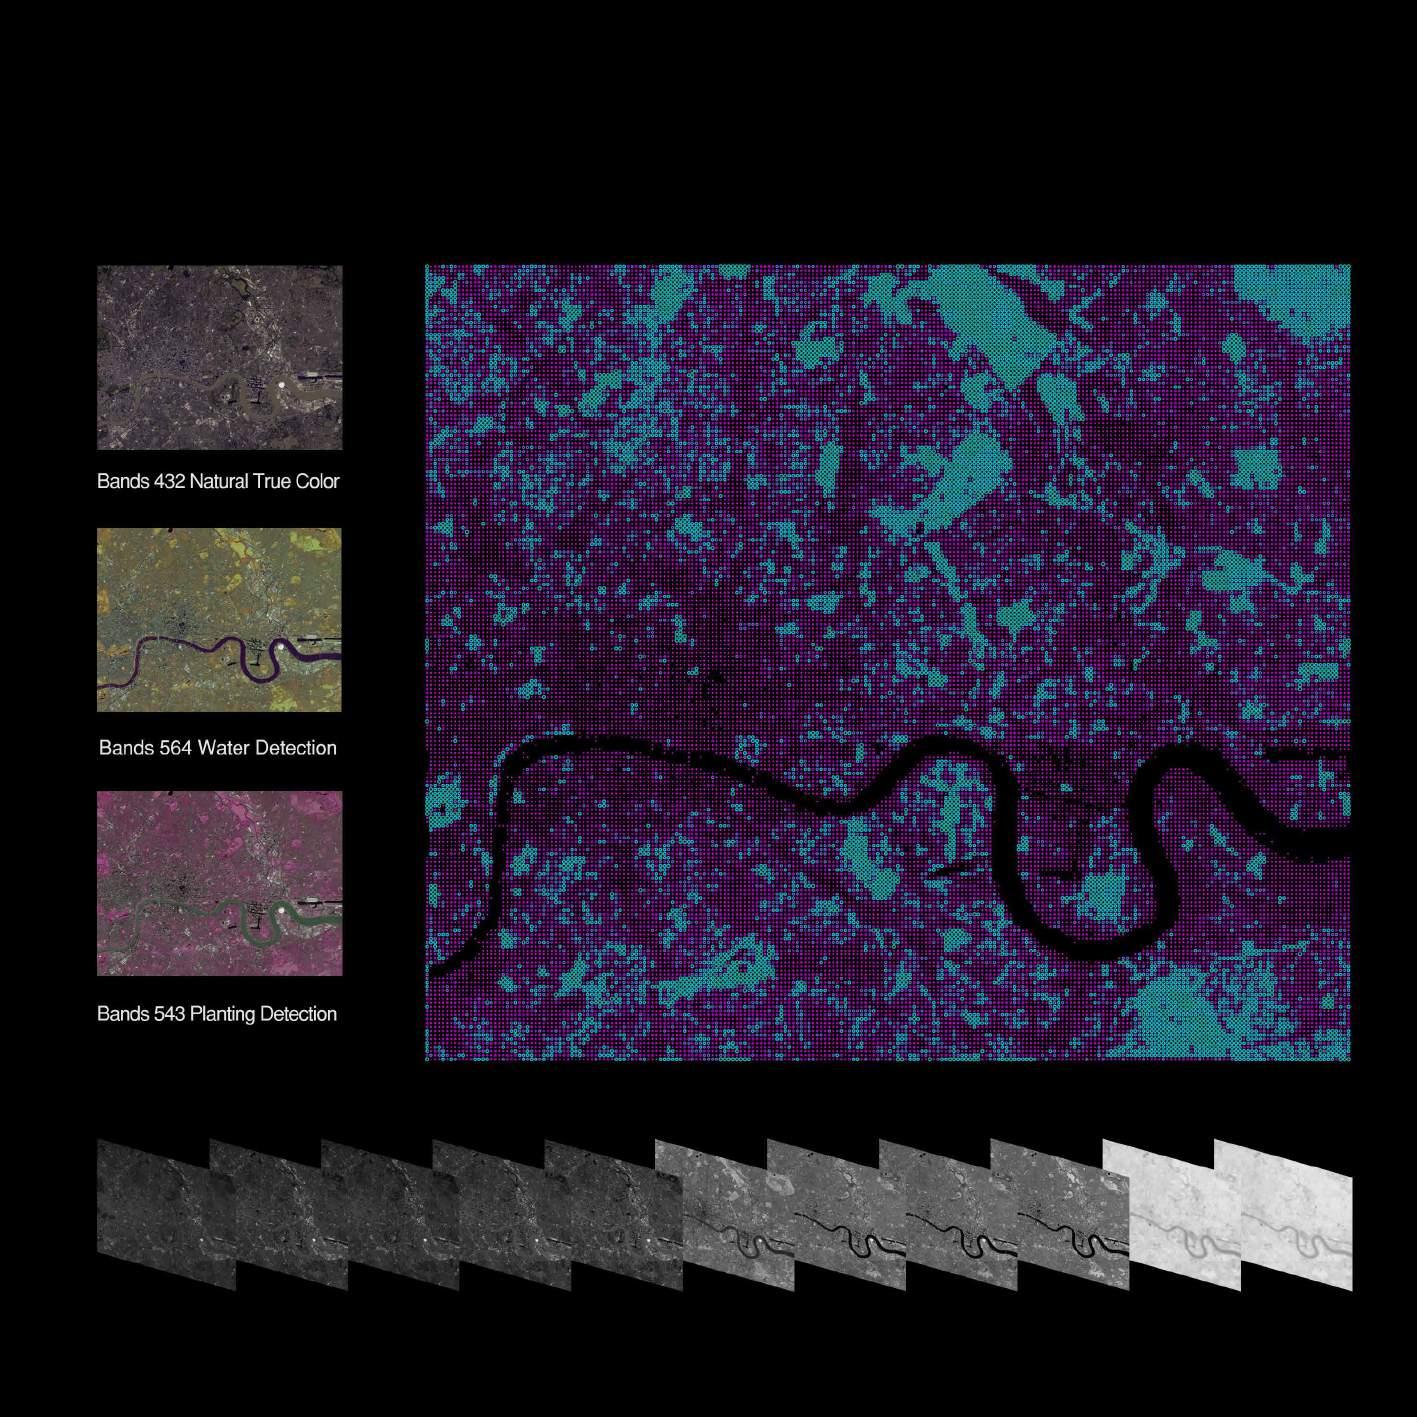
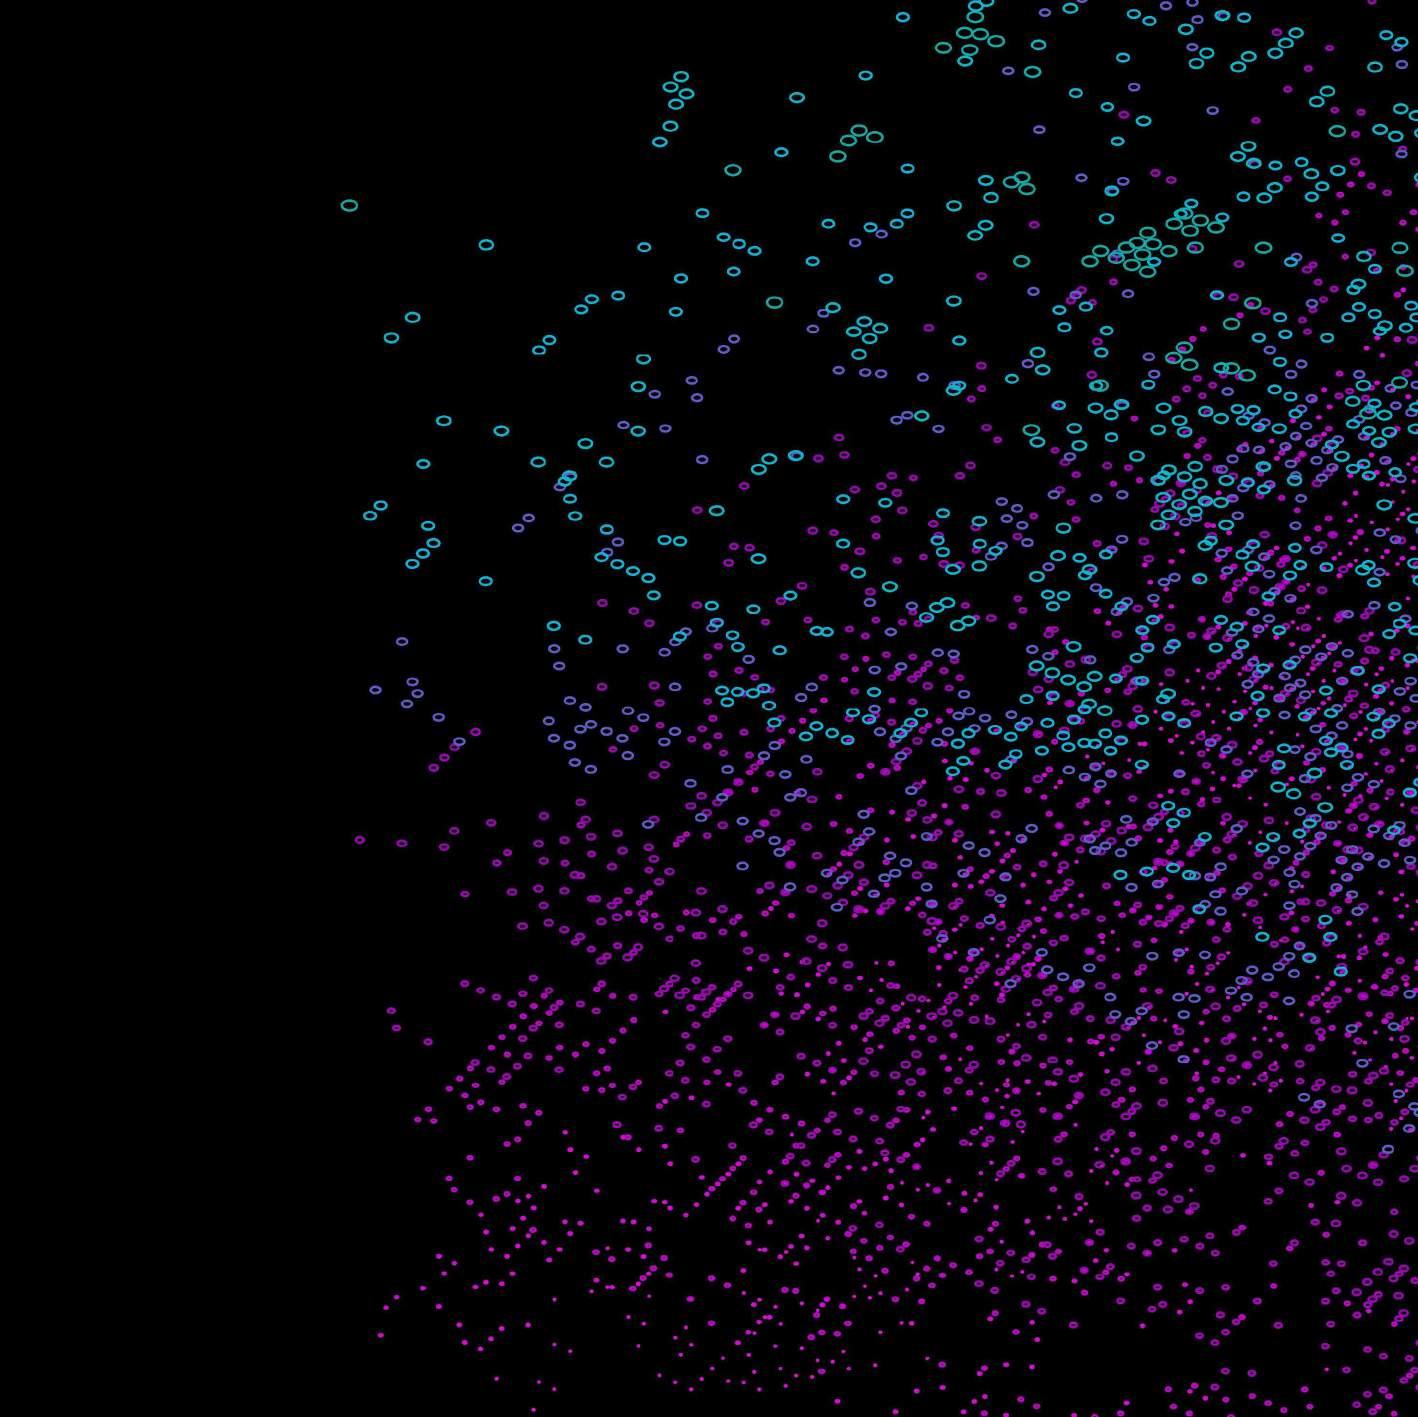
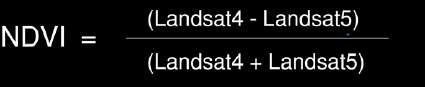
SPECIAL DATA | NDVI (Normalized difference vegetation index)
Done by using the remote sensing data and composing the bands of Landsat 8, which describes the reflectance of vegetation cover and can be used to estimate the density of green on an area of land.
LANDSCAPE ANALYTICS | Rain Flow Analysis
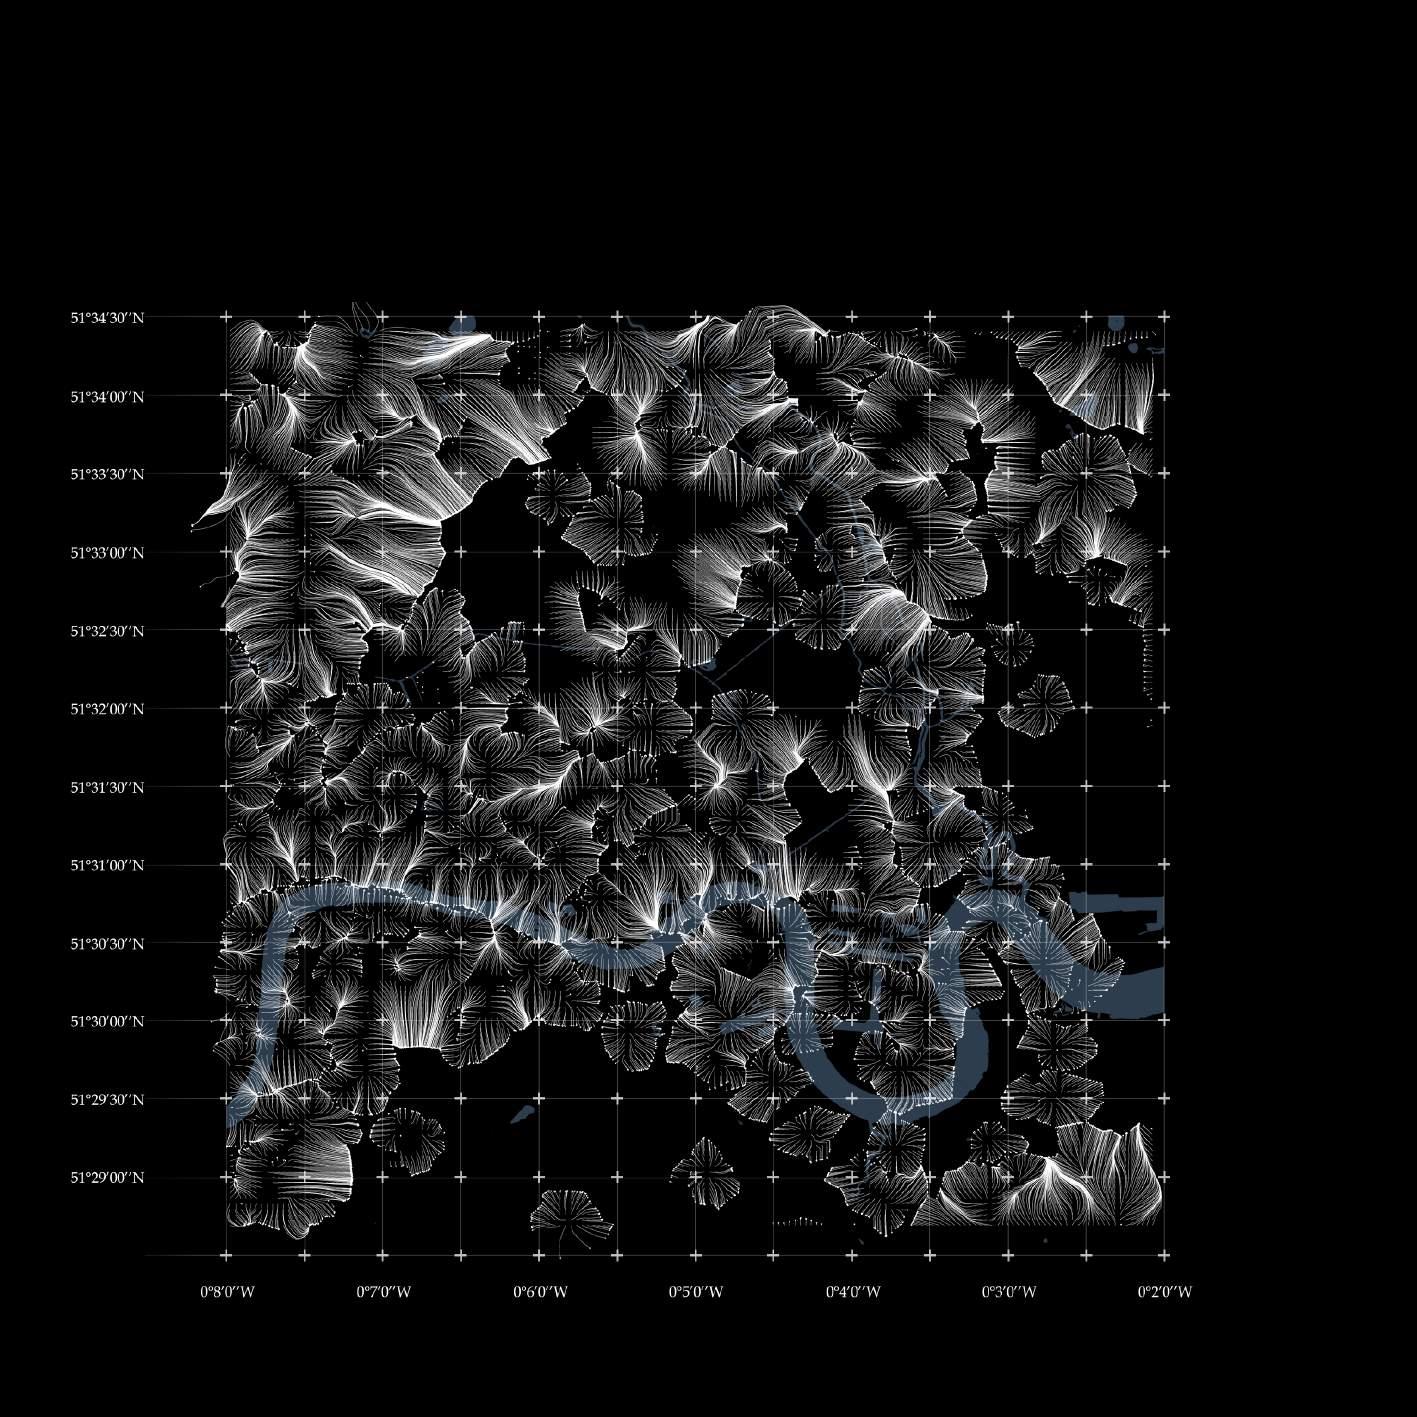
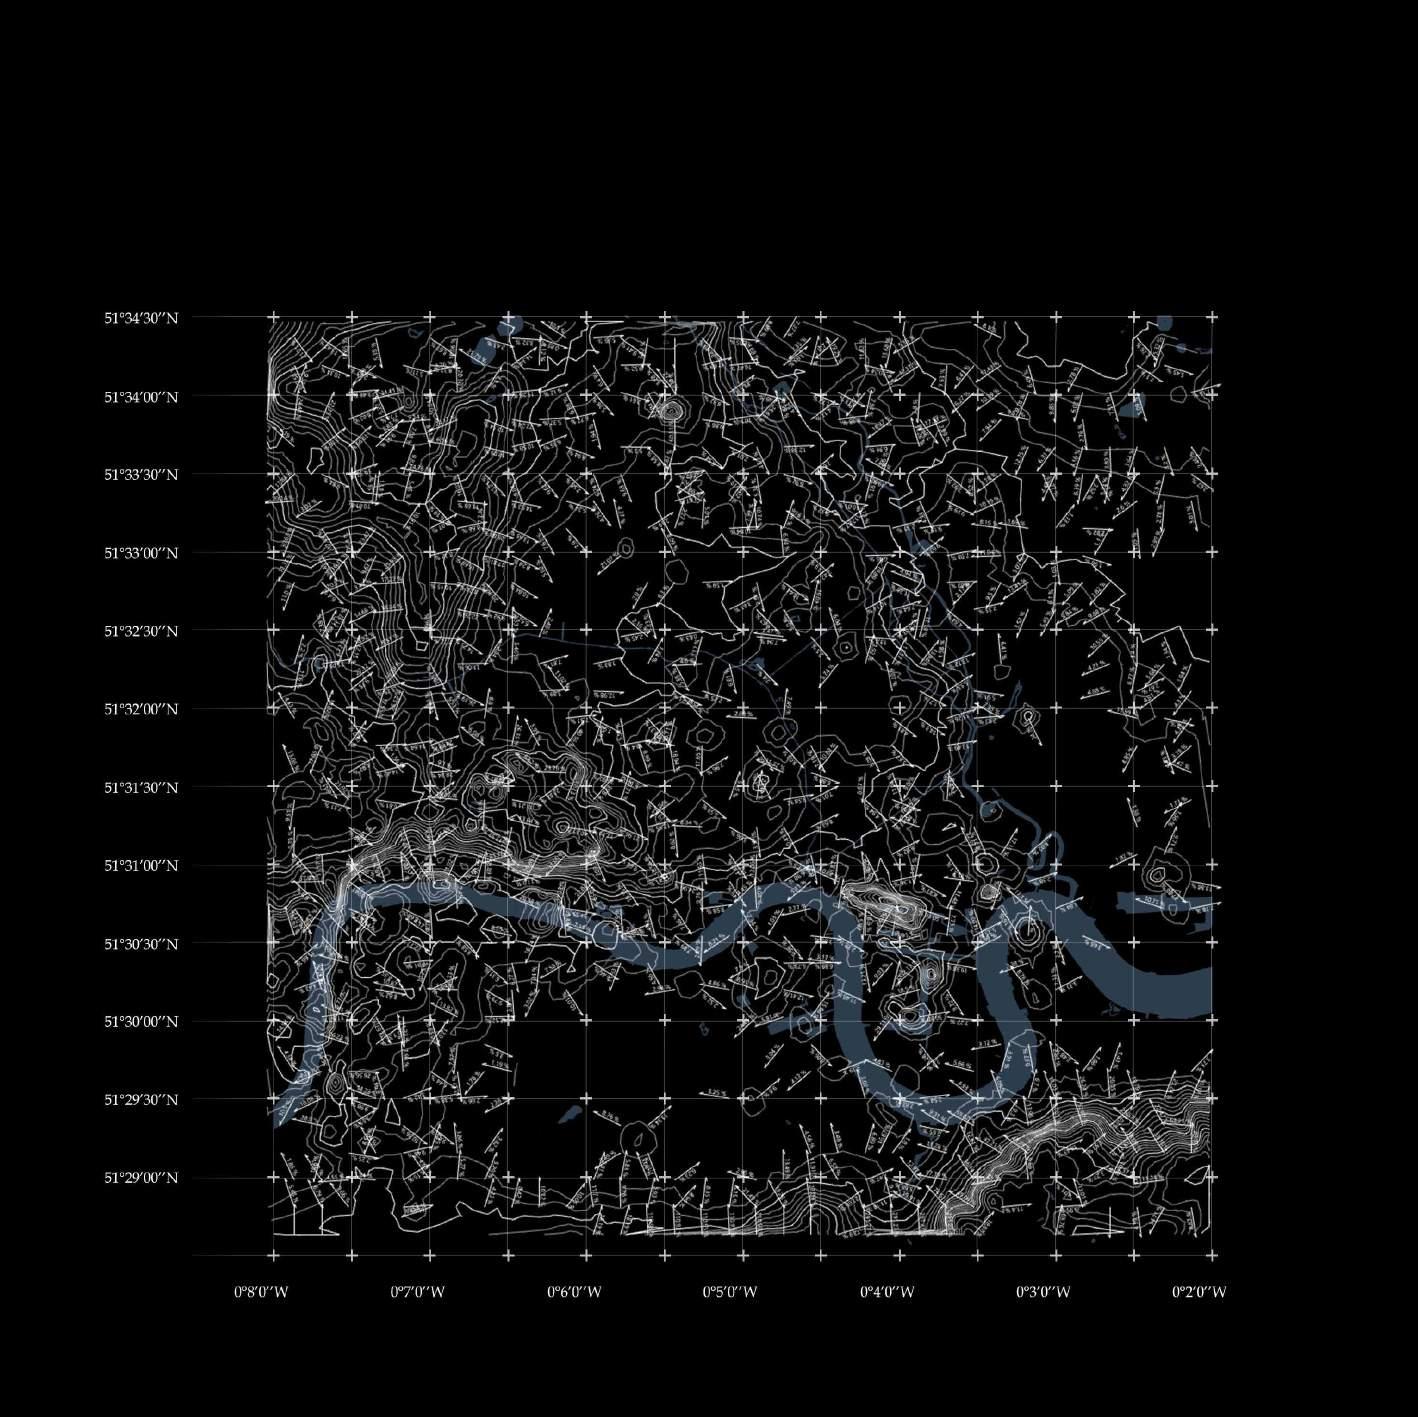
We simulate the rain flow, the slope and the aspect by using the DEM data of our site as factors for site selection. Afterwards we use these data as an important factors to calculate the distance for site selection.
LANDSCAPE ANALYTICS | DEM (Contour and Slope) Analysis
We use spatial analysis to calculate the slope and contour based on the DEM data. Slope and elevation are two crucial information that contributes to out suitability analysis below.
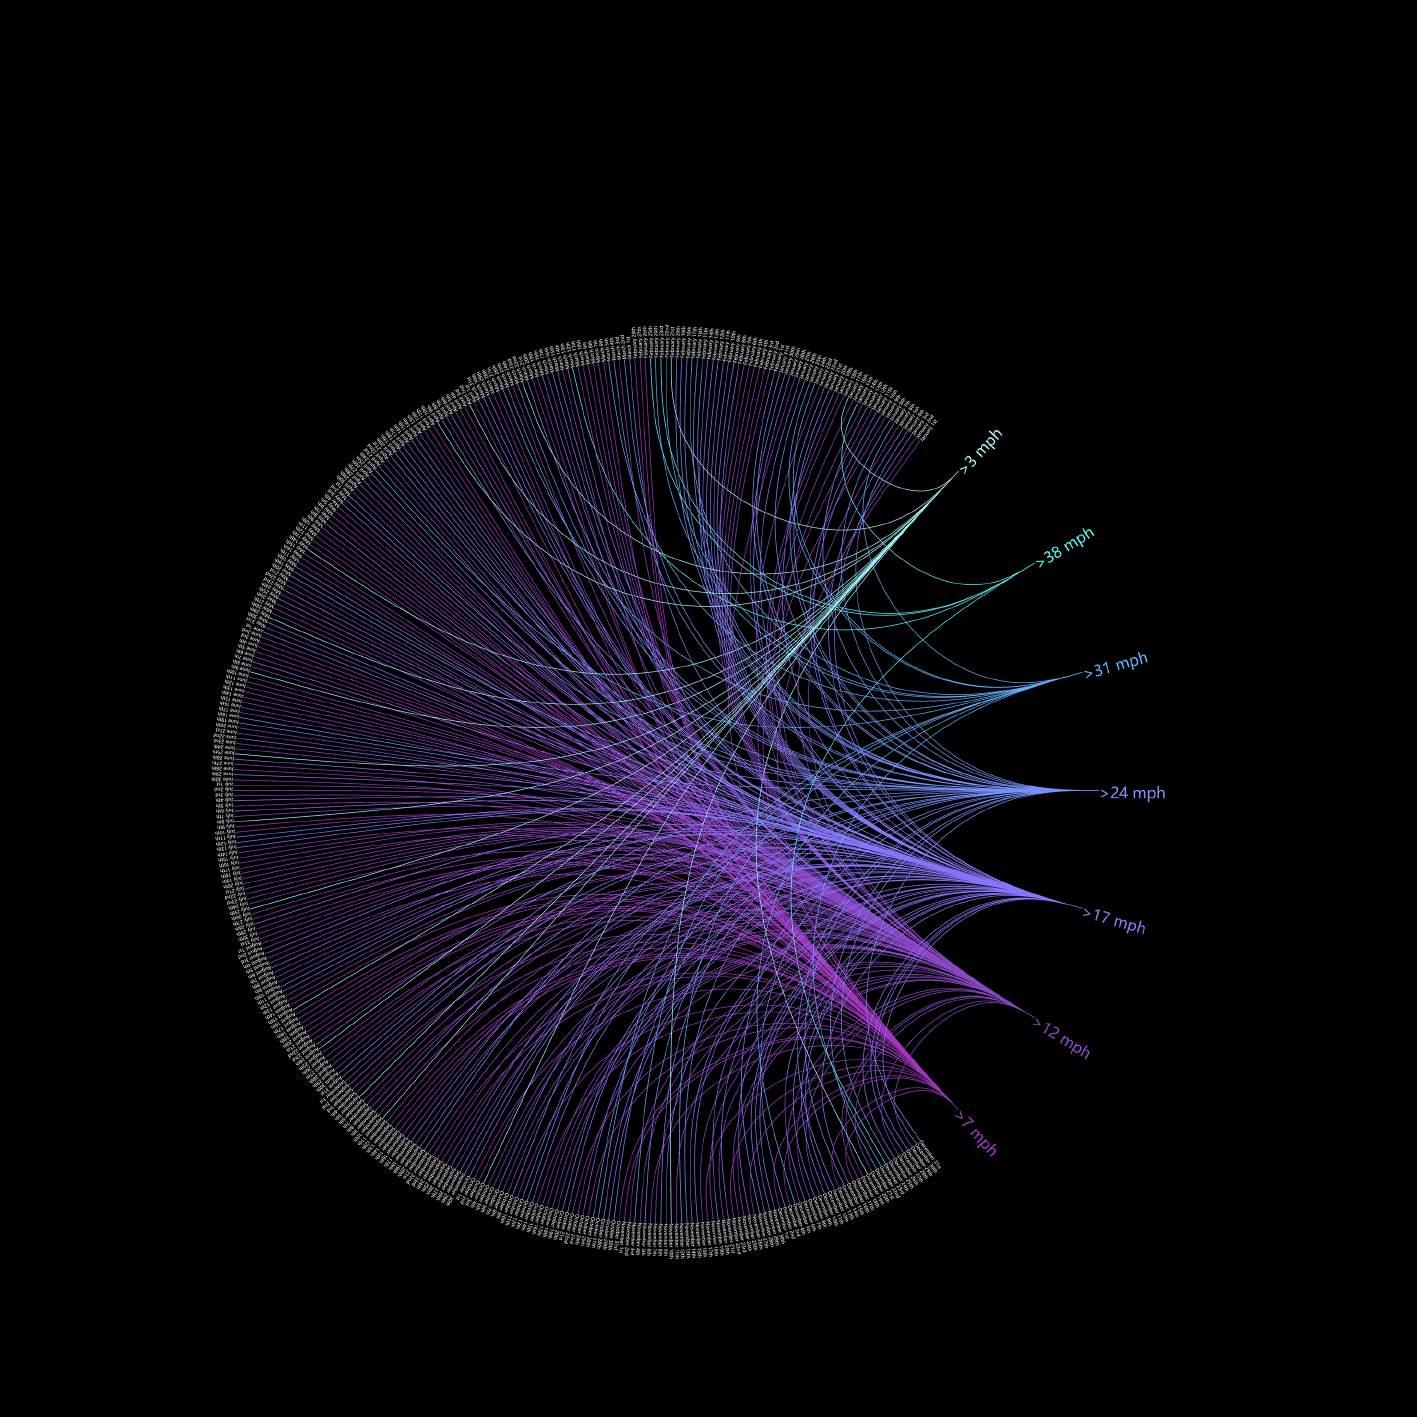
INFORGRAPHICS | London Wind Speed Analysis
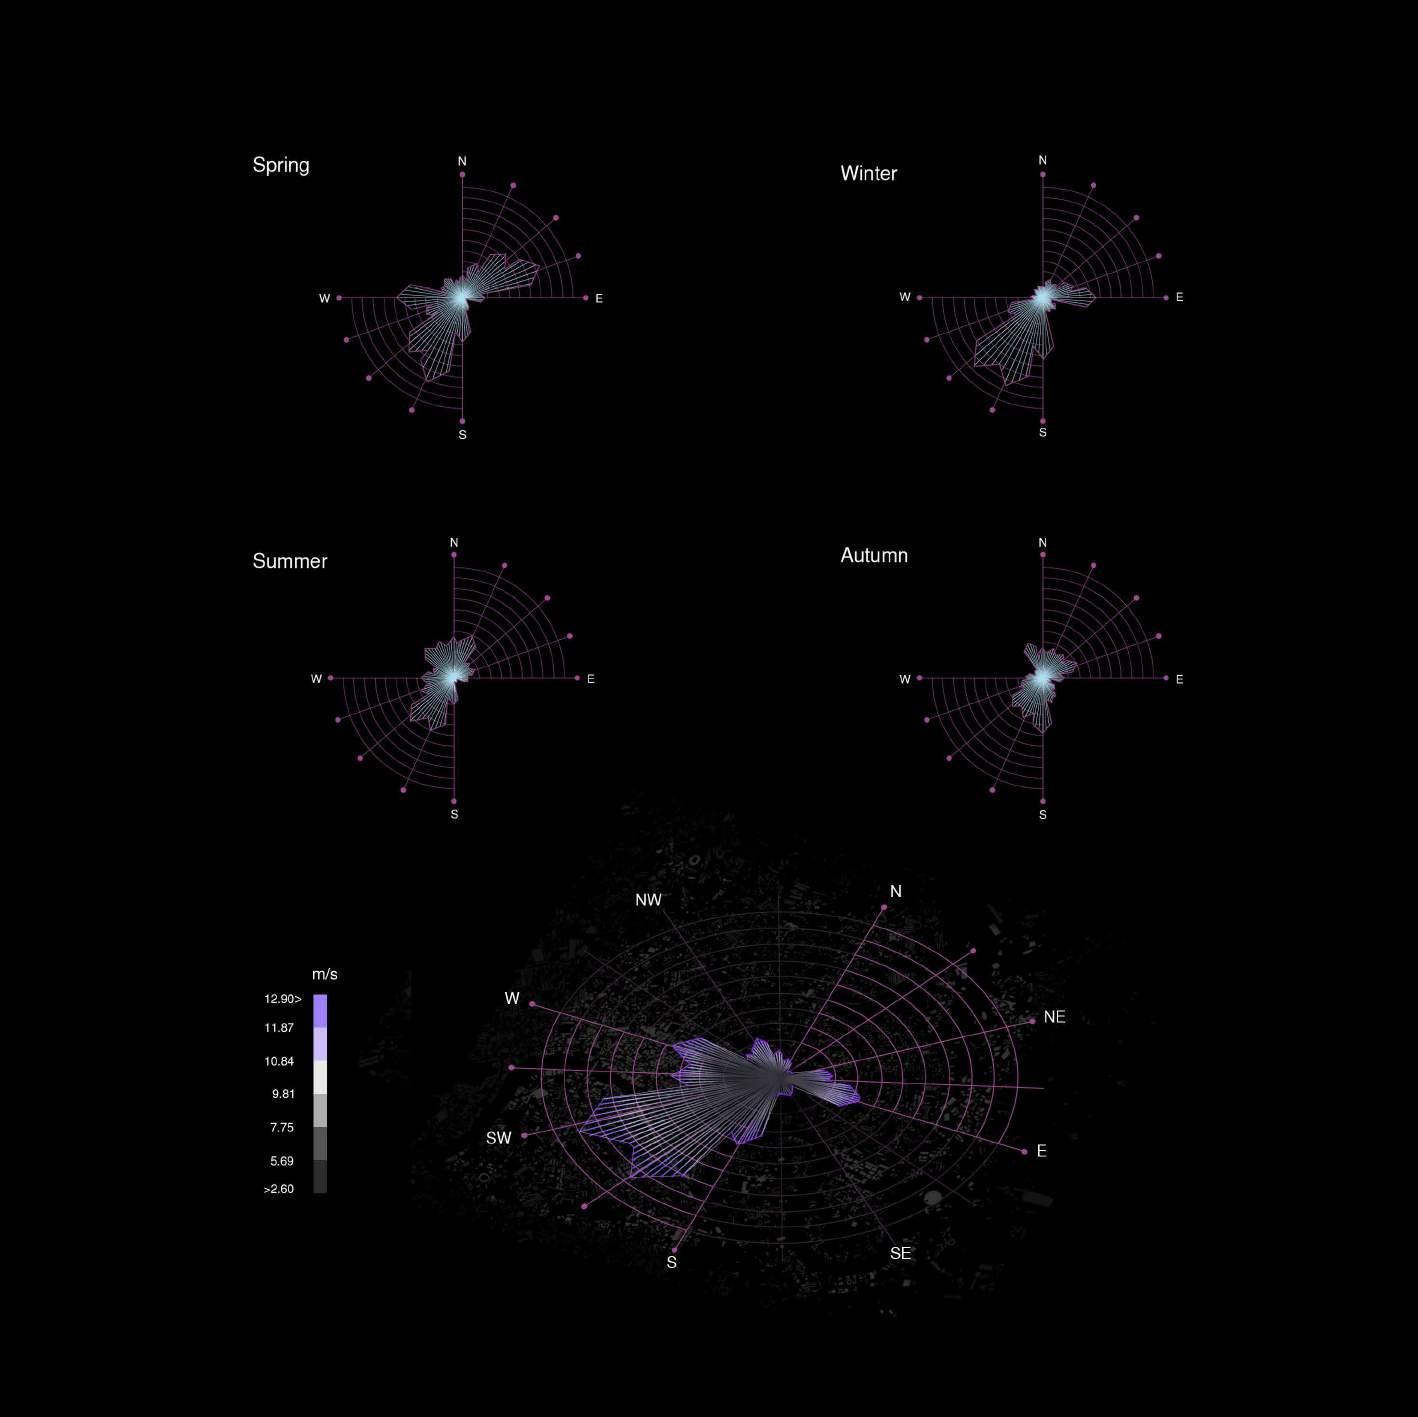
The wind roses for the four seasons show that overall, north-easterly winds prevail in London. The urban wind environment is the key factor that dominates the urban climate and directly affects the living environment of the city. By analyzing the wind direction and wind speed in London, we can roughly infer the influence of pollutant transmission speed and other influences.
SUITABILITY ANALYSIS | Dataset and Method
The wind roses for the four seasons show that overall, north-easterly winds prevail in London. The urban wind environment is the key factor that dominates the urban climate and directly affects the living environment of the city. By analyzing the wind direction and wind speed in London, we can roughly infer the influence of pollutant transmission speed and other influences.
SUPERVISED SUITABILITY ANALYSIS
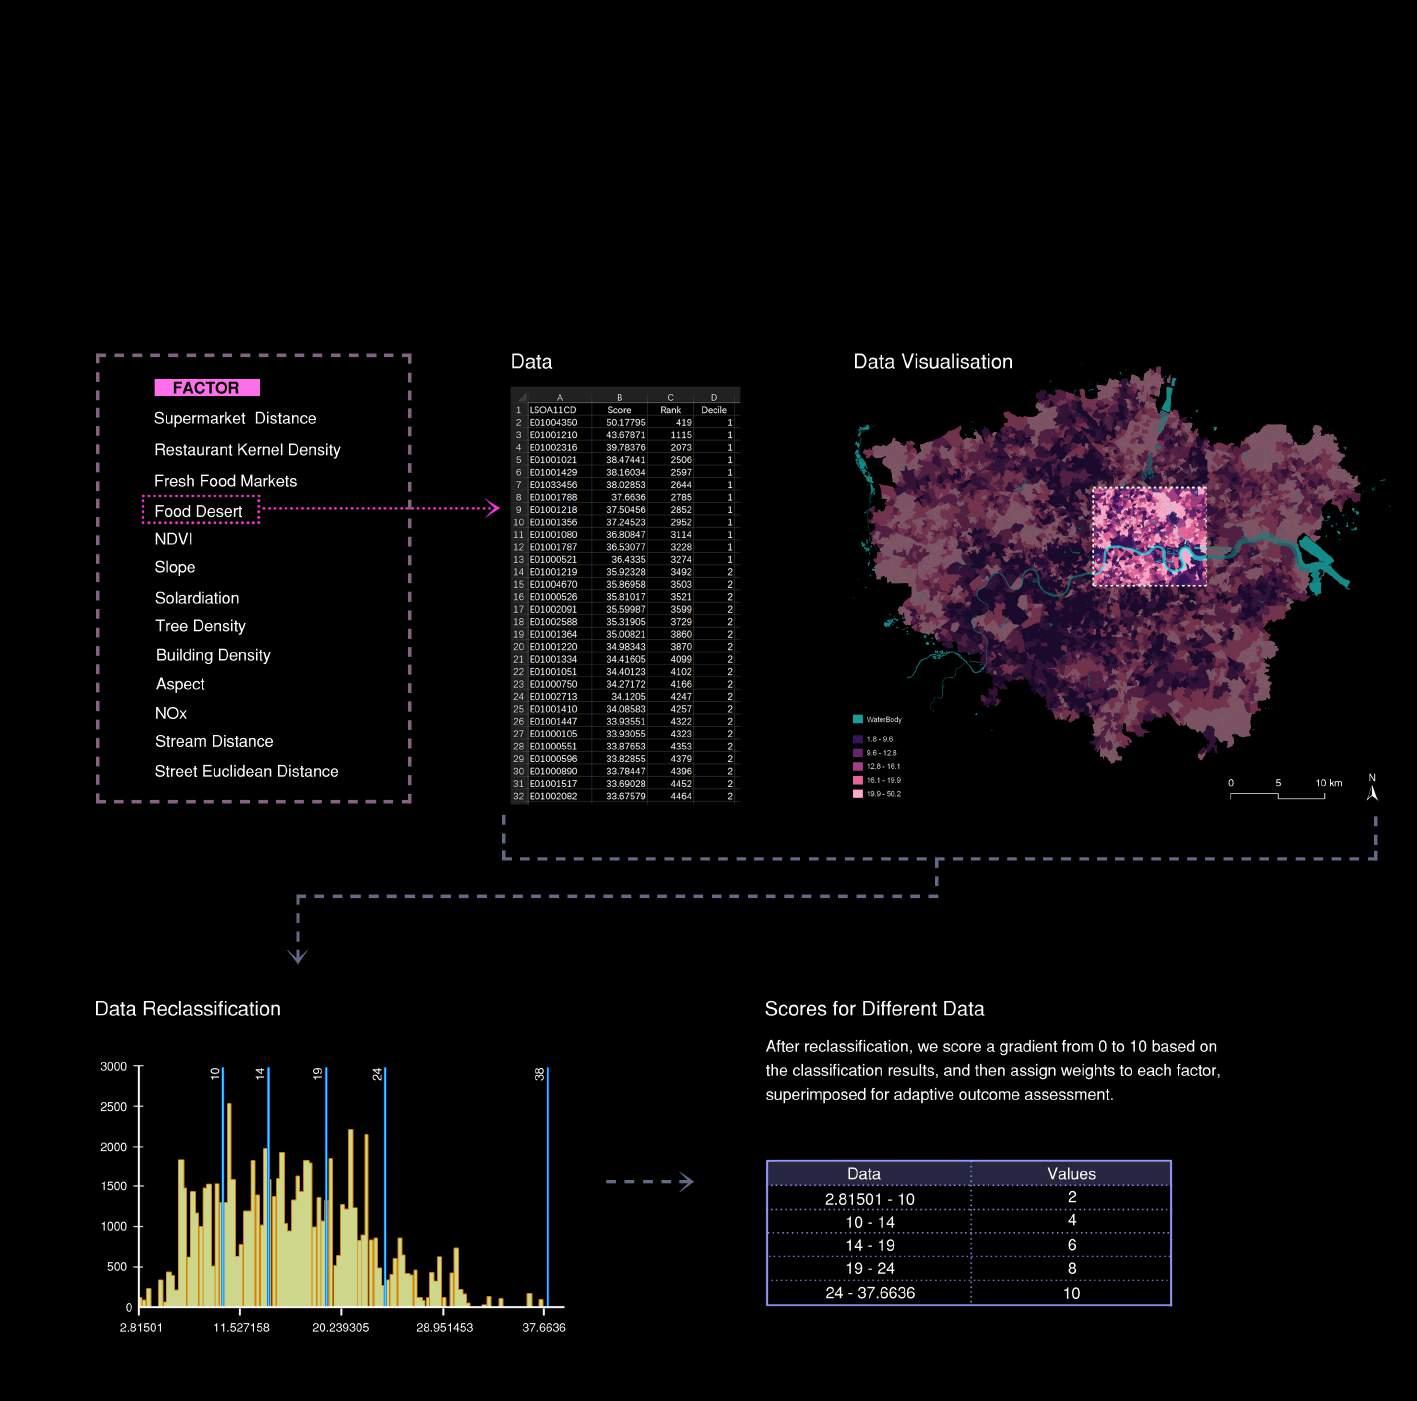
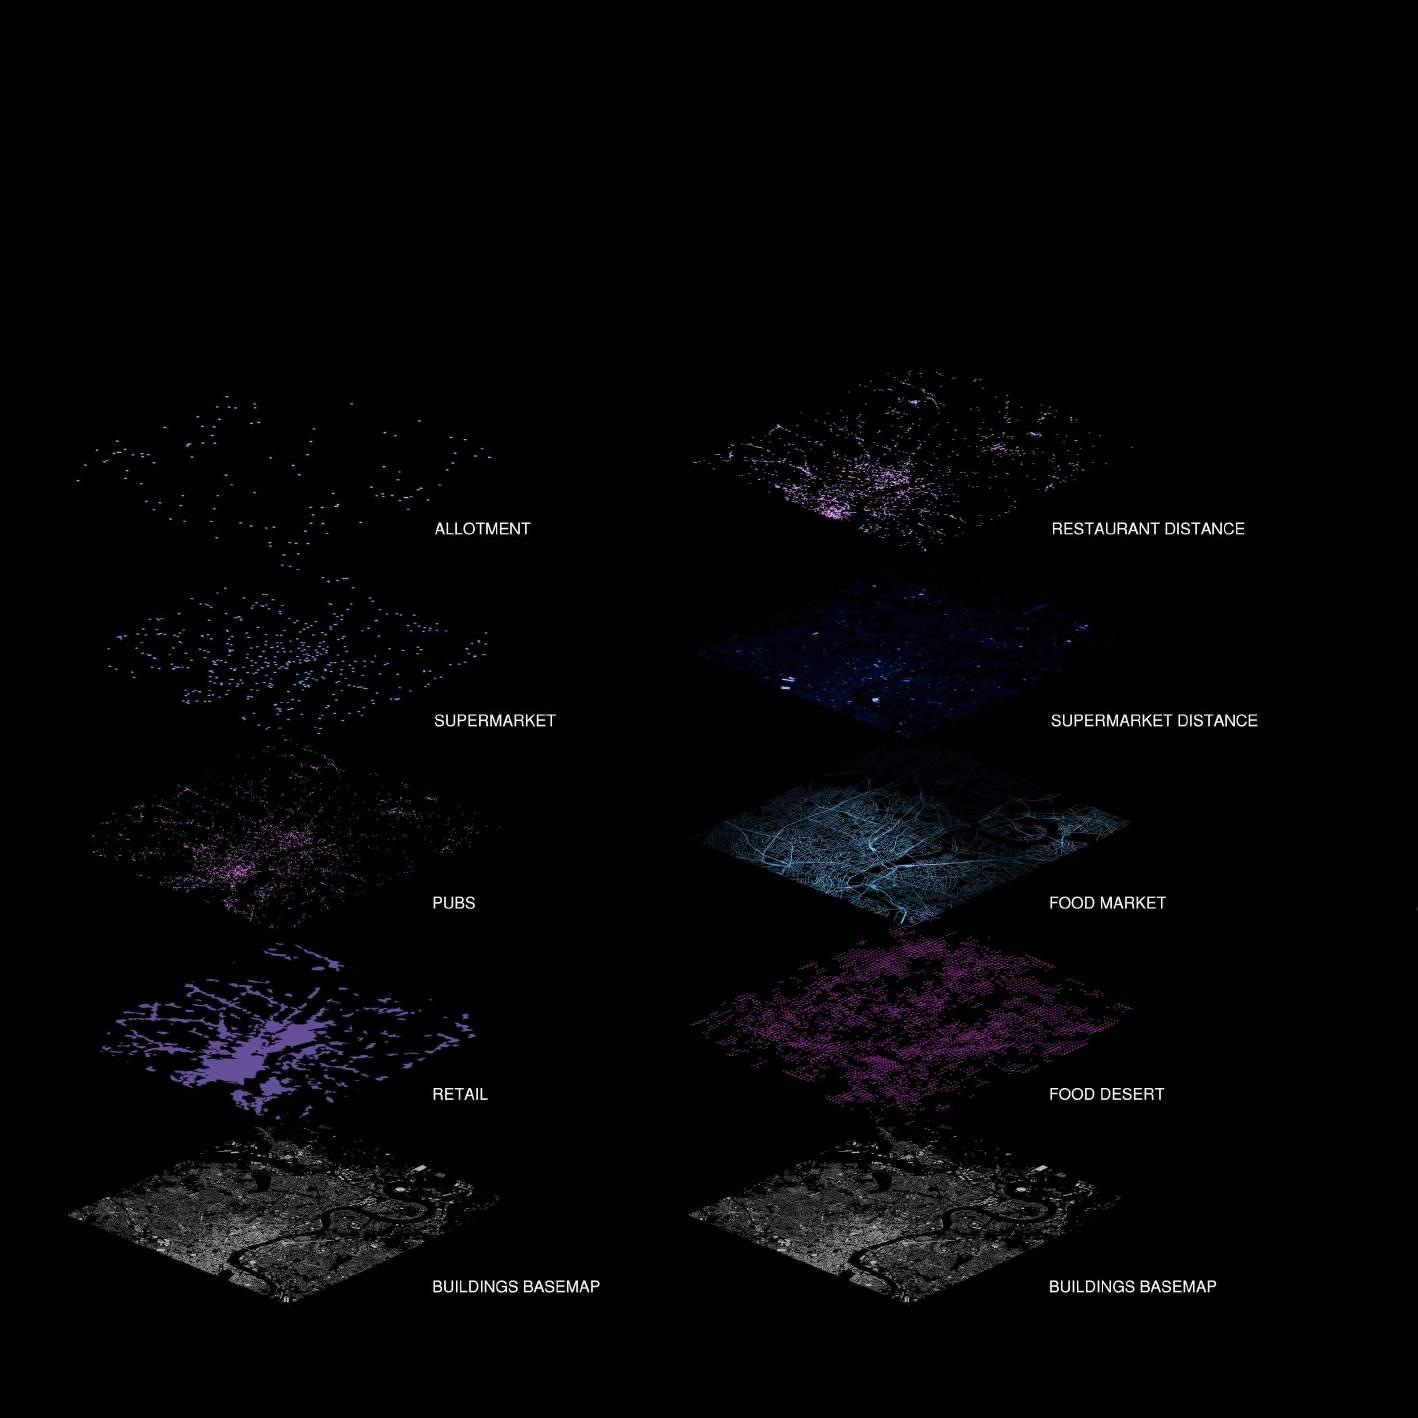
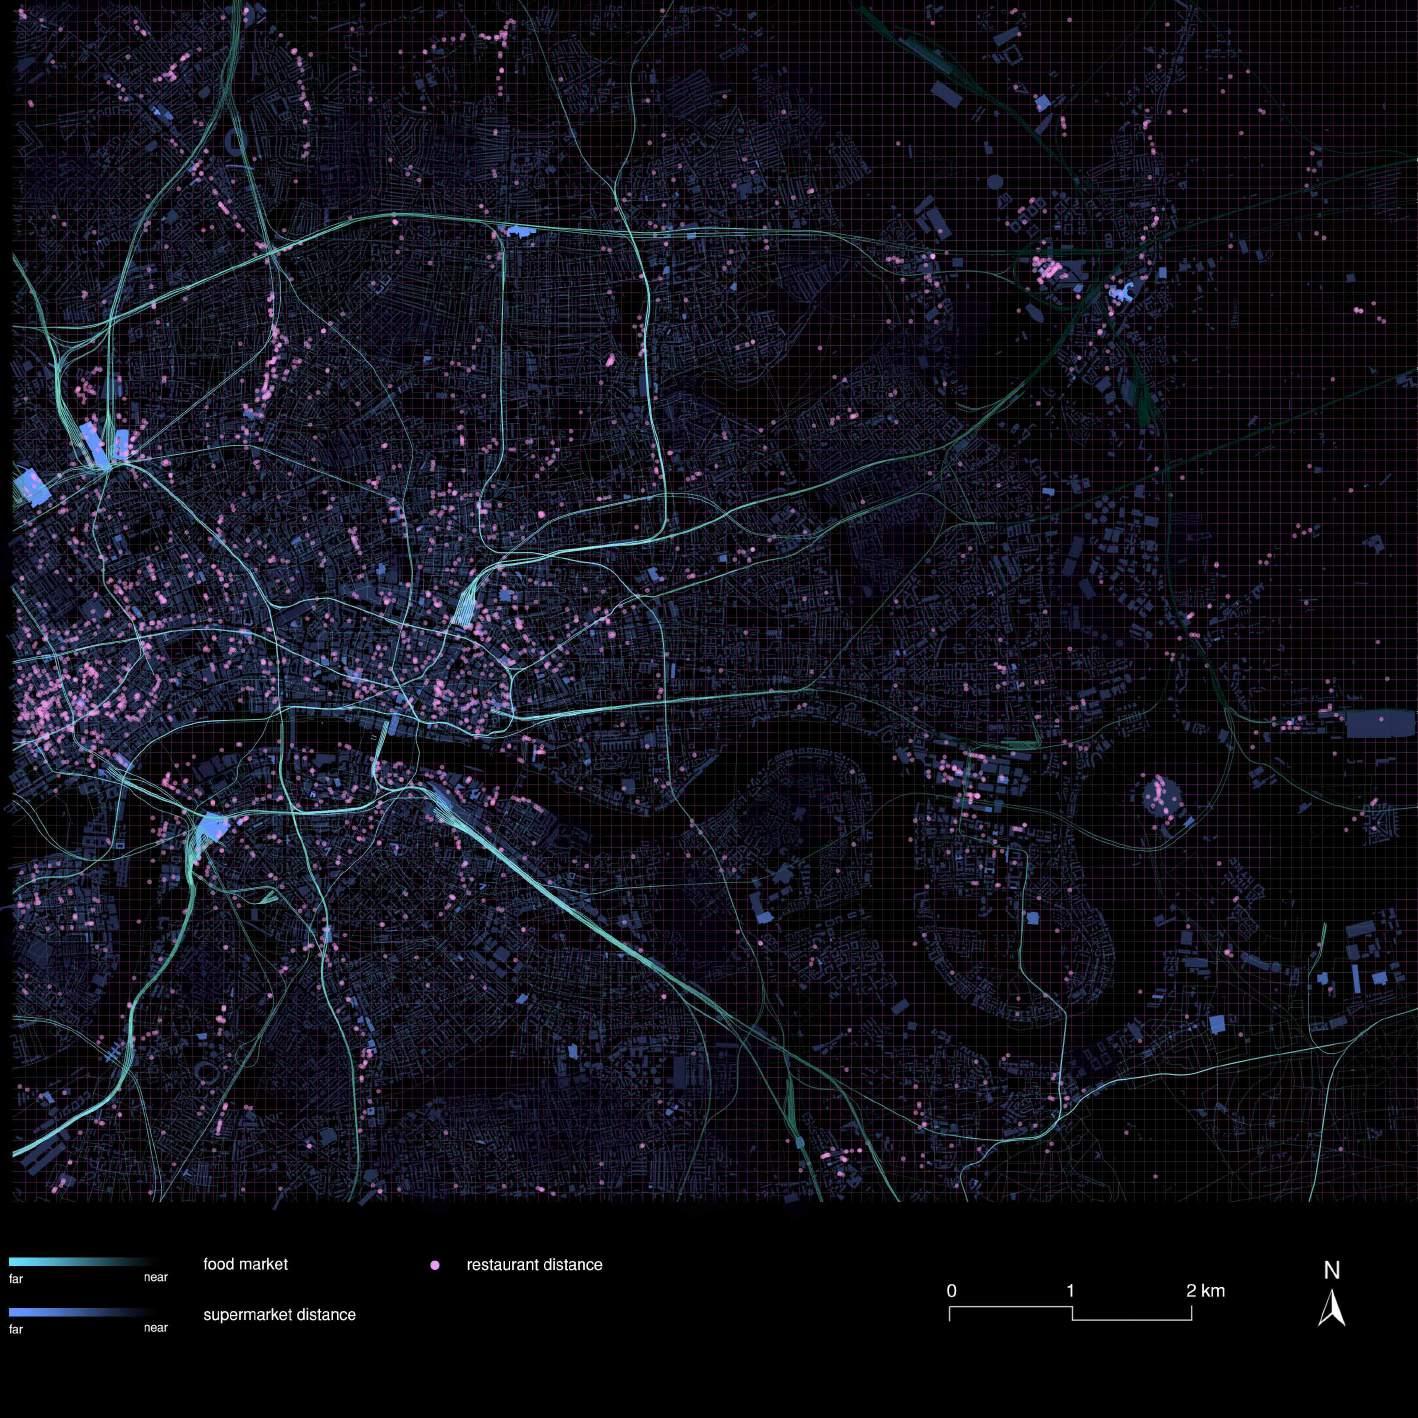
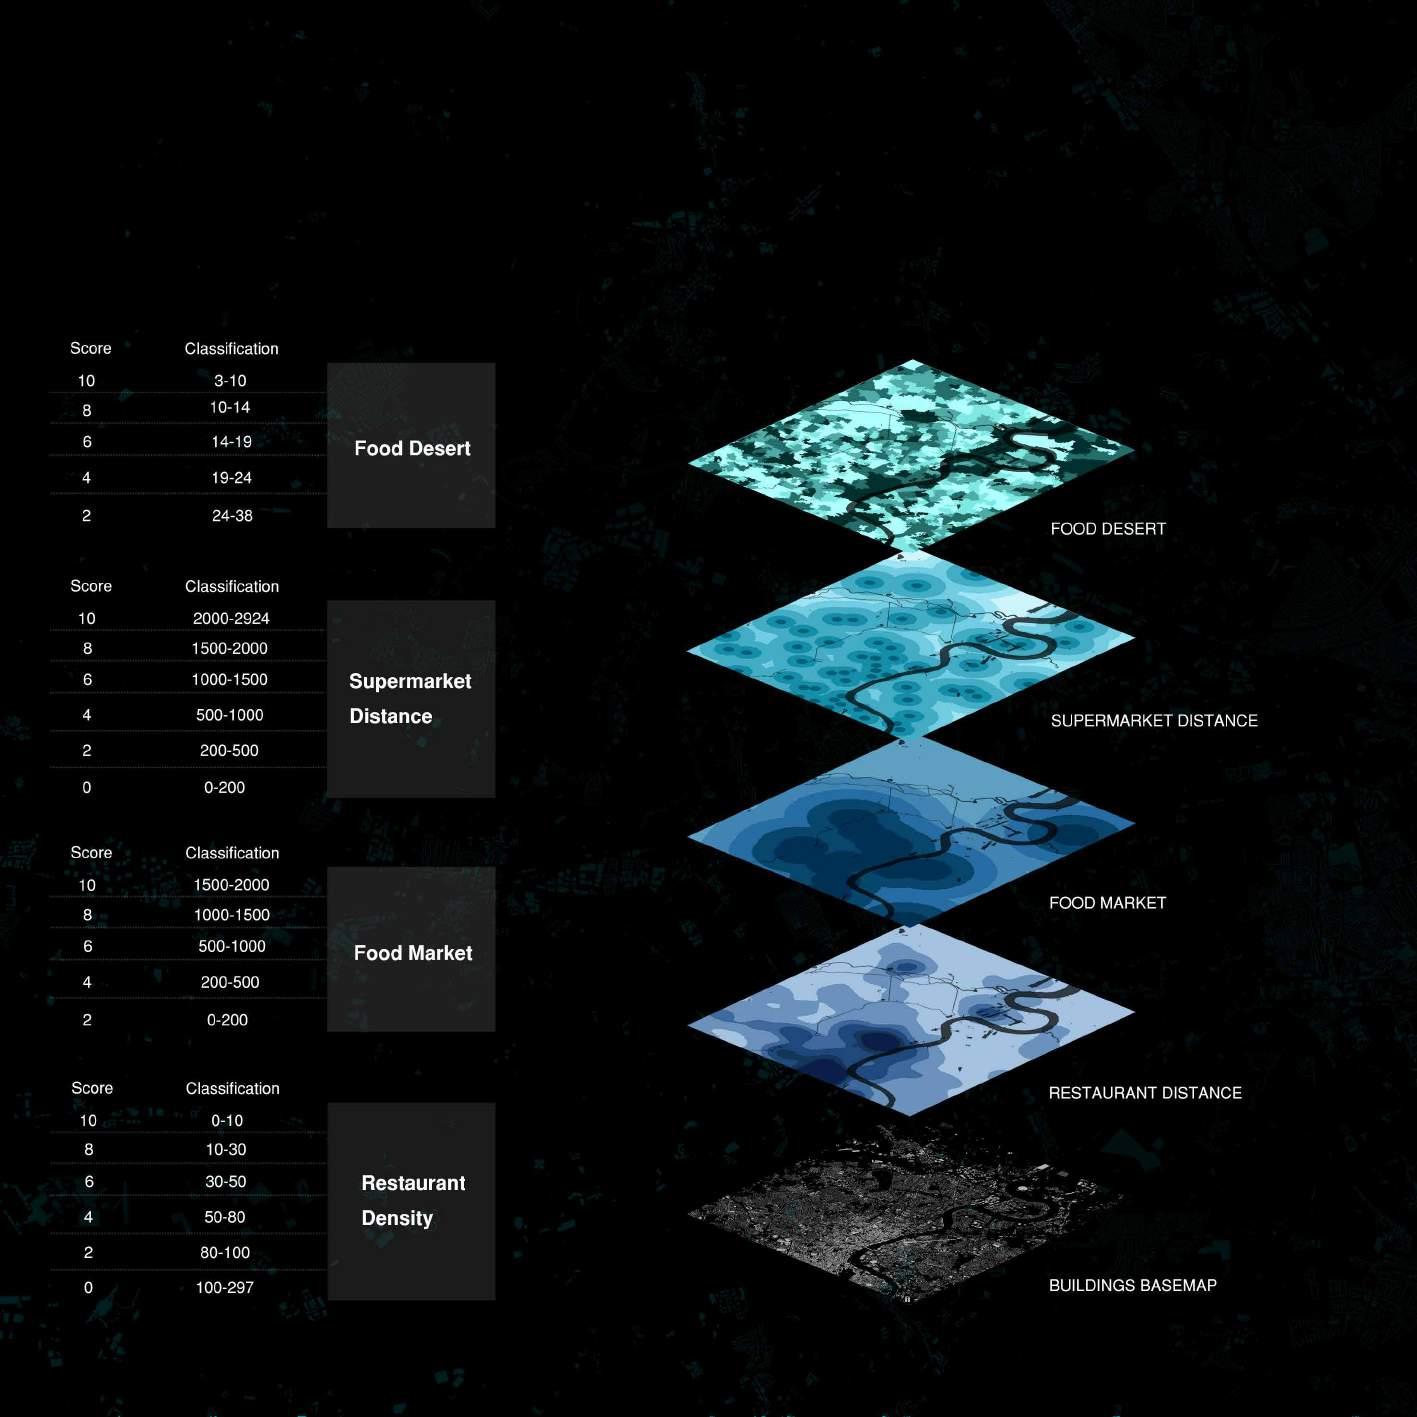
After PCA and K means, we start our supervised suitability analysis. Firstly, we use the 4 most important food related data: Food Desert, Supermarket Distance, Food Market Distance, Restaurant Density. We use different method to deal with the data according to their types like kernel density, point density, euclidean distance etc.
SUITABILITY ANALYSIS
Related Factors
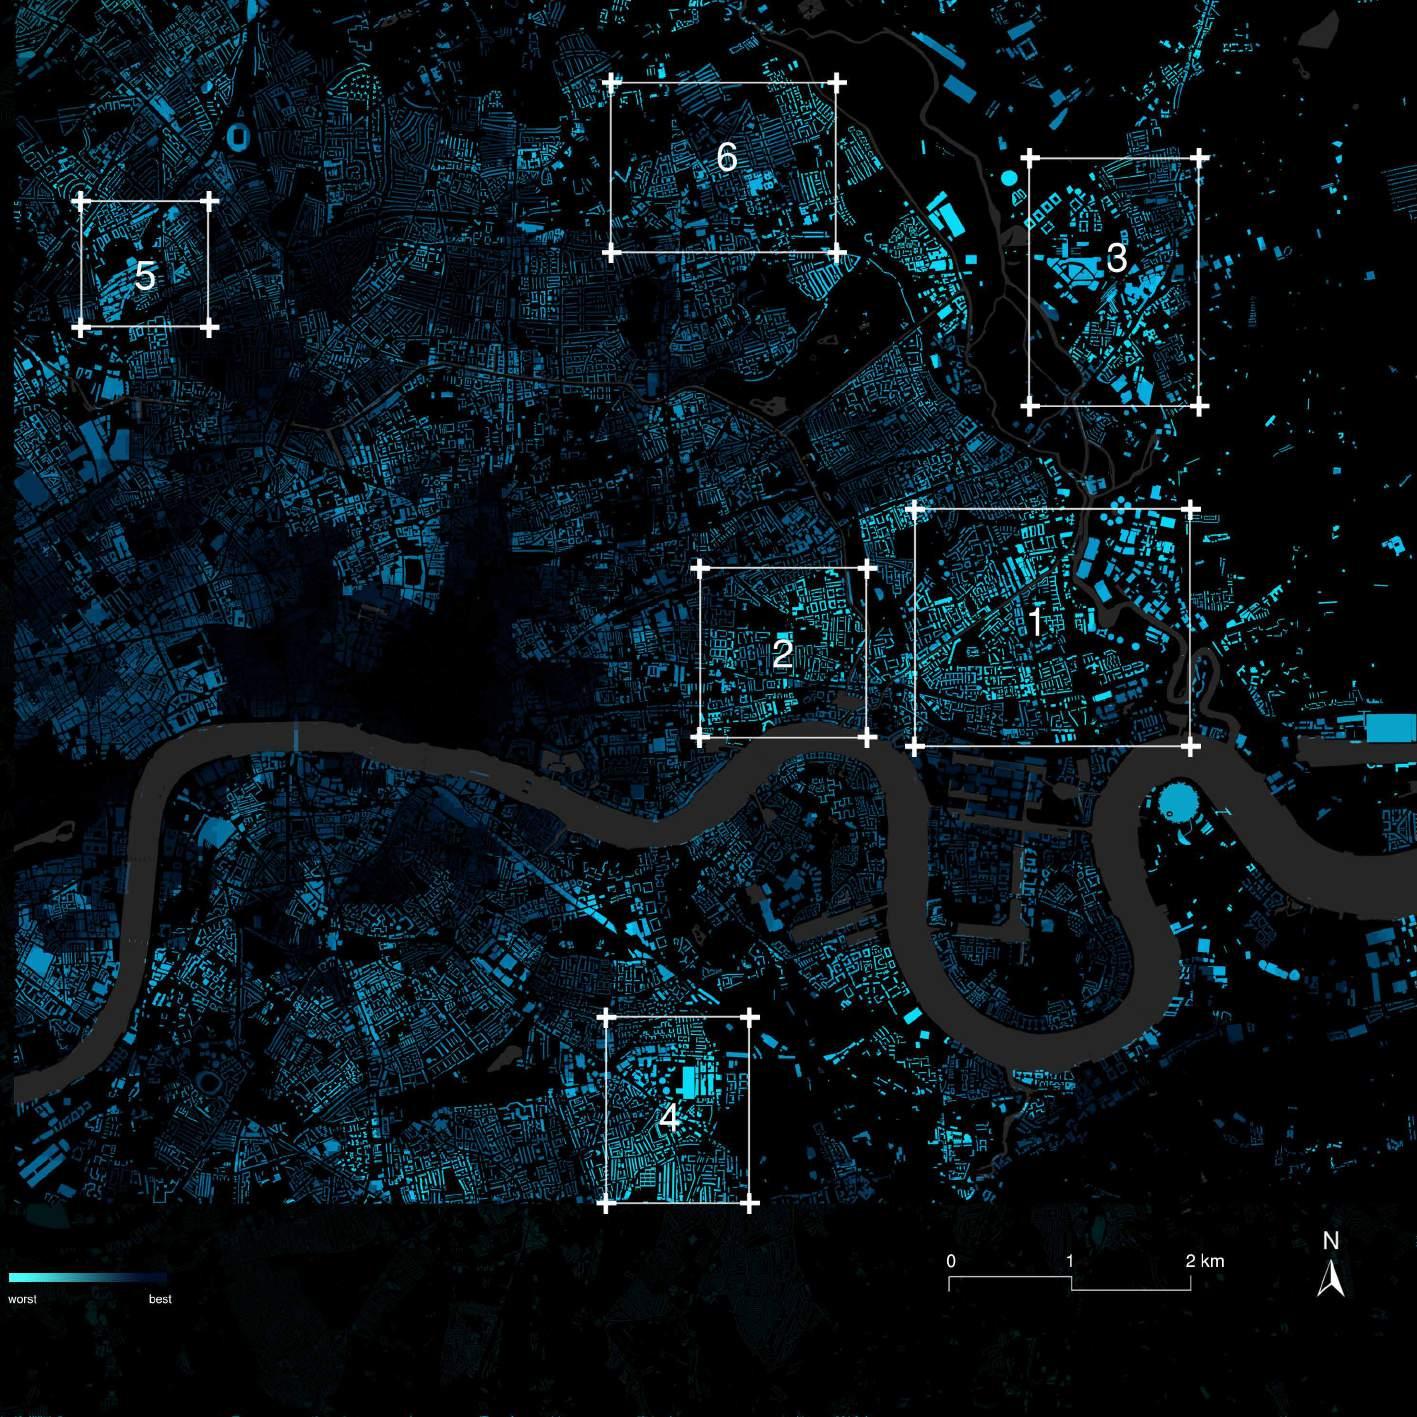
SUITABILITY ANALYSIS | Site Selected by Environment Related Factors
By giving the different weight to data, we score and reclassify the 4 food data and then overlay them to one raster file. We join them to the city base map and finalize our initial design site as the square shows.
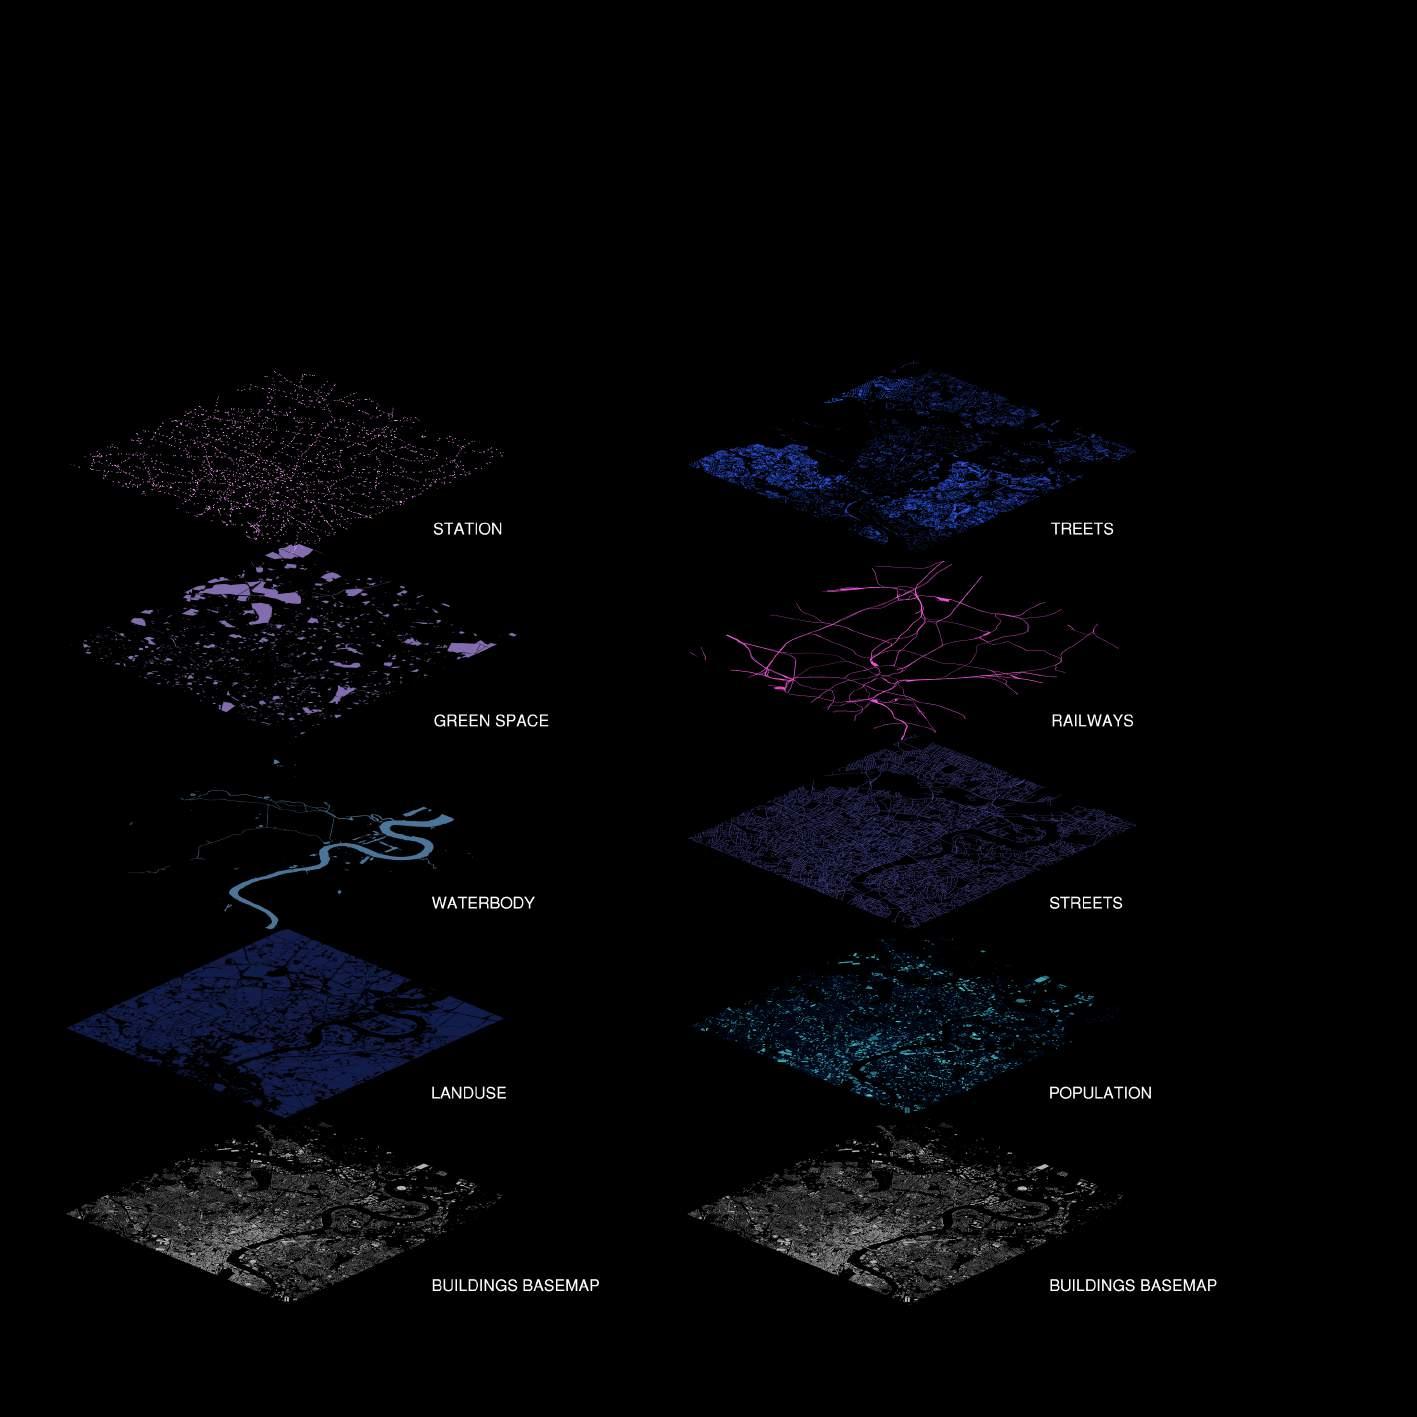
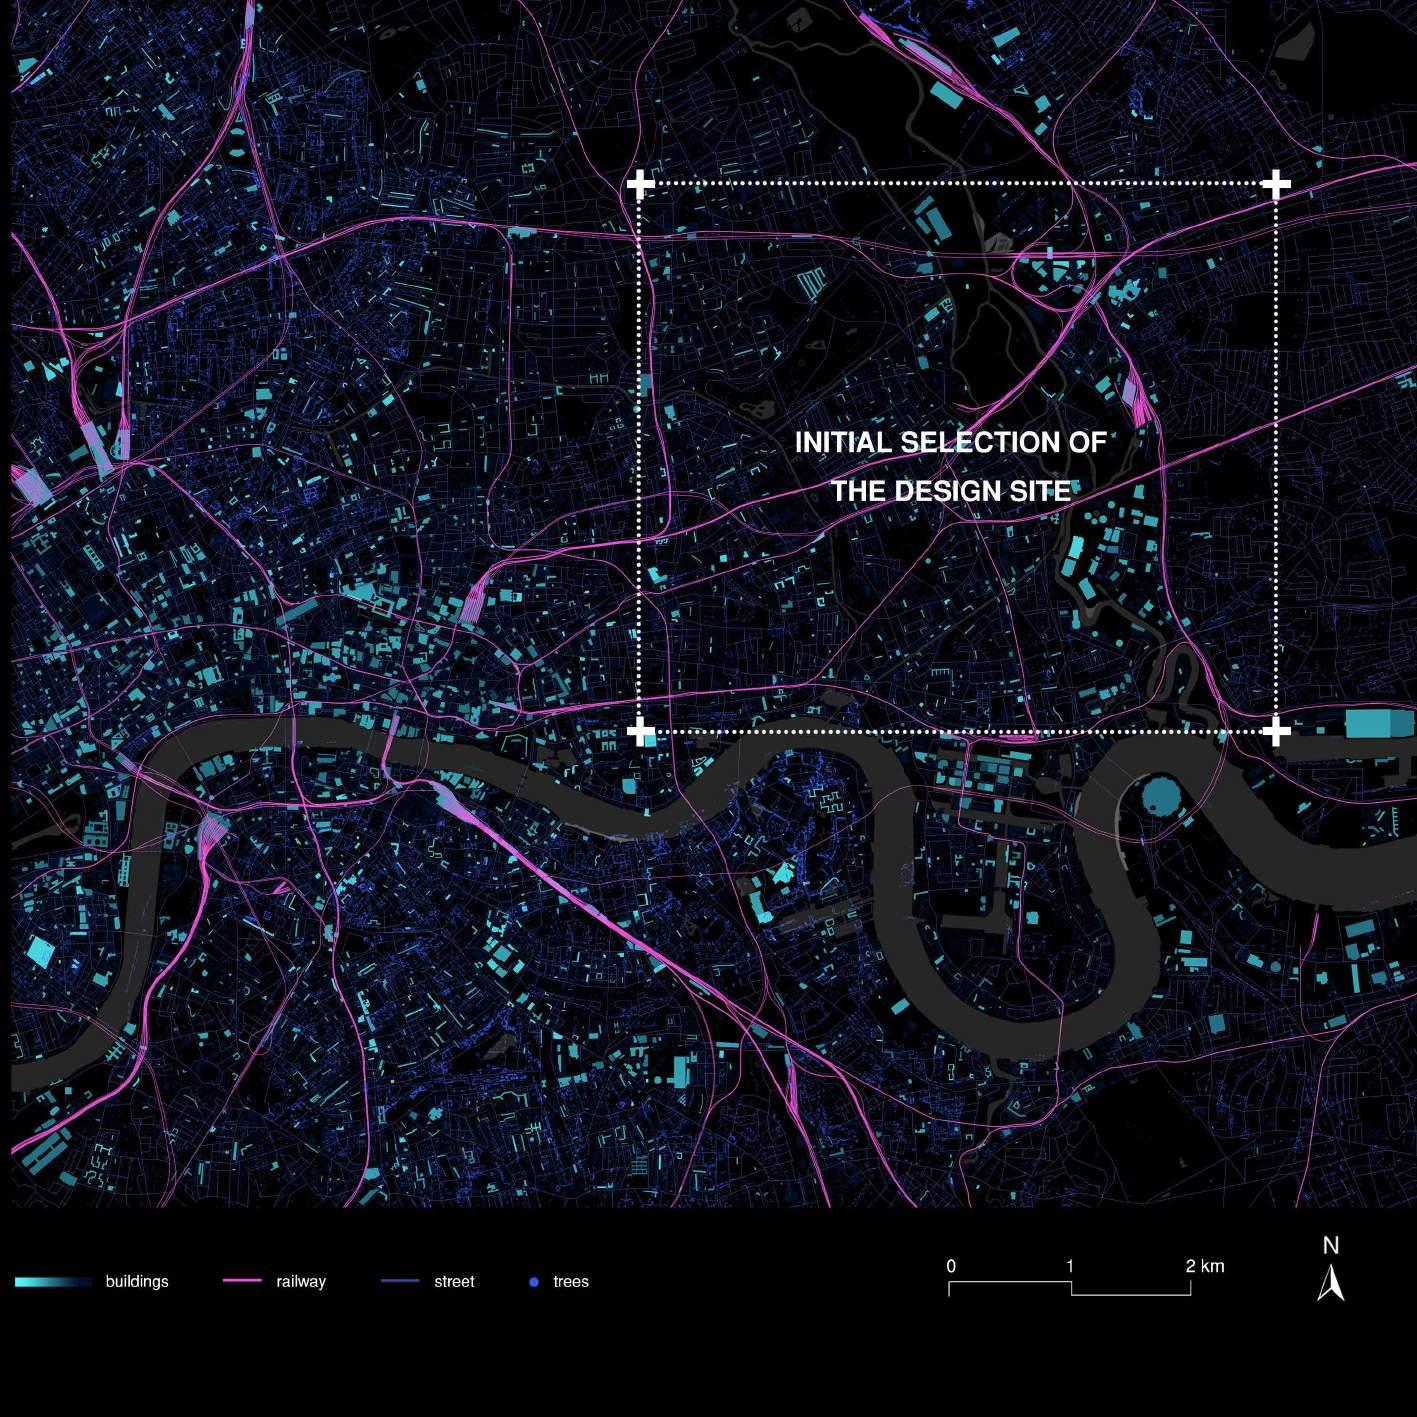
SUITABILITY ANALYSIS | Environment Dataset Visulization
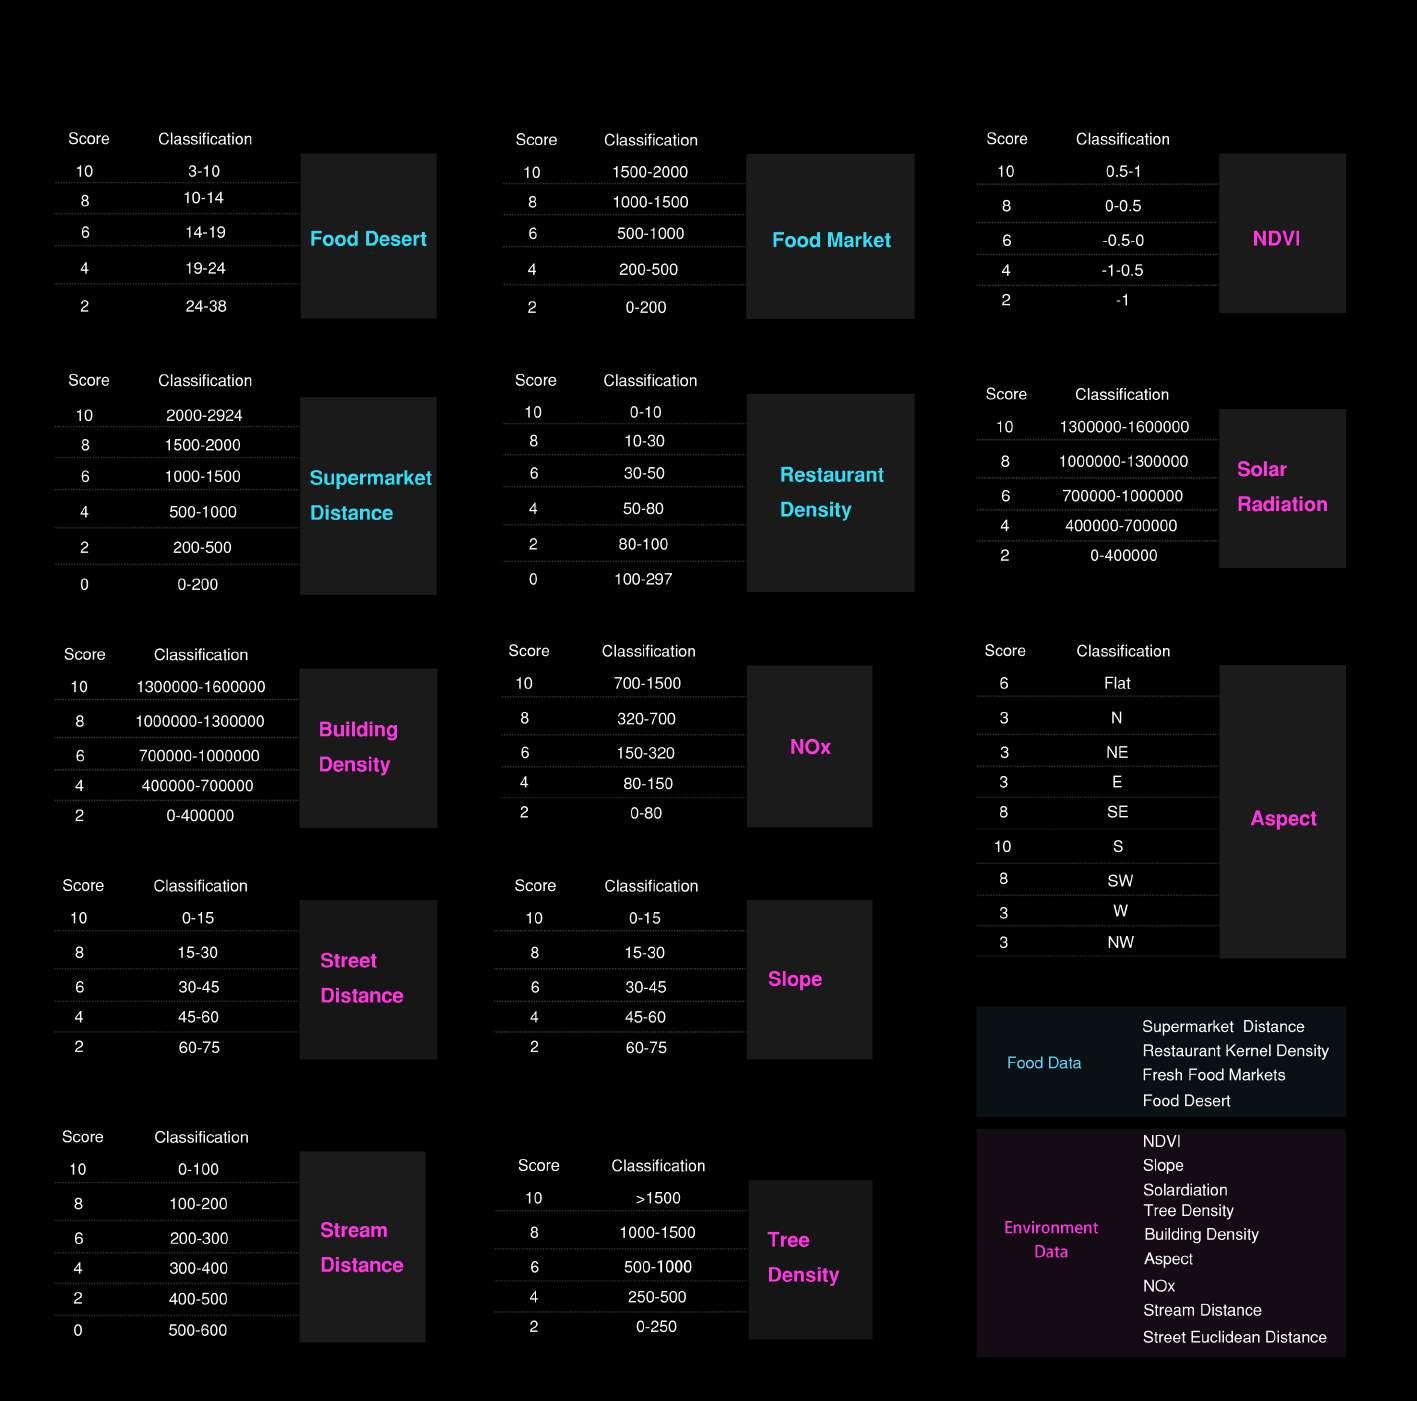
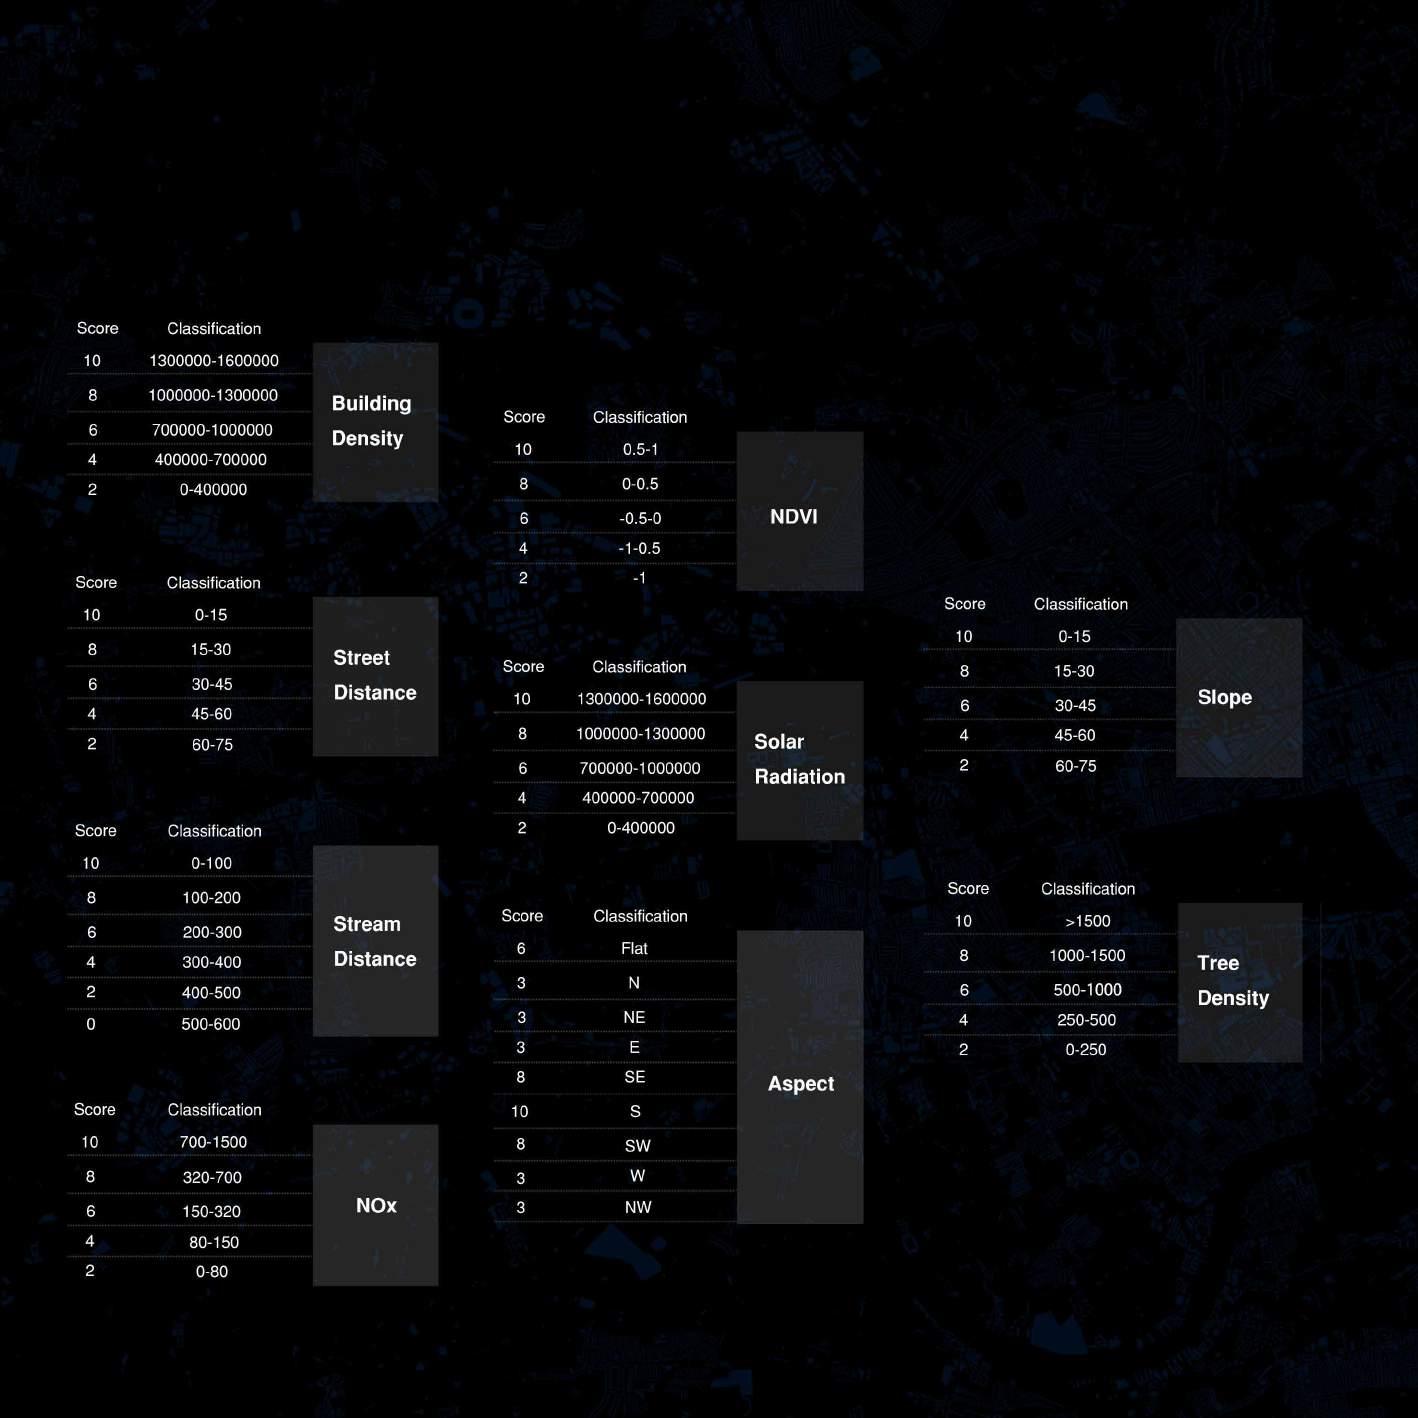
Environment data include 9 crucial factors: Slope, Stream Distance, Building Density, Solar Radiation, NDVI, Tree Density, Street Distance, Aspect, NOX. We use different method to deal with the data according to their types like kernel density, point density, euclidean distance etc.
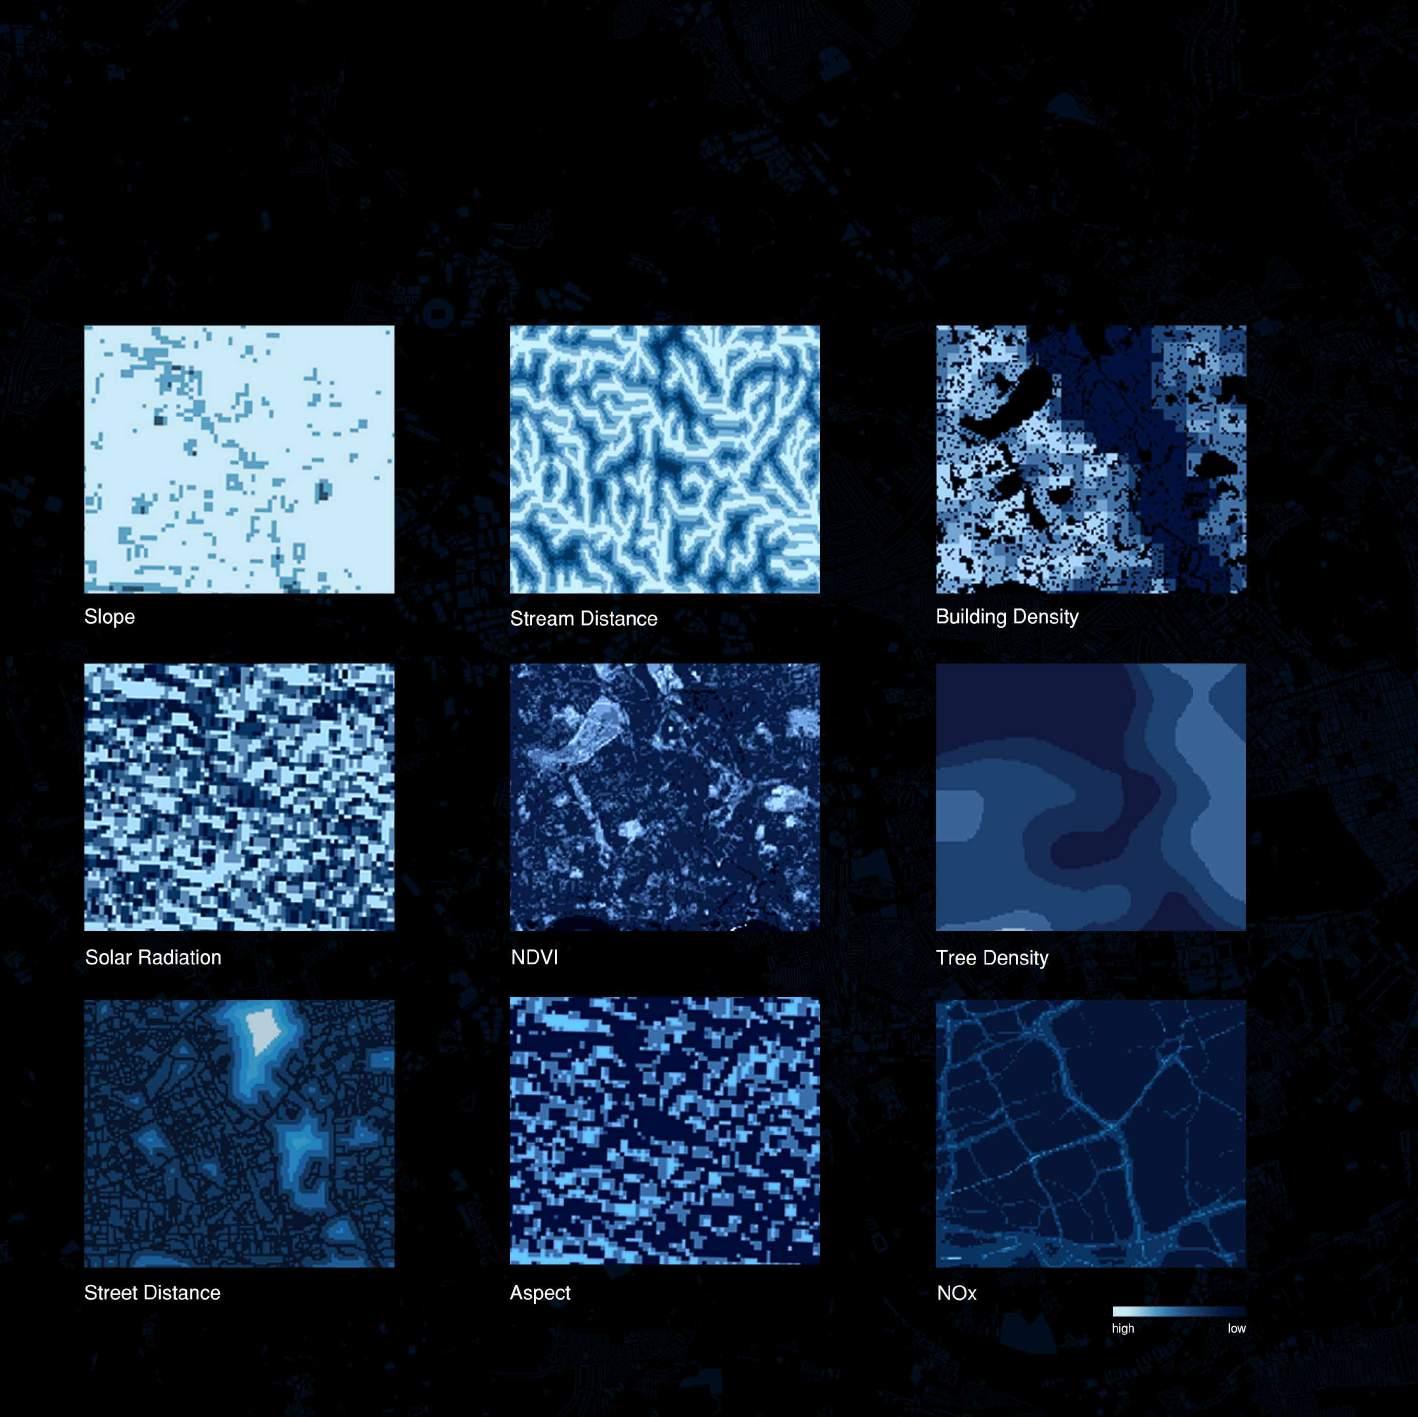
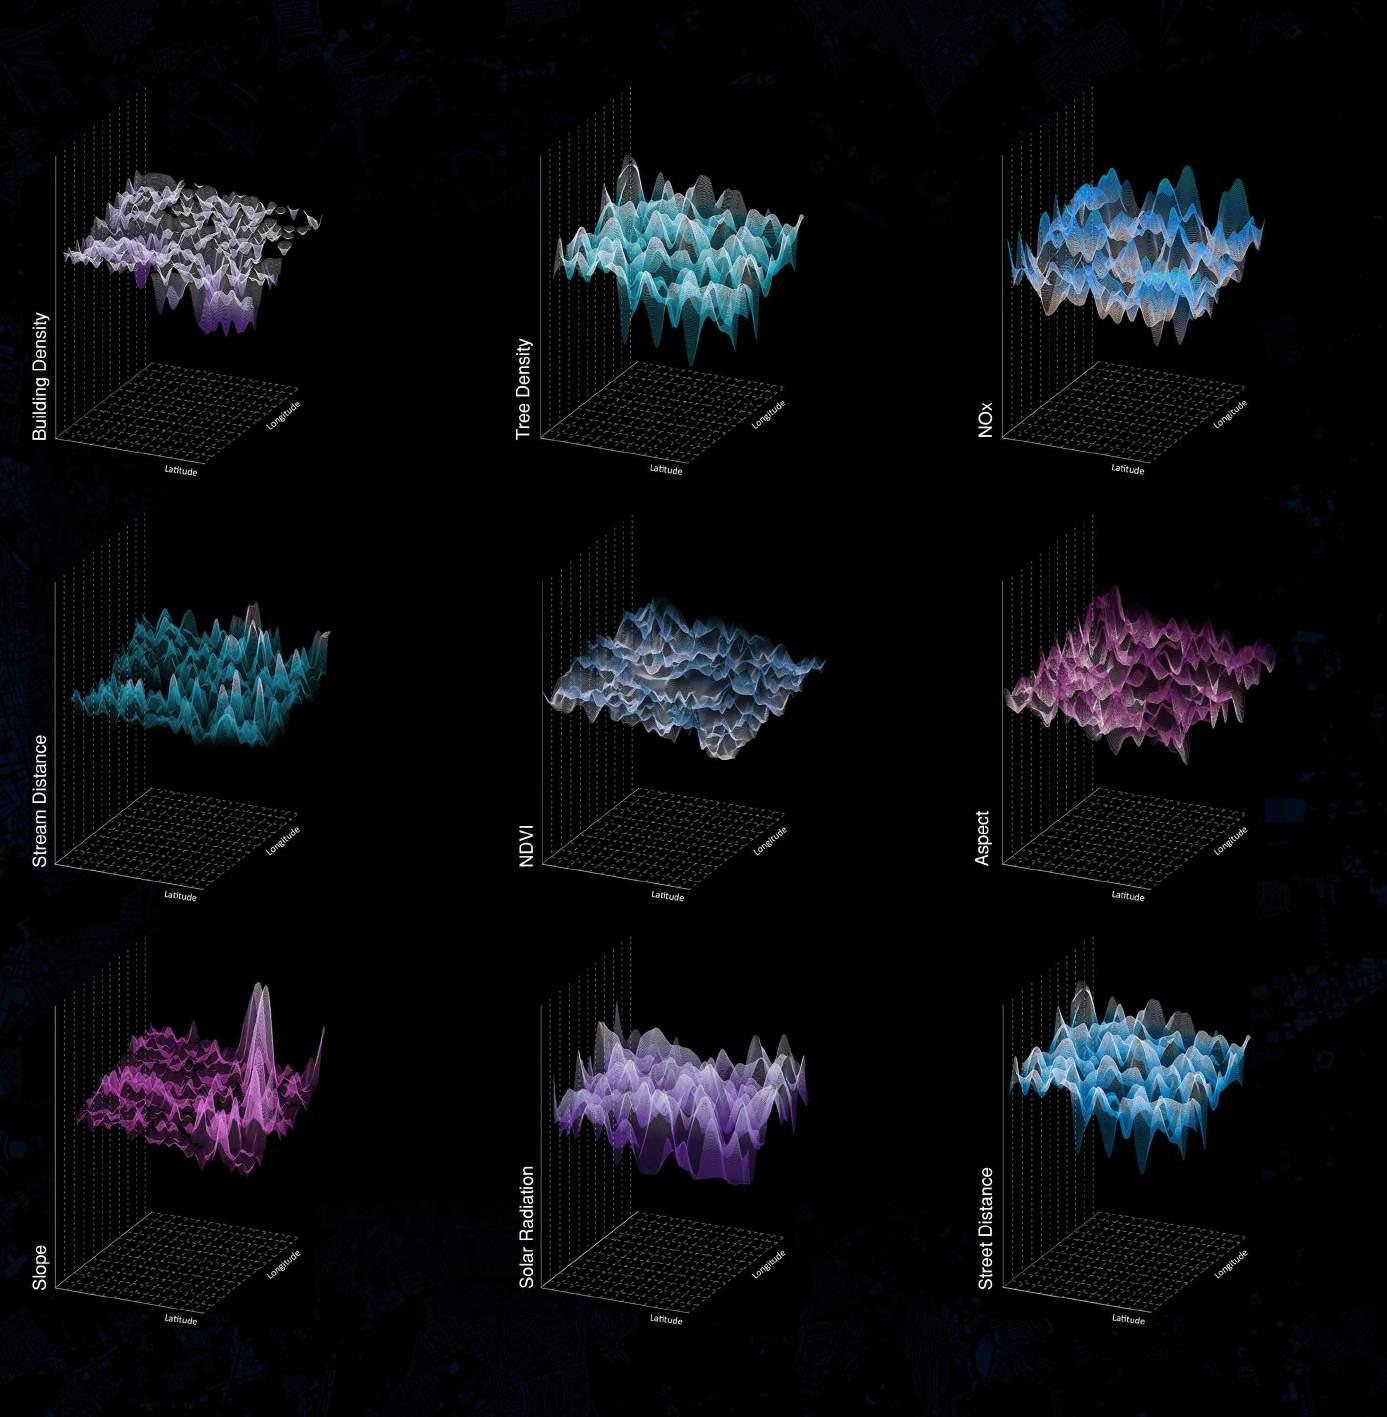
SUITABILITY ANALYSIS | Supervised Classification and Score
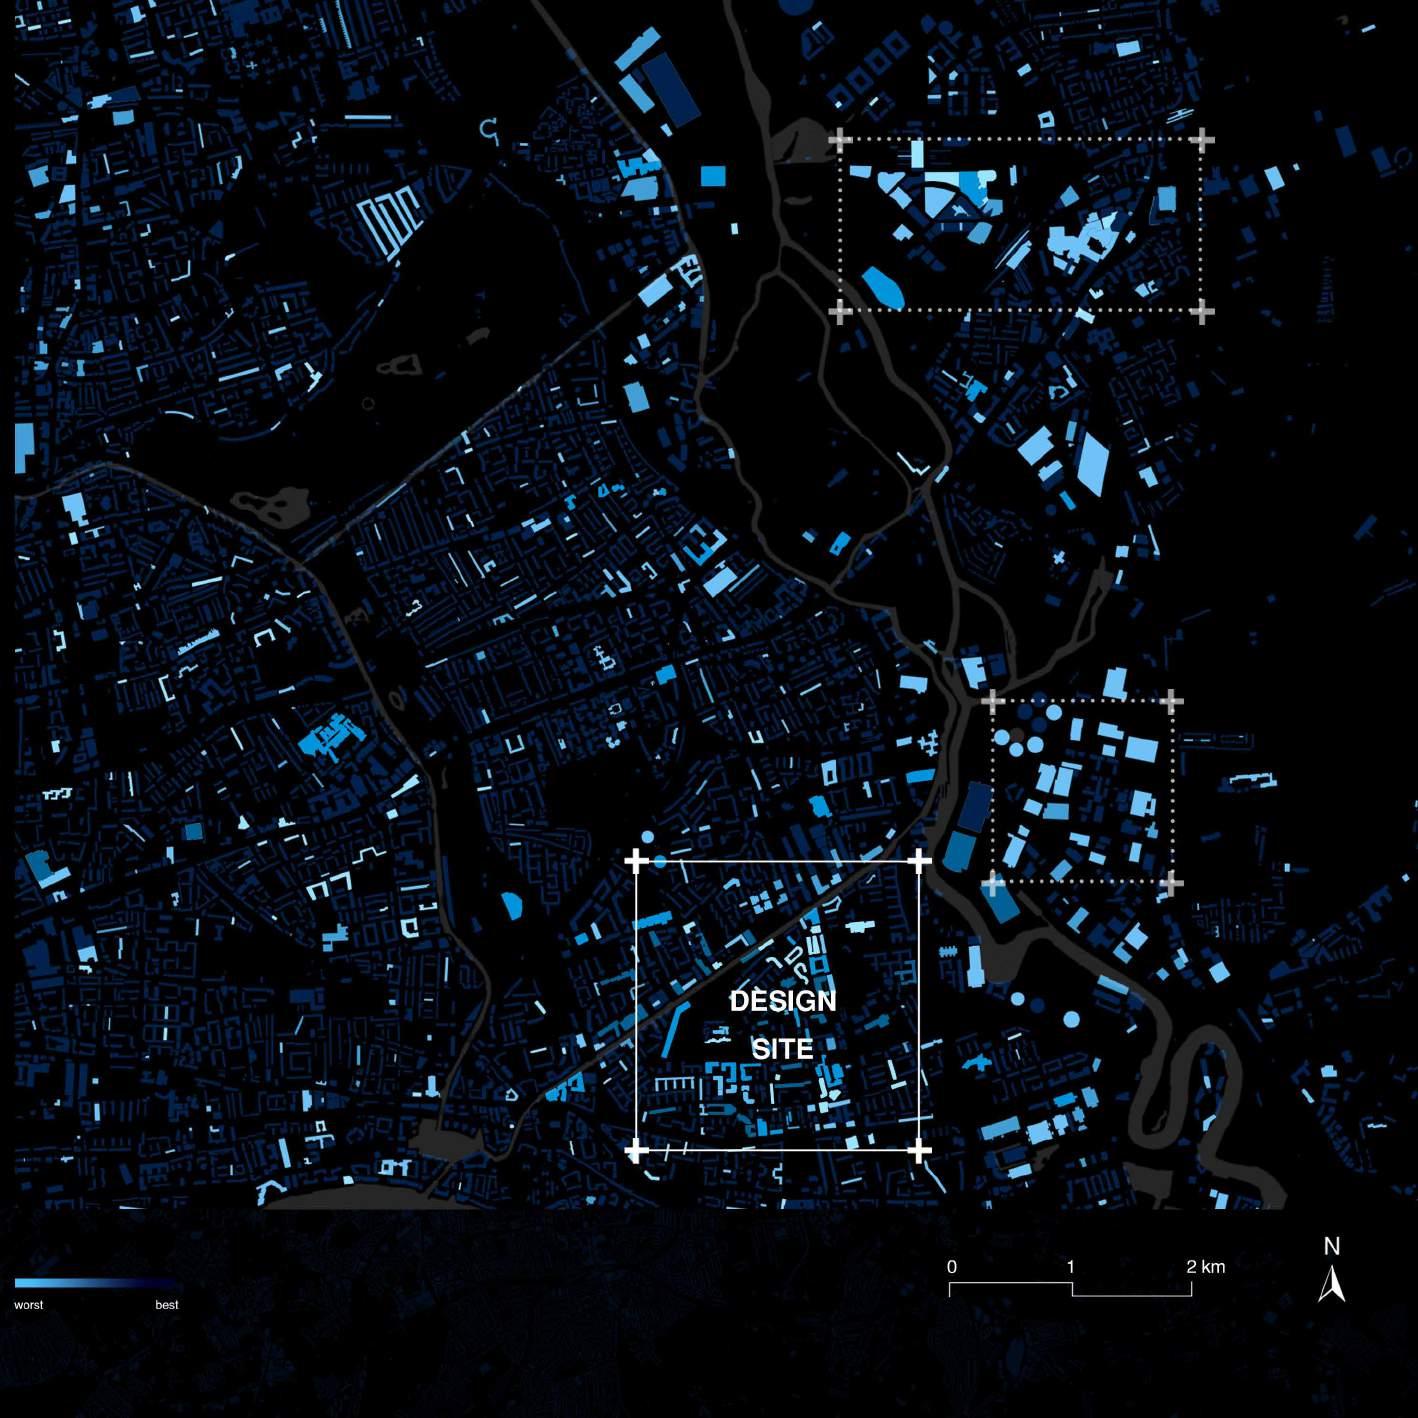
By giving the different weight to data, we score and reclassify the 9 environment data and then overlay them to one raster file. To make the result more tangible we join them to the city base map and finalize our site as the square shows.

DATA CROSSING ANALYSIS [PART THREE]
This part shows some special machine learning result to analyse and redefine the space of our site.

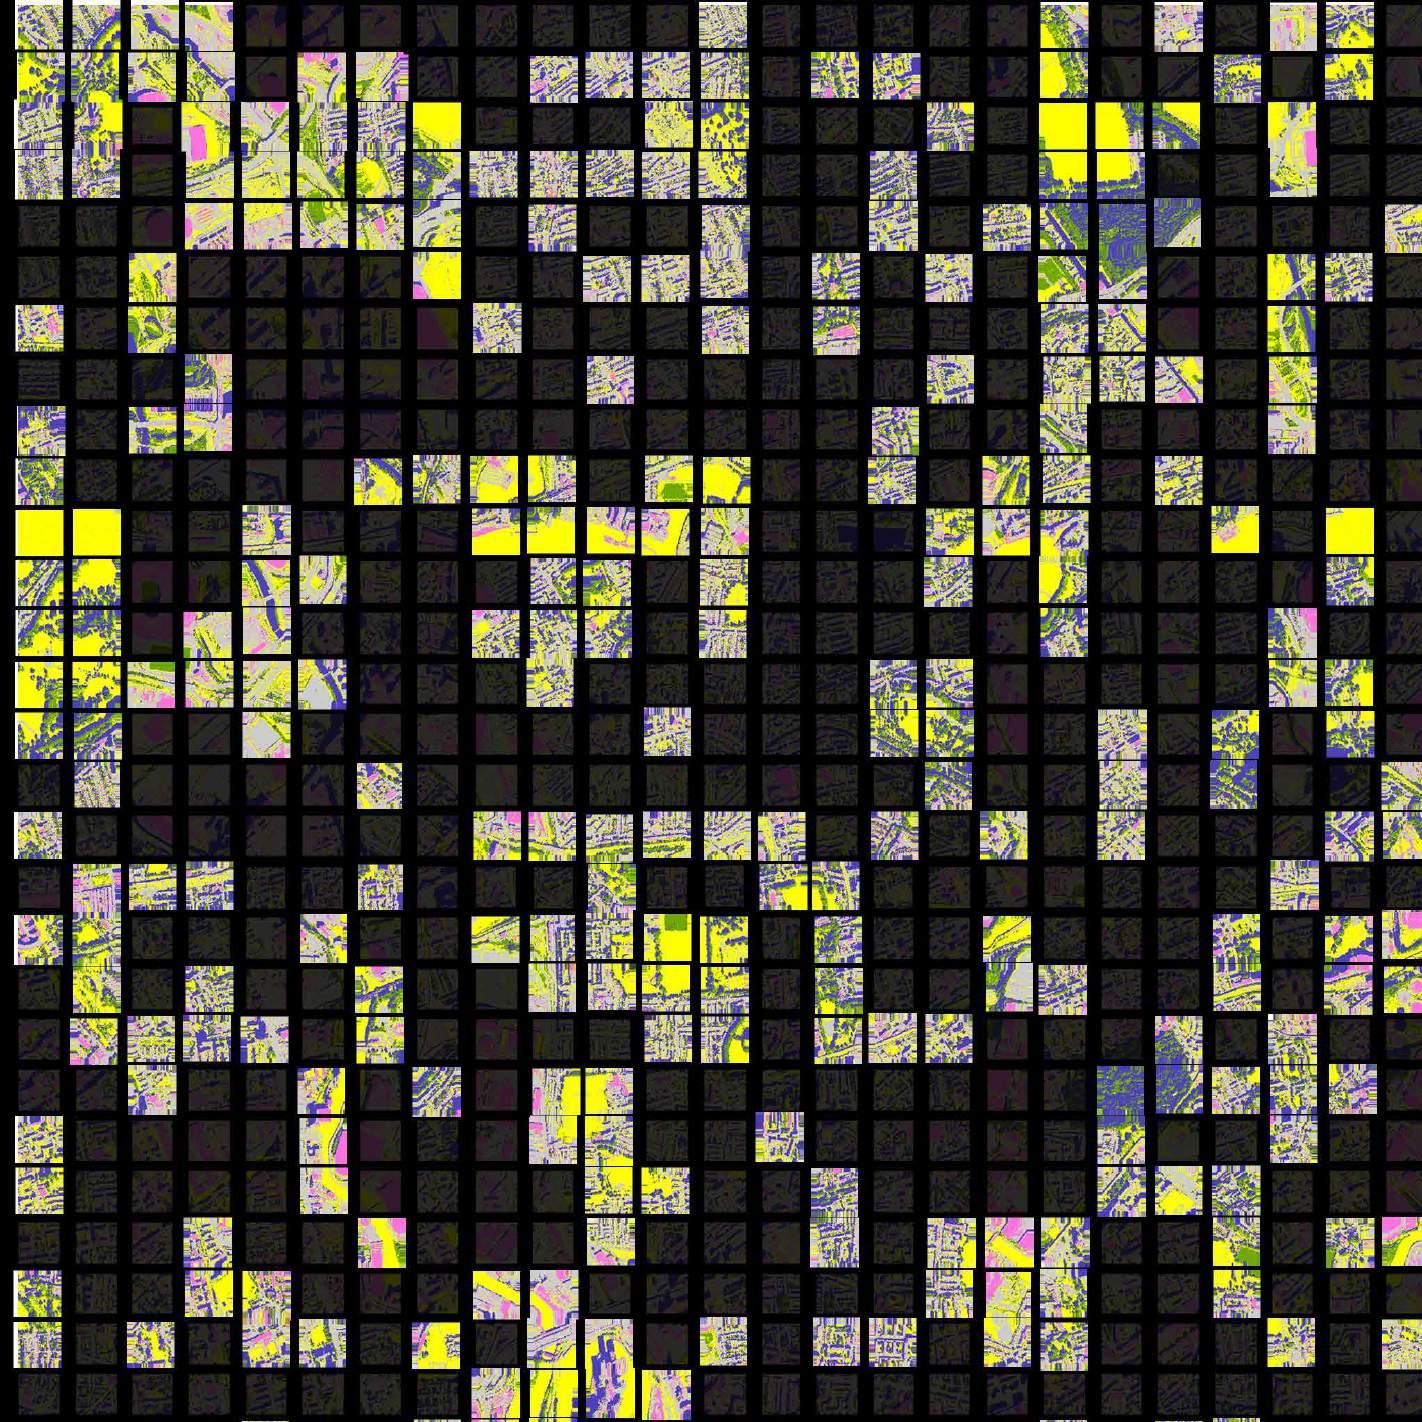
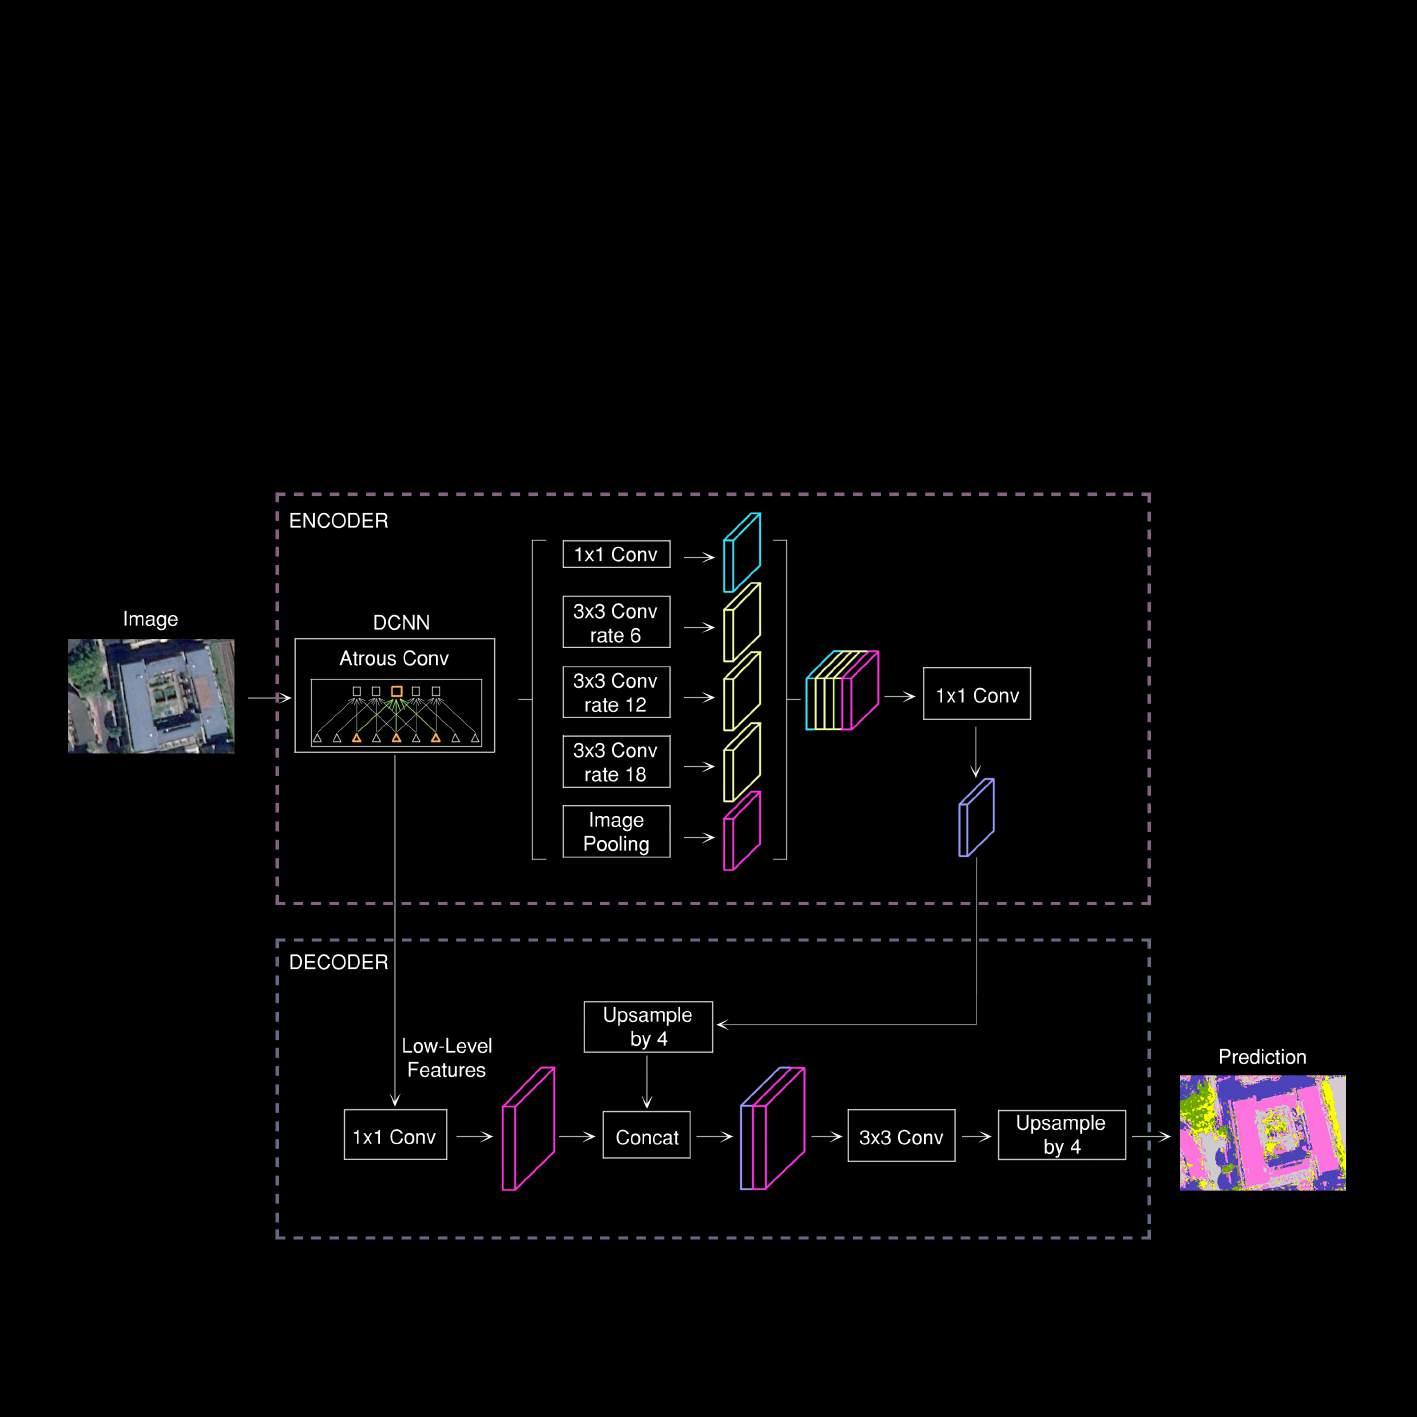
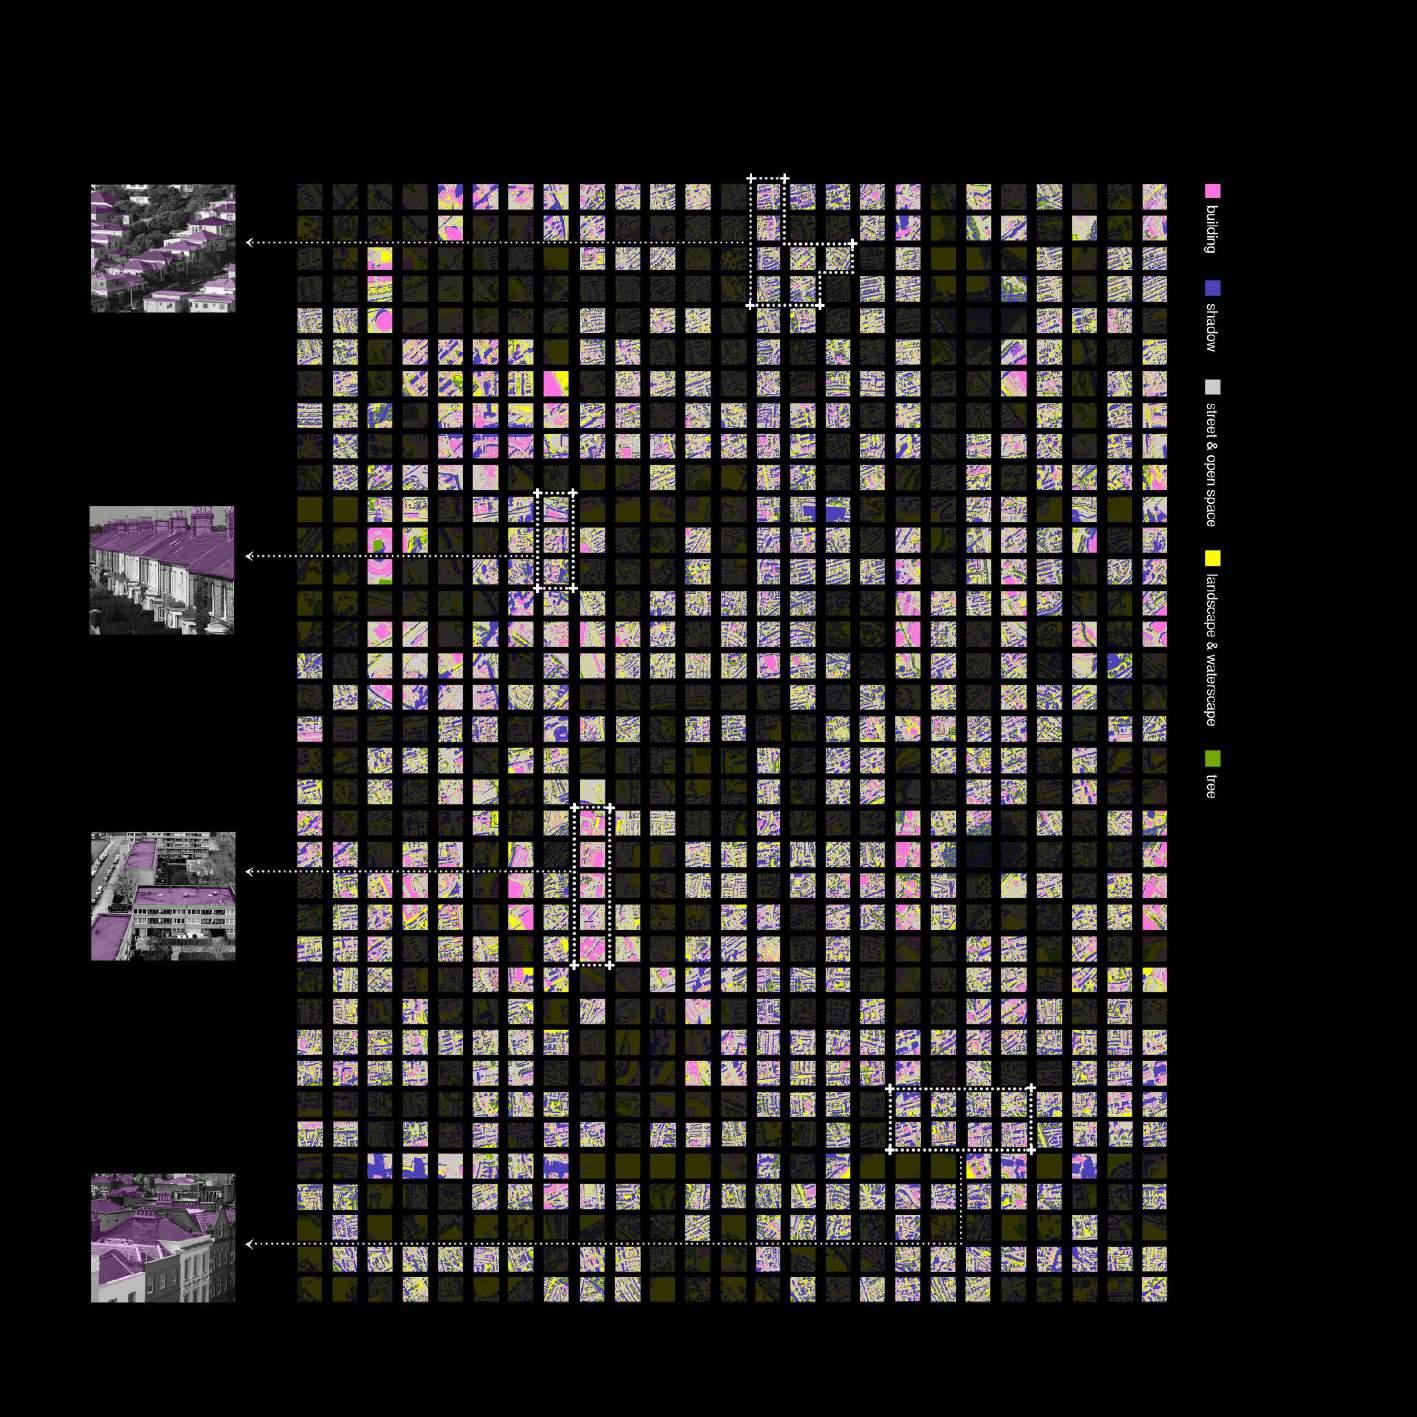
MICRO-SCALE ANALYSIS | Satellite Image Segmentation for Roof and On-Ground
MICRO-SCALE ANALYSIS | Method of Satellite Image Segmentation
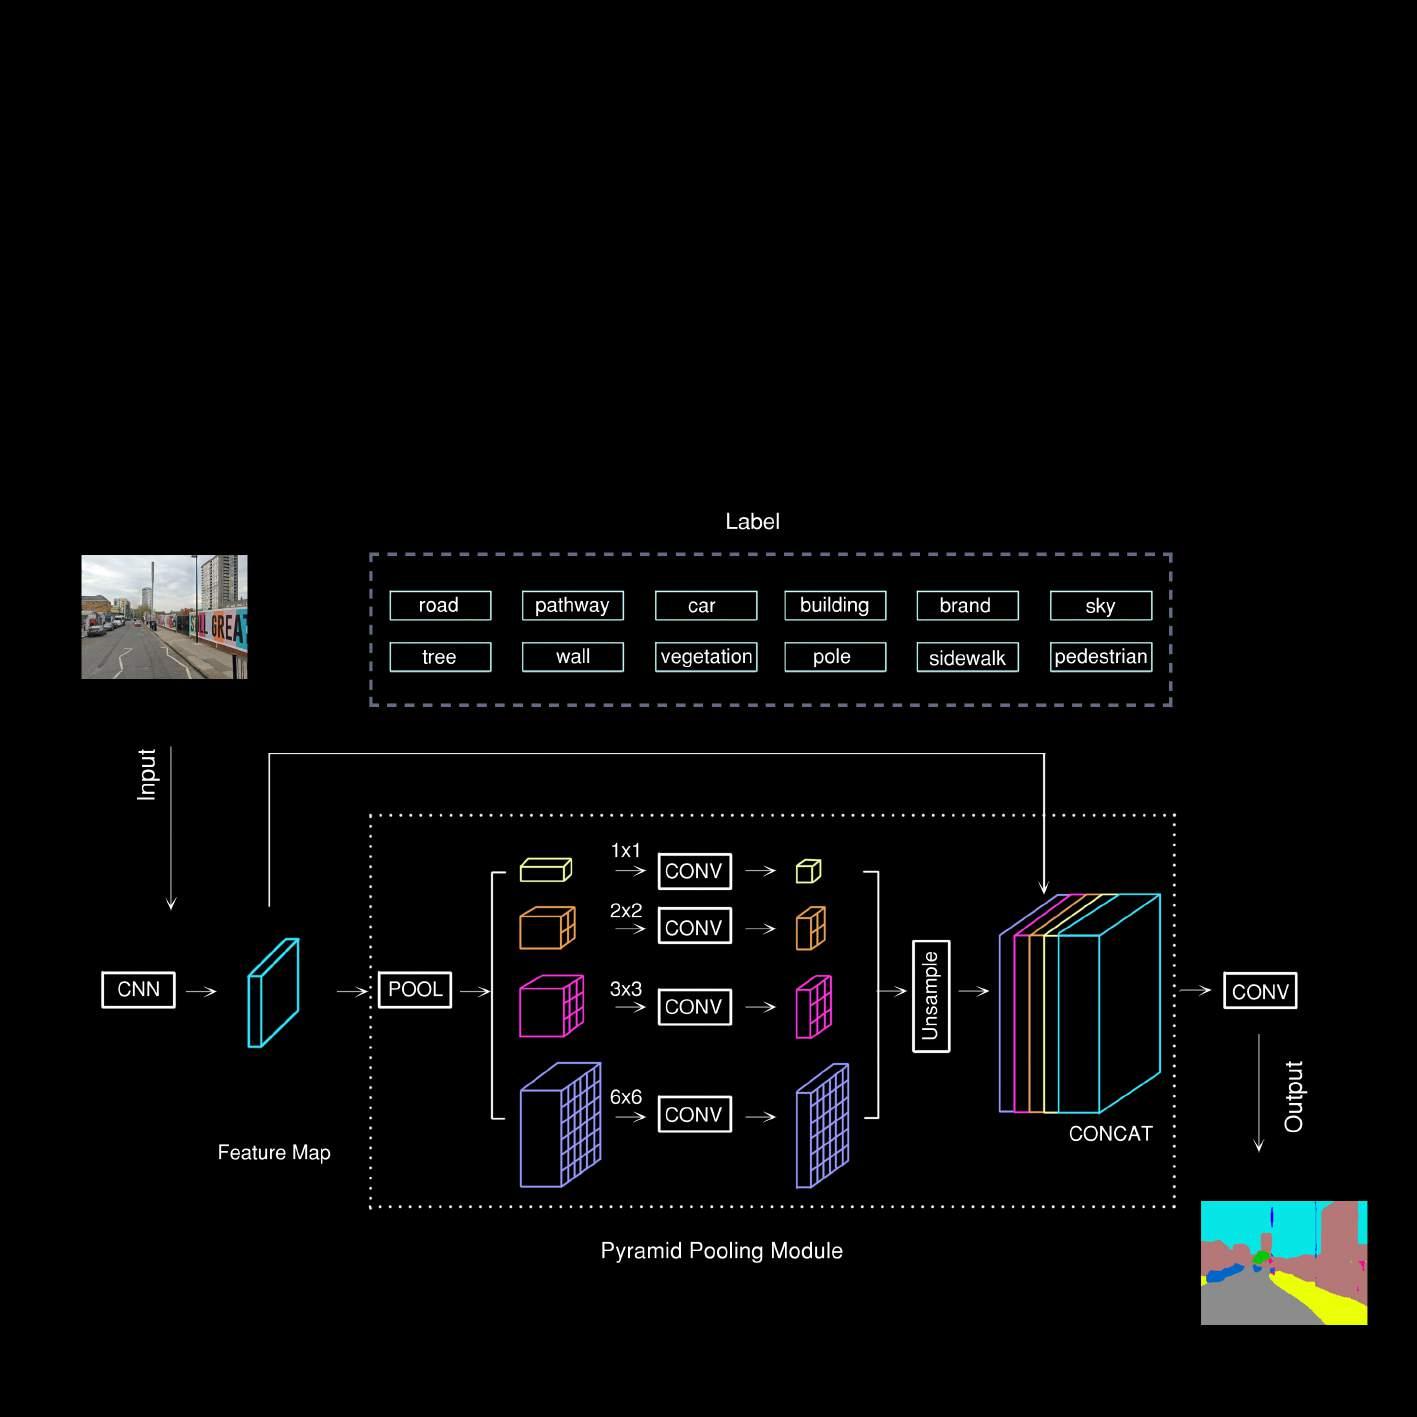
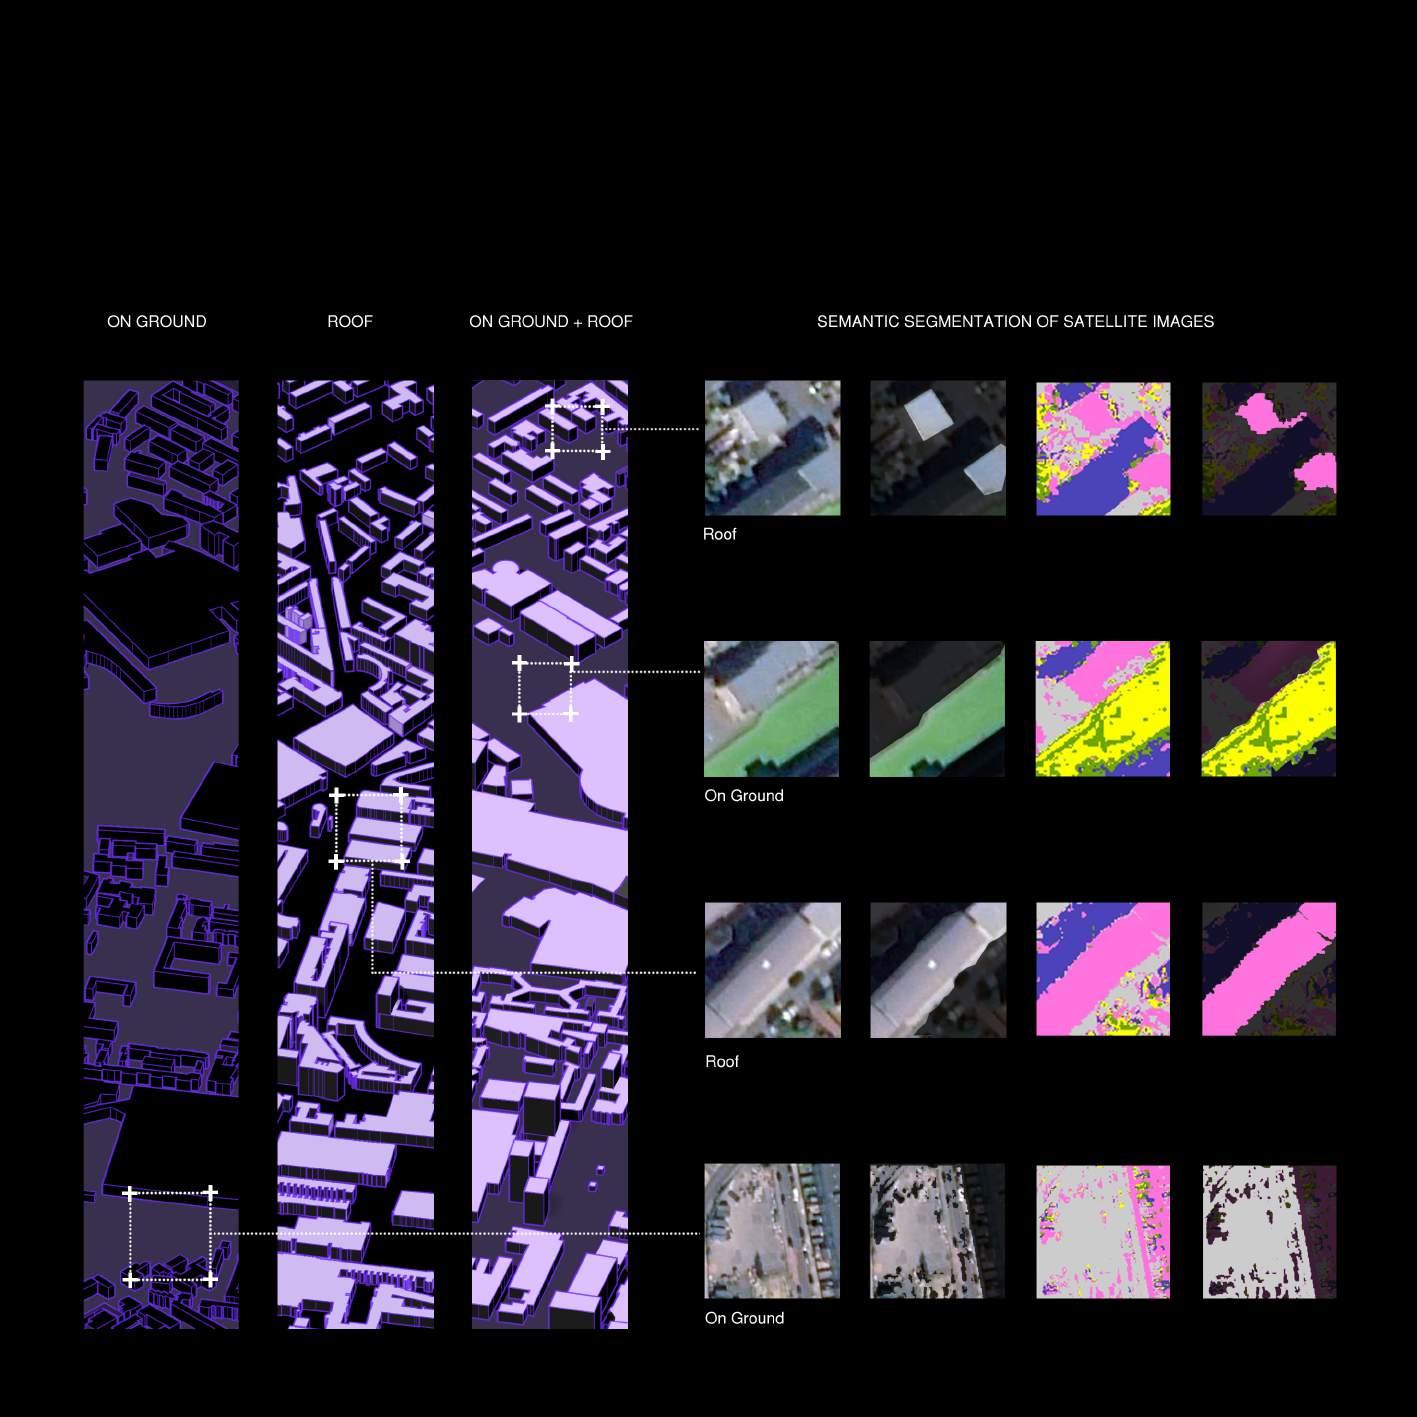
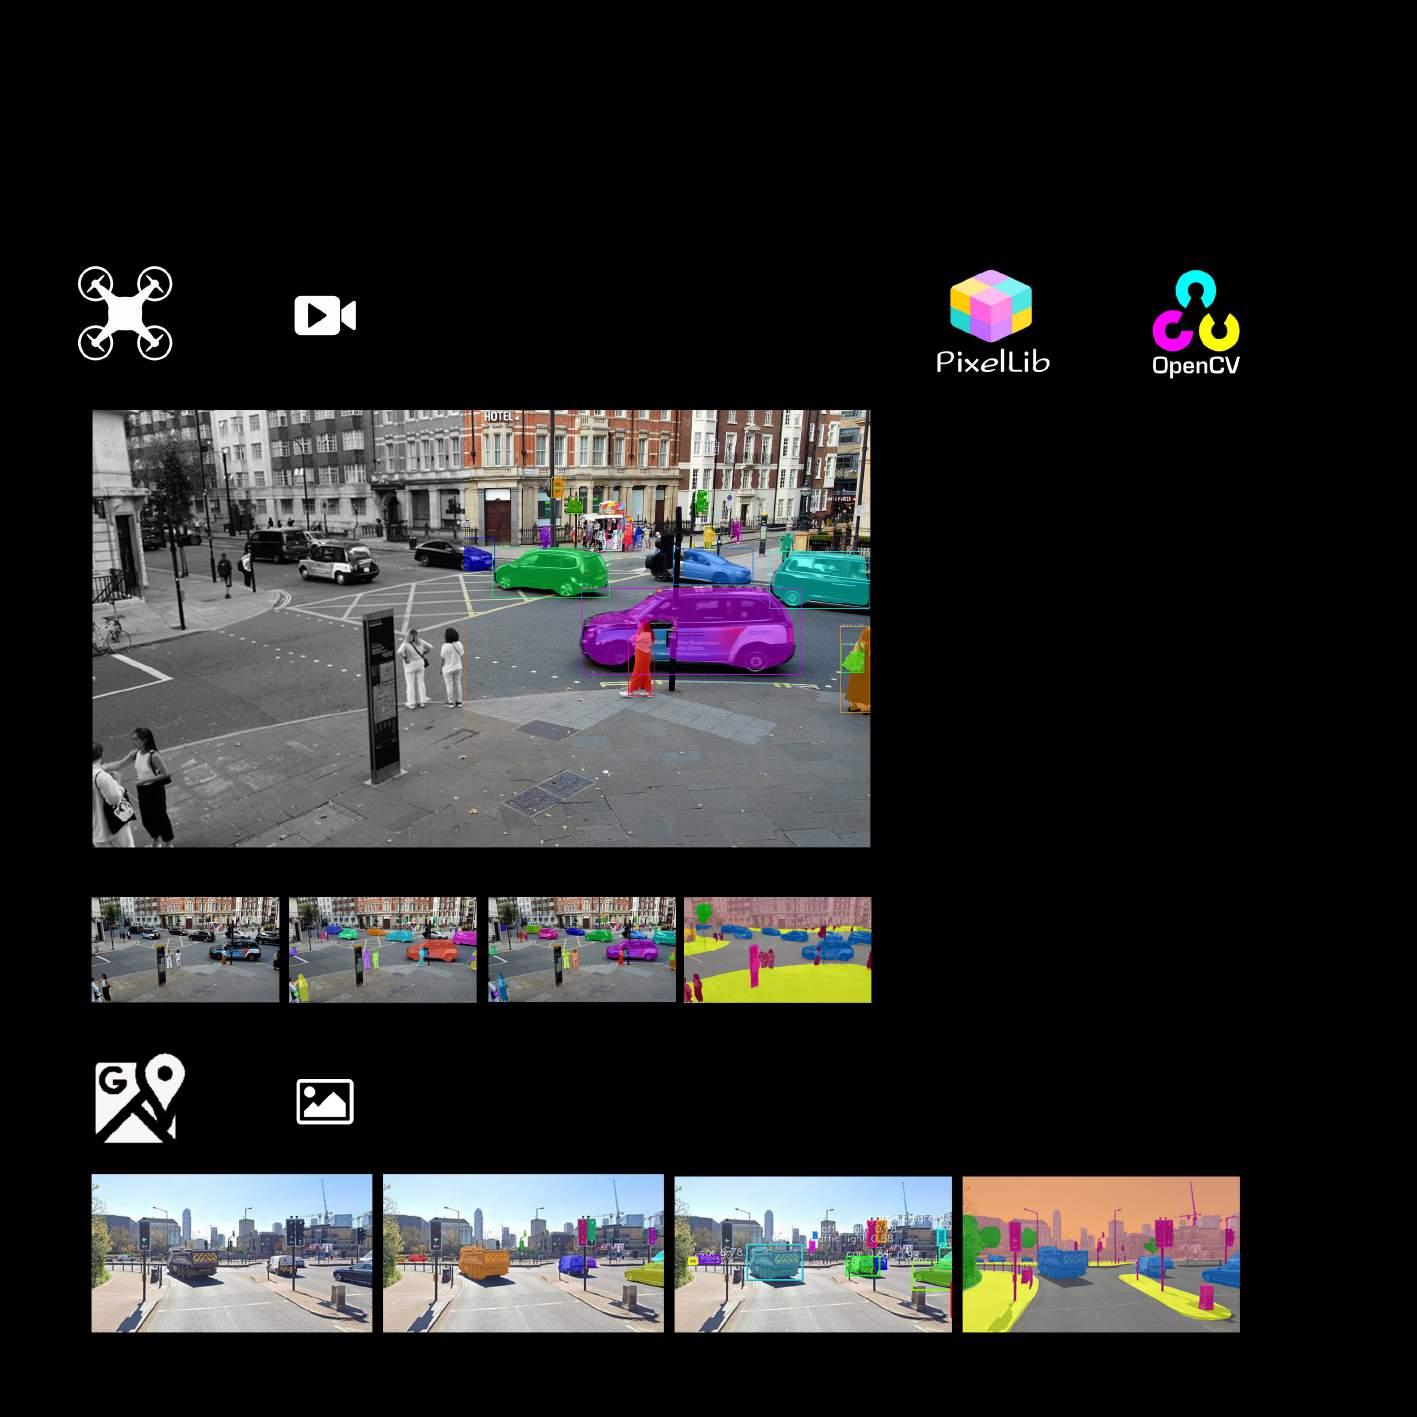
Image semantic segmentation is an important part of machine vision technology regarding image understanding. Semantic segmentation is the process of linking each pixel in an image to a class label. These labels may include buildings, trees, roads, etc. Semantic segmentation enables fast recognition, segmentation and processing of image data. In satellite image analysis, different types of spaces in an image can be automatically identified by training neural networks. The design feasibility of the site is assessed based on its results.
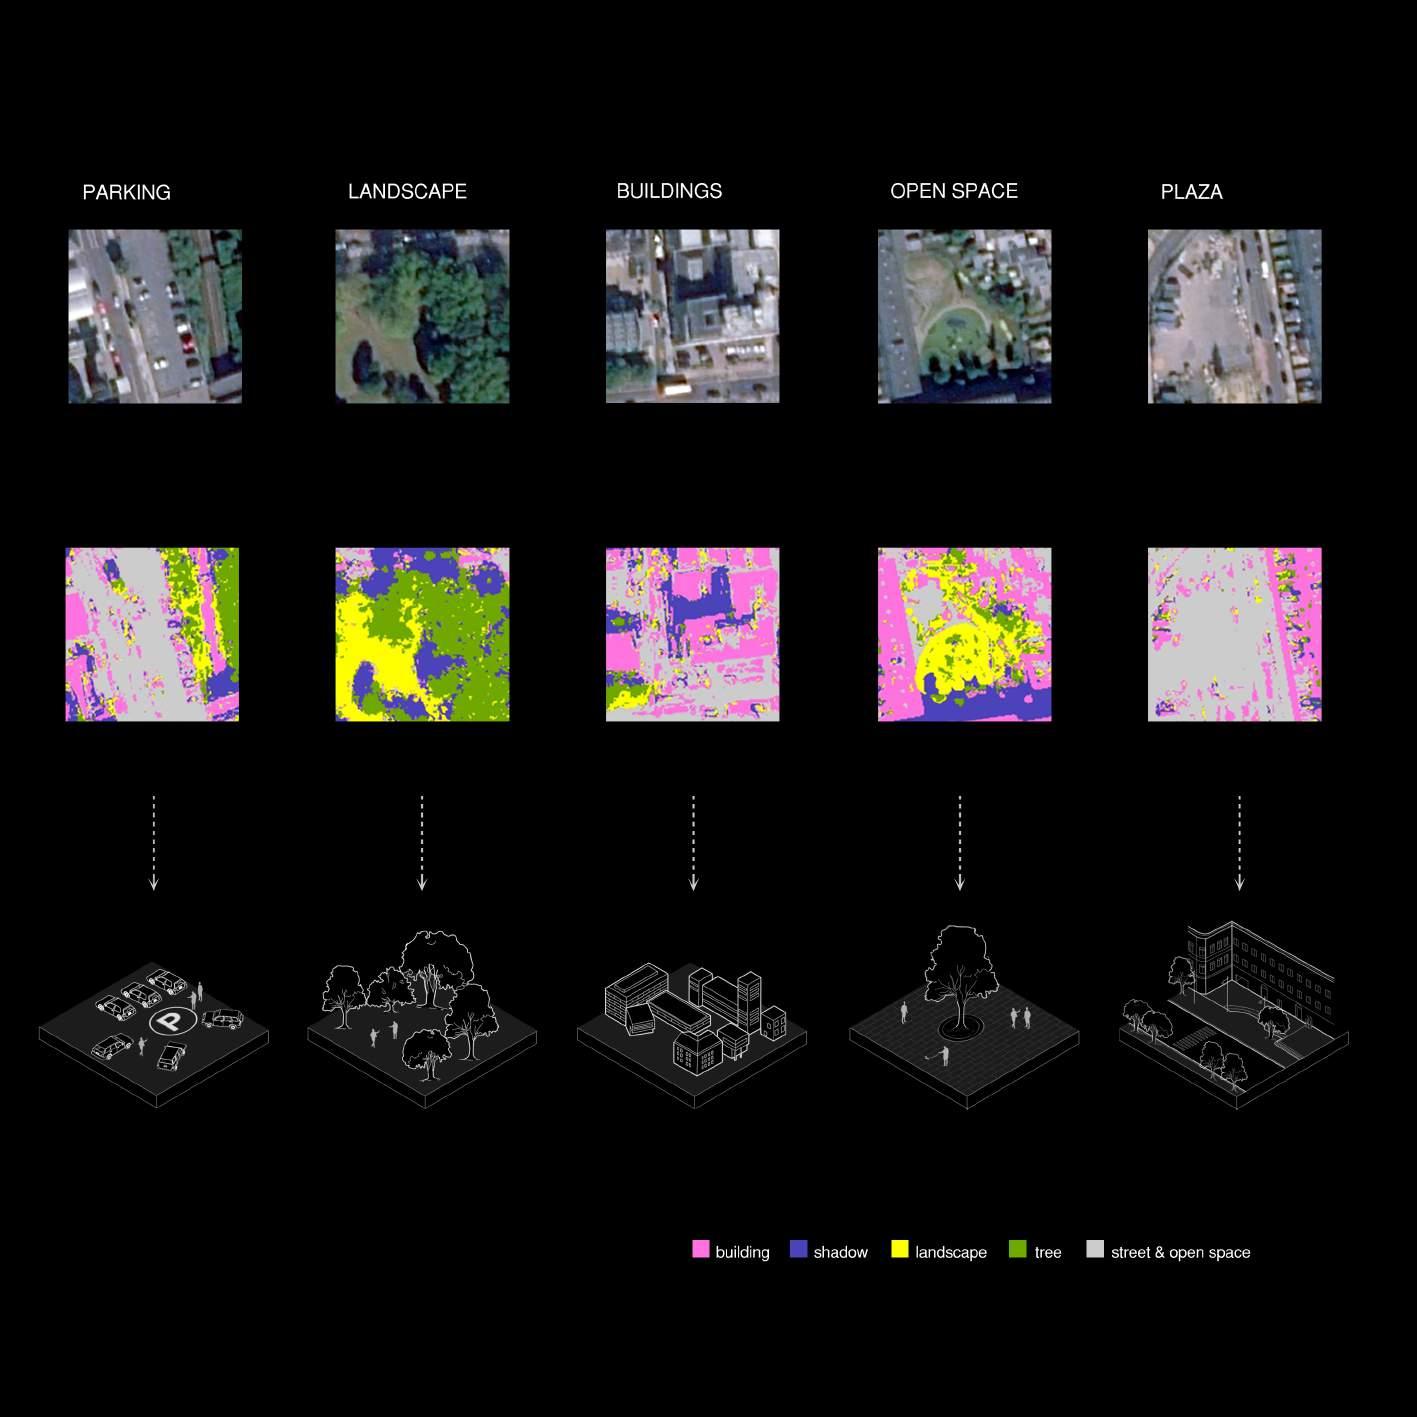
MICRO-SCALE ANALYSIS | The Result for Rood and On-ground
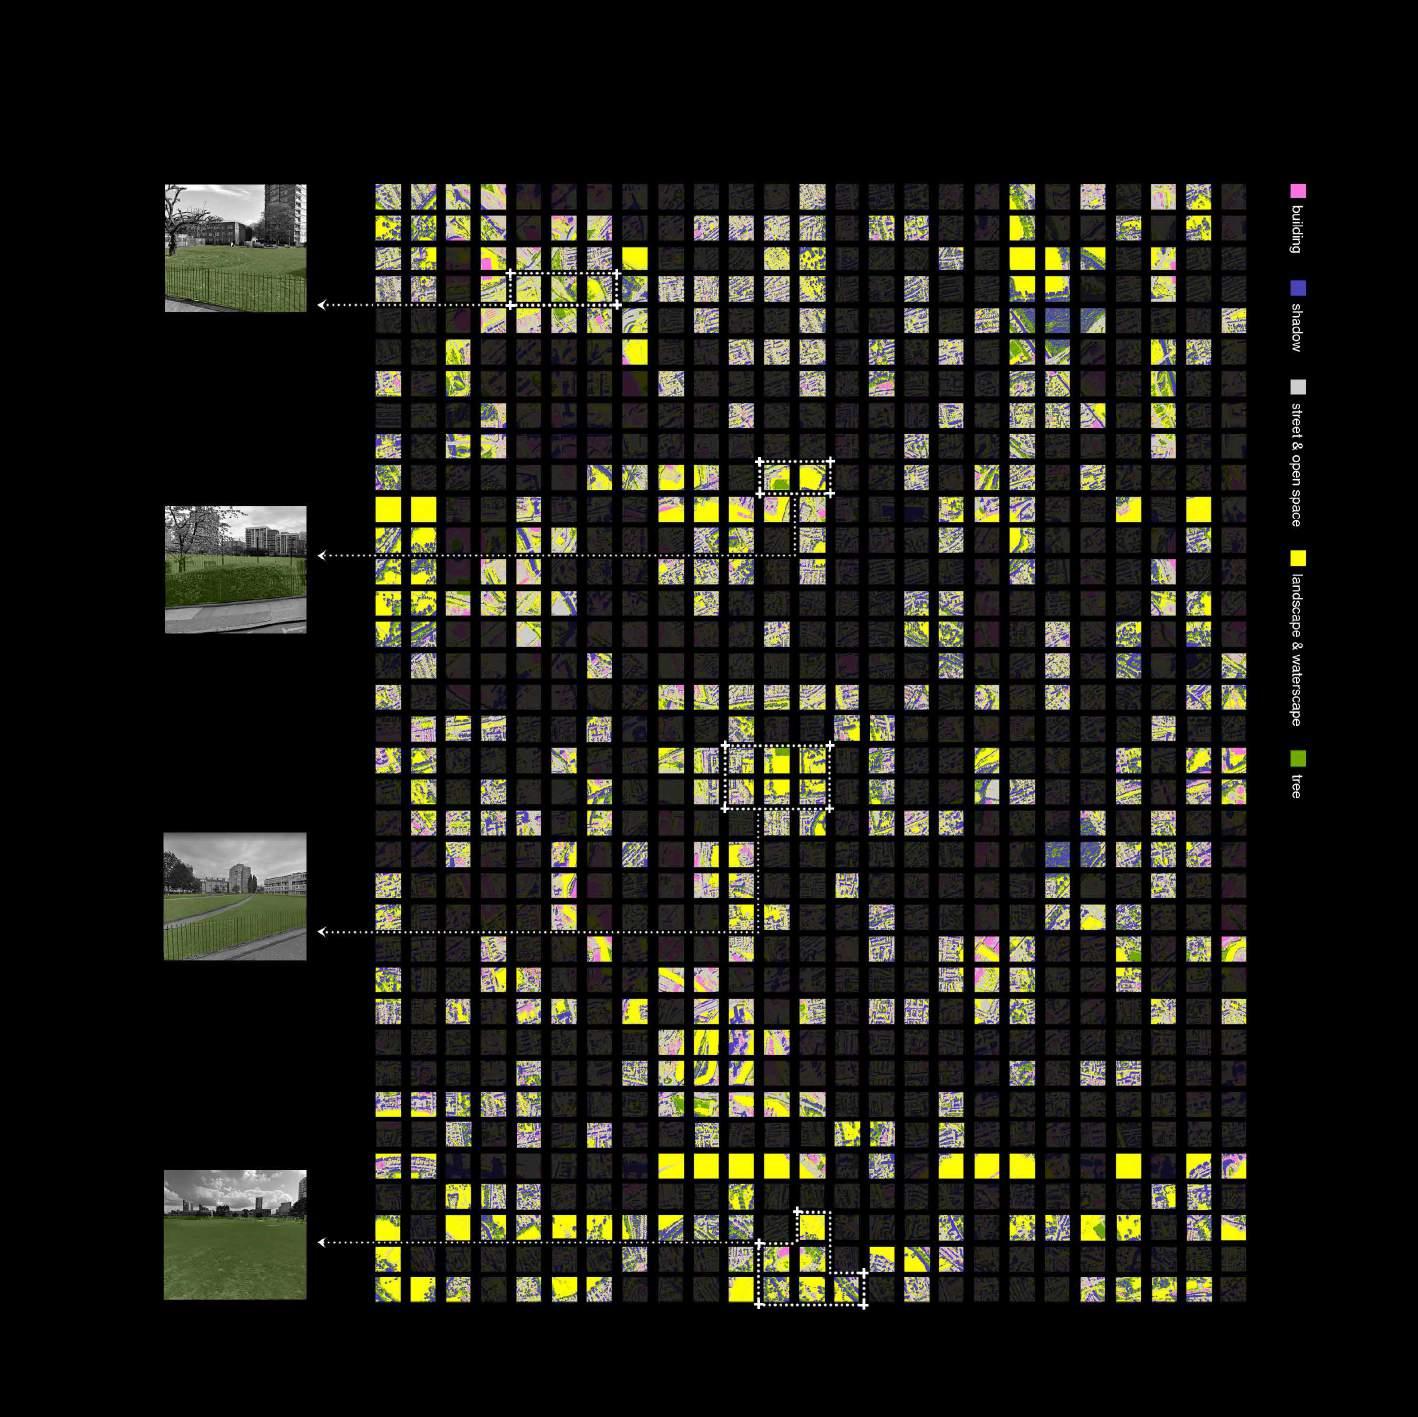
MICRO-SCALE ANALYSIS | Google Street View for Vertical Analysis
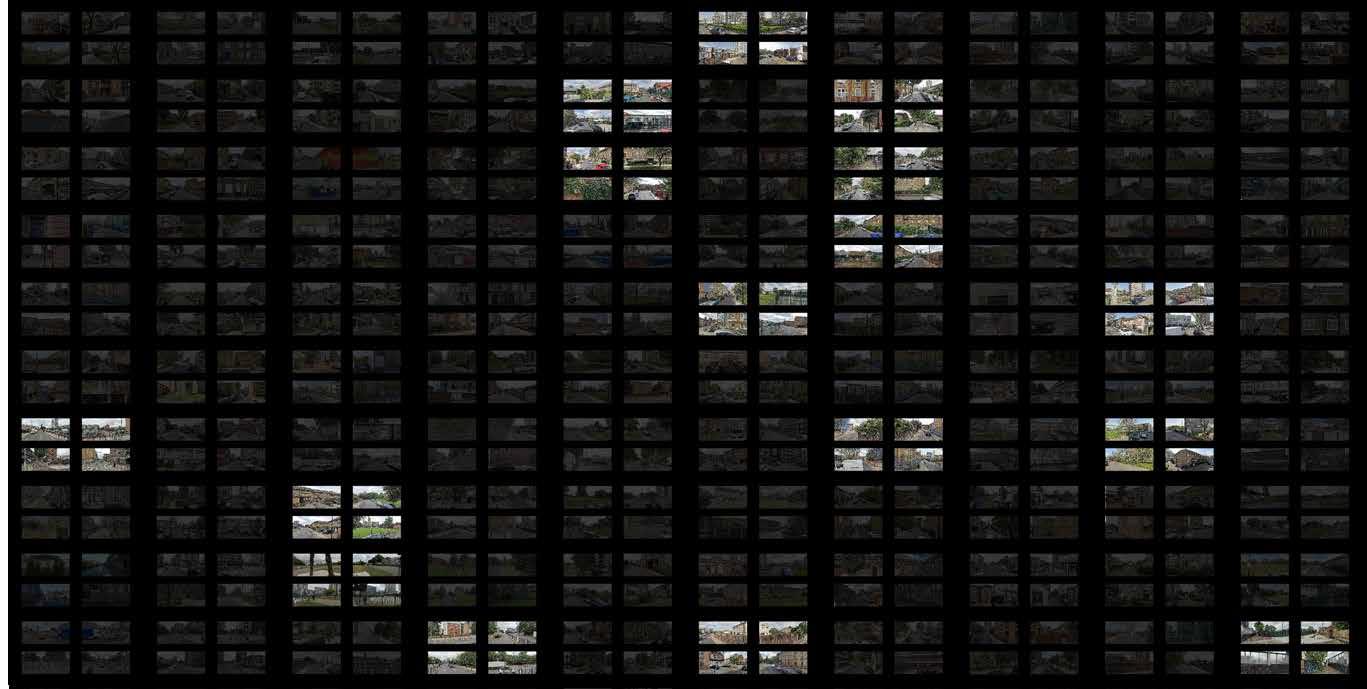
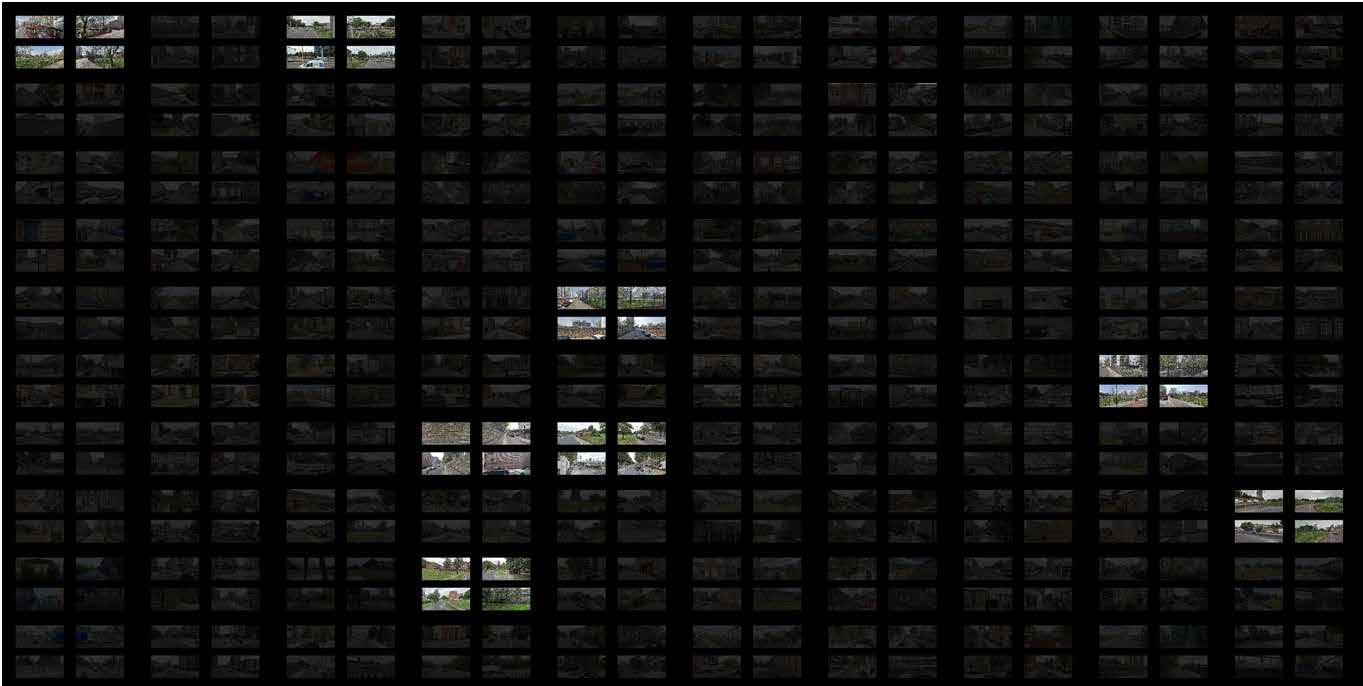
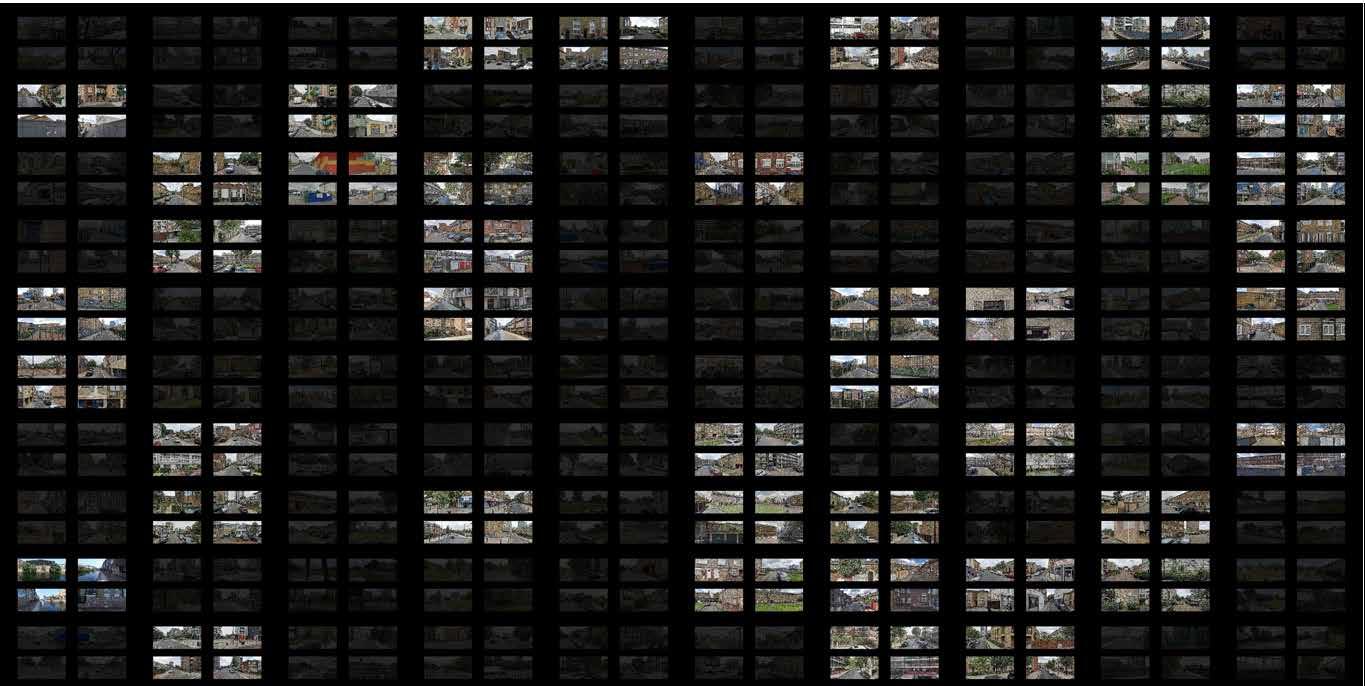
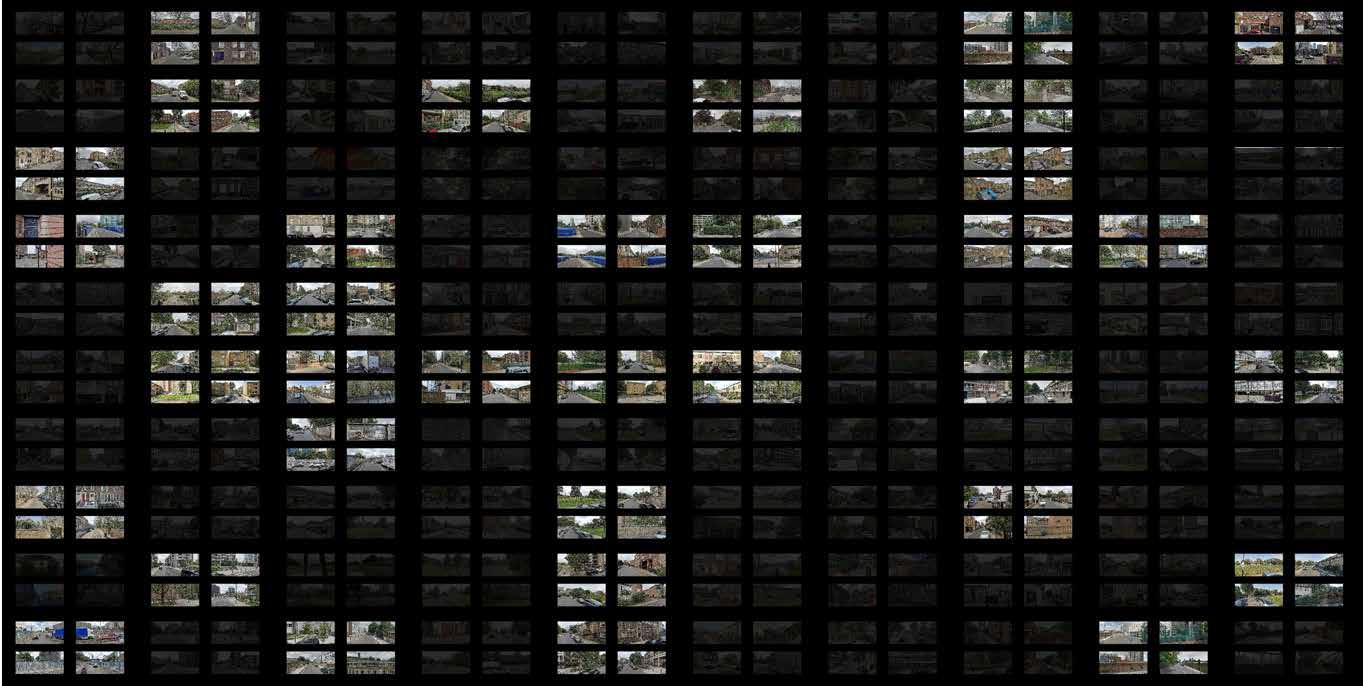
MICRO-SCALE ANALYSIS | Google Street View Segmentation for Vertical Analysis
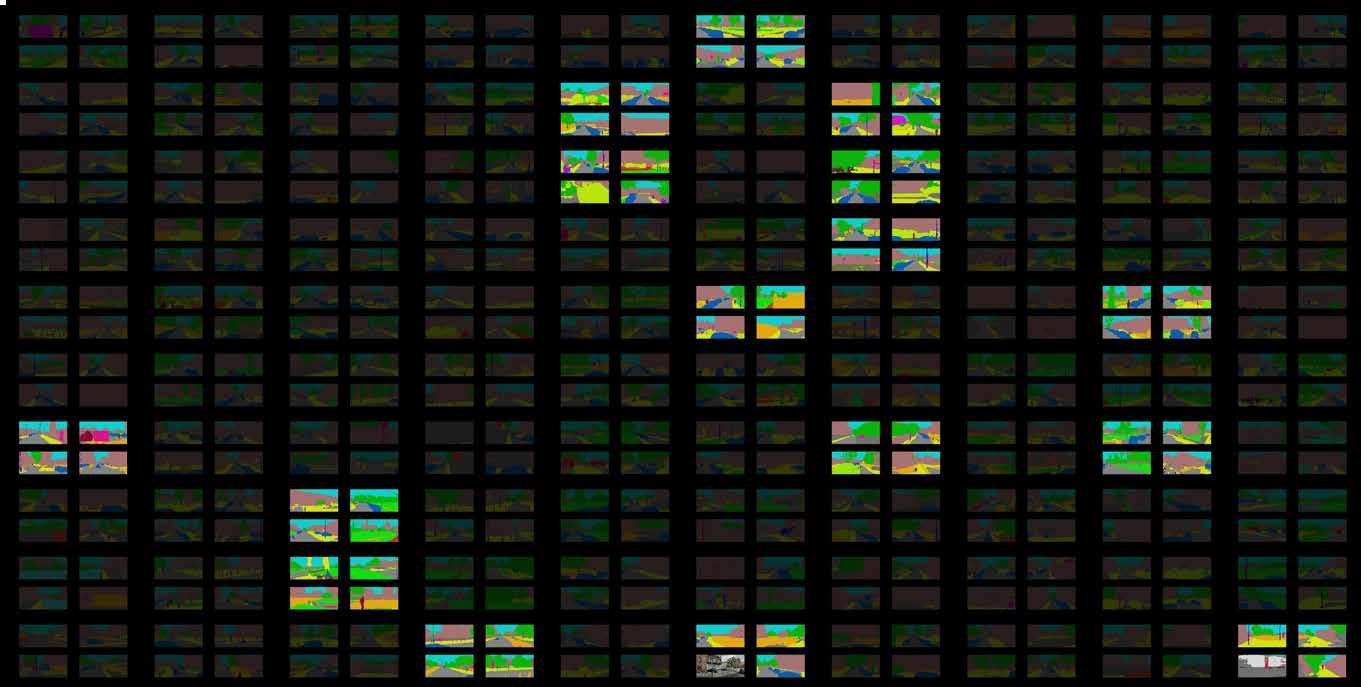
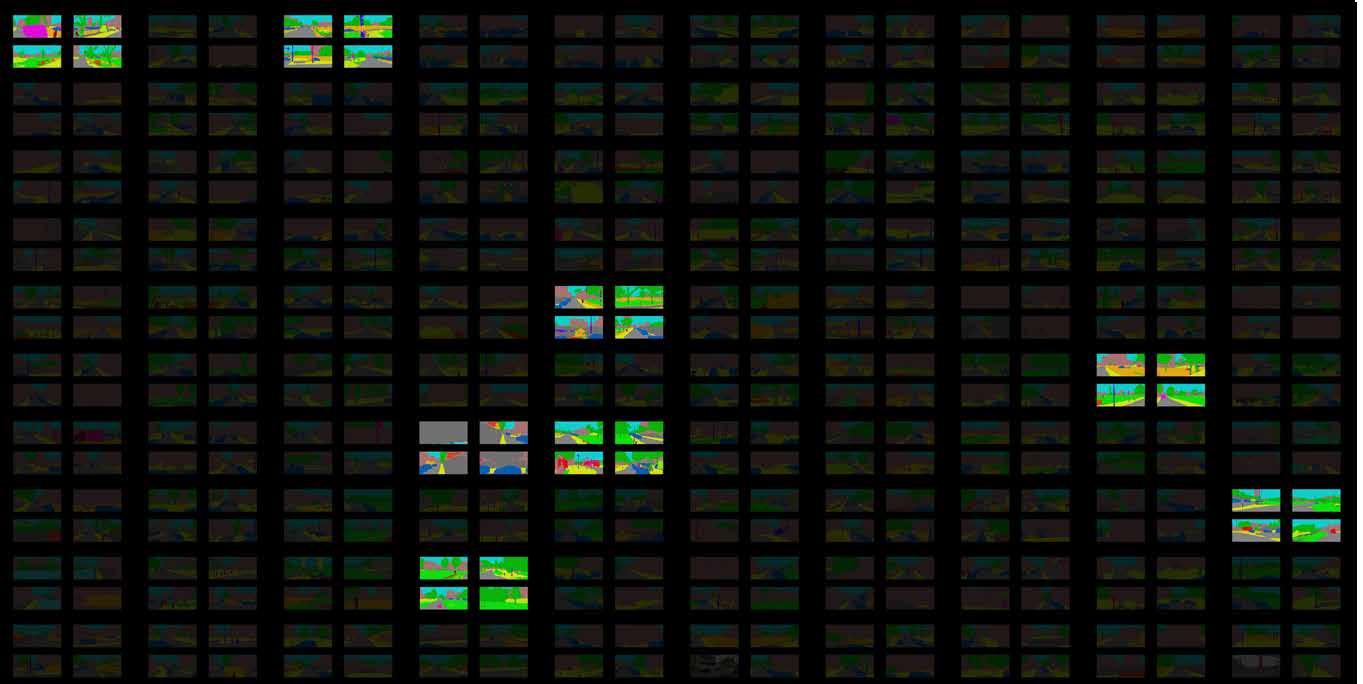
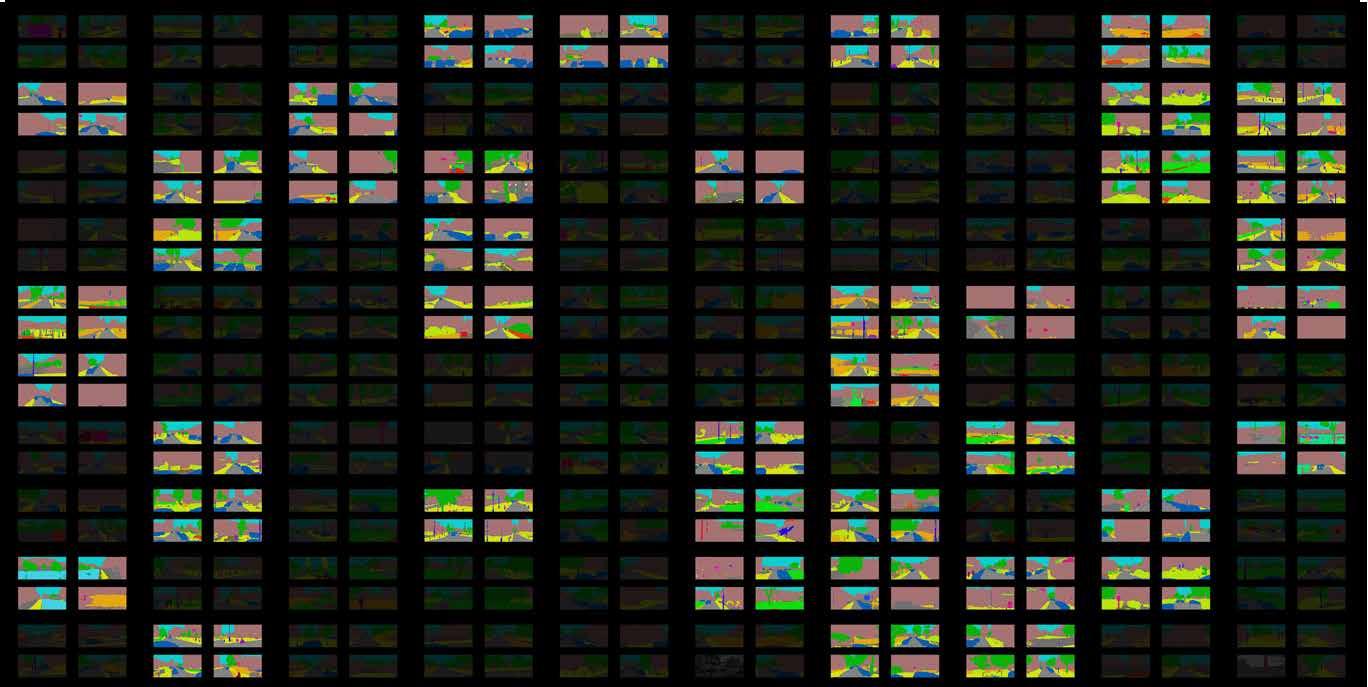
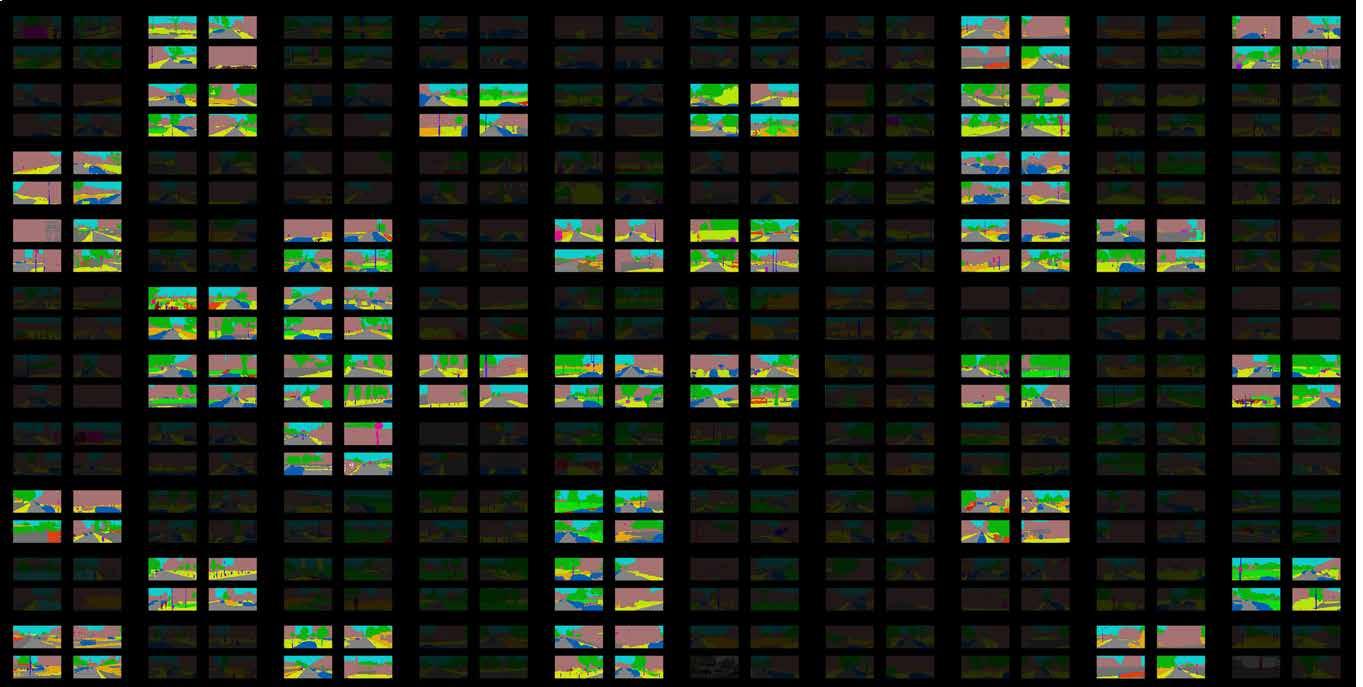
MICRO-SCALE ANALYSIS | Method of Google Street View Segmentation
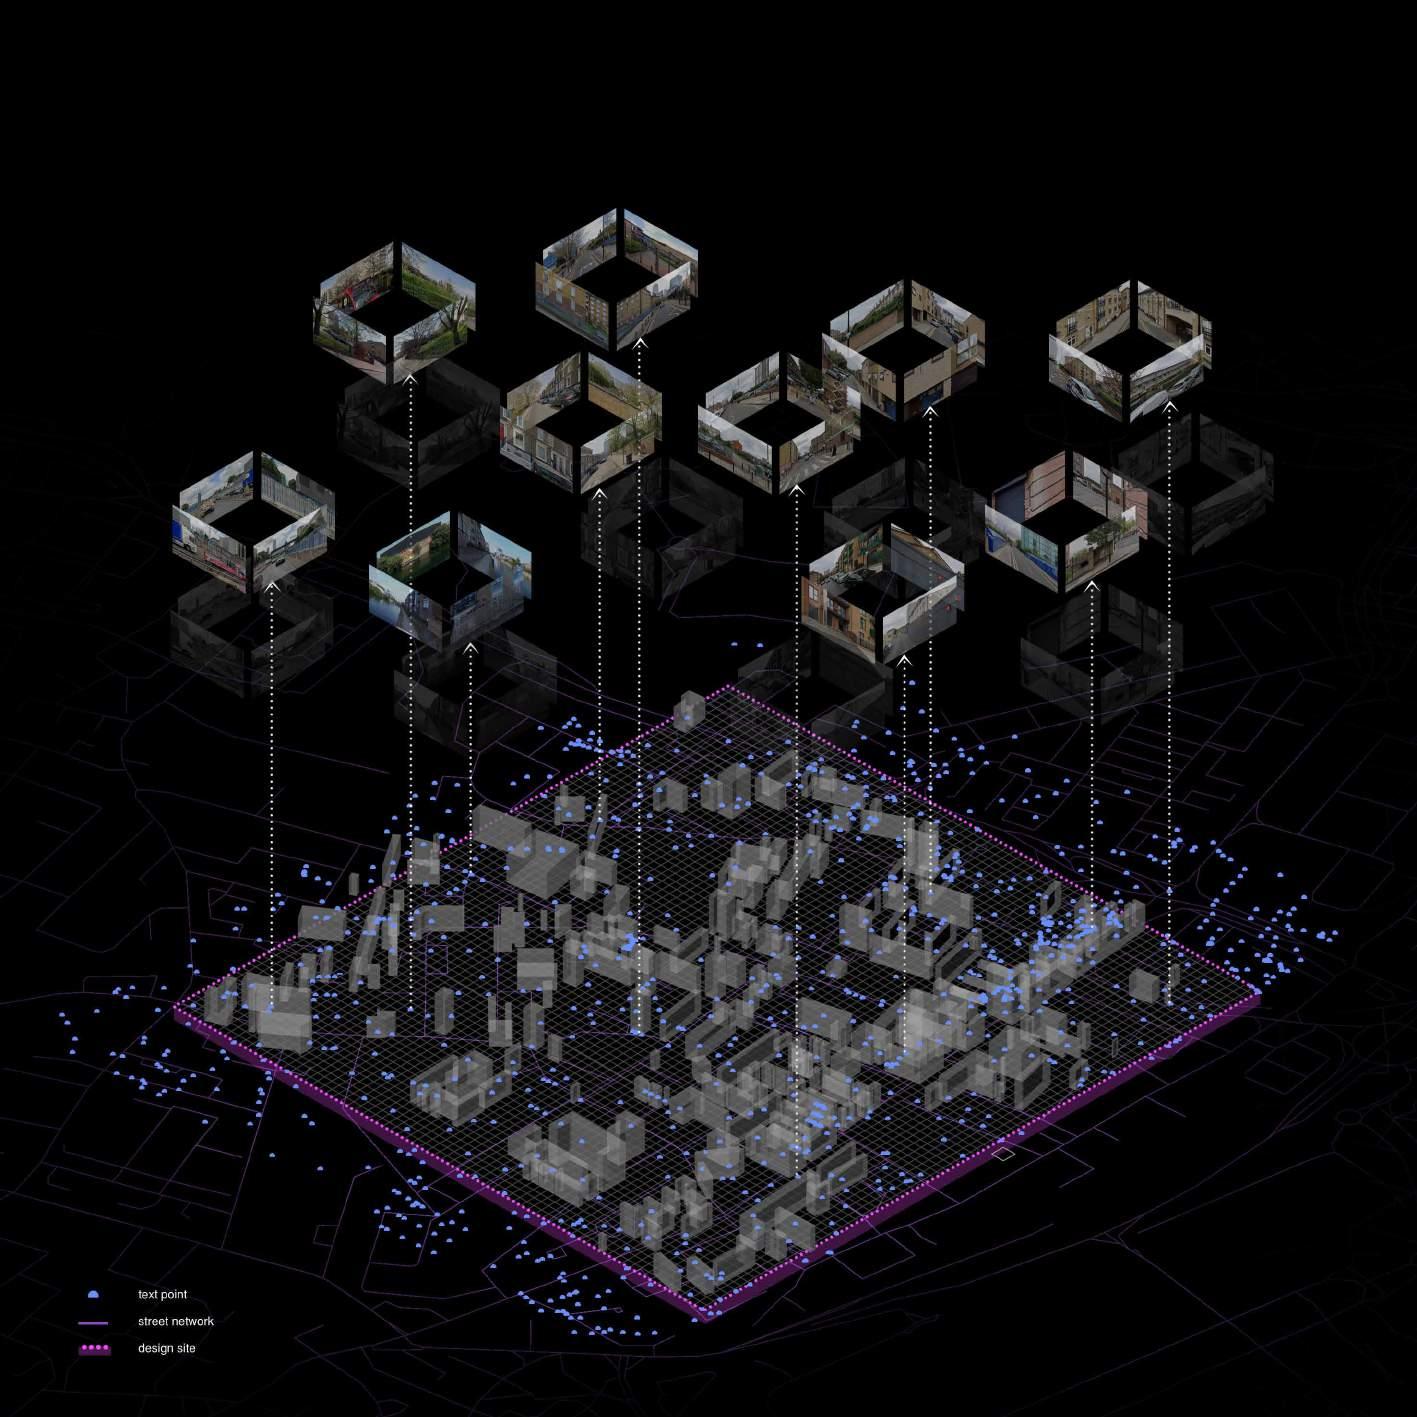
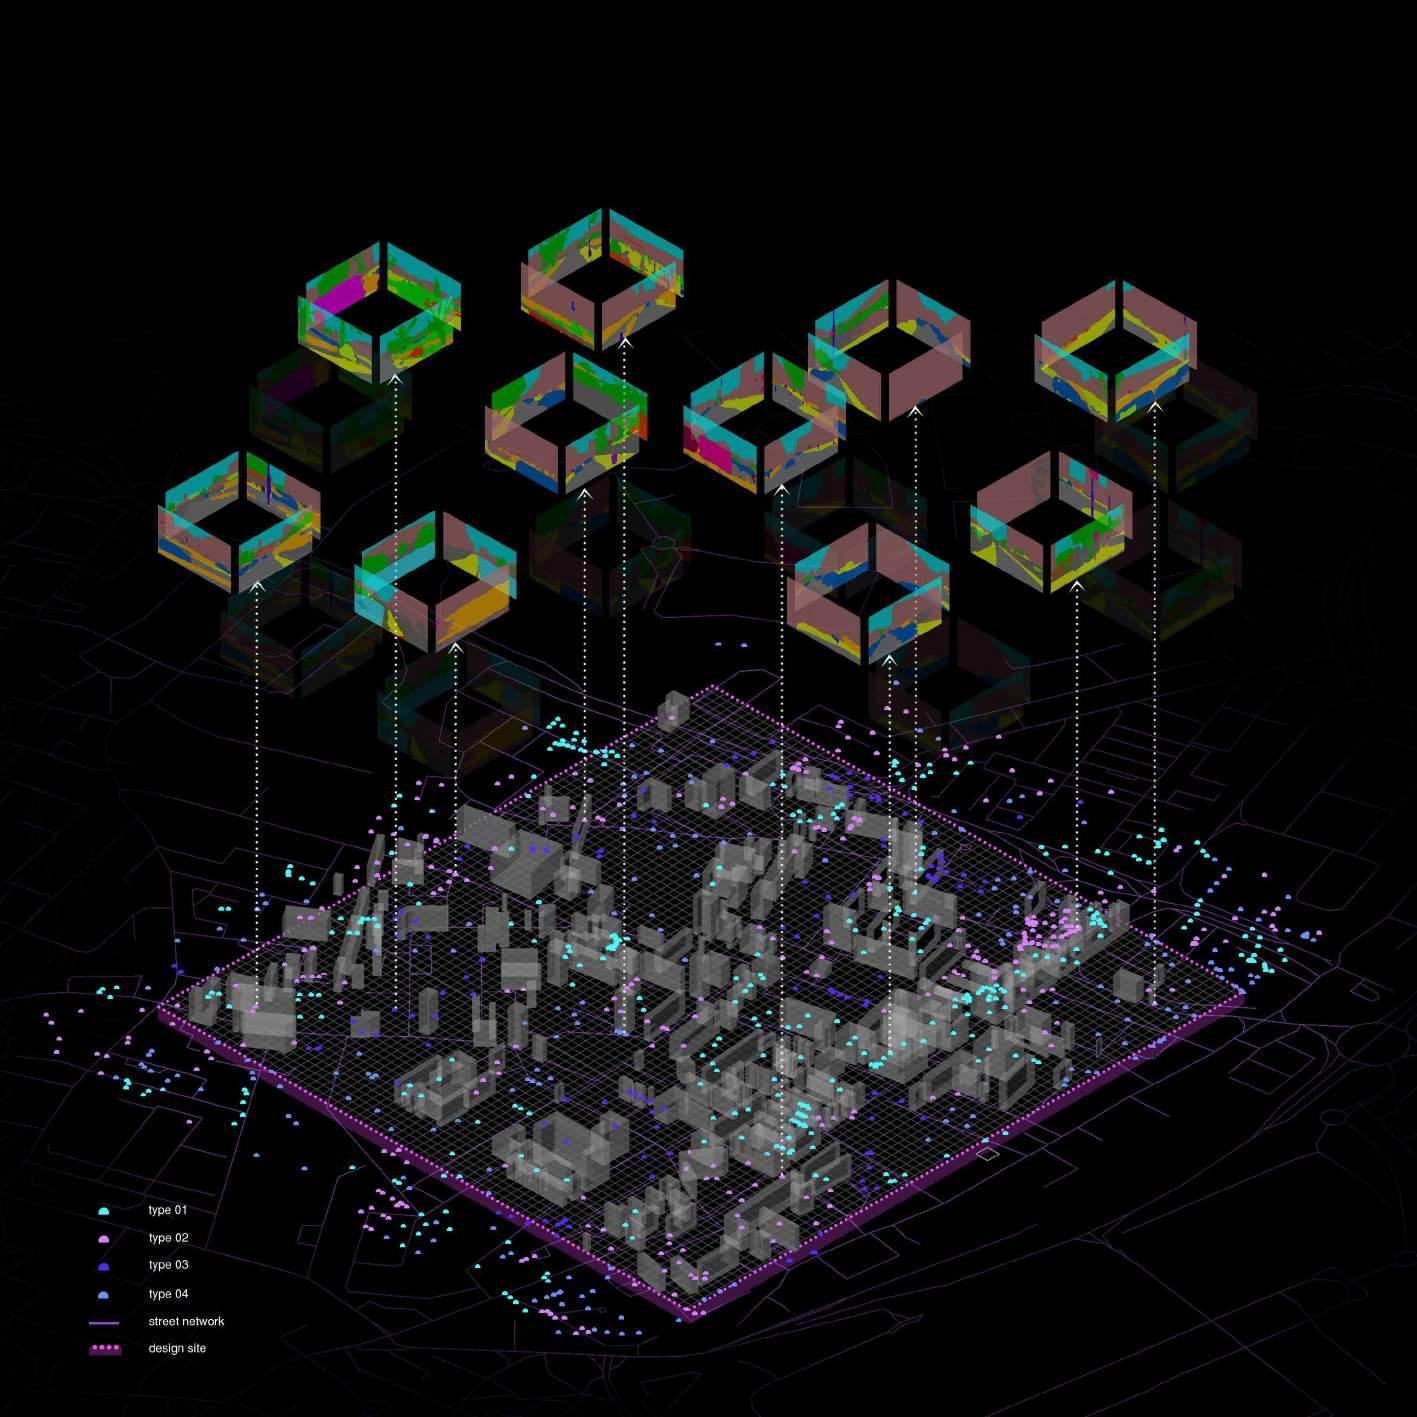
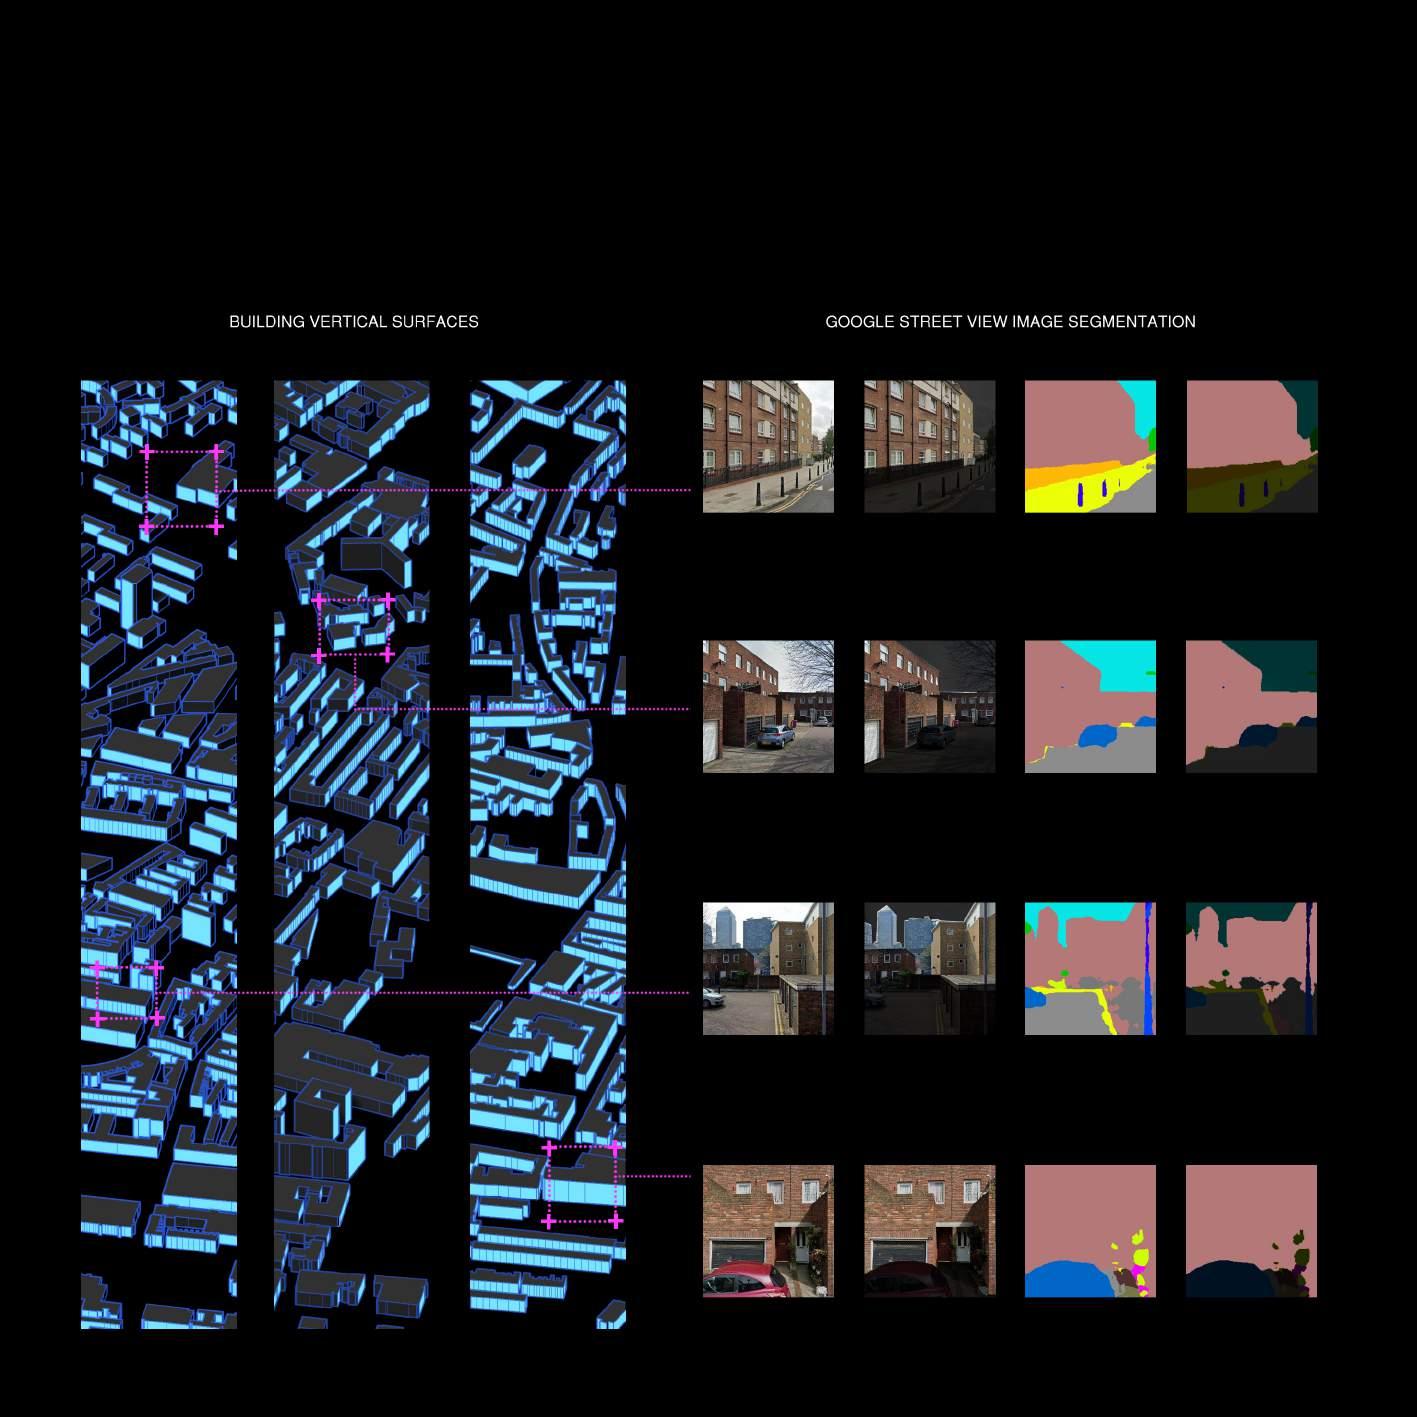
The semantic segmentation labels of google street view images include road, pathway, car, building, sky, tree, wall etc. We got the google location point firstly and then examined four viewpoints of the each point.
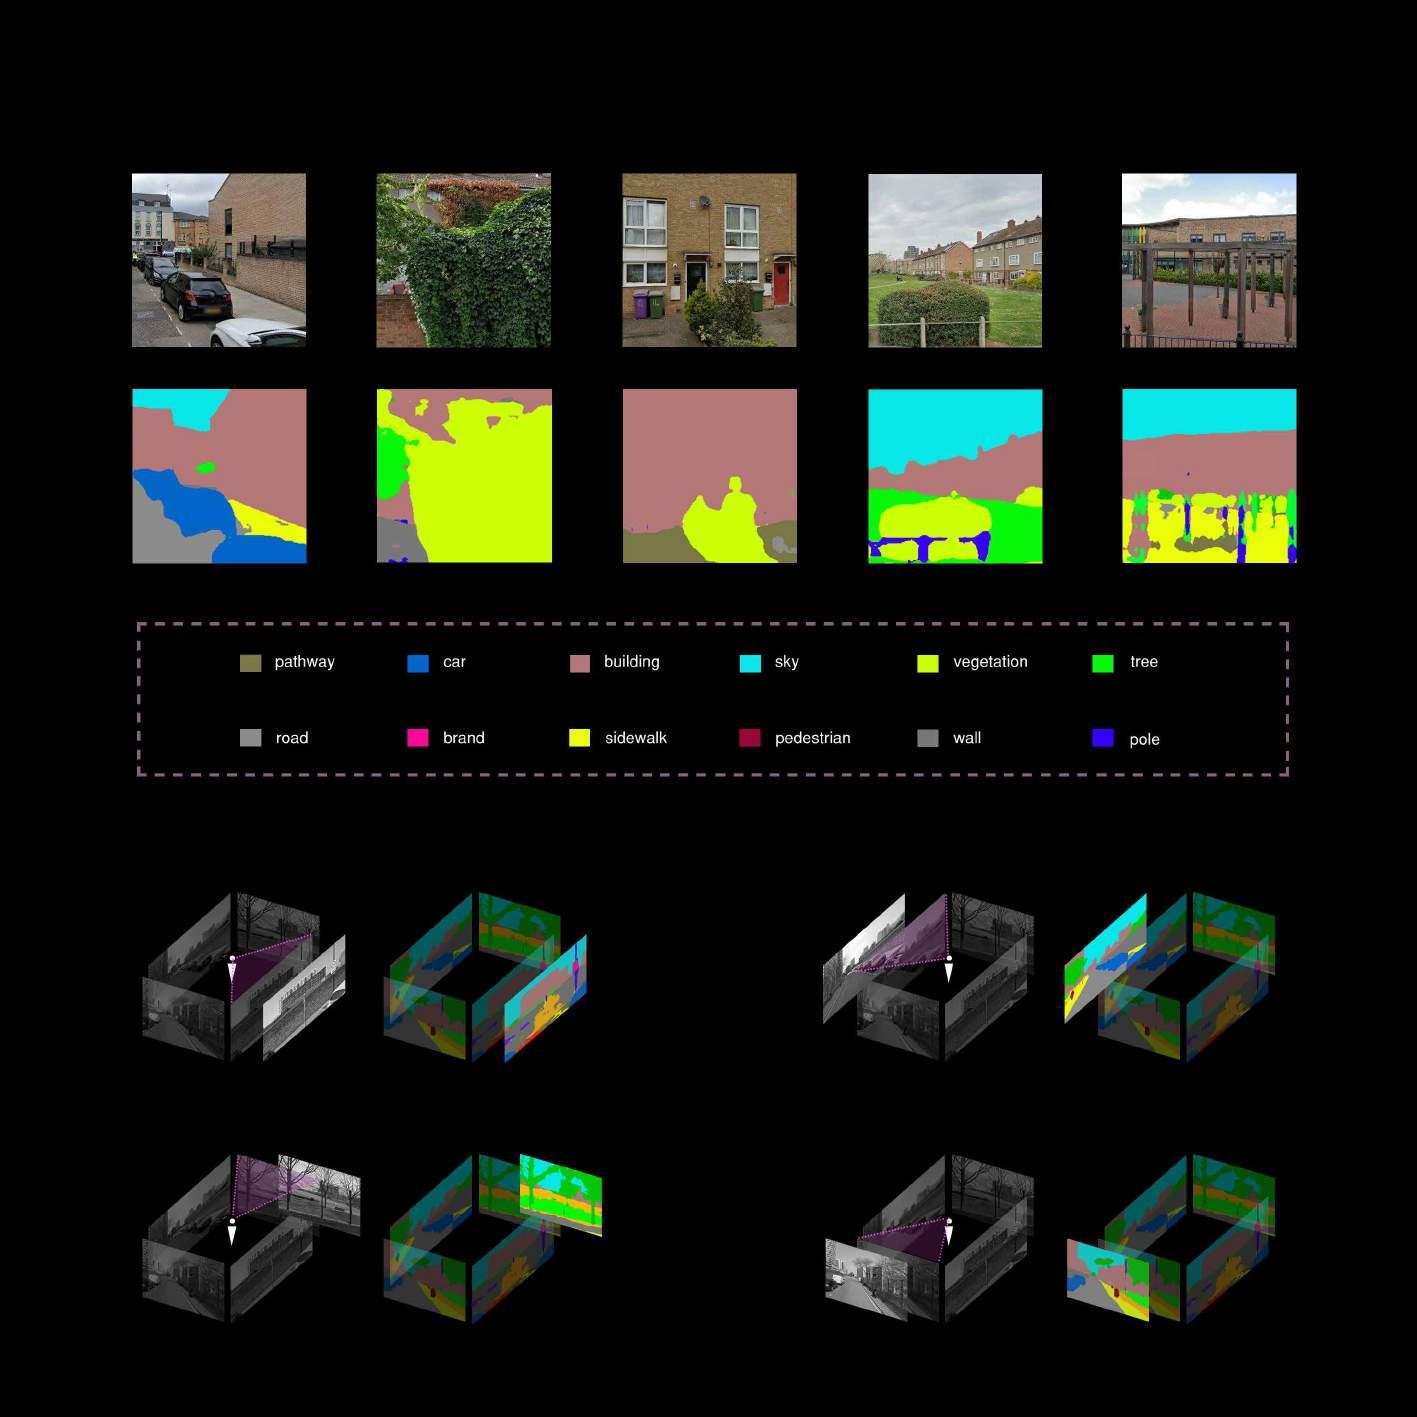
MICRO-SCALE ANALYSIS | The Result of Google Street View Segmentation
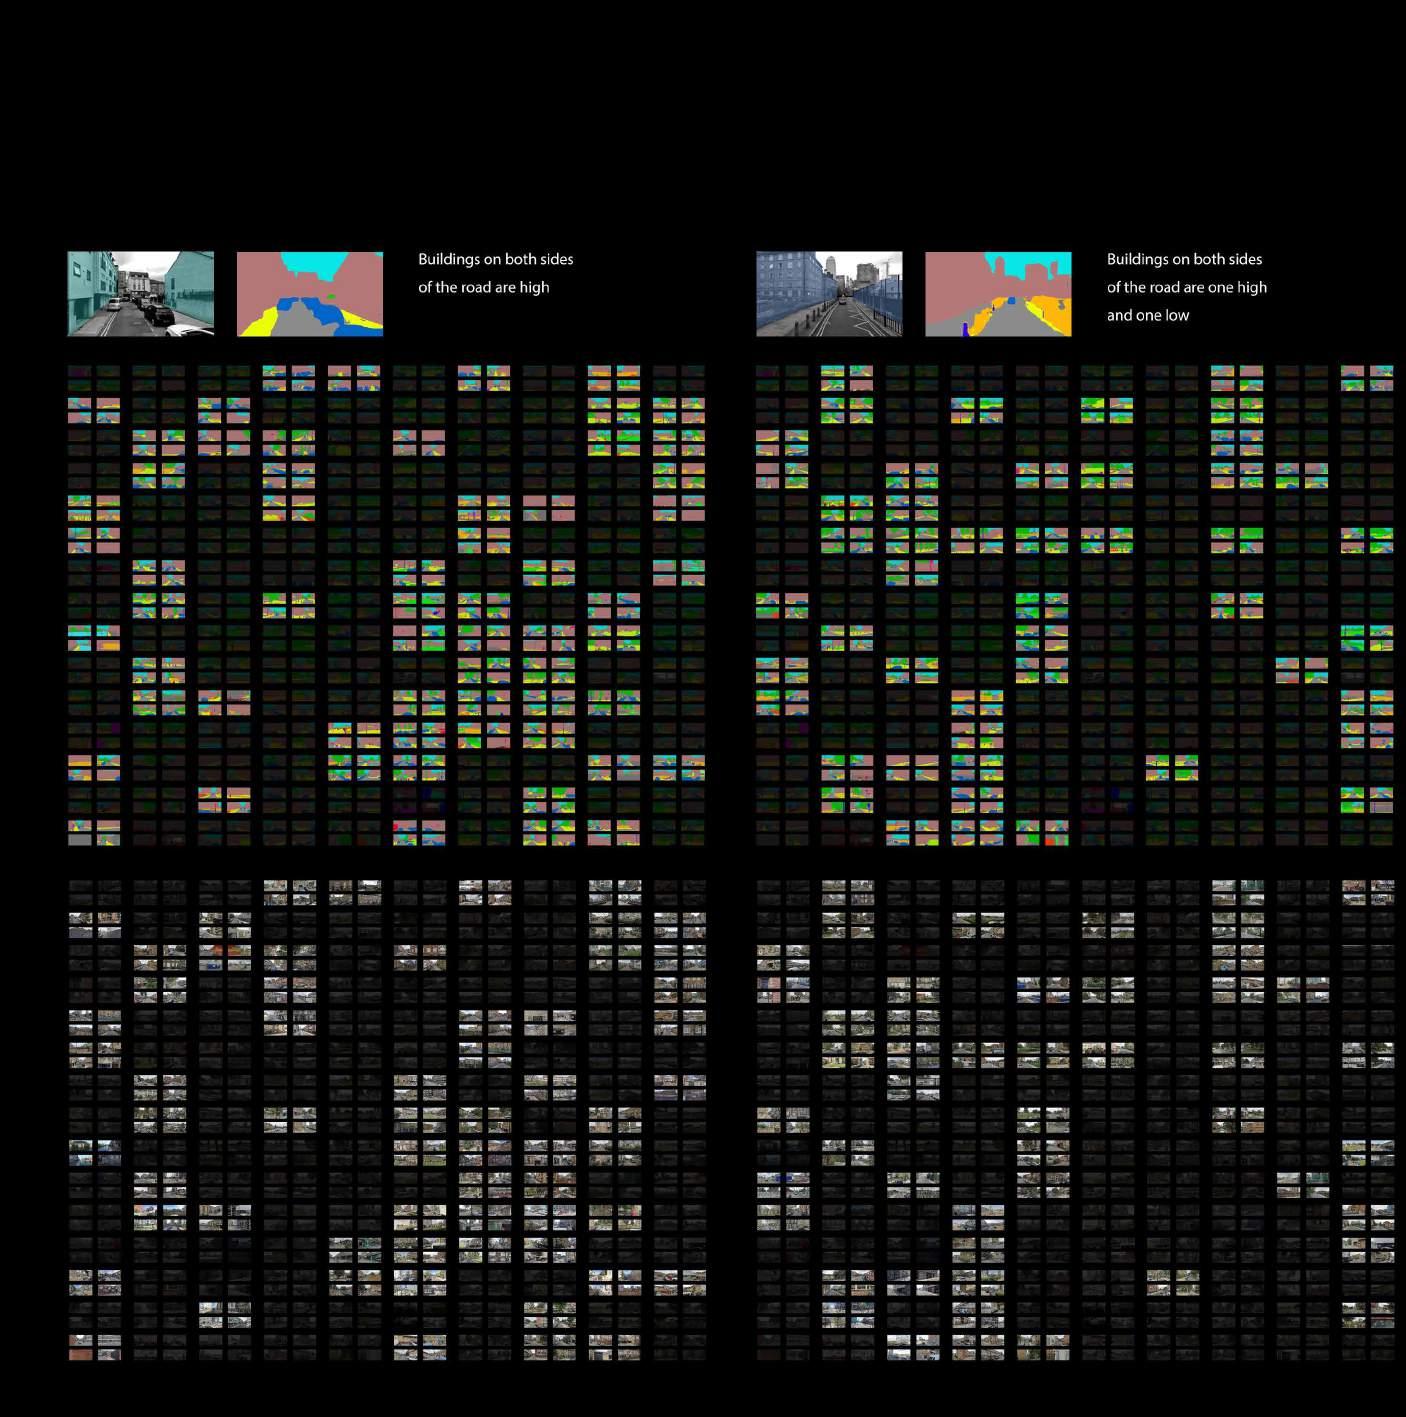
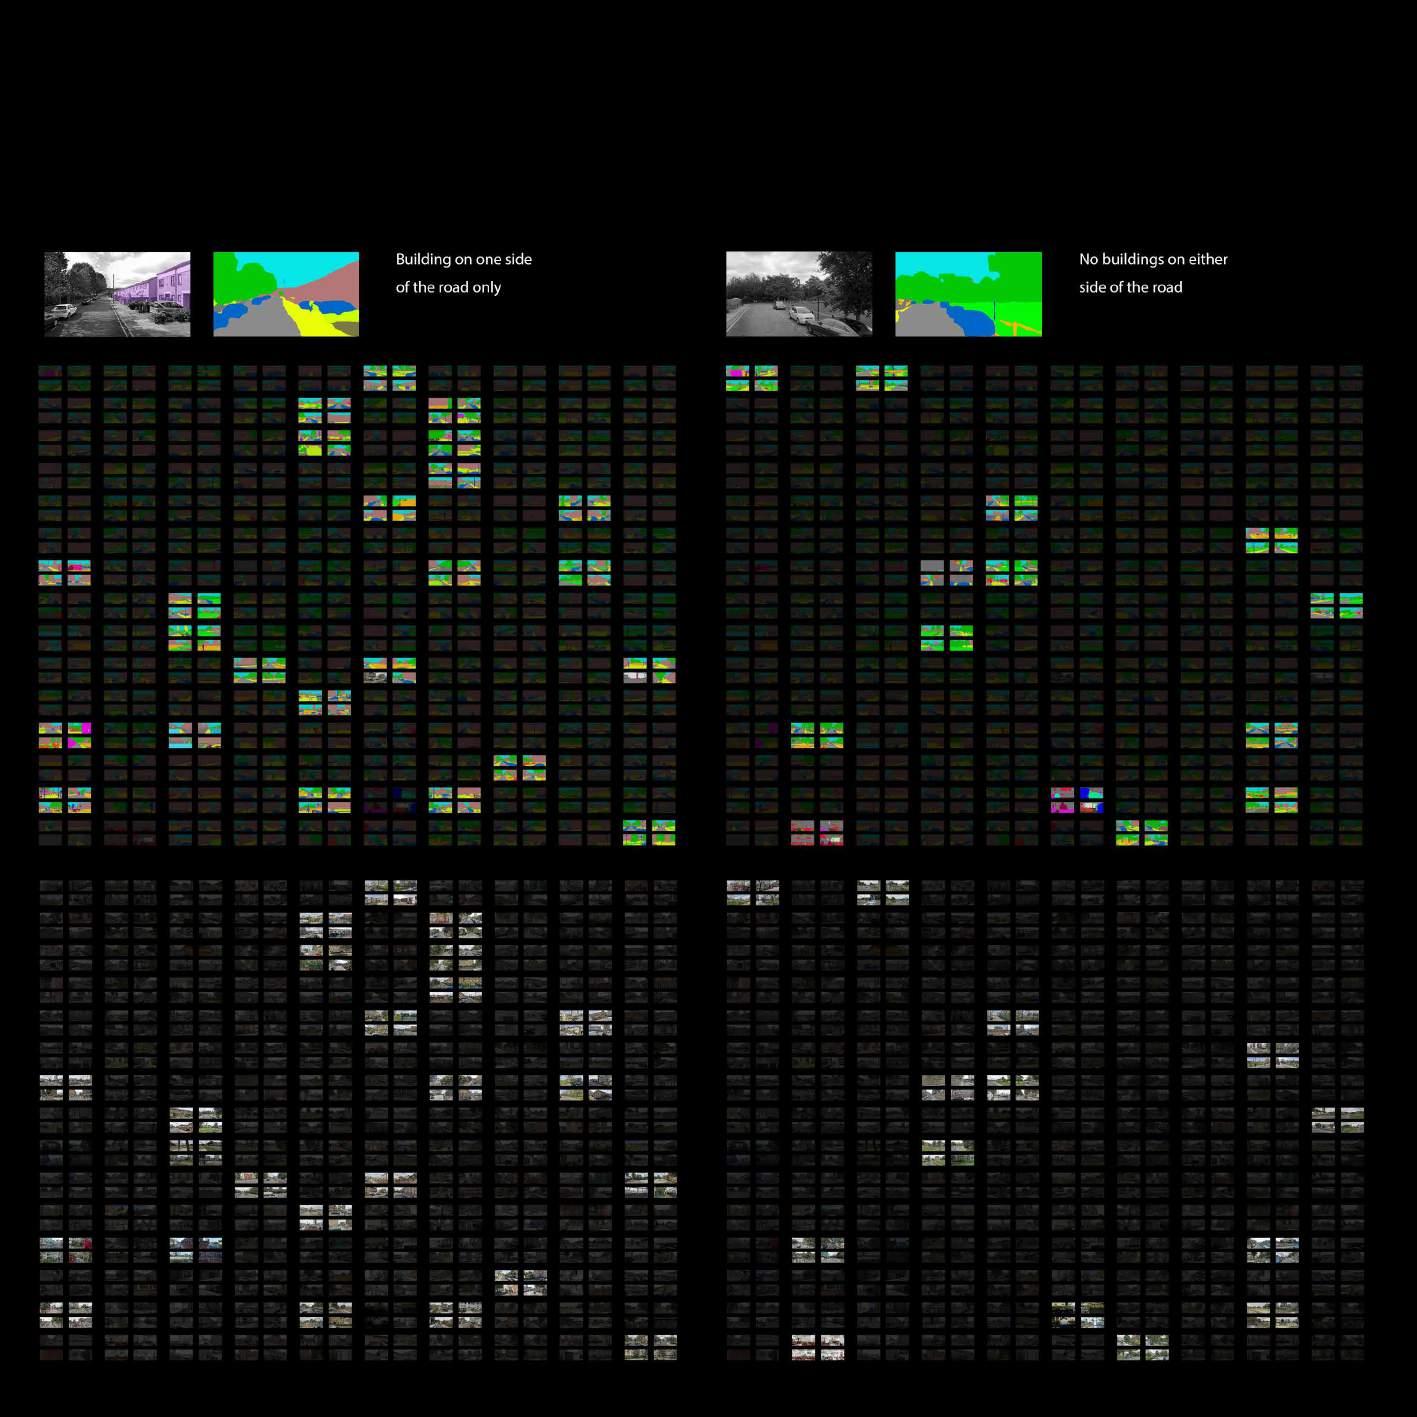
MICRO-SCALE ANALYSIS | Four Types Street Availability Map
MICRO-SCALE ANALYSIS | On-ground, Roof and Vertical
MICRO-SCALE ANALYSIS | Assessment Models for PCR System
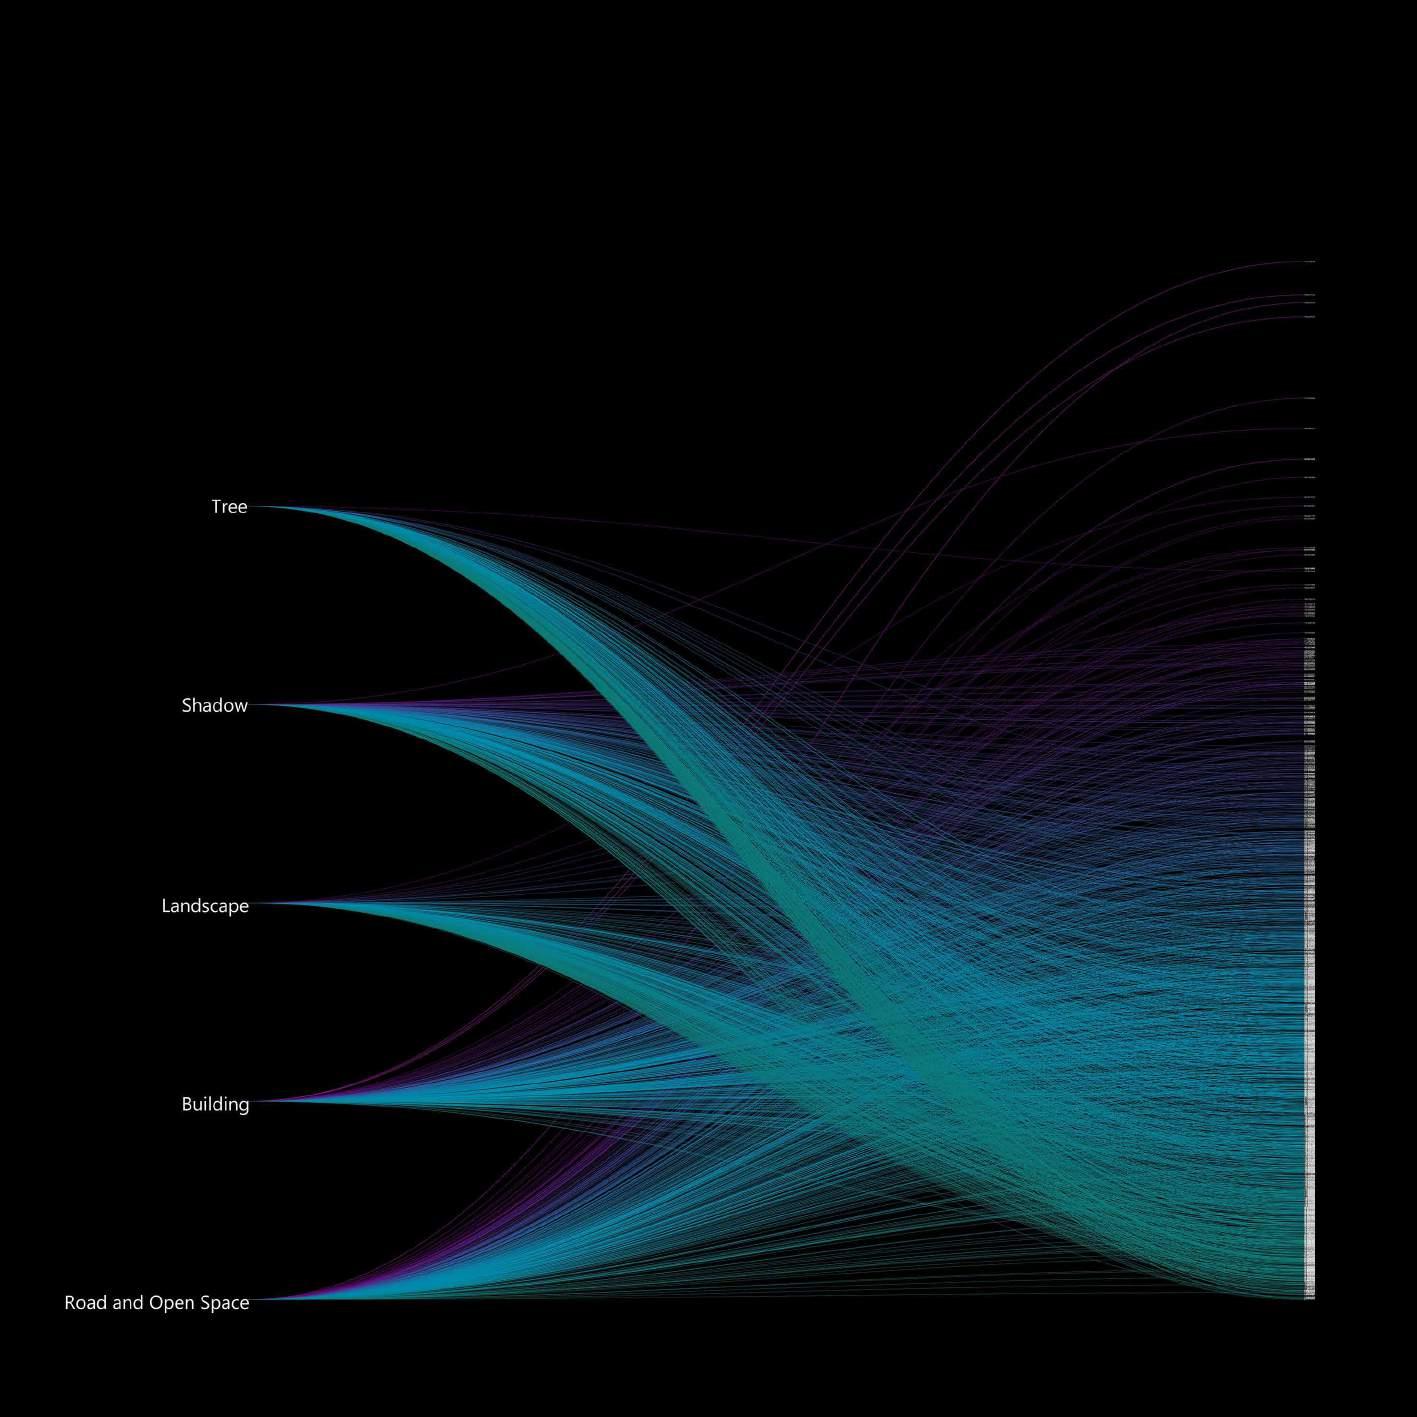
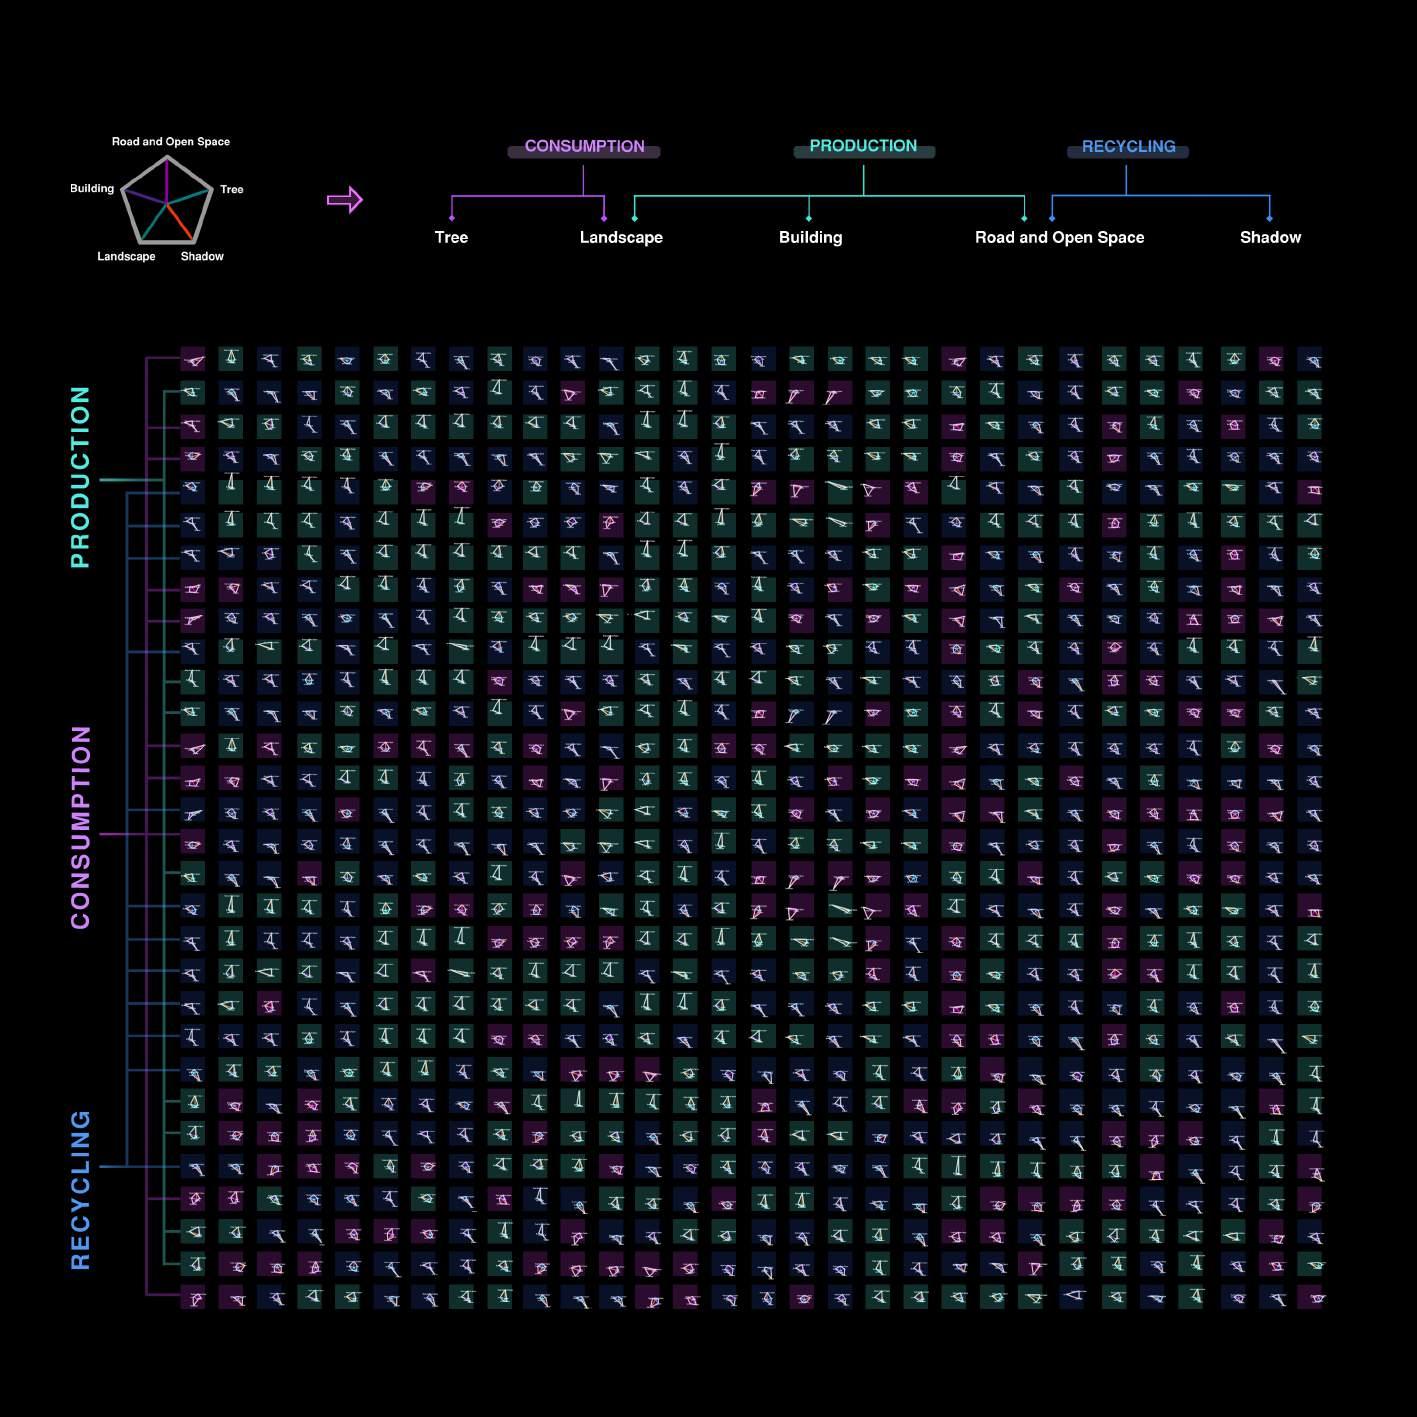
We create an assessment model to calculate the percentage of different types(tree, shadow, landscape, building, road and open space) of space in each patches.
MICRO-SCALE ANALYSIS | Crowdsourcing Dataset from Social Media
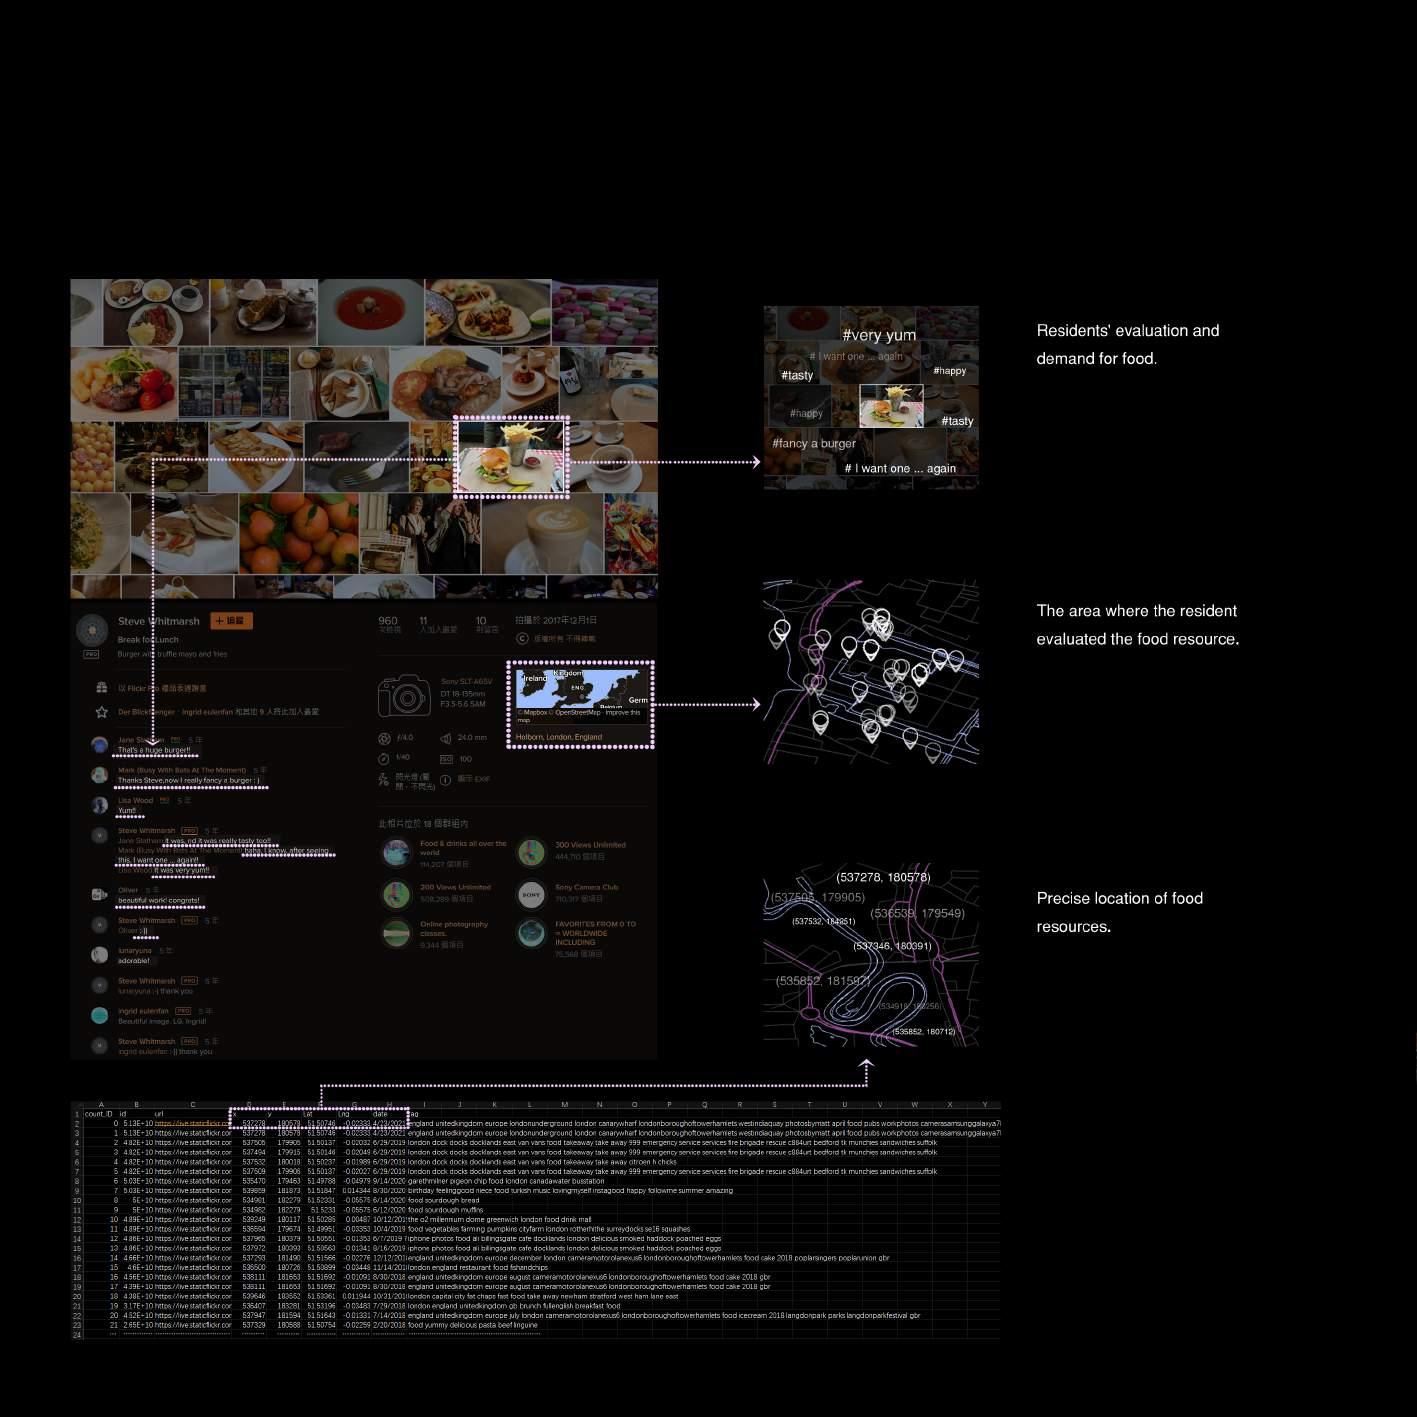
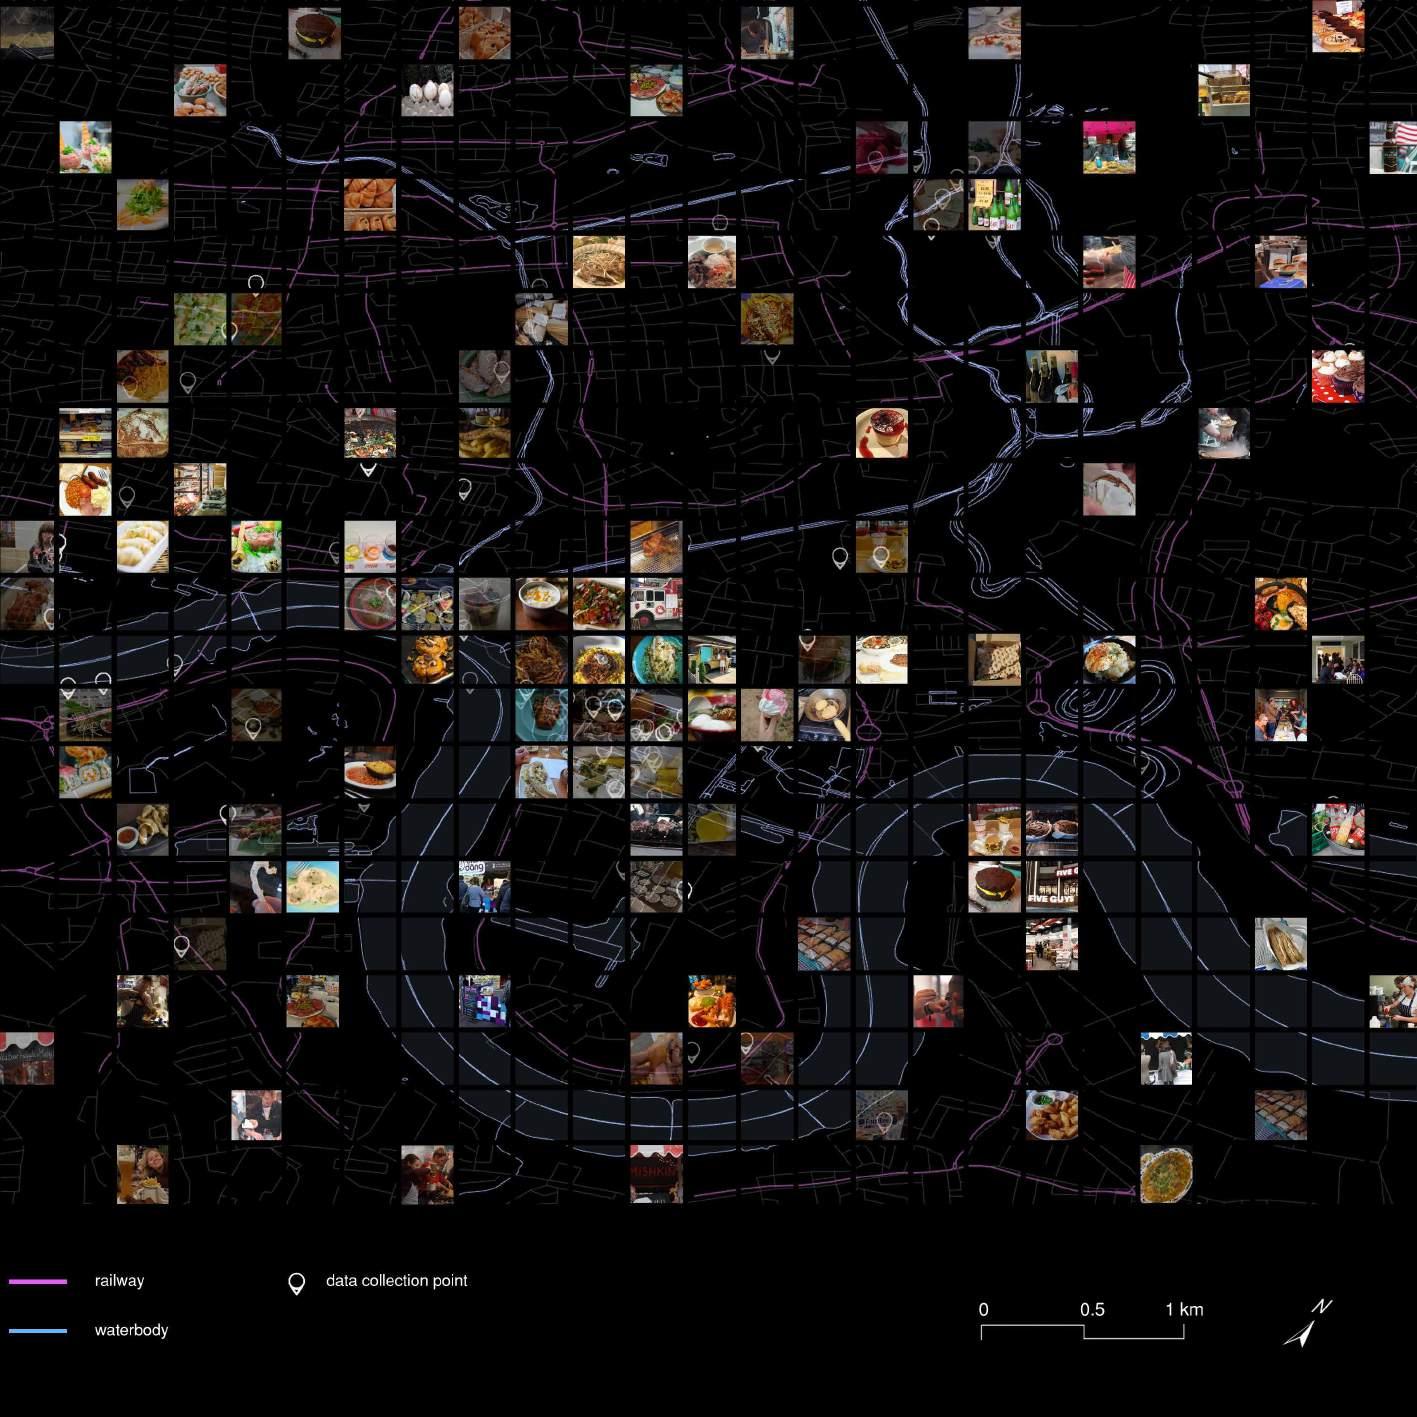
We combine the results with the food photos from social media as crowdsourcing data to locate the situation and predict the demand.
DESIGN SITE SELECTION | Overlay
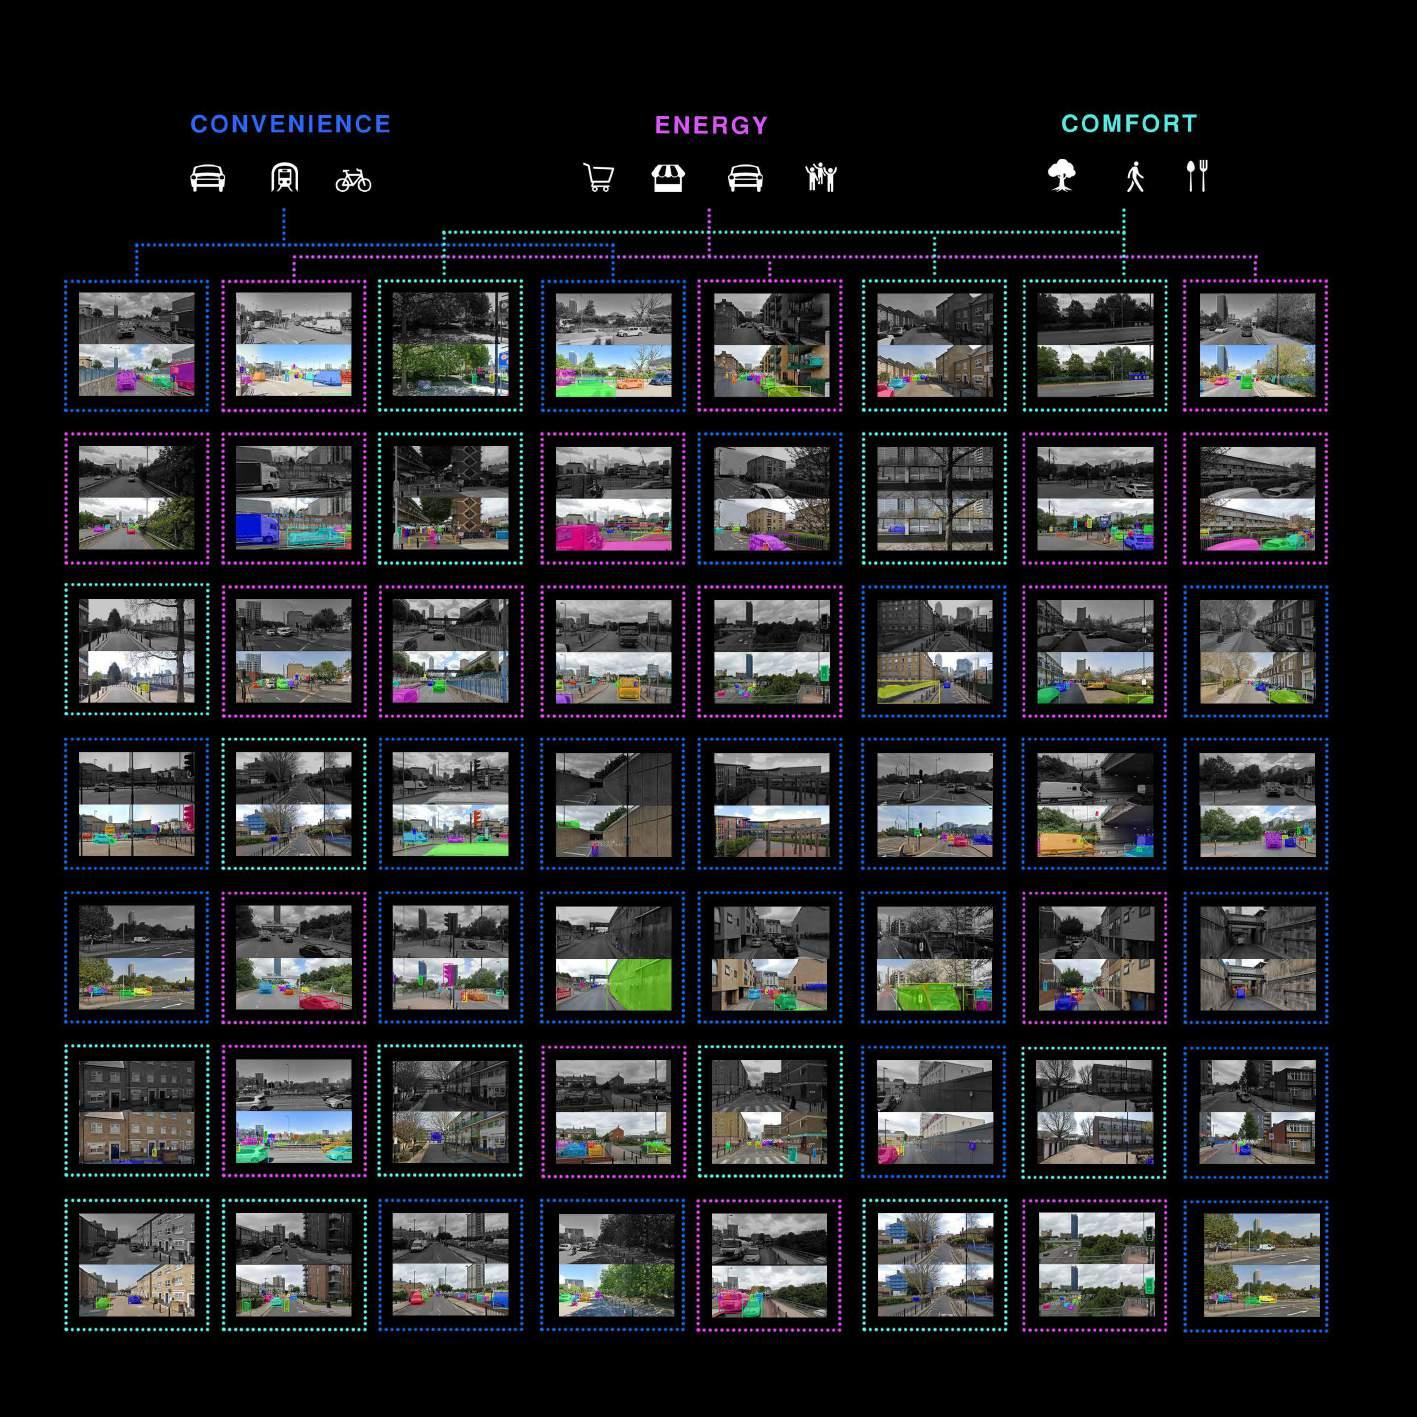
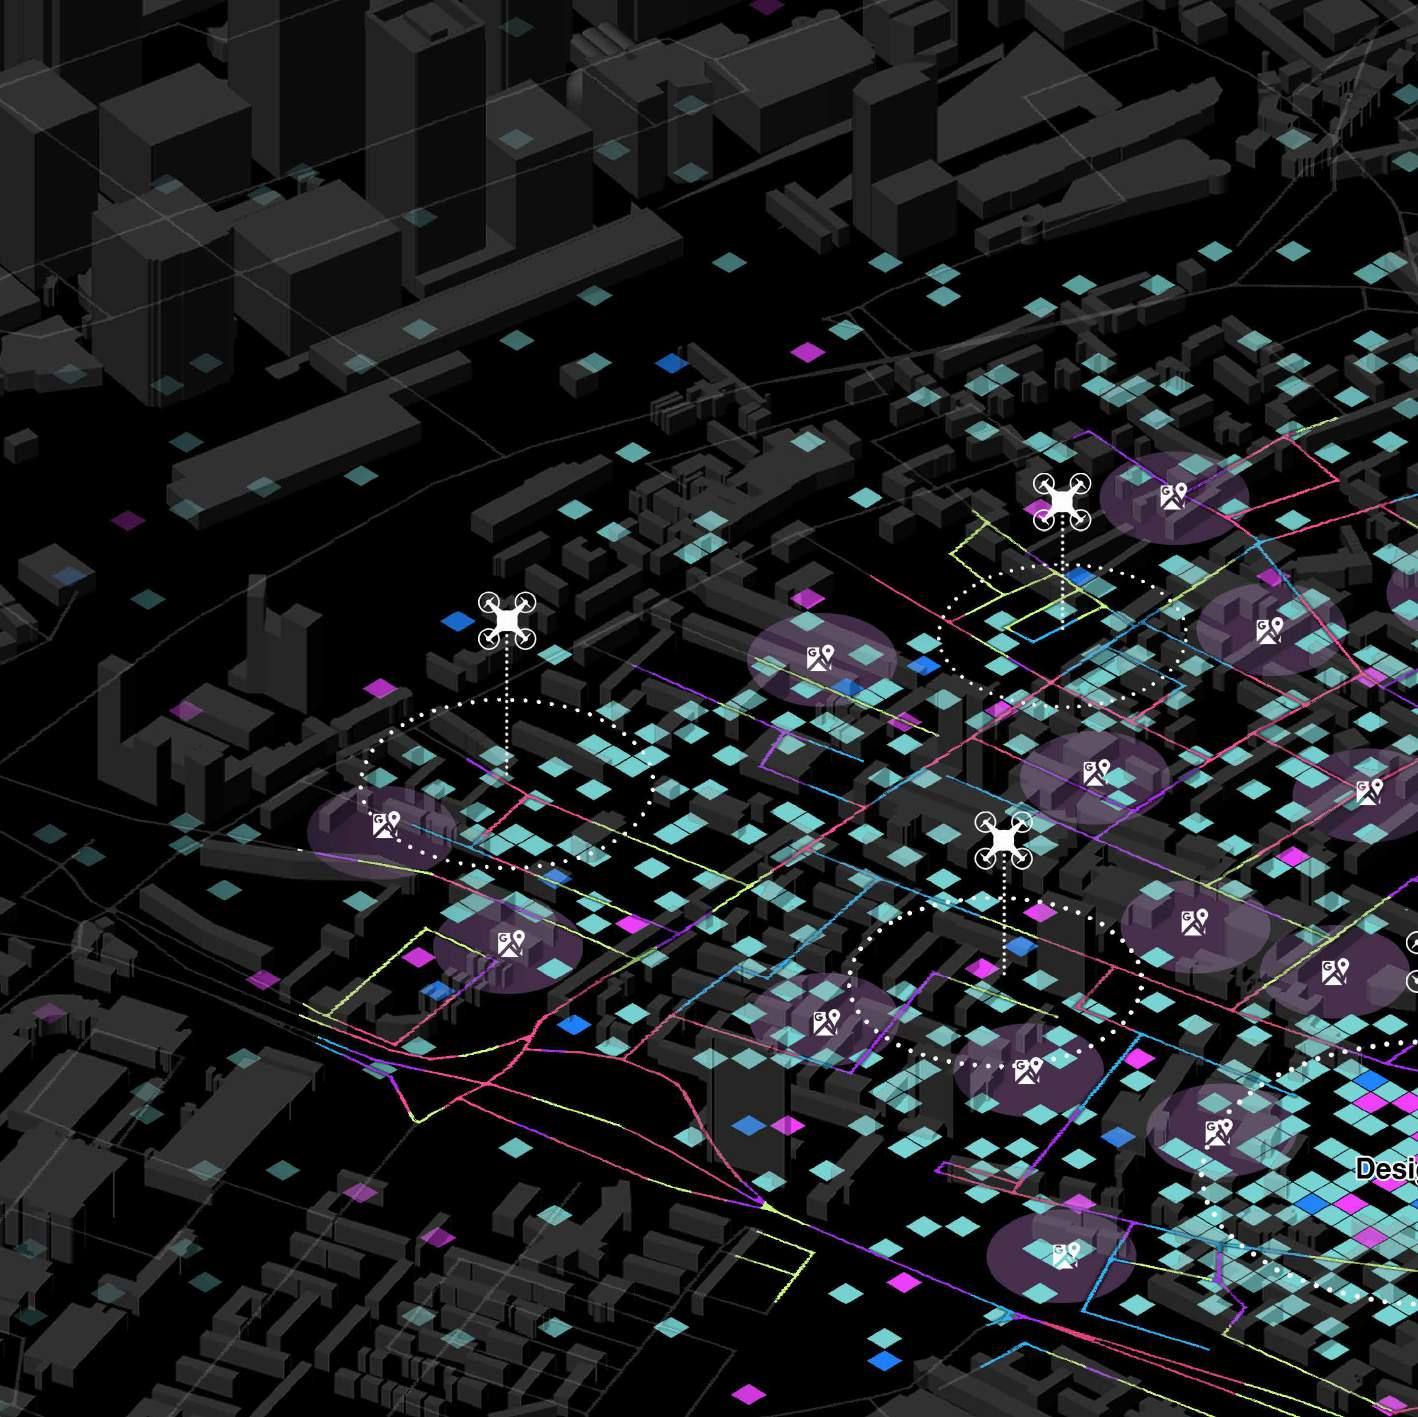
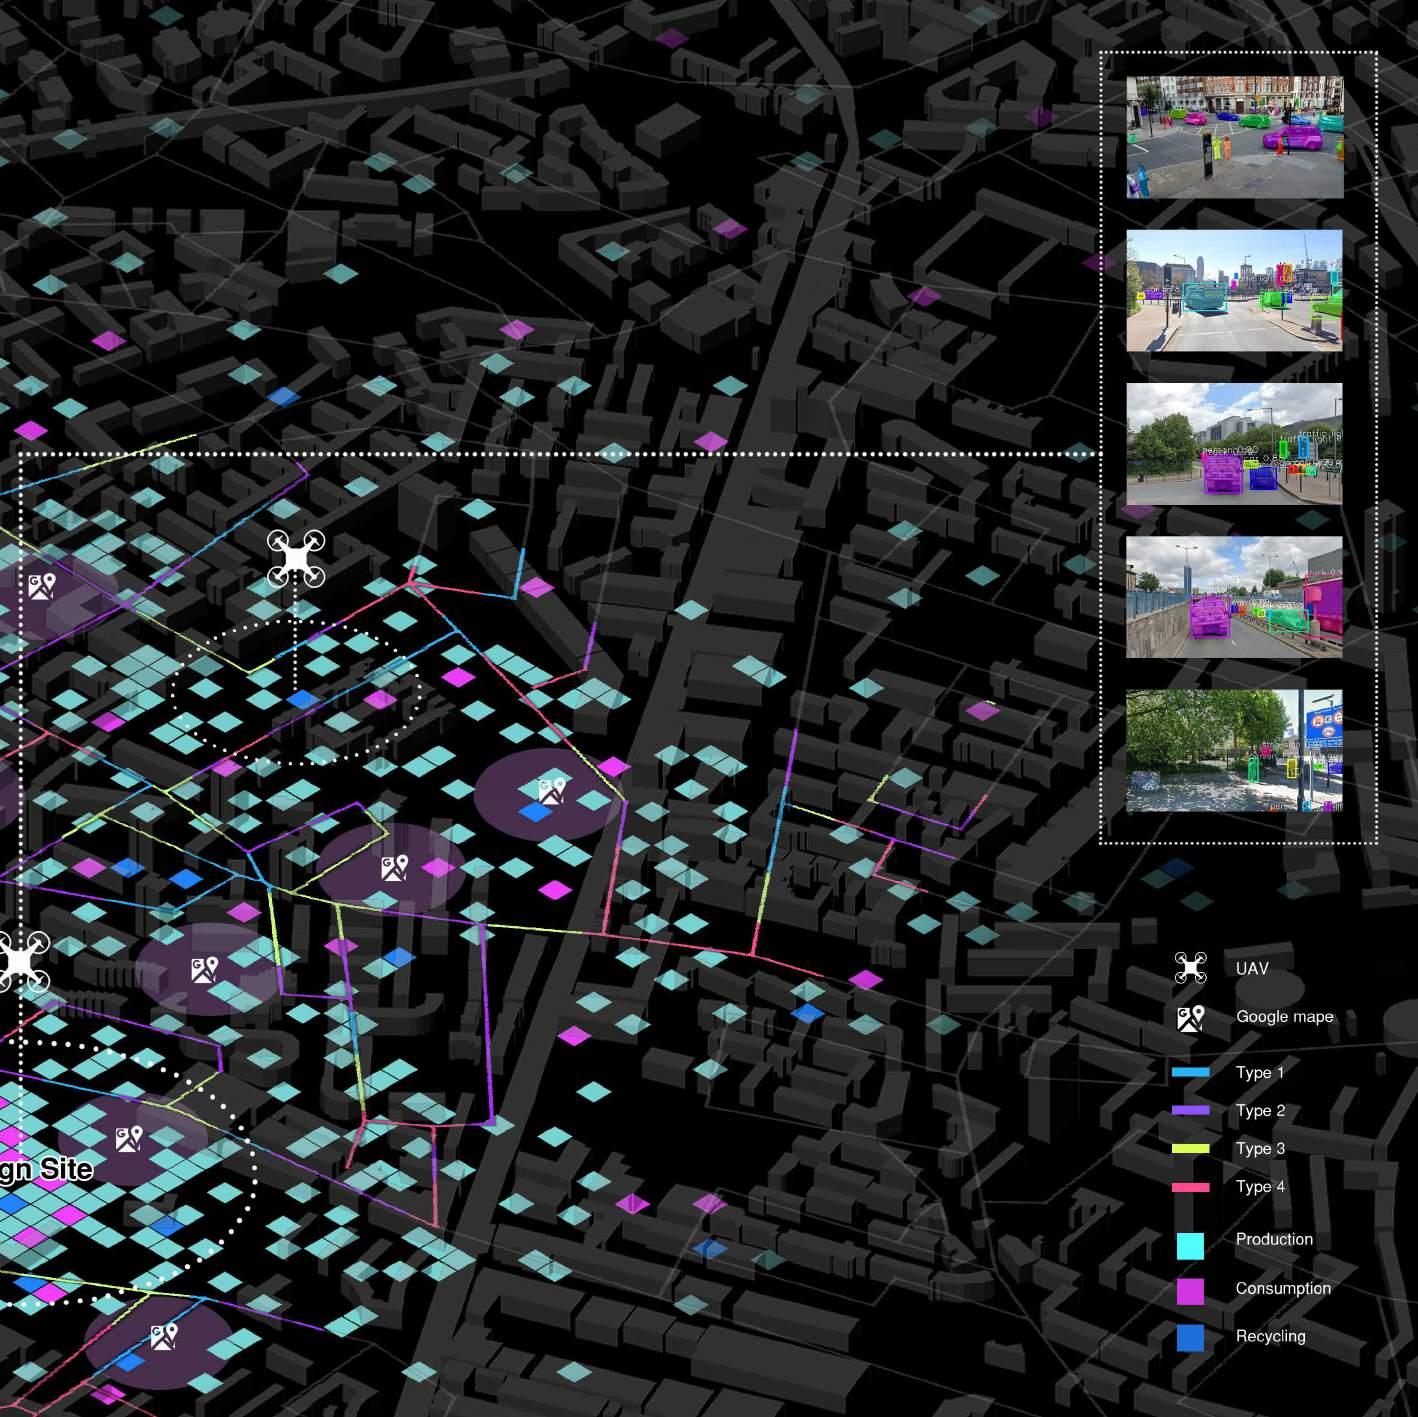
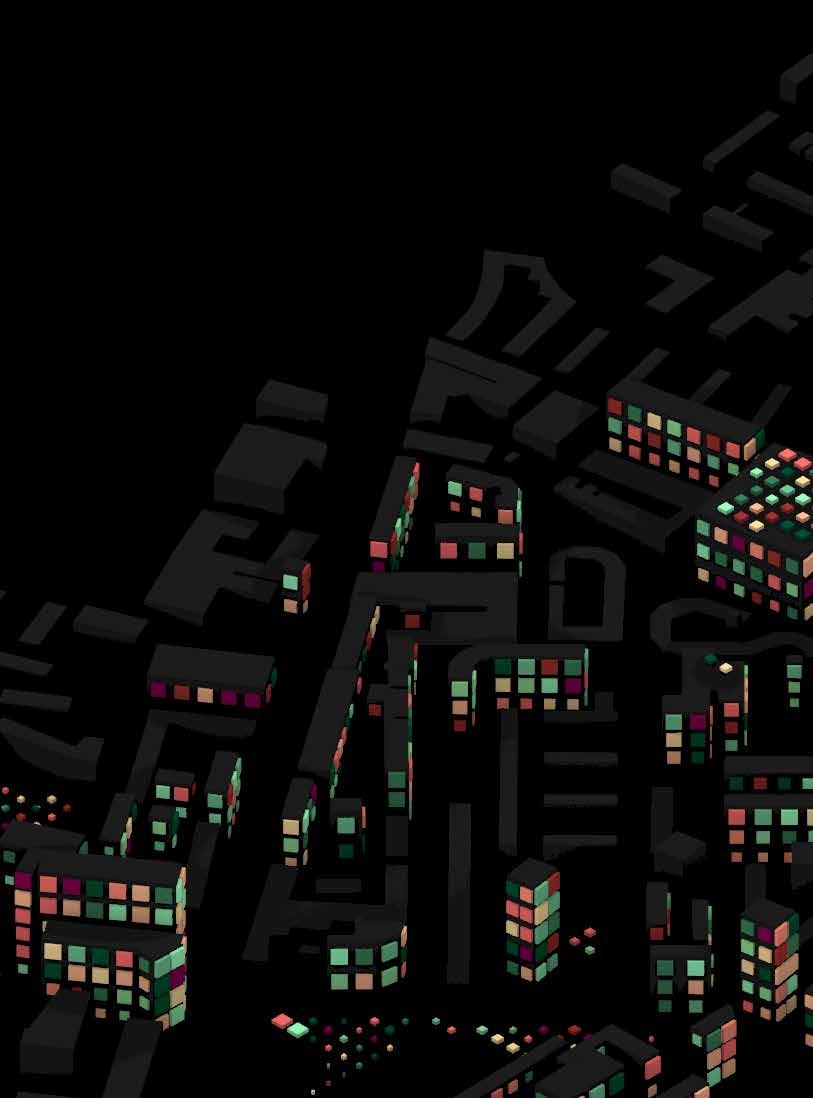
After all the results were overlayed, we finalized our design area according to convenience, energy, and comfort.
DESIGN STRATEGY
PRODUCTION, CONSUMPTION AND RECYCLING [PART FOUR]
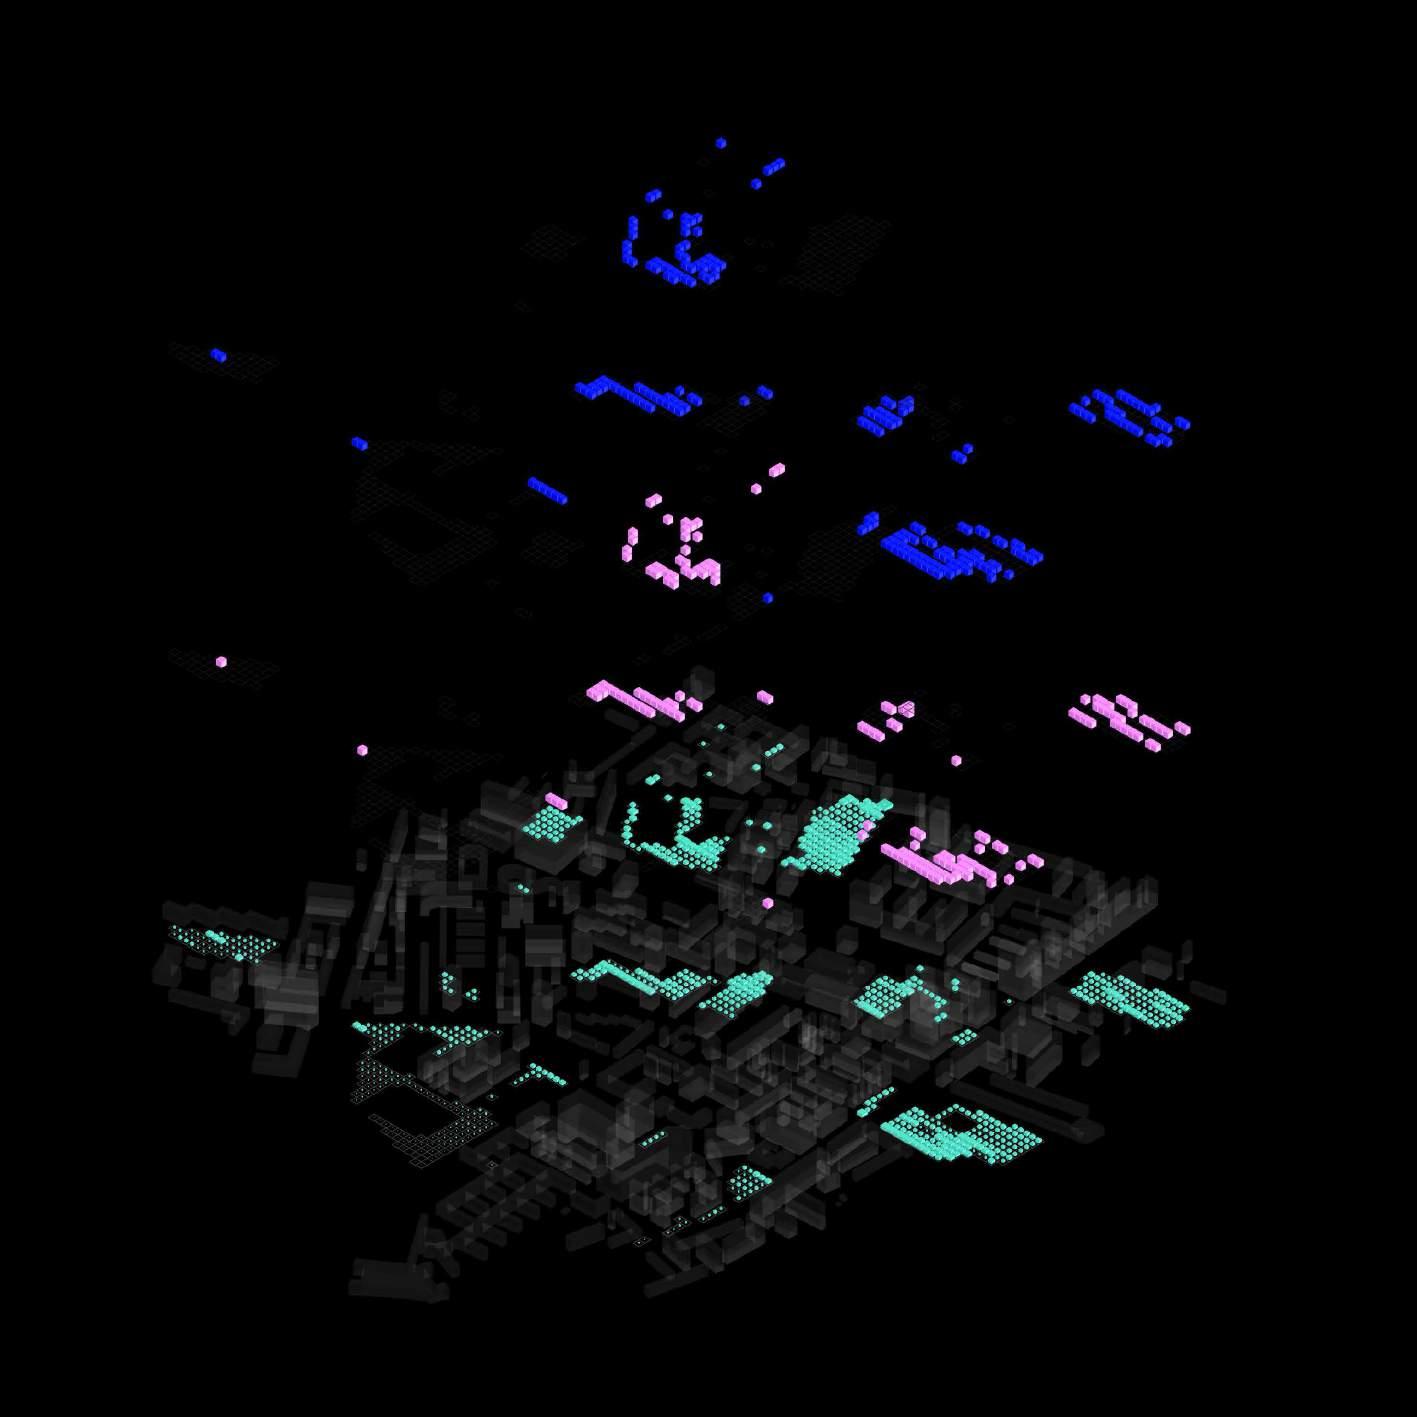
This part shows our design strategies for our ideas: Consumption, Recycling and Production areas for Roof, Elevated, Vertical, On ground Farming.
DESIGN STRATEGY | Proposing Vertical Farms
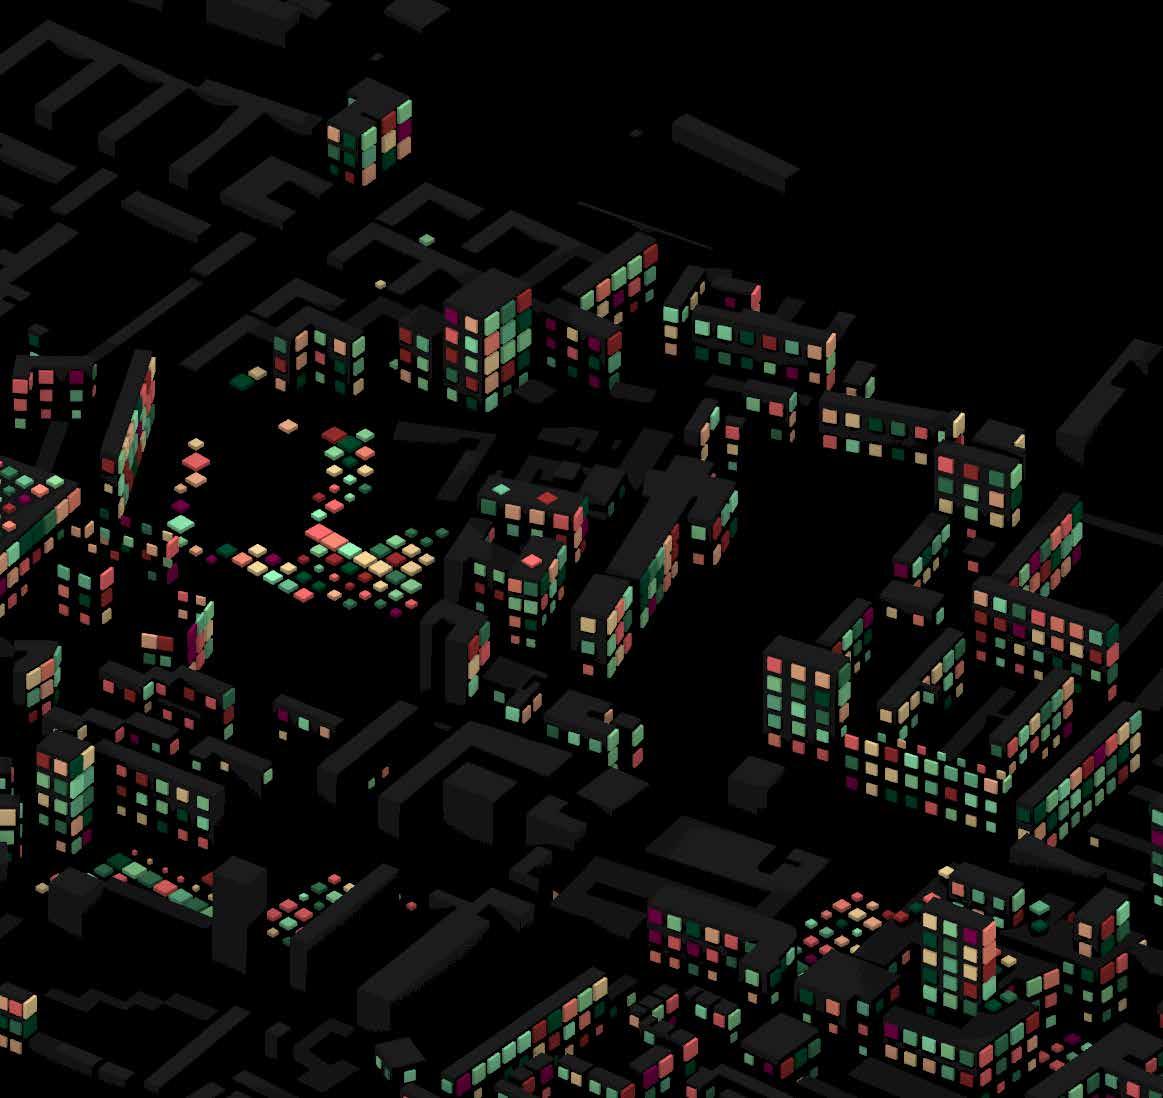
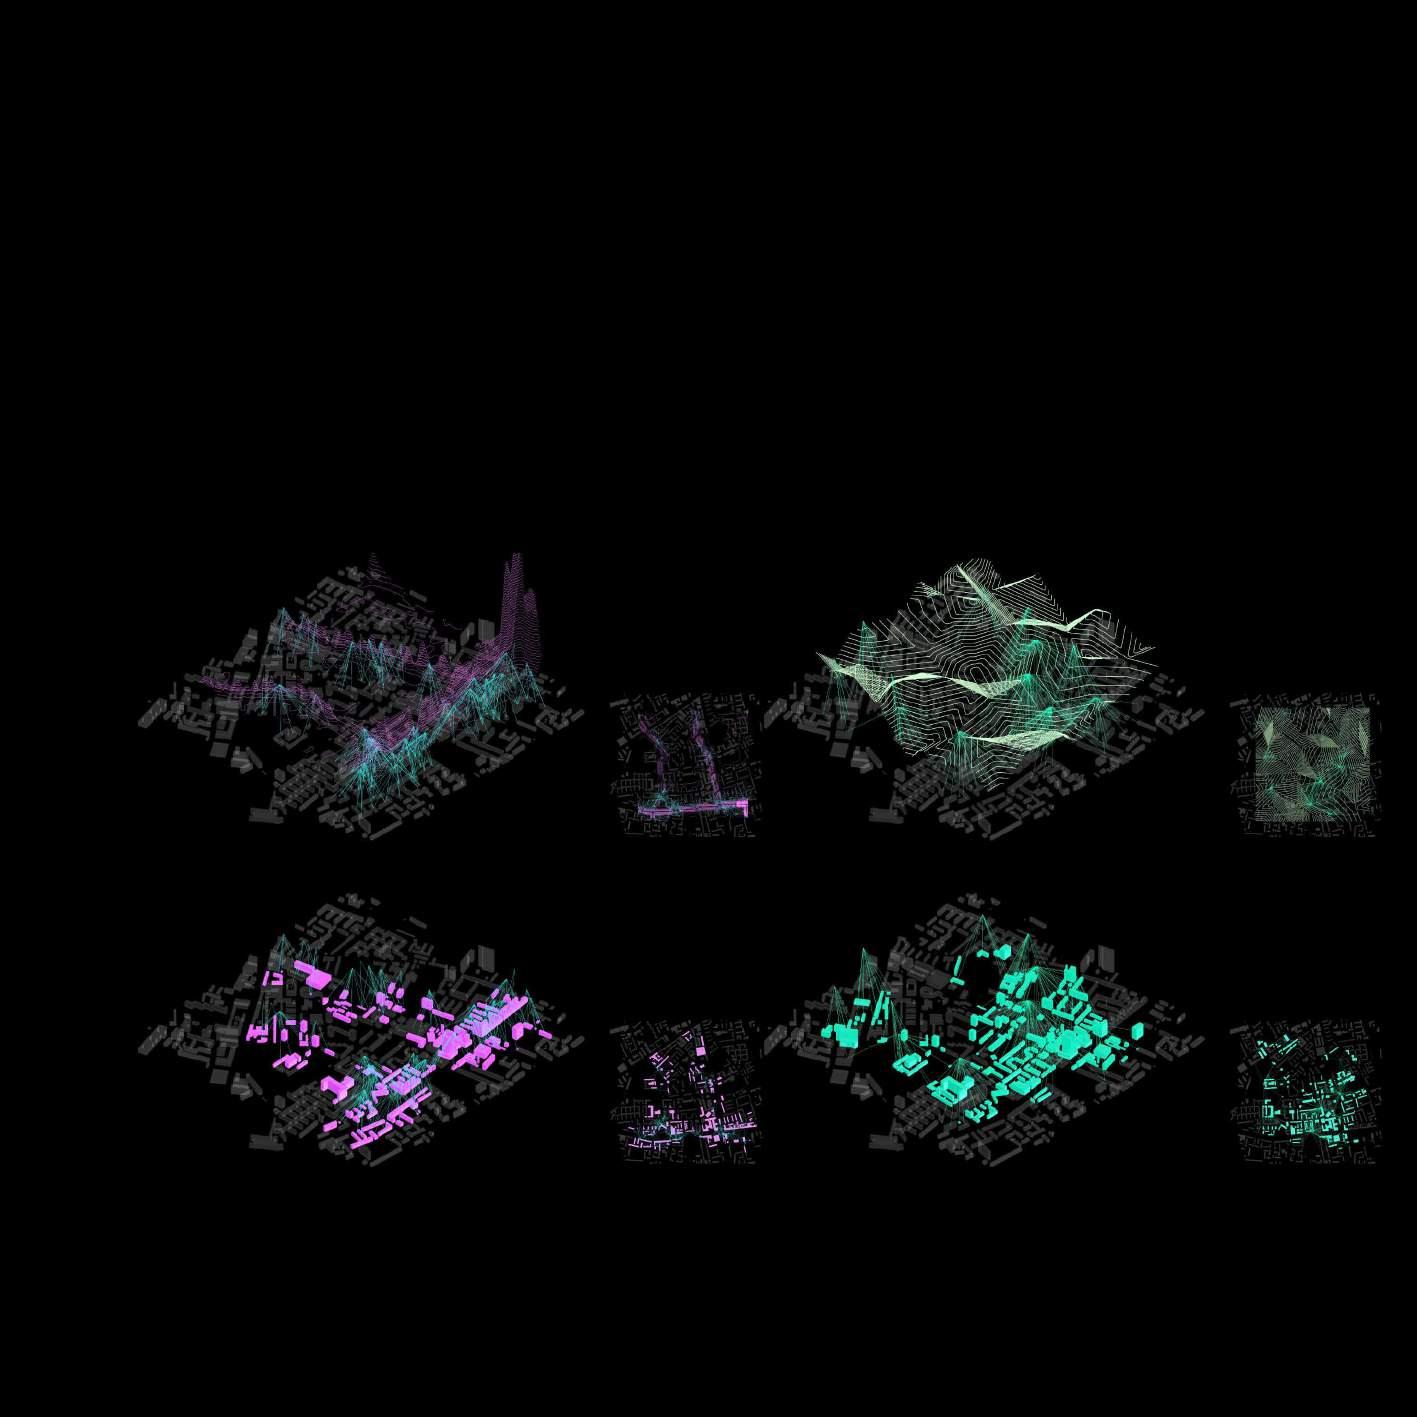
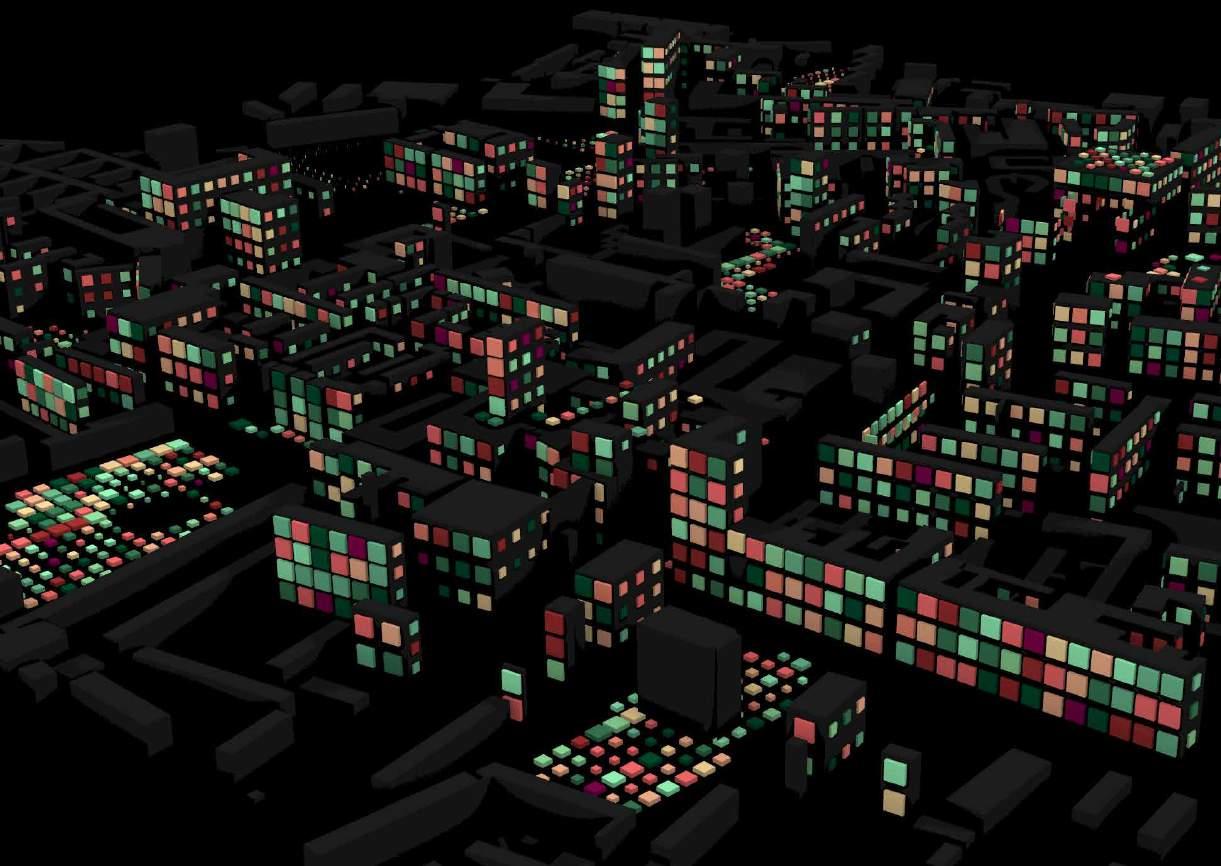
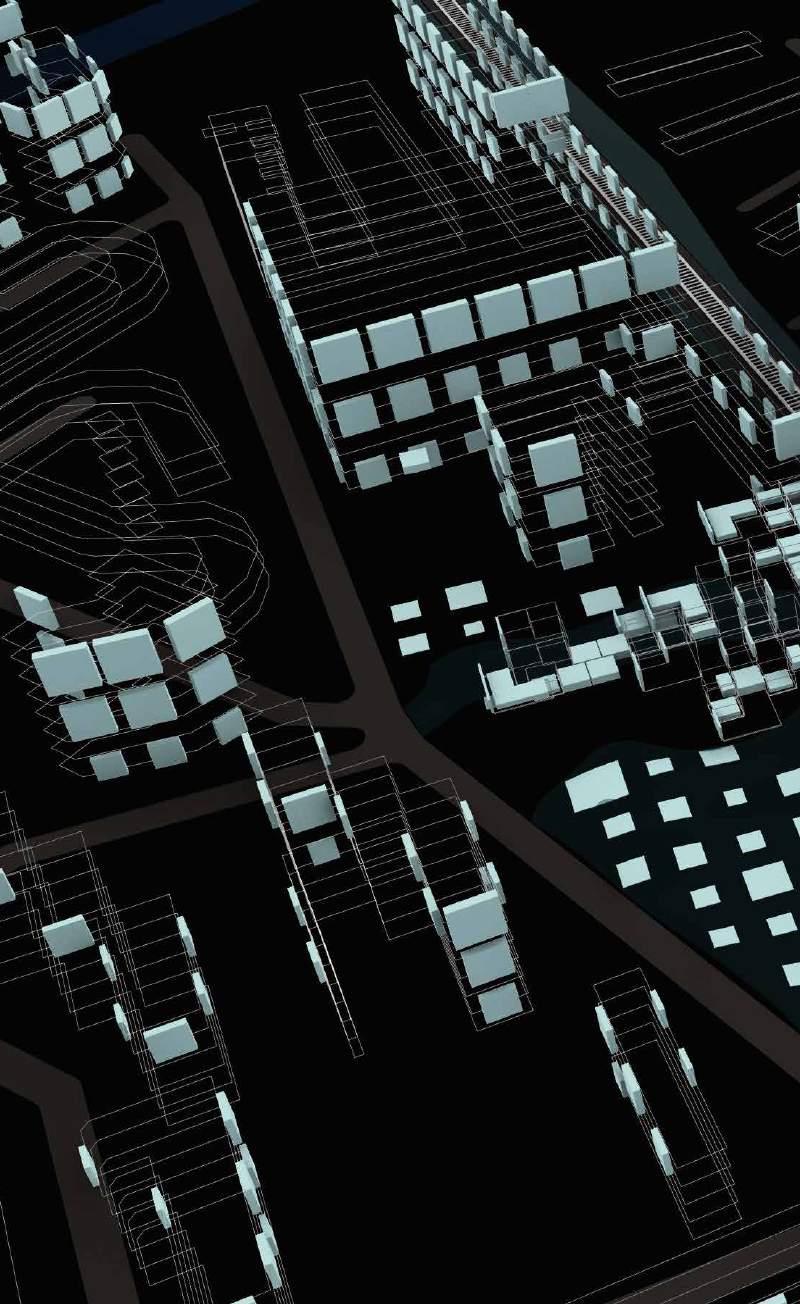
For proposing vertical farms, we start with finding buildings that are near a 100m radius to the highest values of NOx, highest values away from Shadow and Highest values of solar radiation. After obtaining the buildings, we run a simulation on Evolutionary Optimizer to check for the optimal height above these buildings according to the average sunlight hours throughout different seasons in the year. We apply the incident radiation to the optimal heights received and we zoomed in a bit more. We select radiation values between 3 and 5 to get the high radiation values for each square facade of the buildings. We then propose vertical modules that can help grow food by gaining an appropriate amount of solar radiation throughout the year. The size of these modules depends on the amount of radiation received by each square facade.
BUILDINGS NEAR NOX
BUILDINGS NEAR SOLAR RADIATION
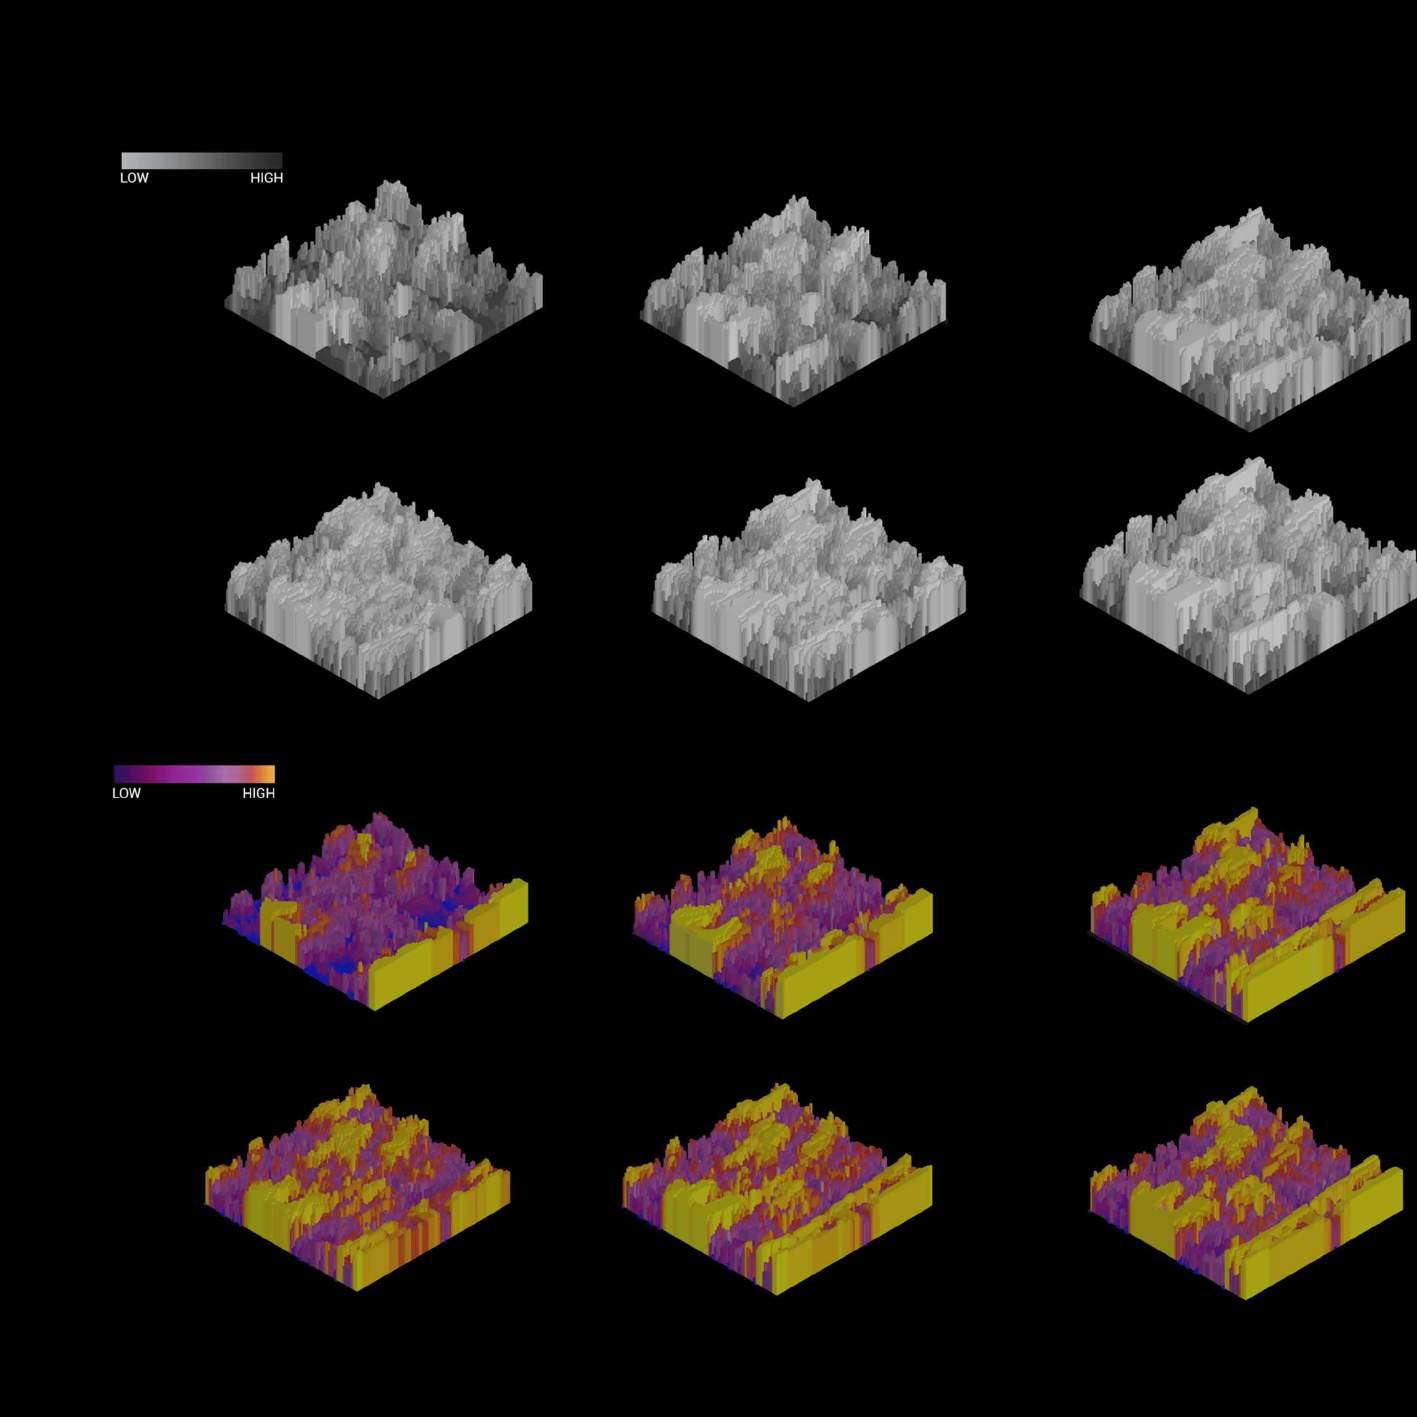
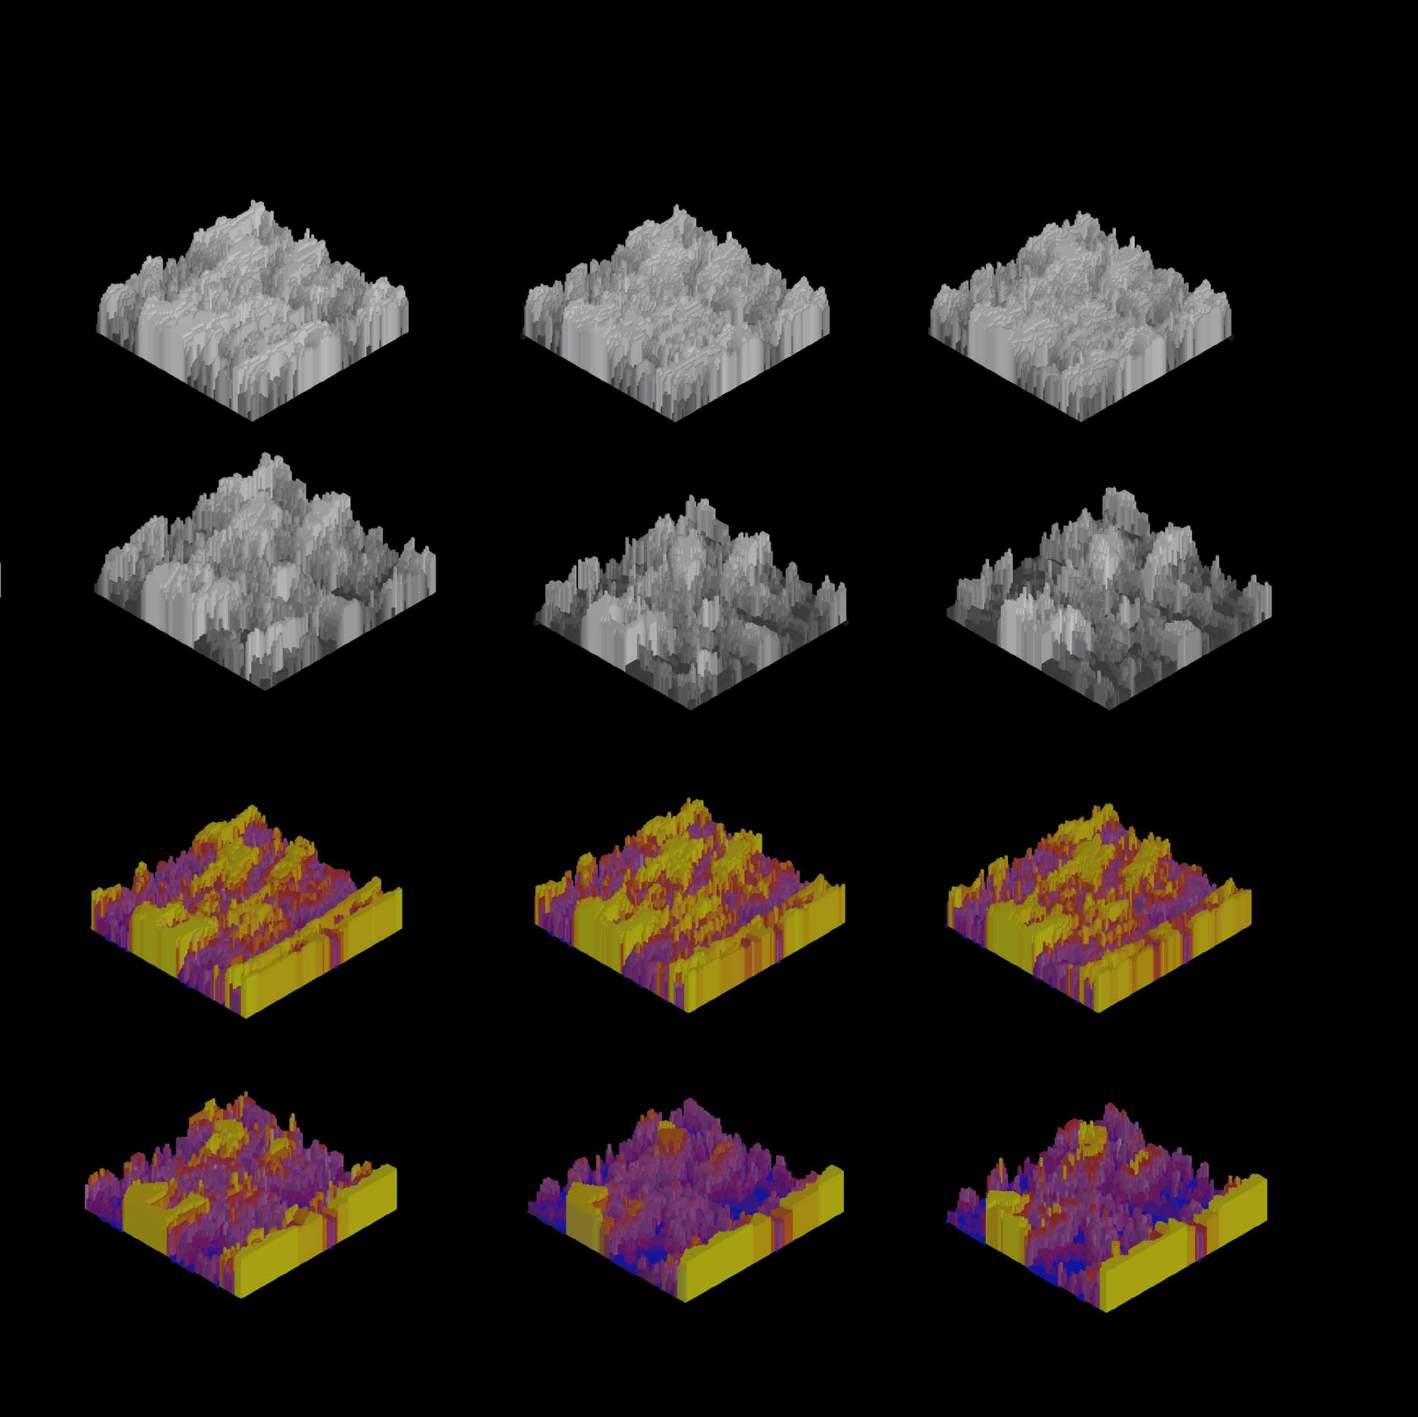
DESIGN STRATEGY | Proposing Vertical Farms
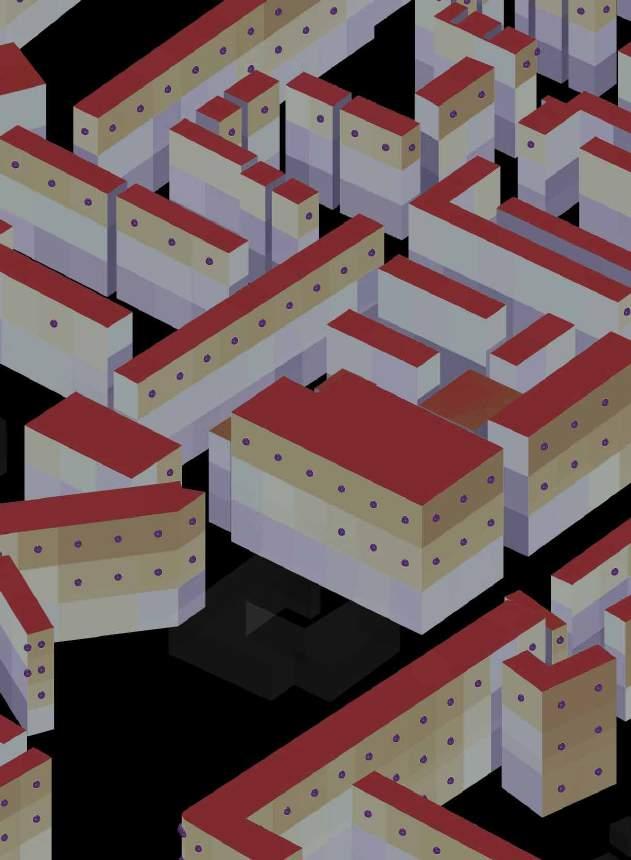
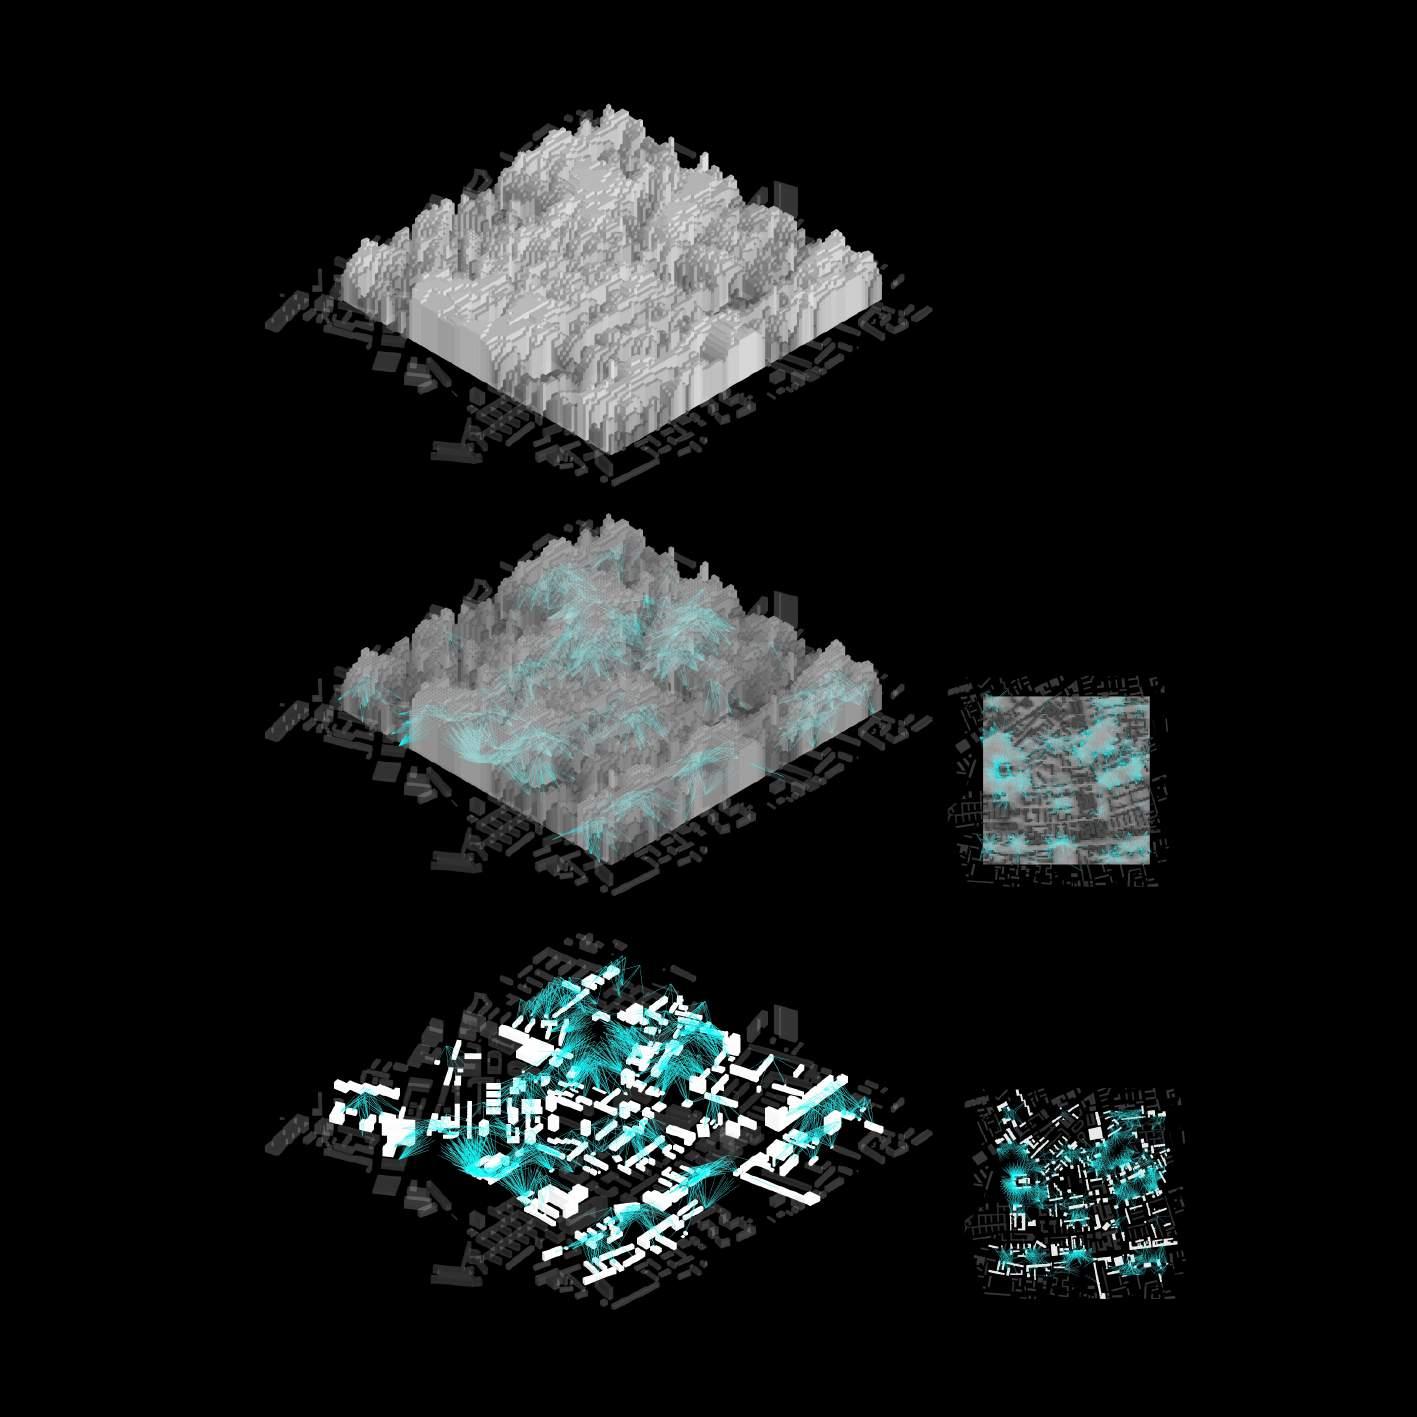
We first check for Optimal height (average sun hour for different seasons of the year) using Evolutionary Optimizer. Then we select incident radiation values between 3 and 5 on the facade. Incident solar radiation to normal refers to solar radiation falling perpendicular on a surface, ie, having an angle of 90 degree to the surface. Finally, we propose modules that can grow plants. Their size changes according to value of radiation.
OPTIMAL HEIGHT - EVOLUTIONARY ALGORITHM
INCIDENT RADIATION
PROXIMITY OF FACILITIES
DESIGN STRATEGY | Agro-Matrix Script (Production, Consumption And Recycling)
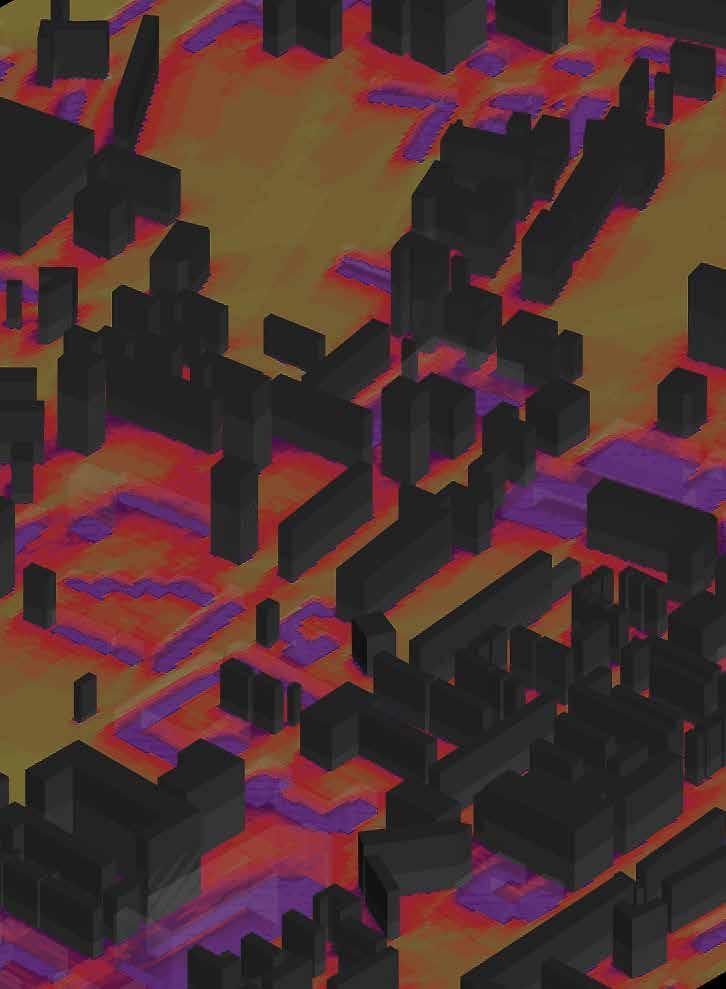
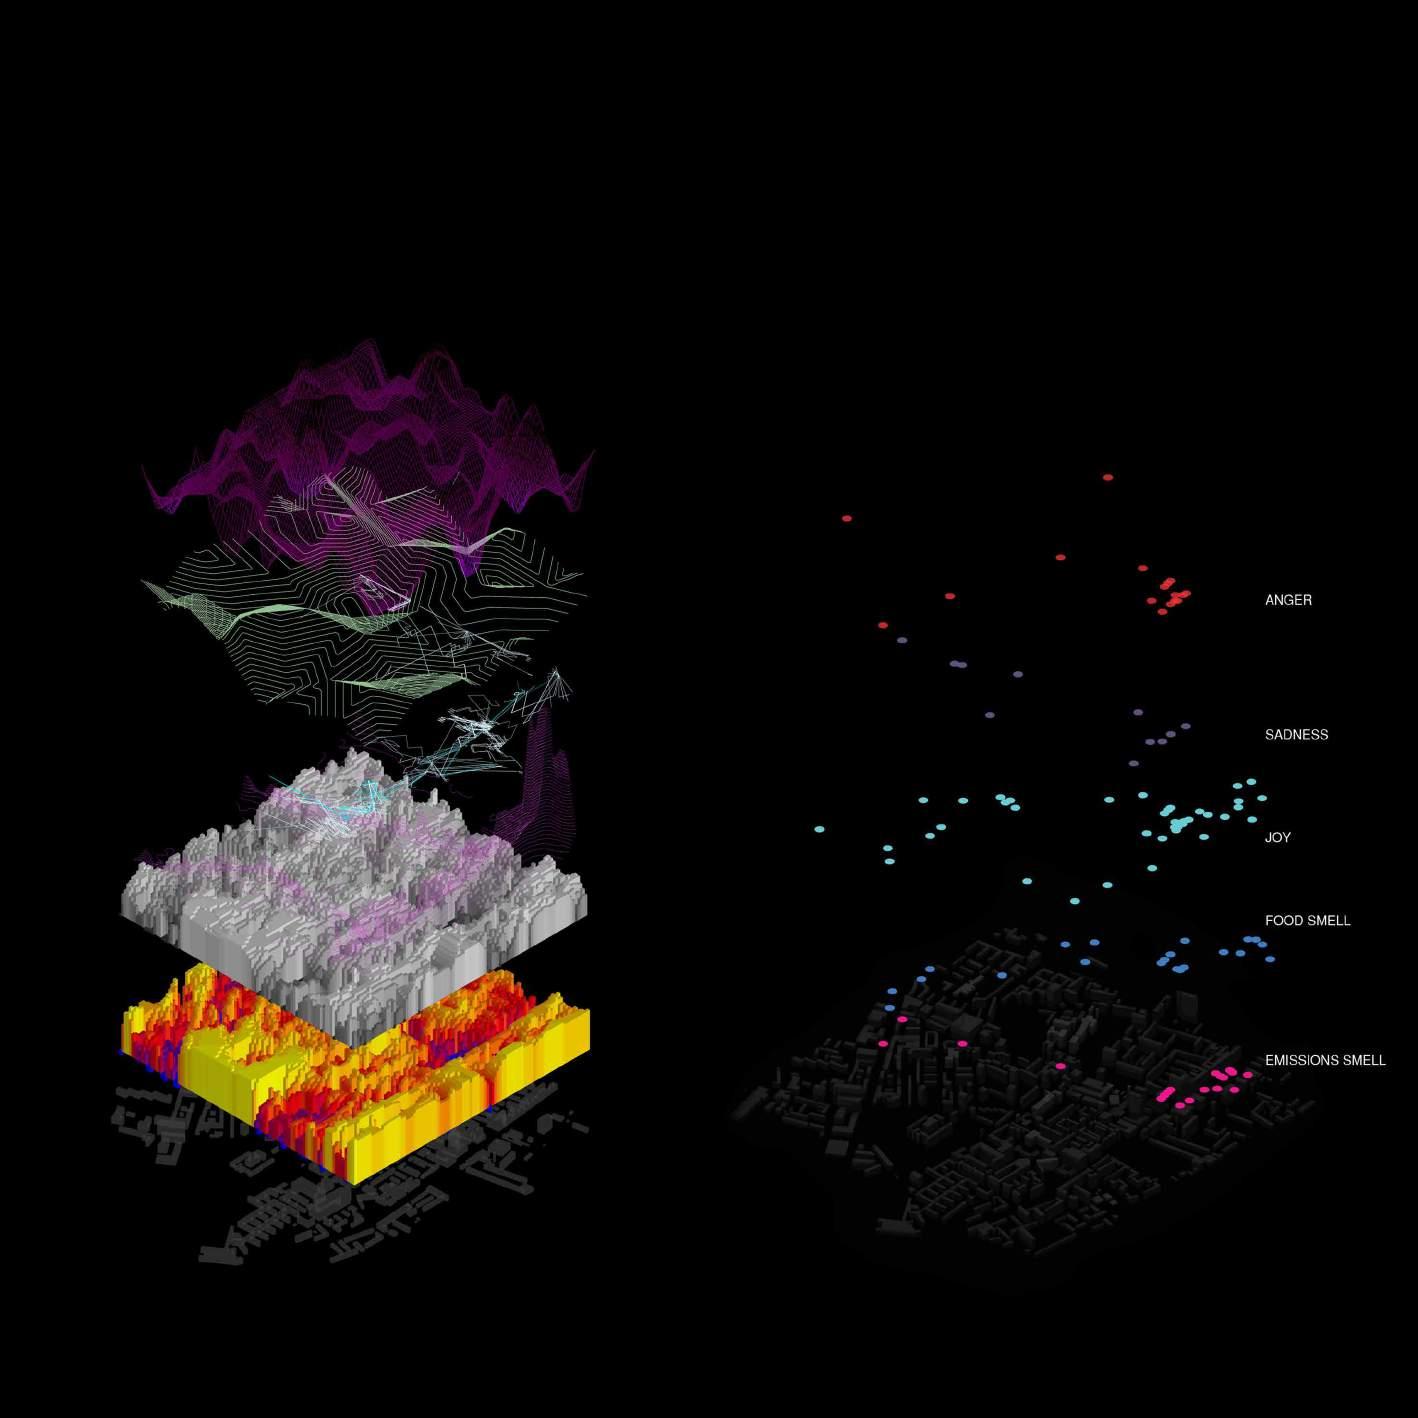
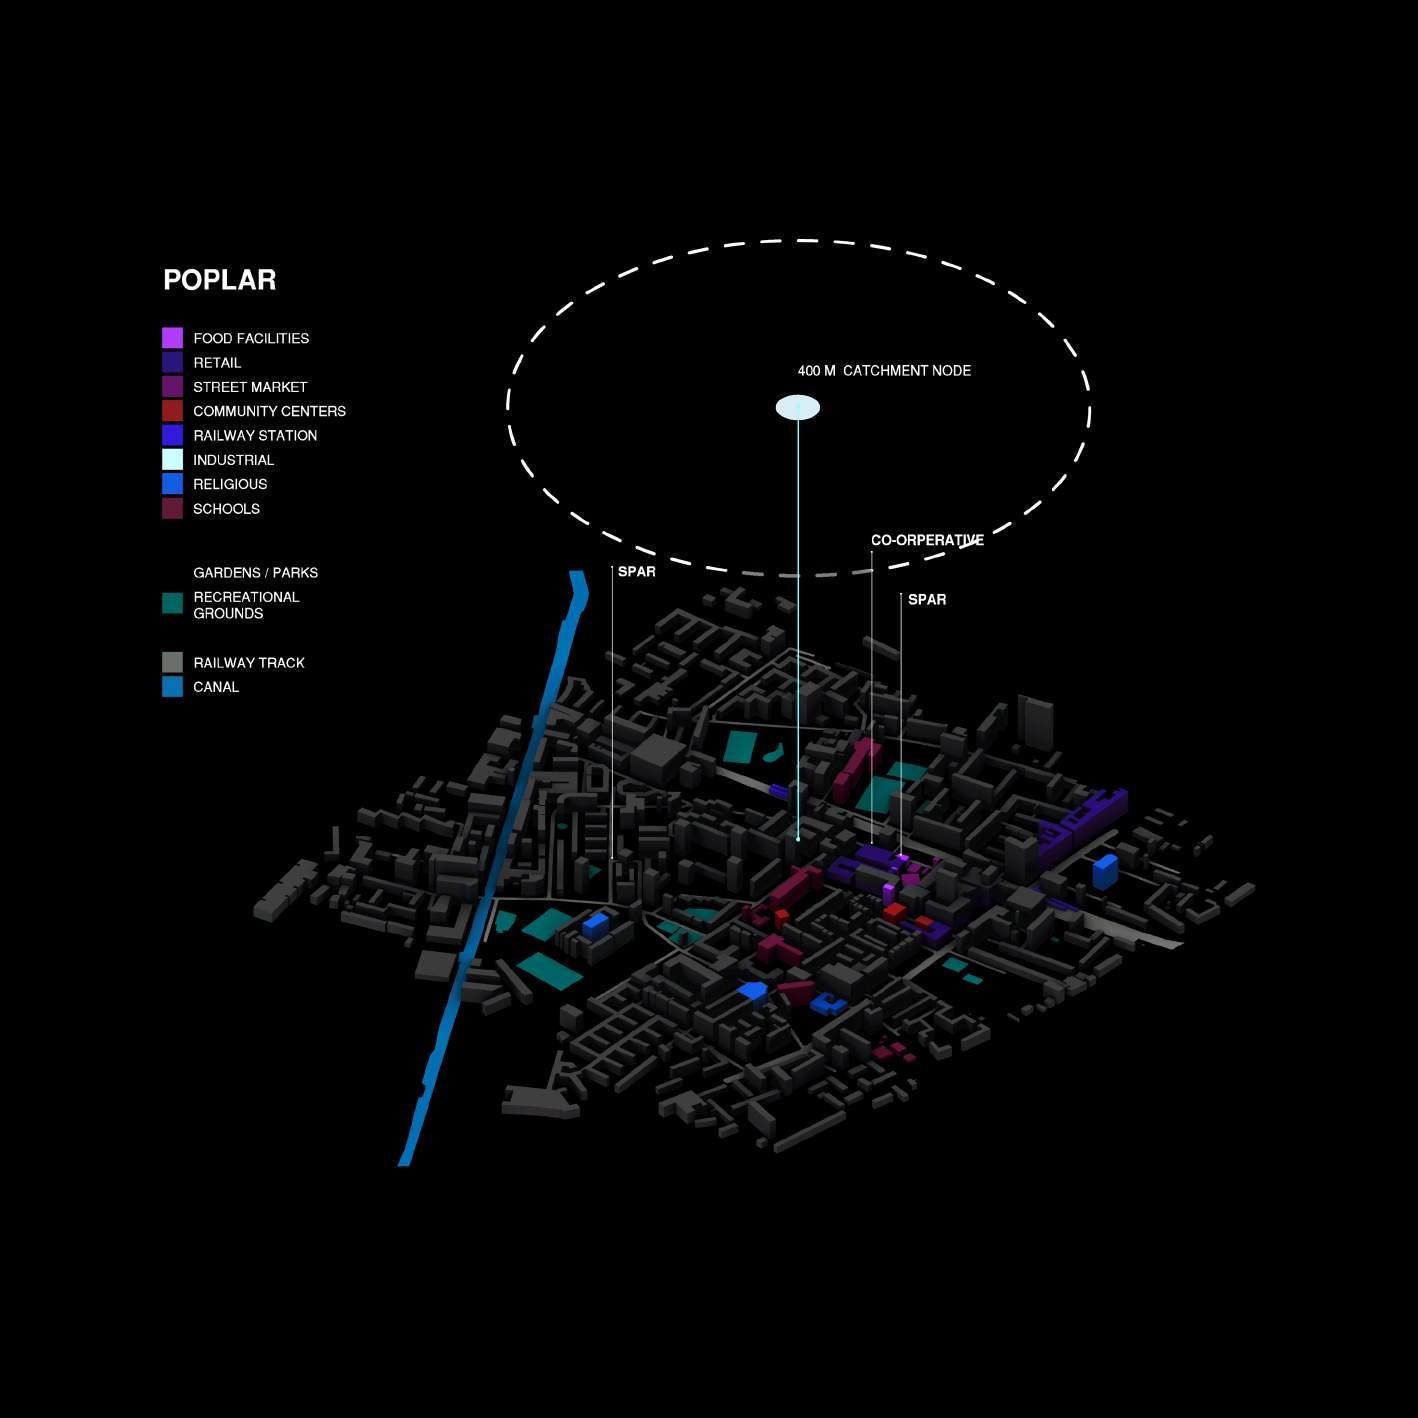
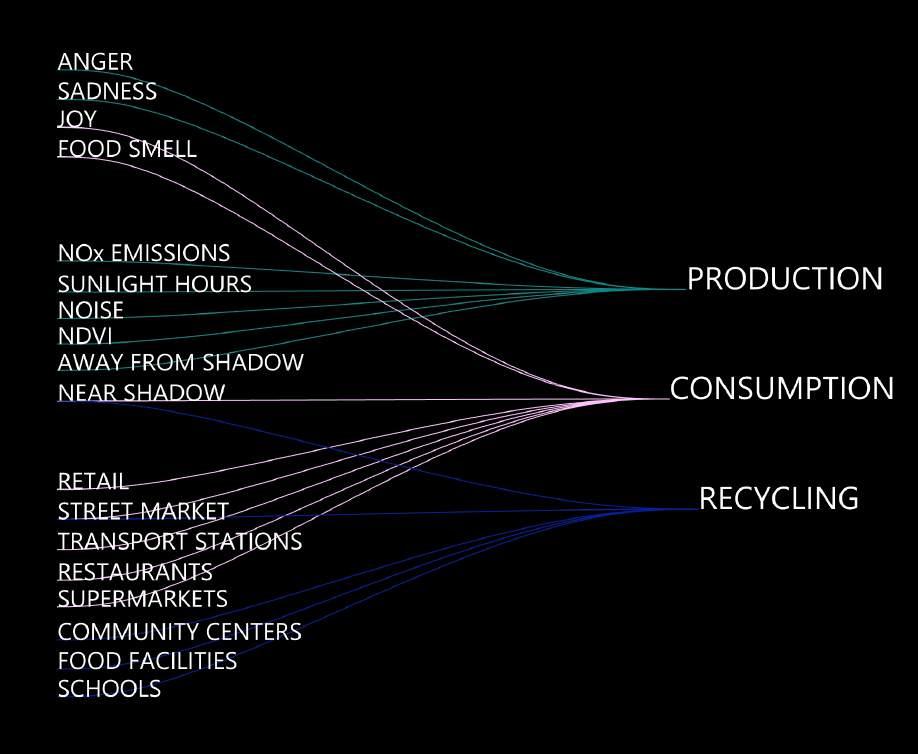
We wanted to locate Production areas that are near : Anger (associated lack of nutrition), sadness (green spaces will improve mental well-being), sunlight hours (to go food), noise (for plants to absorb sound) areas away from Shadow and NDVI.
For Consumption areas we wanted them to be near: Joy, Food smell, areas near Shadow, retail spaces, street markets, transport stations for better accessibility, restaurants and supermarkets.
For Recycling areas we wanted them to be near: Areas near Shadow, retail, street market, community centres, food facilities and schools (for promoting recycling activity).
After putting in these objectives we use Wallaci to decide t the optimal location for our PCR points in the city.
EMOTIONS AND SMELL
PROXIMITY OF FACILITIES ENVIRONMENT SIMULATIONS
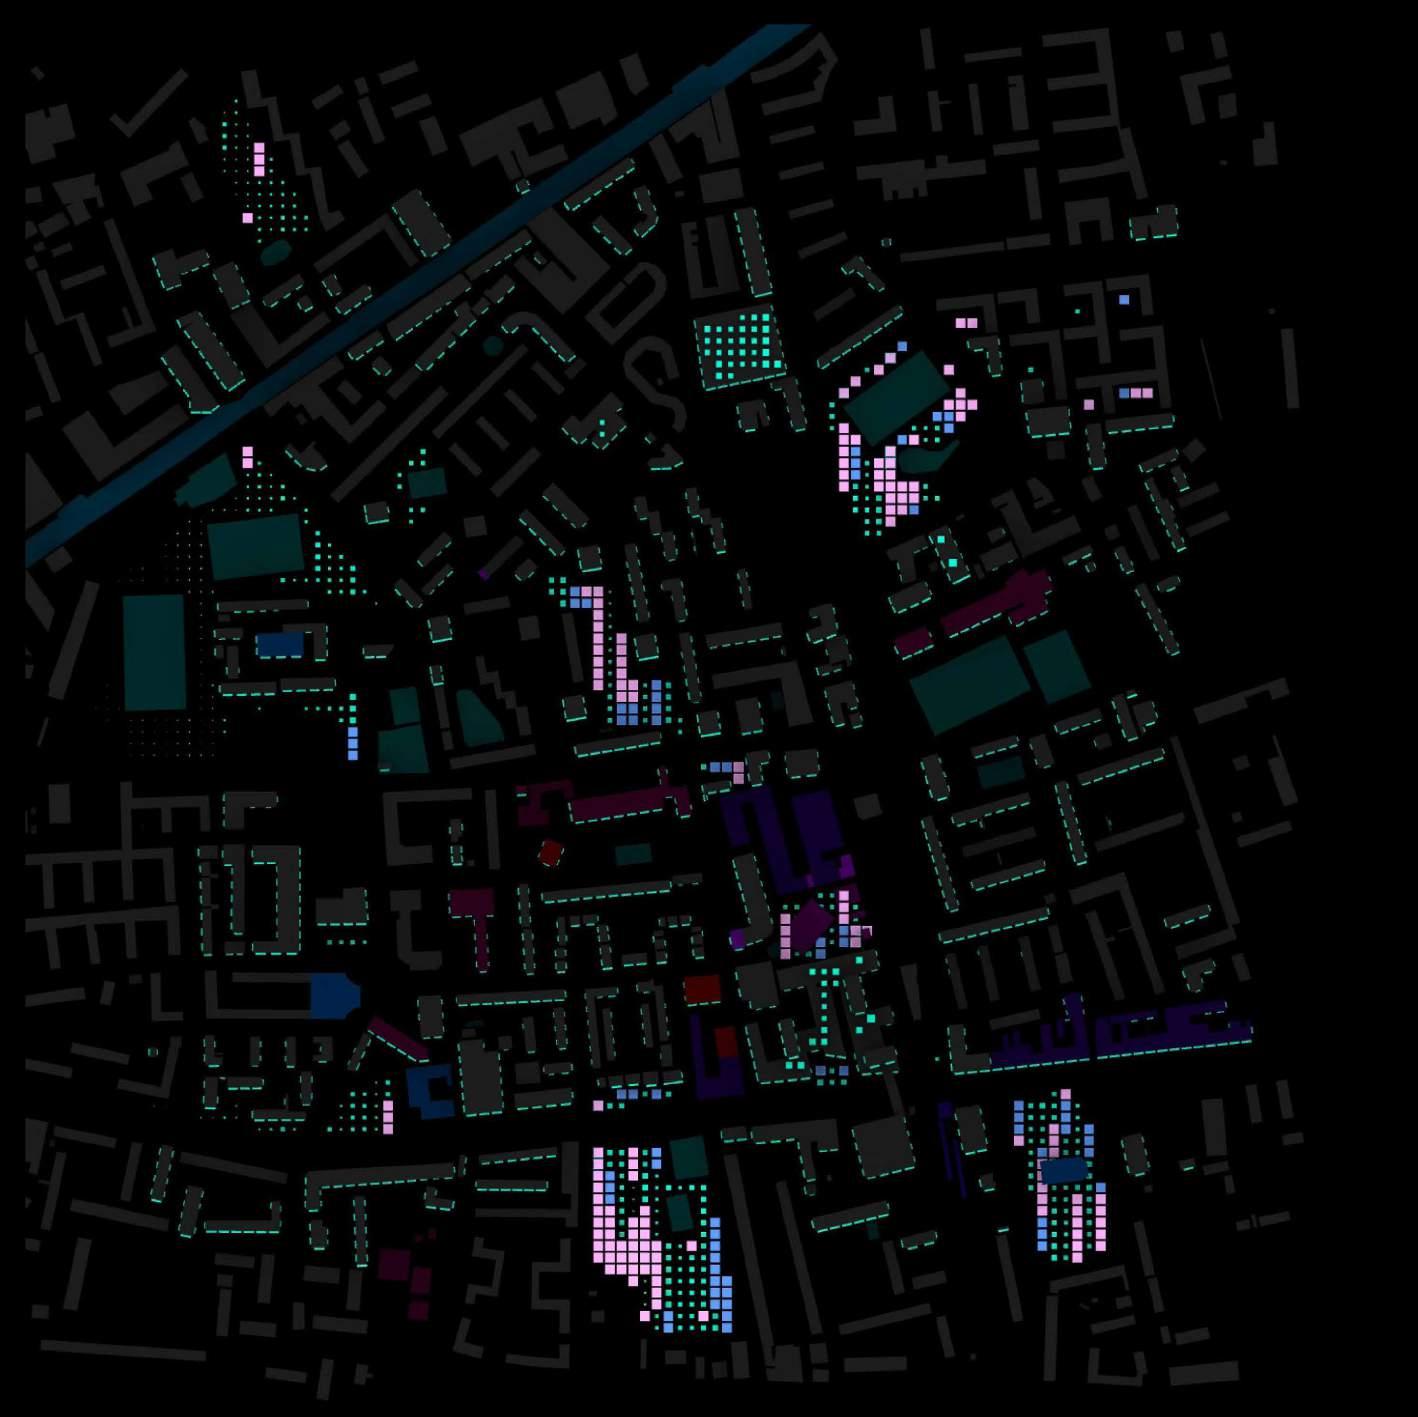
PRODUCTION CONSUMPTION RECYCLING
LANGDON PARK PRODUCTION: ON-GROUND
P.O.S
LANGDON PARK CHRISP MARKET
POPLAR RECREATIONAL
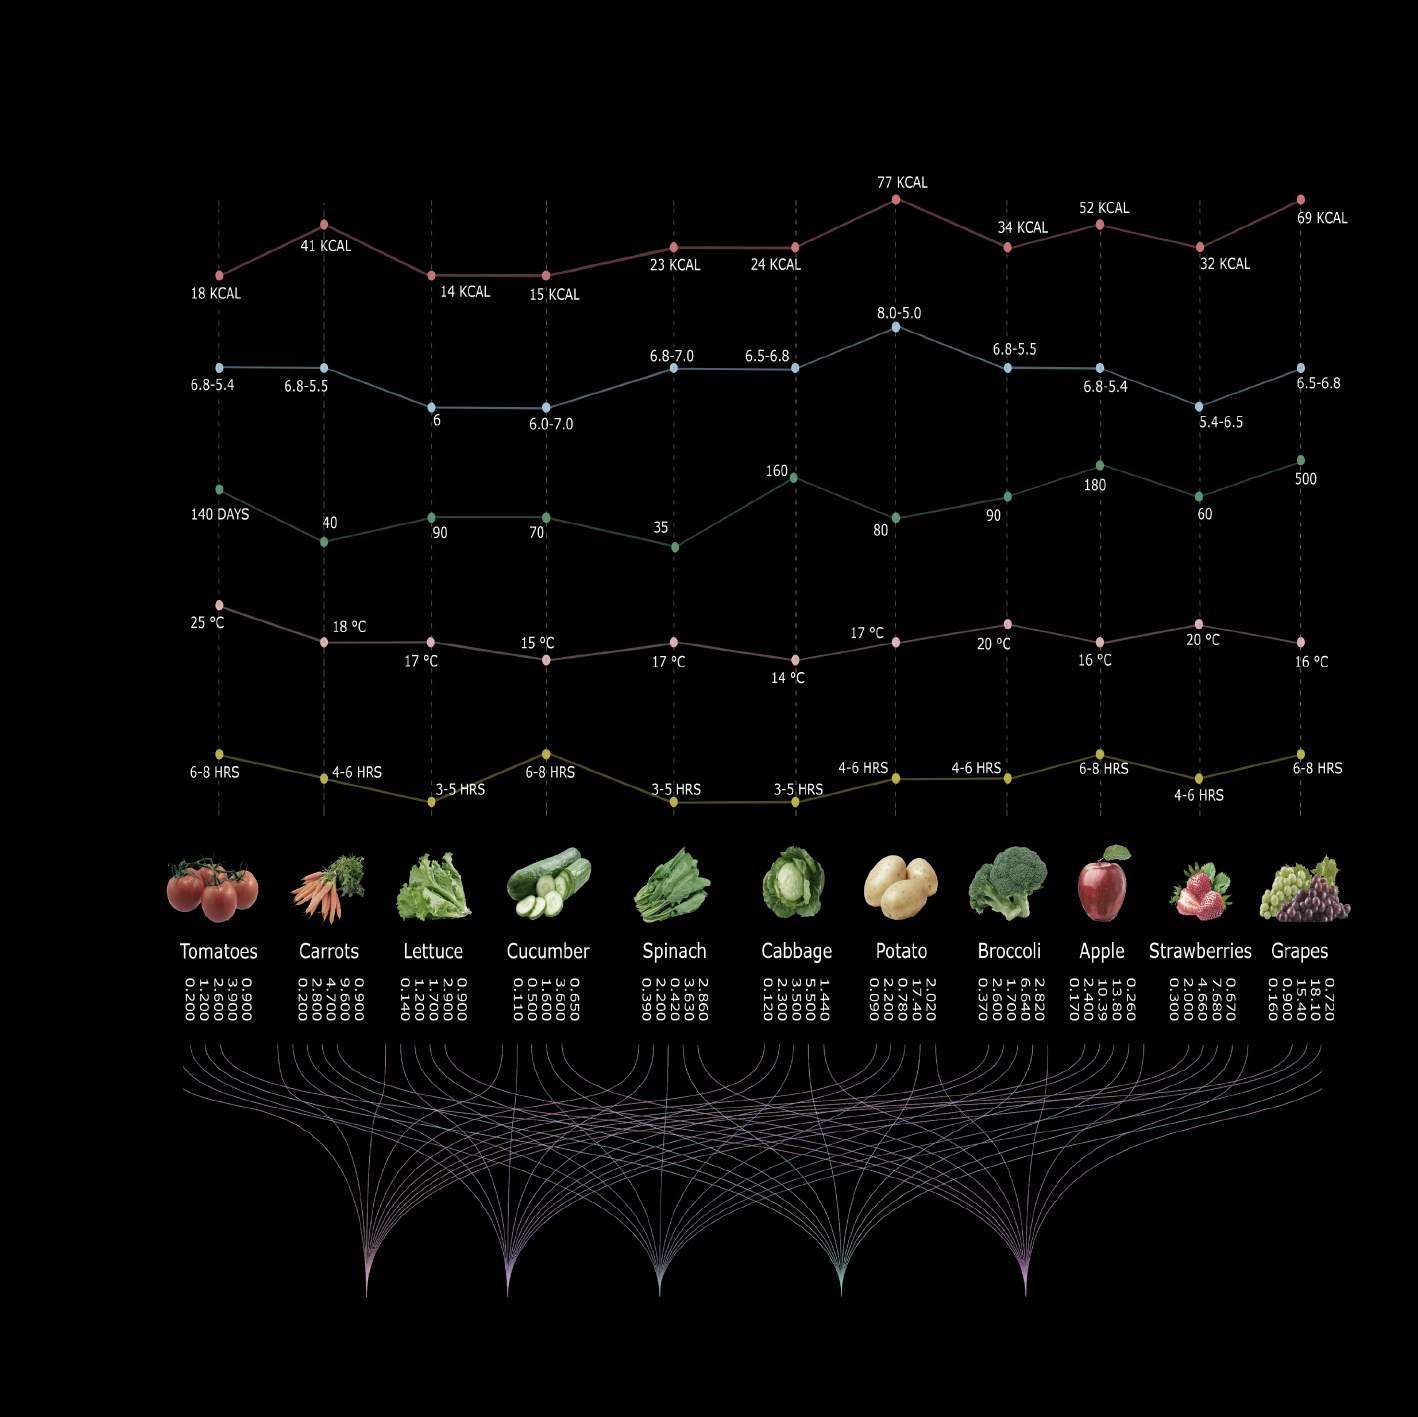
DESIGN STRATEGY | Food Study Requirement Crop
 Carbohydrates Sugar Protein Fats Fibres
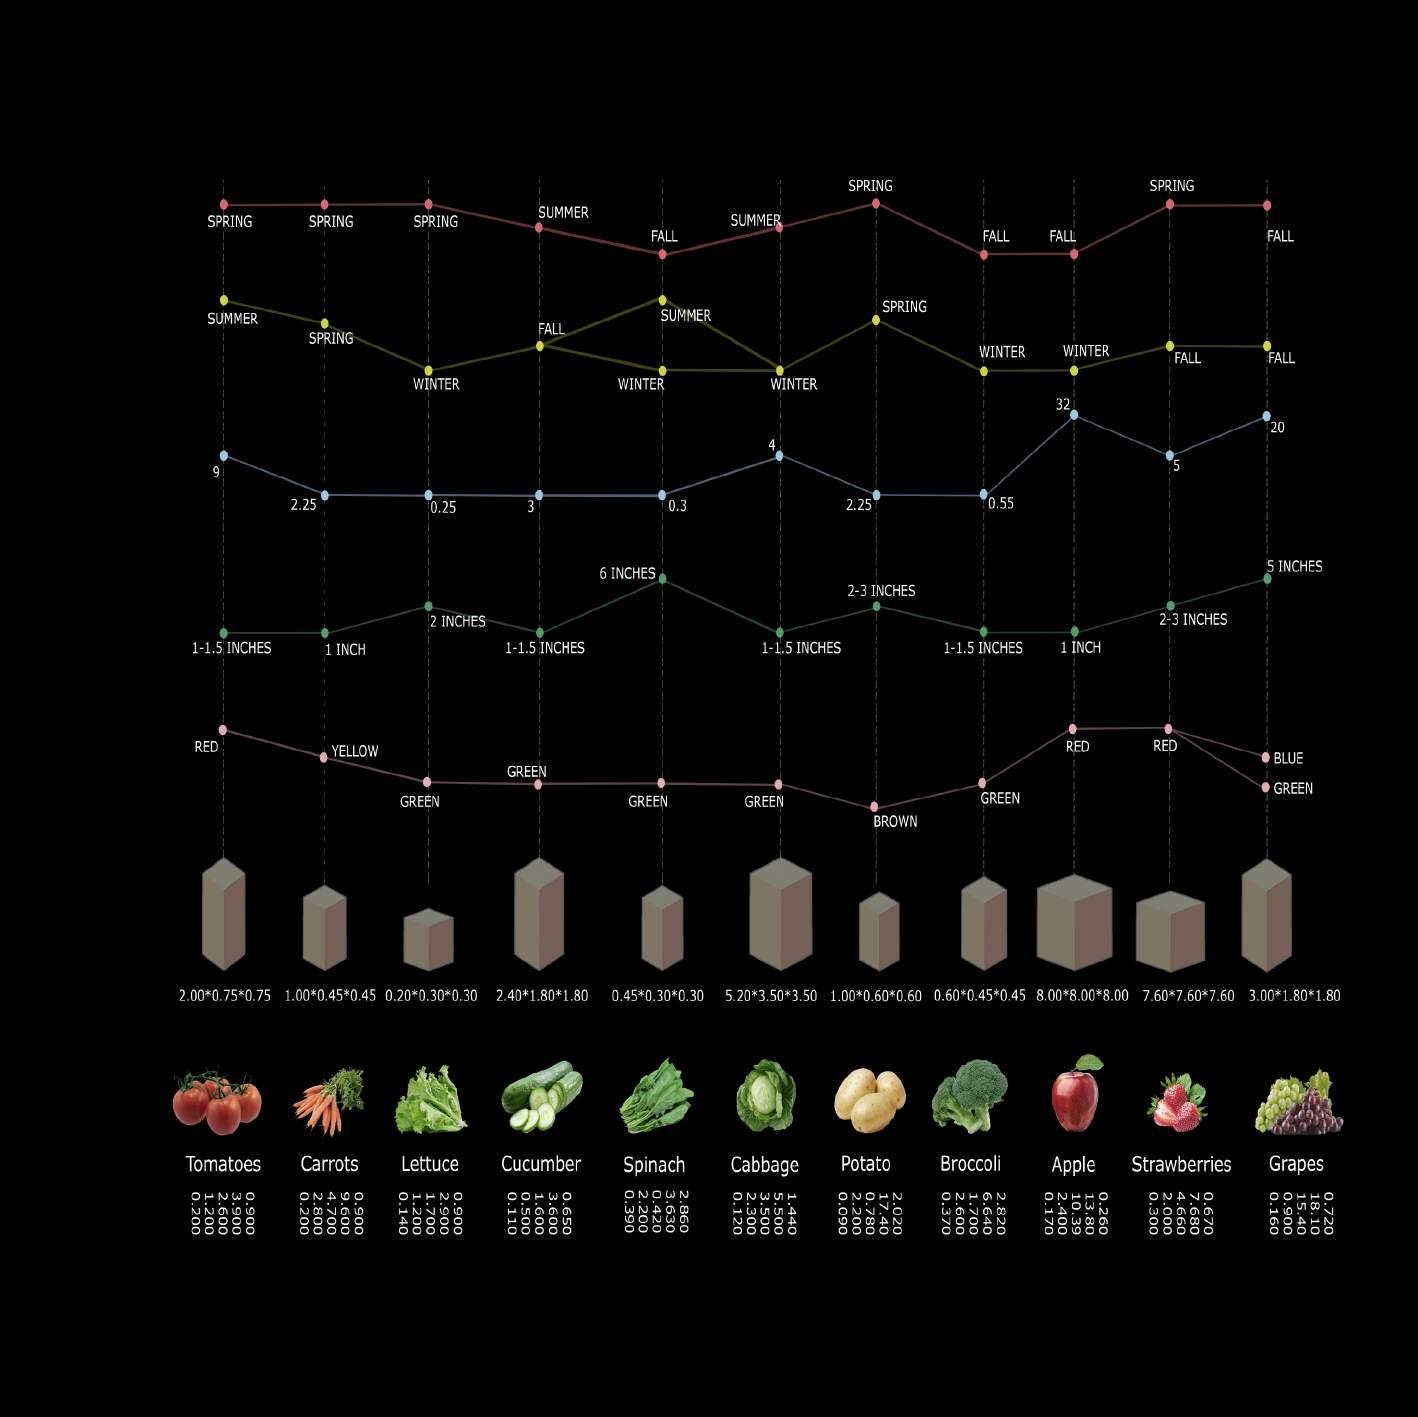
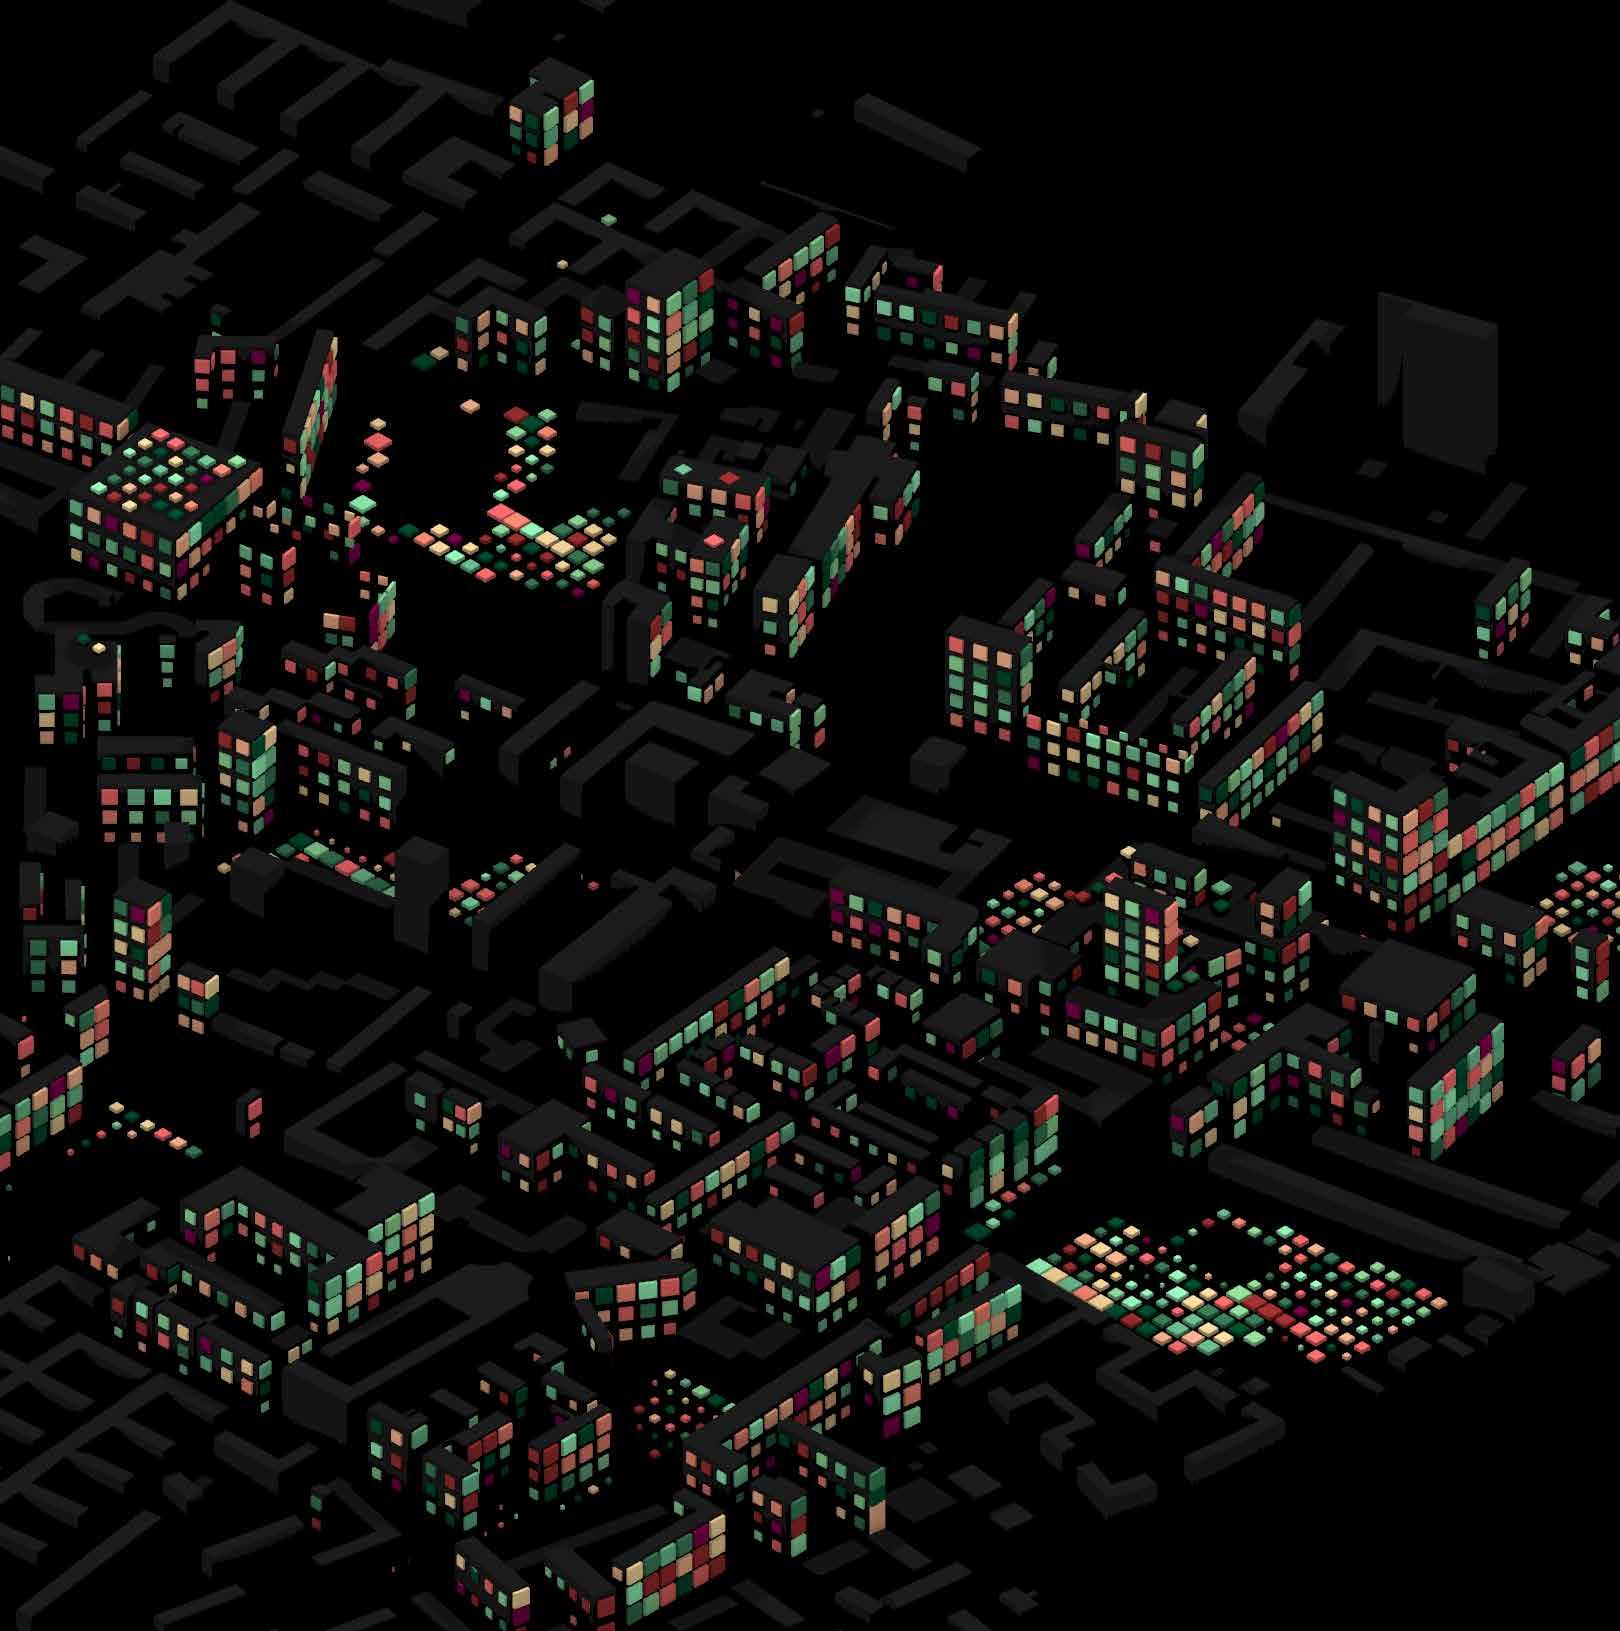
A new evolutionary algorithm is created using the production Grid from the PCR script, and it takes four objectives into account.
- Each cell requires one hour of sunlight every day.
- Daily Relative Humidity Requirement
- Day-to-day Temperature Requirements
- Volume of live space per cell
Each food crop has various requirements, and by including those criteria into the Script, we may identify multiple iterations of the most likely options for which crop will work best in a cell.

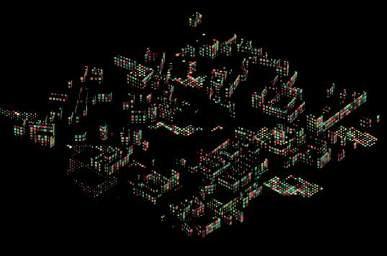
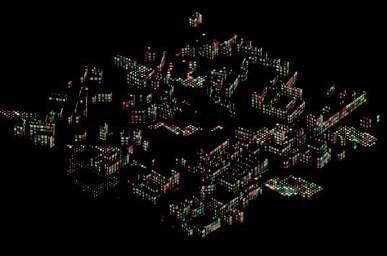
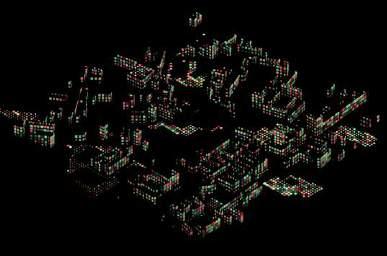
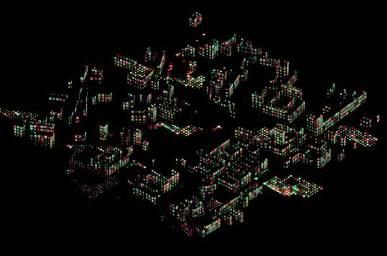
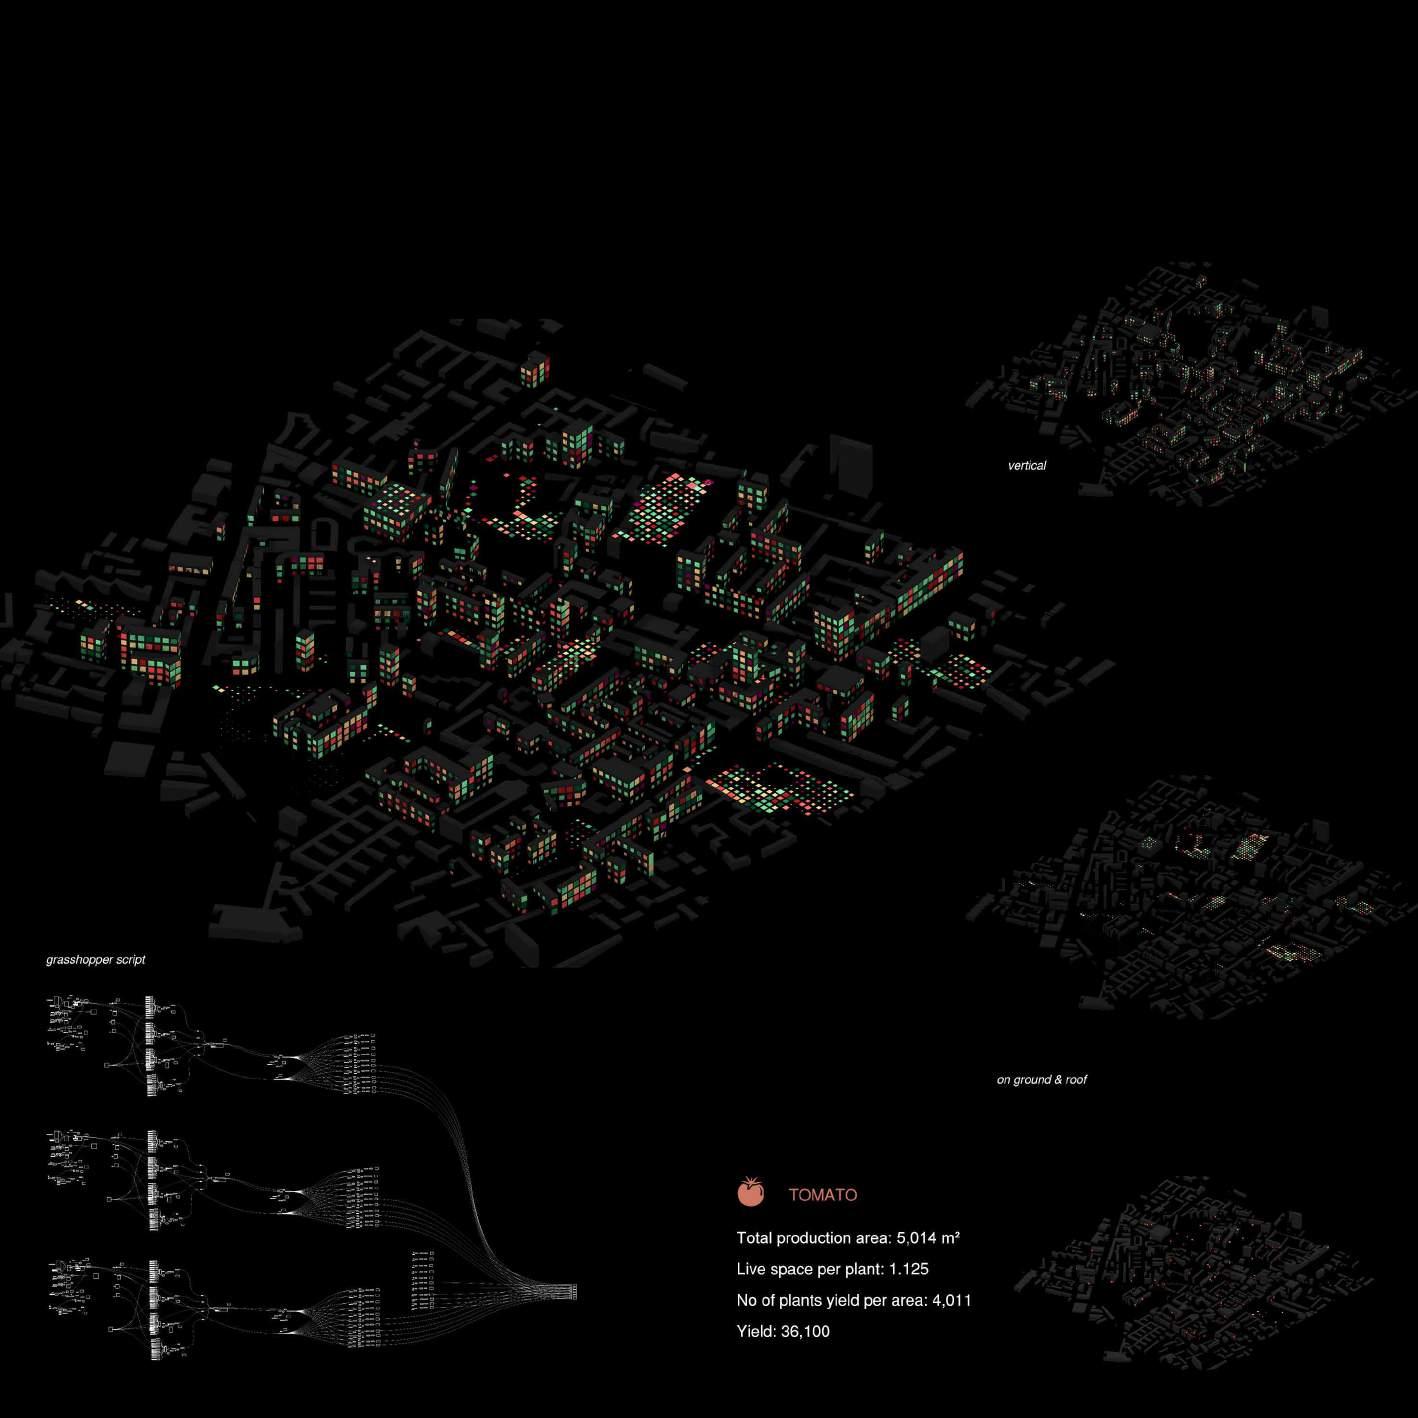
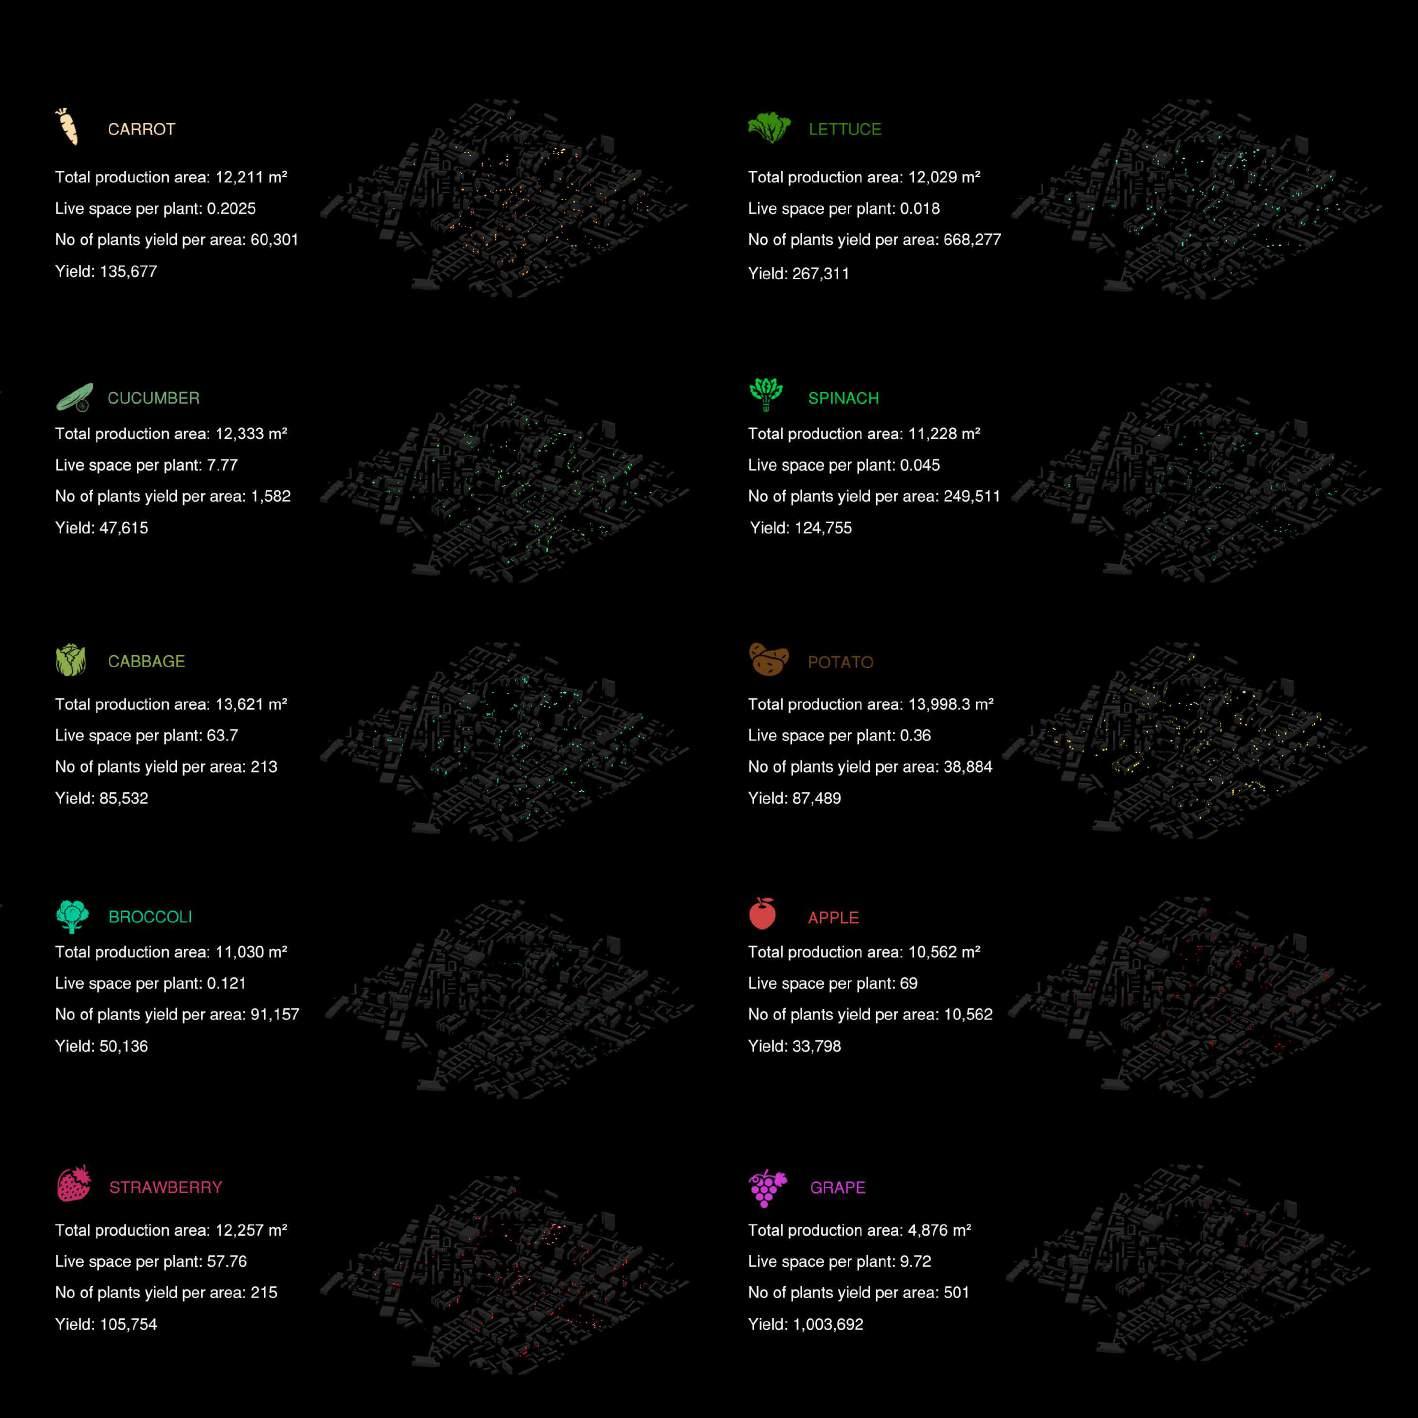
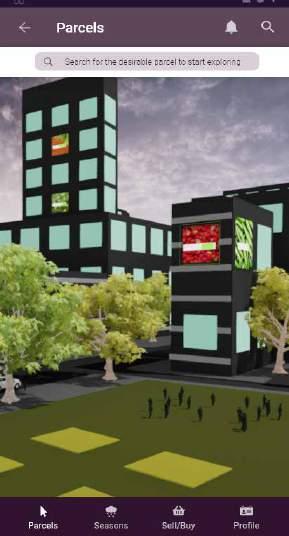
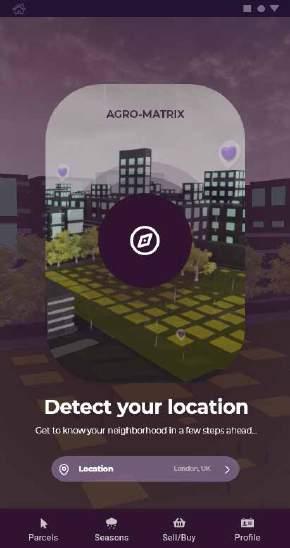
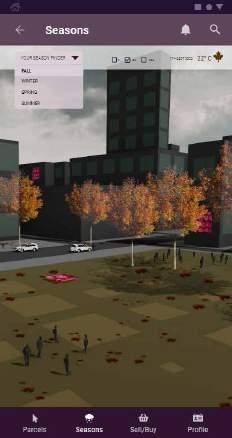
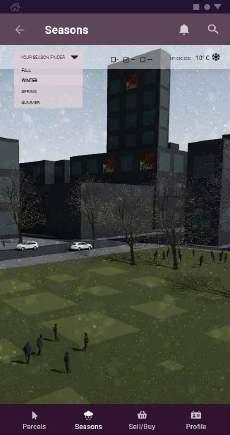
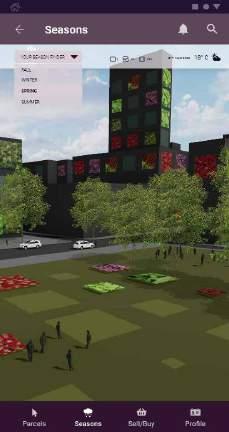
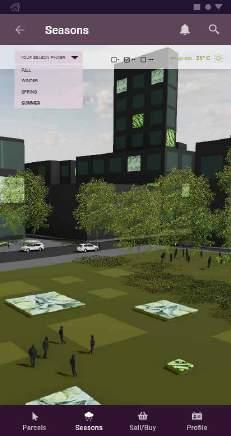
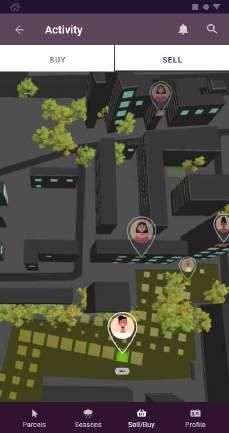
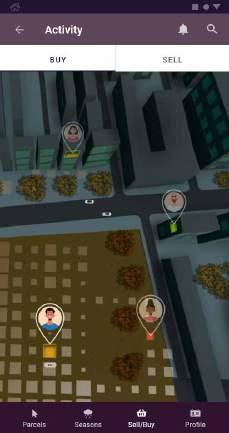
The app’s primary goal is to locate places where food may be grown and markets where food can be purchased. Using external parameters like sunlight hours, Humidity, and crop Lifetime, our Agro-Matrix algorithm helps the user identify the best crop to plant on a parcel of land. Users can select any Parcel of land in the area and explore the crop type. Another feature of the app will be selecting crops based on the seasons.
Welcome to AgroMatrix
Detect your location

Explore your parcels


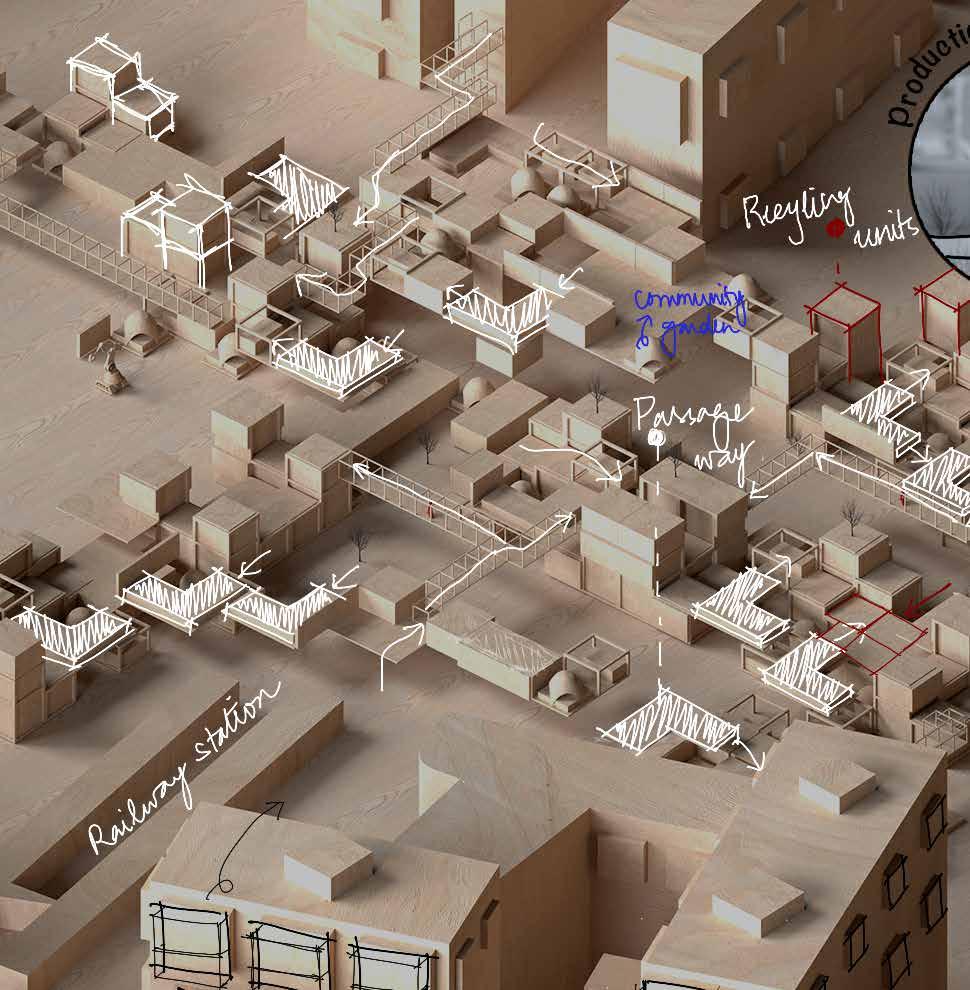
FOOD ORIENTED NEIGHBOURHOOD DEVELOPMENT
This part shows our design strategies for our ideas: Consumption, Recycling and Production areas for Roof, Elevated, Vertical, On ground Farming.
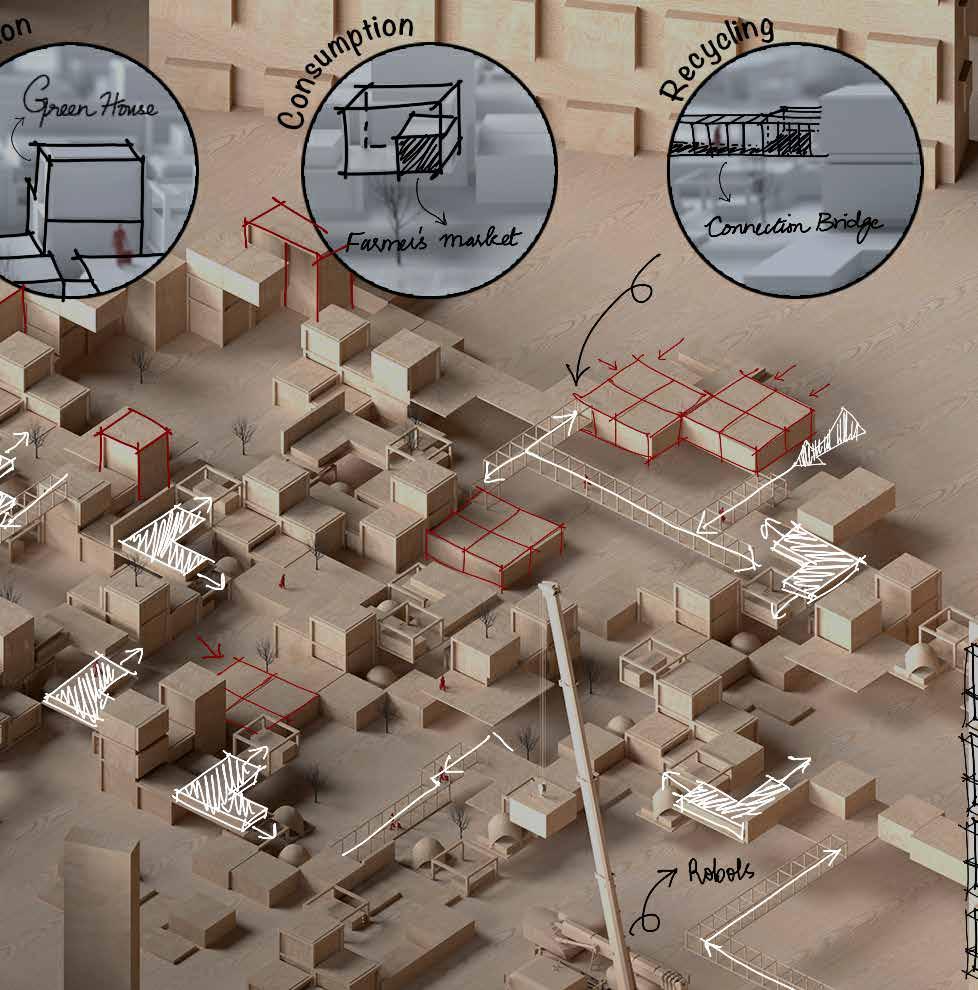
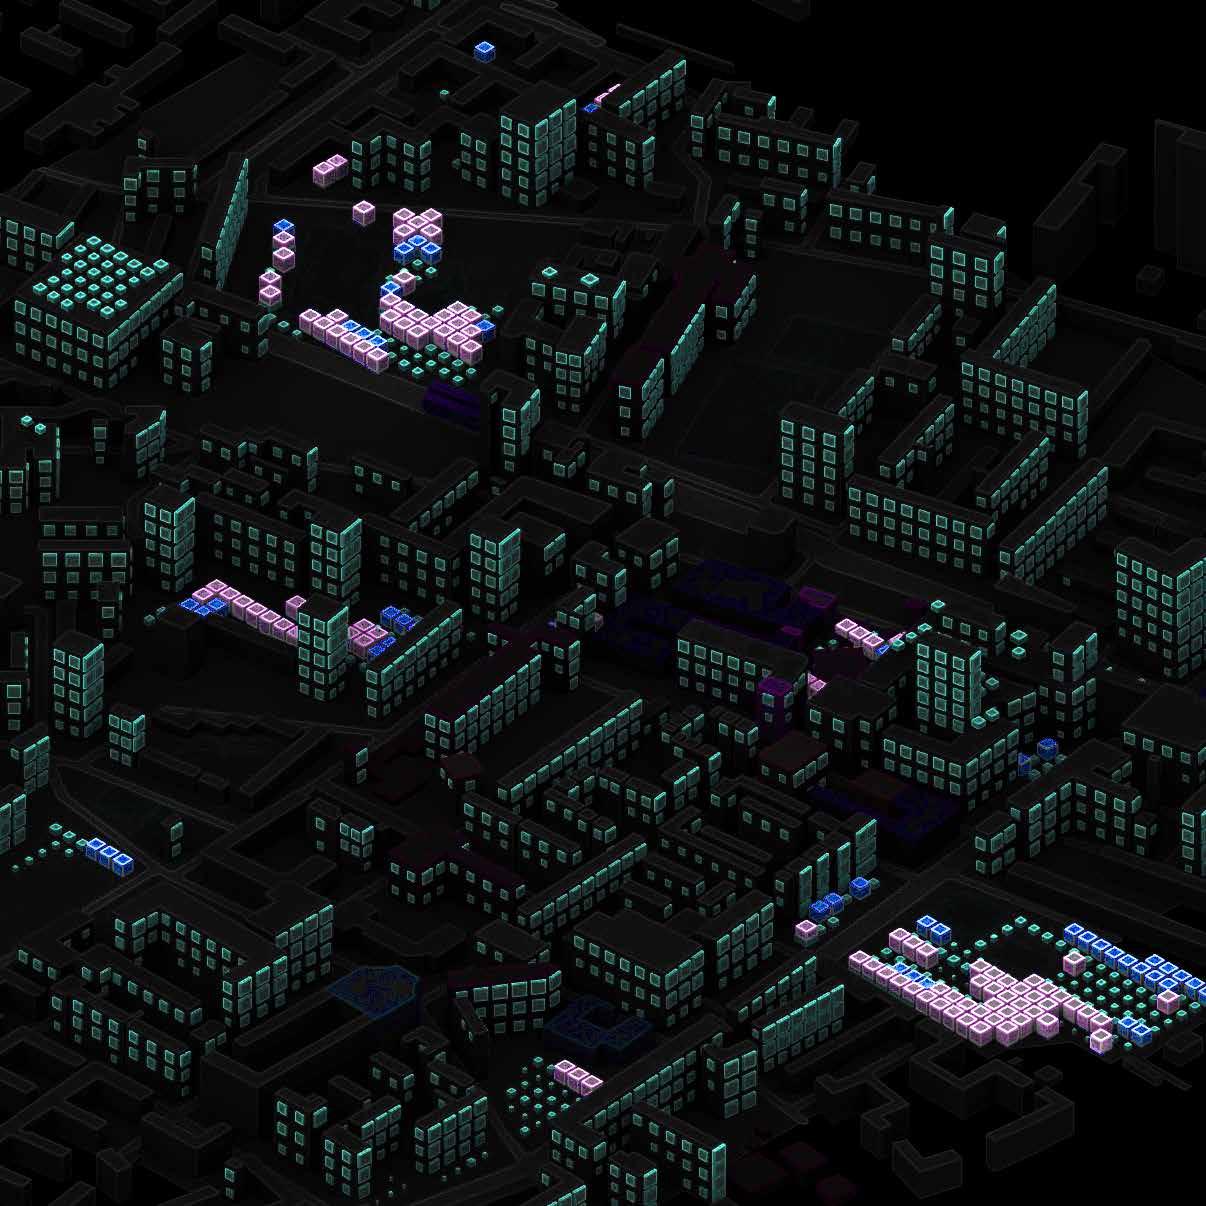
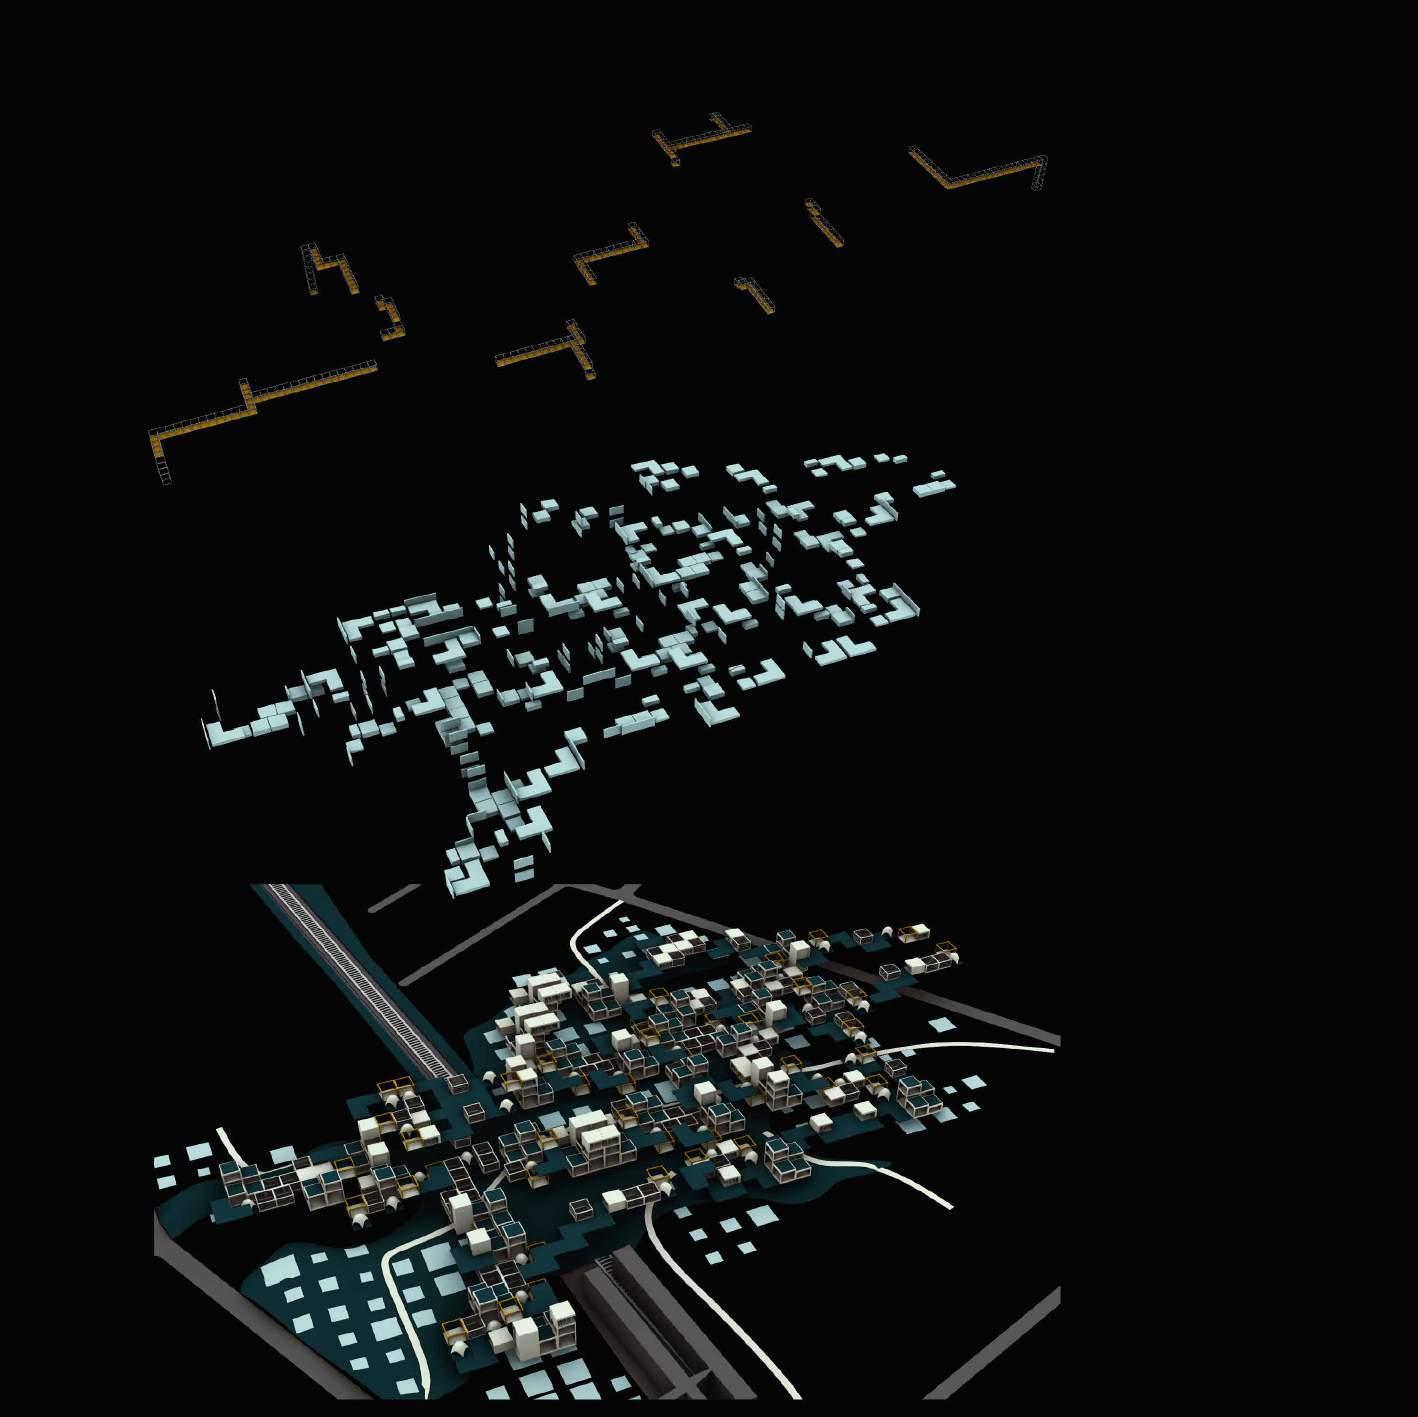
Zooming into Langdon Park because of its connectivity to underground station, Bus stop and nearby community resedences. Creating a food network that is acceseble from all types of transport system.For our intervention proposal, the plan was to integrate food into the city in form of a food network. From integration points, points away from shadow and production cubes we formulated a network of lines using the woolly algorithm.
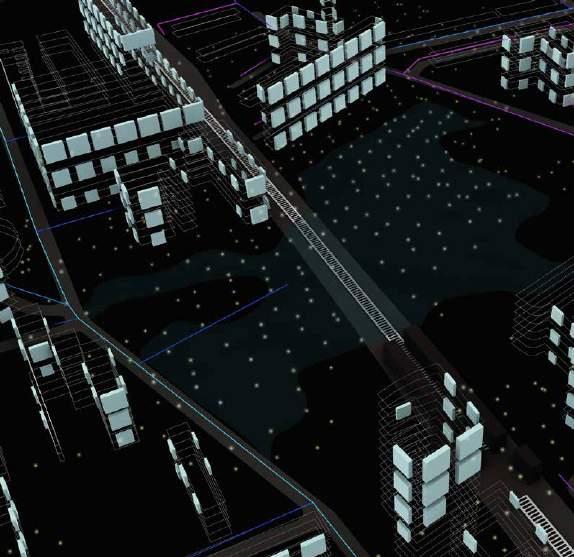

LANGDON PARK SCHOOL

PATHS SELECTED FROM WOOL FOR FIELD AGGREGATION
WOOLLY PATH
LINES CONNECTING THE DATA
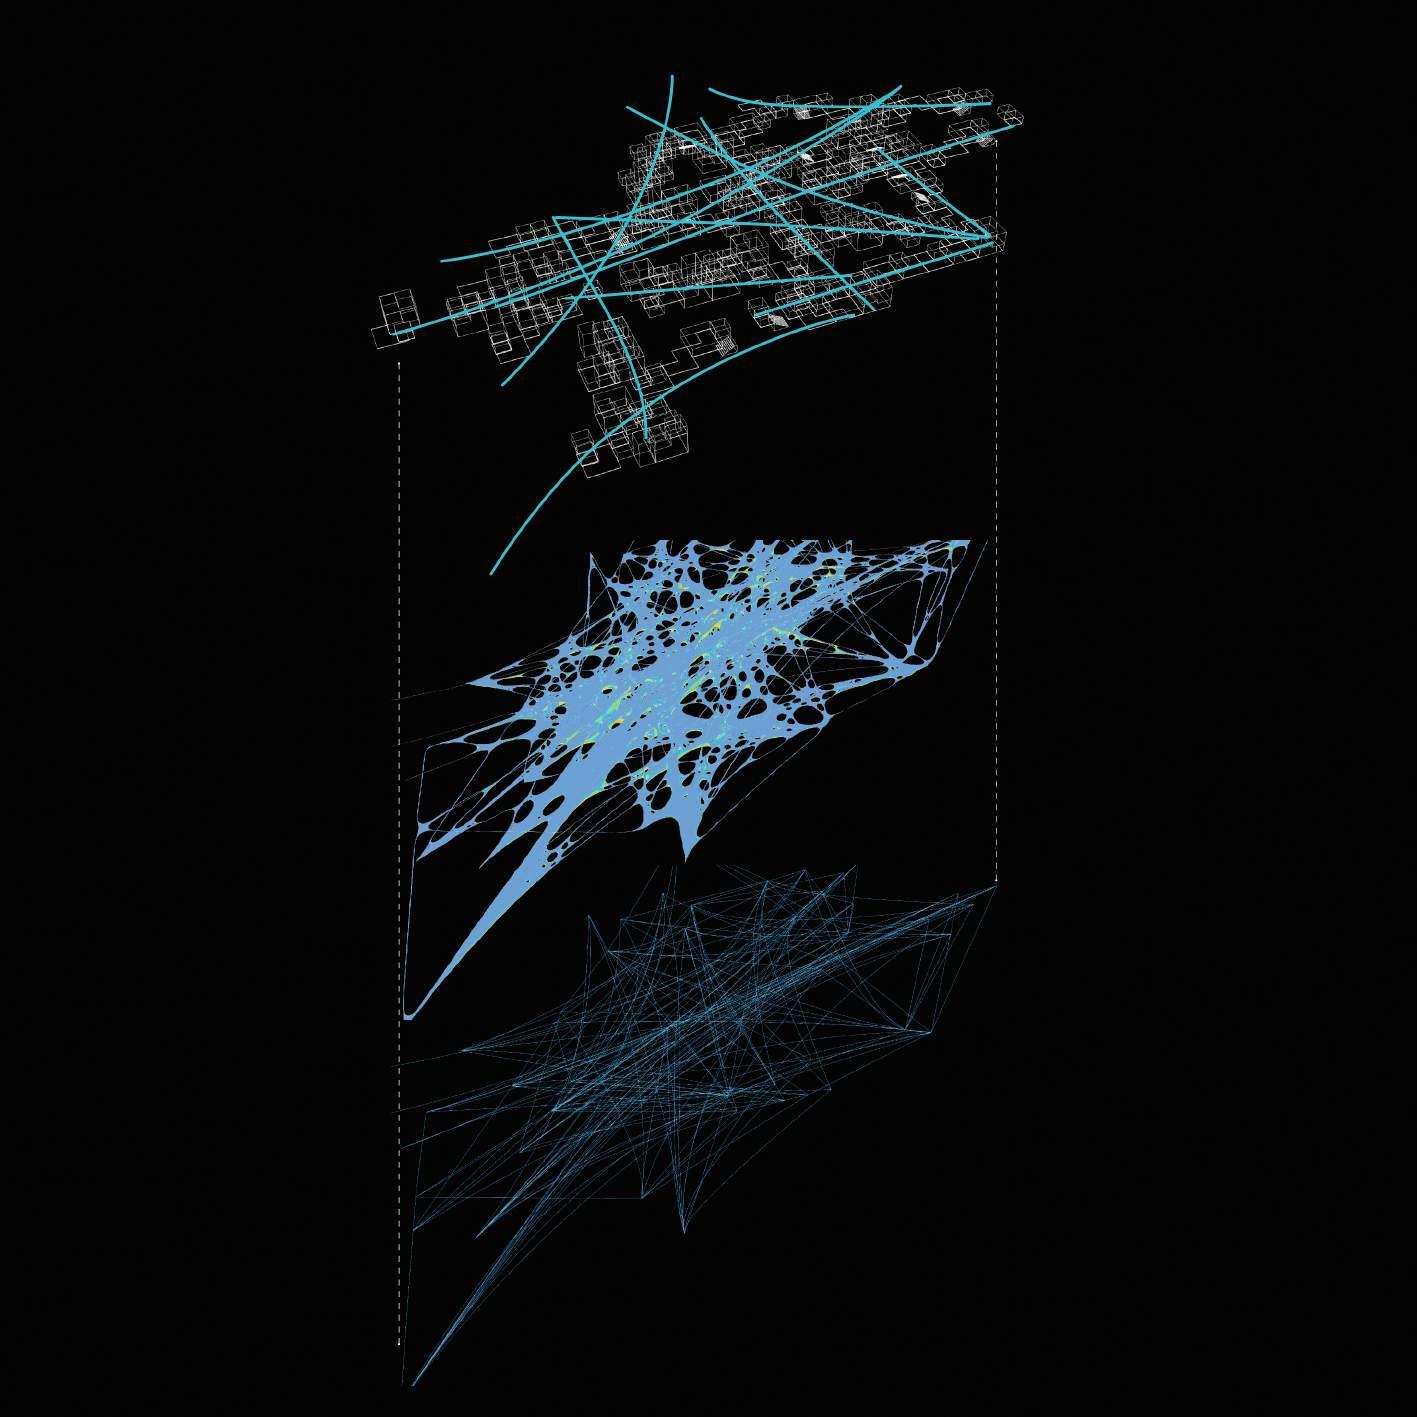
BRIDGES FOOD MODULES
AGGREGATION
FOOD ORIENTED NEIGHBOURHOOD DEVELOPMENT | Neighbourhood Production Areas
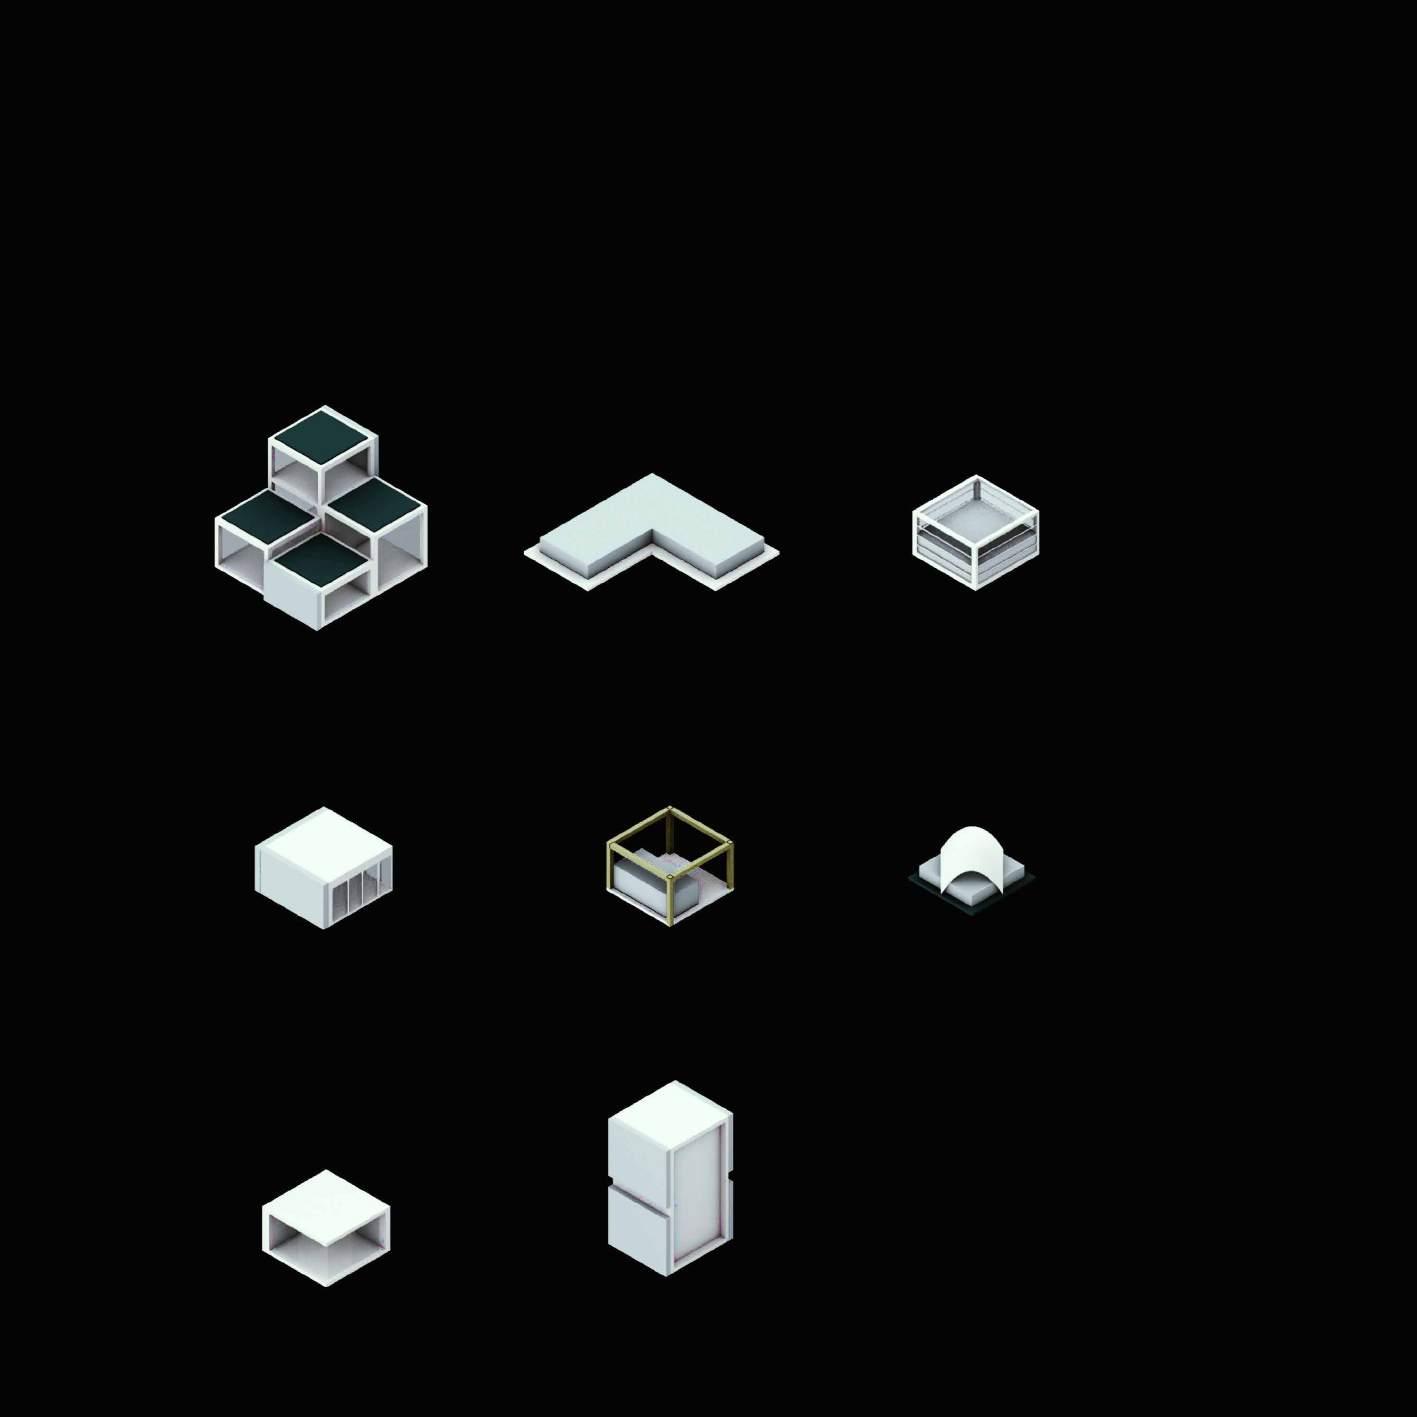
We then employed Discrete design as a design tool, to create a network of links between our production, consumption, and recycling modules to propose a Food-oriented Neighbourhood Development.

FOOD ORIENTED NEIGHBOURHOOD DEVELOPMENT | Neighbourhood Production Areas
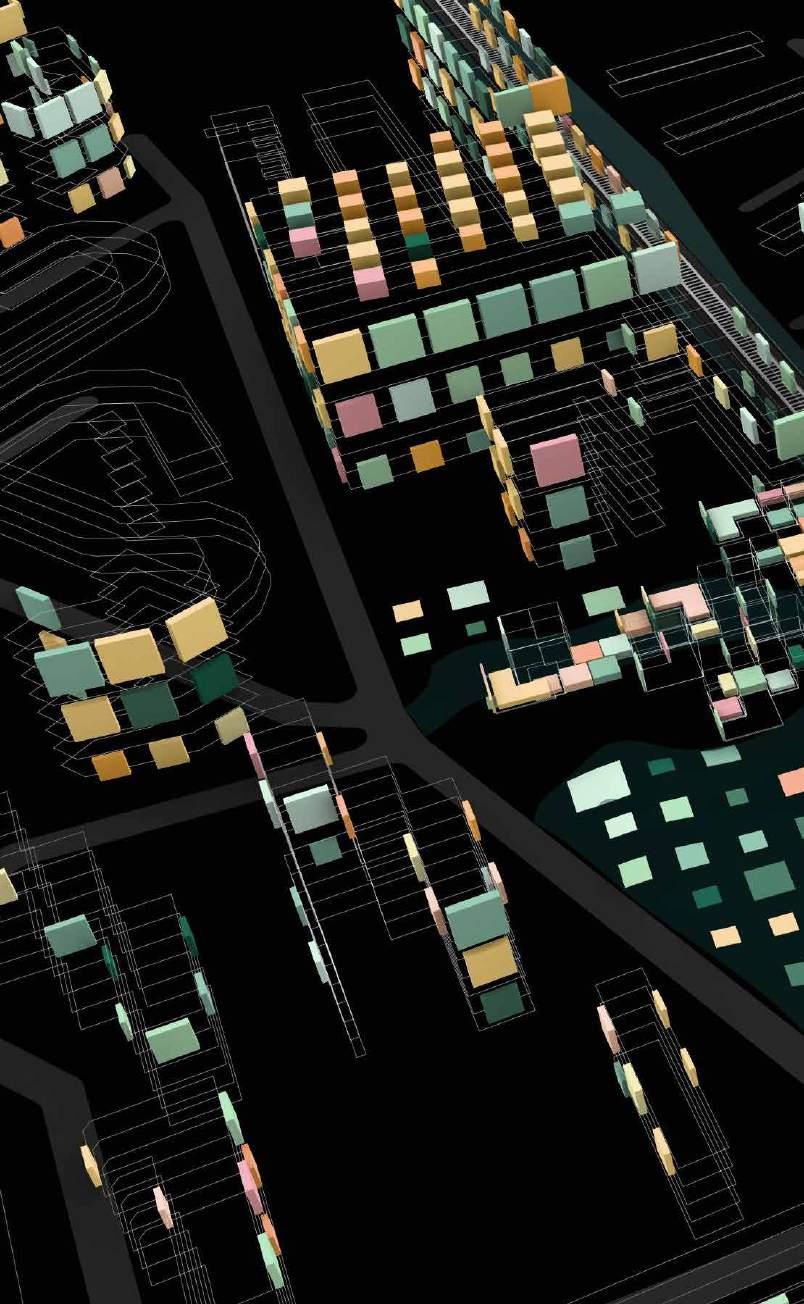
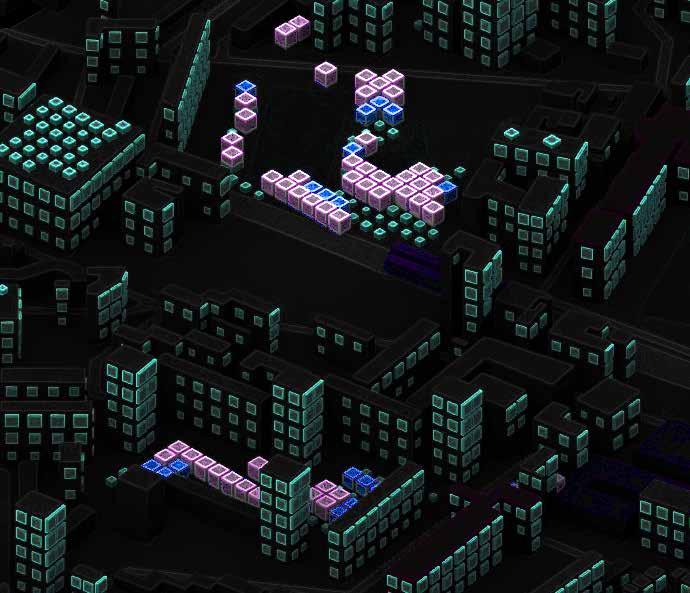
Growing food is one of the best ways to reconnect with nature and the community. Color of food adds a vibrant environment where people can connect back to food at all levels of the food system. It is a genuine ‘hands-on’ endeavor that may re-educate us about our relationship with food and the living environment, offer us direct access to fresh goods, and aid in the growth of our social development.

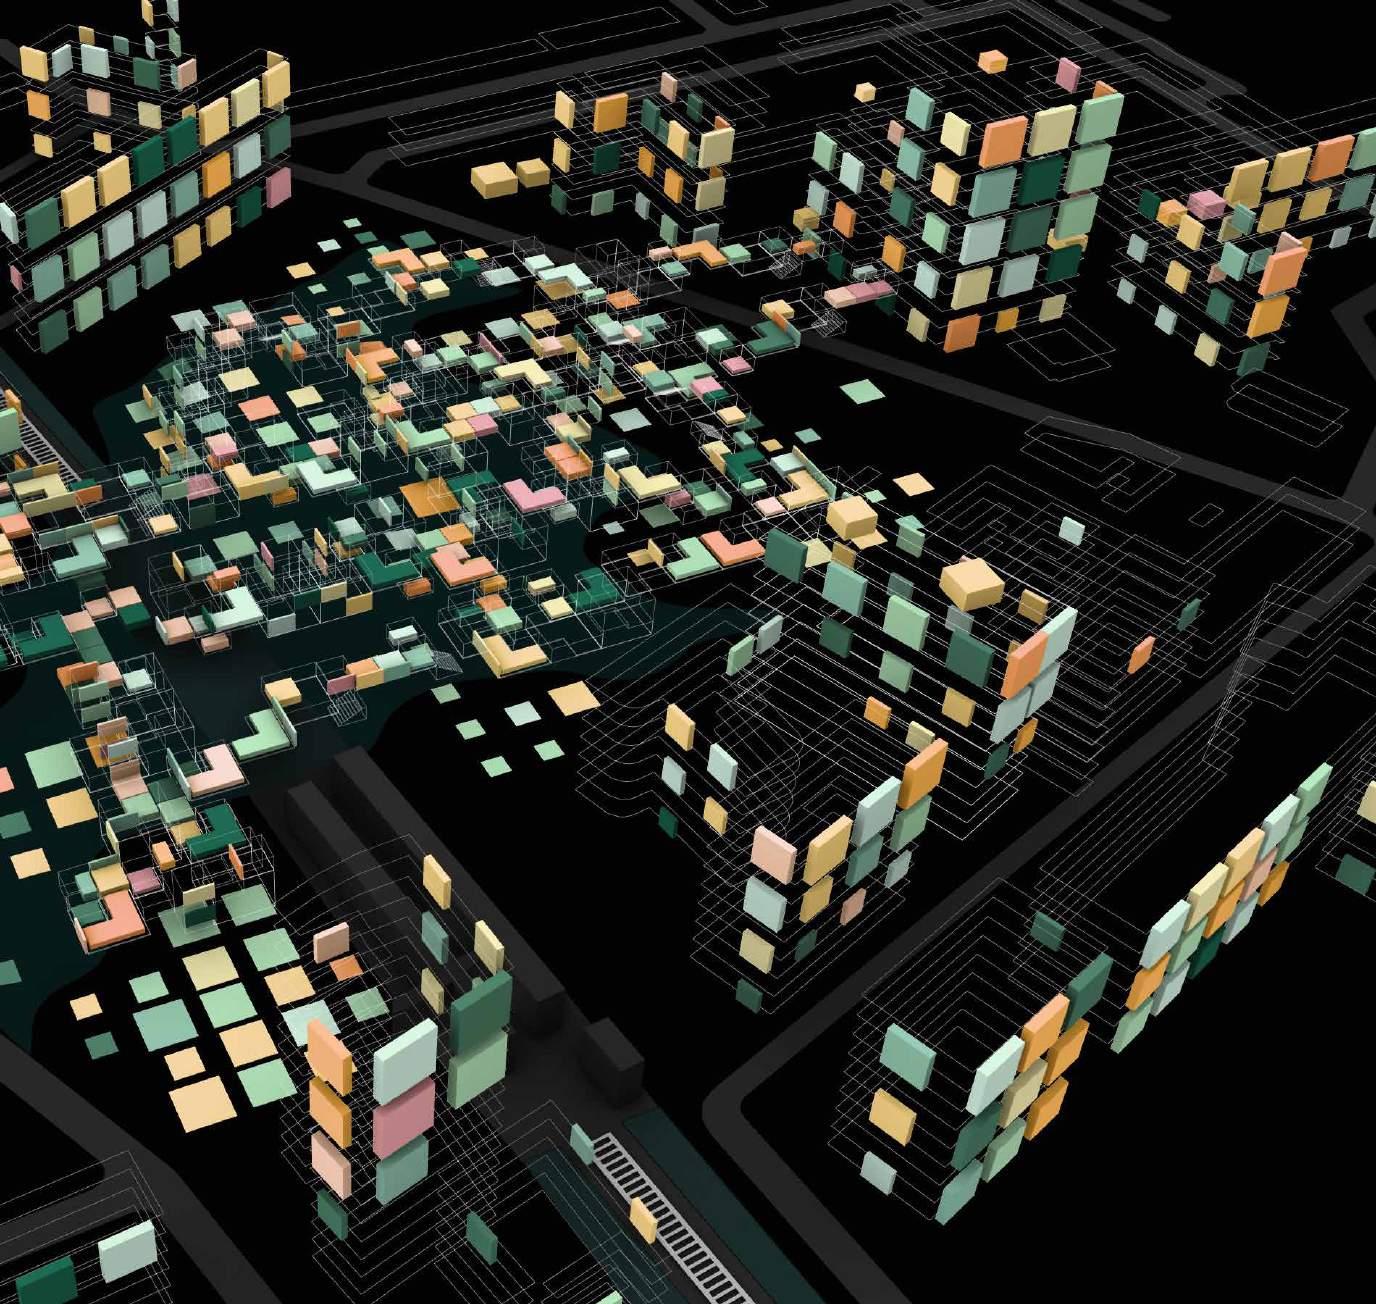
ORIENTED NEIGHBOURHOOD DEVELOPMENT | Neighbourhood Production Areas
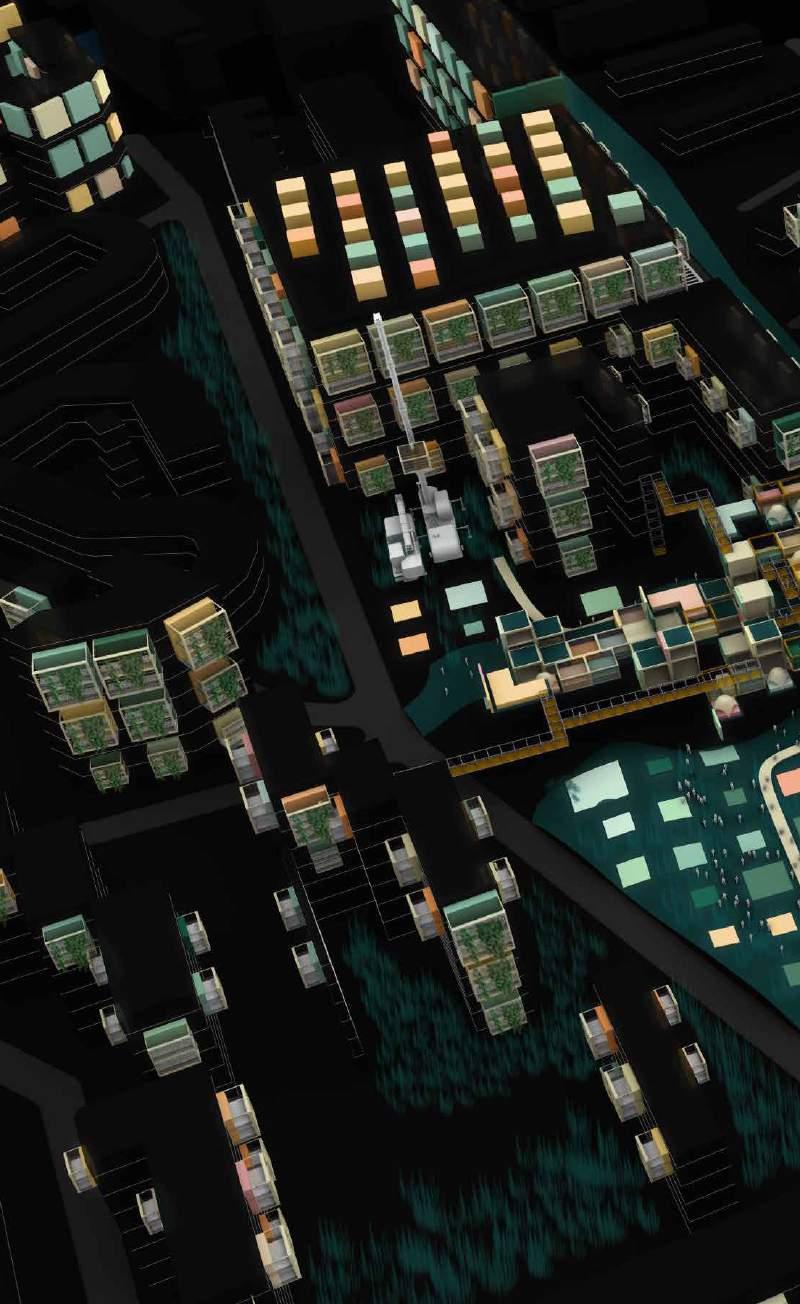
Adding Balconies infrastructure for the vertical surfaces
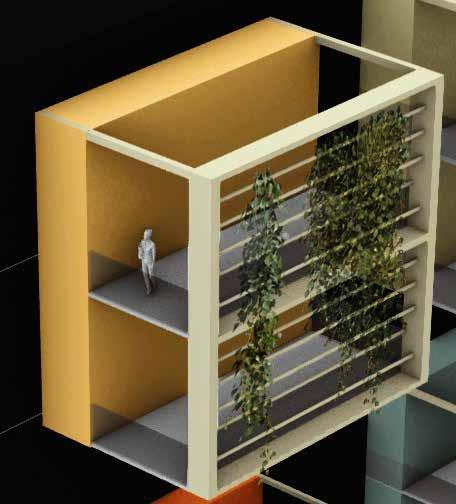
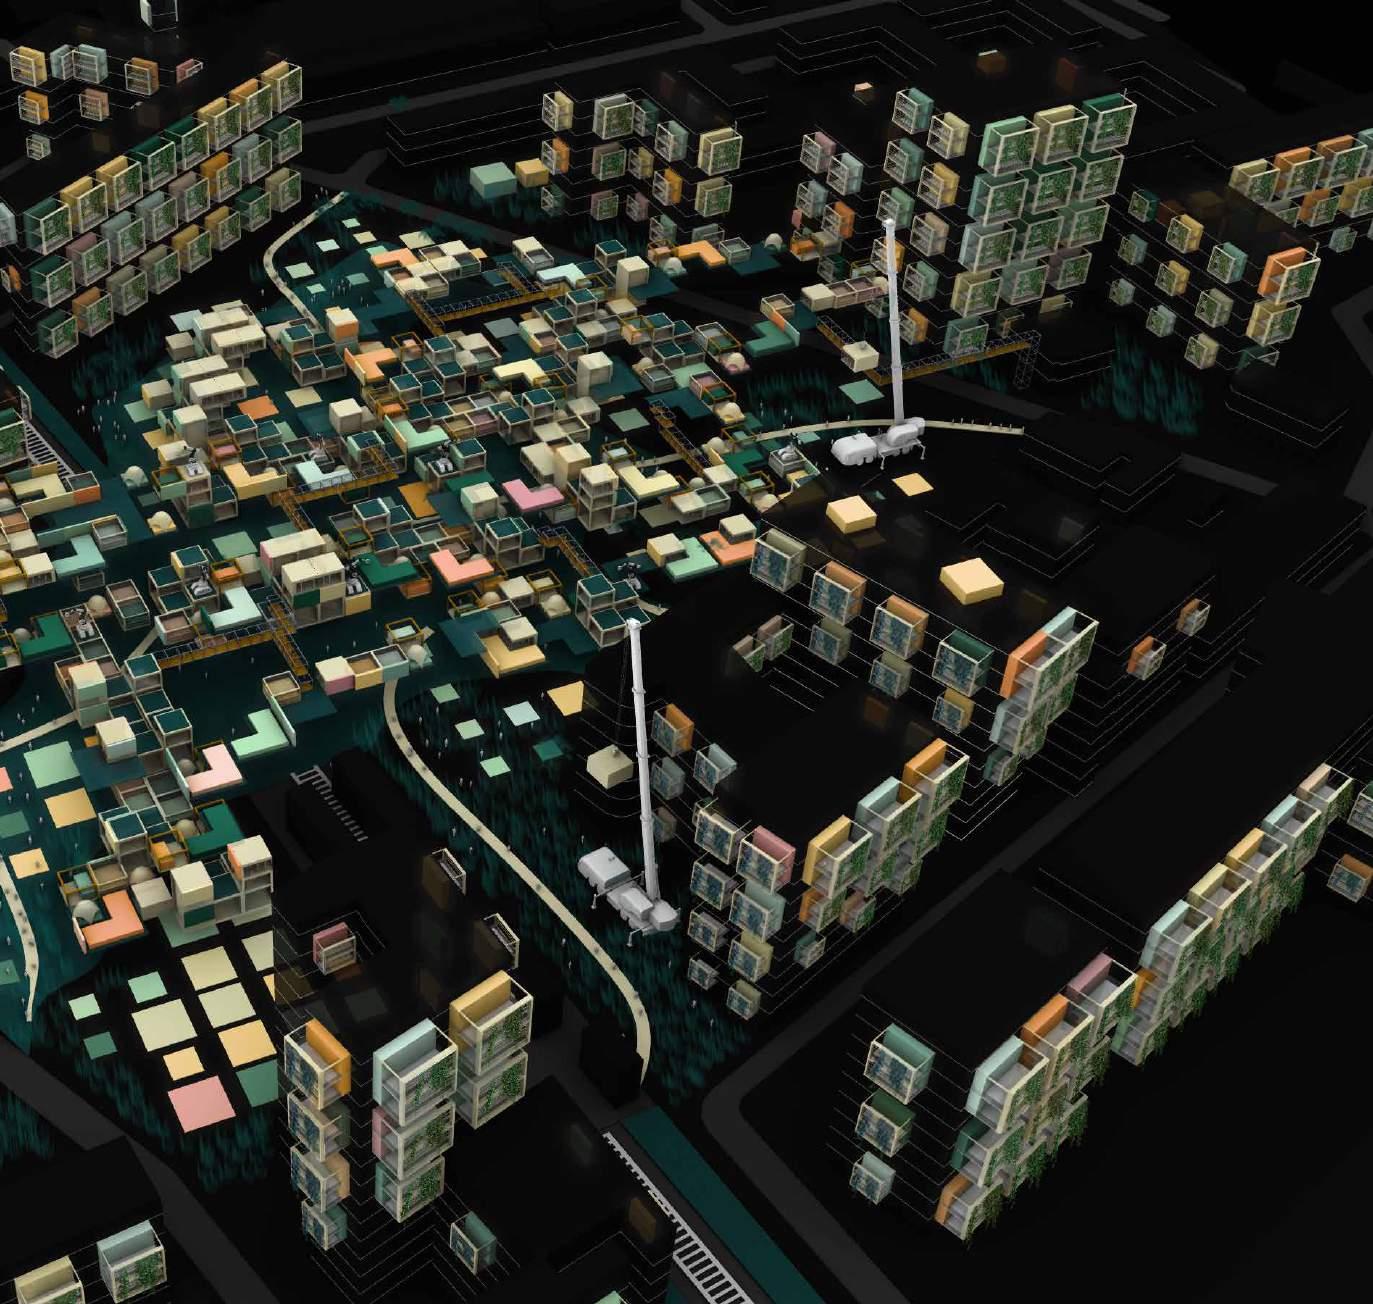
MASTERPLAN | Site Accessibility
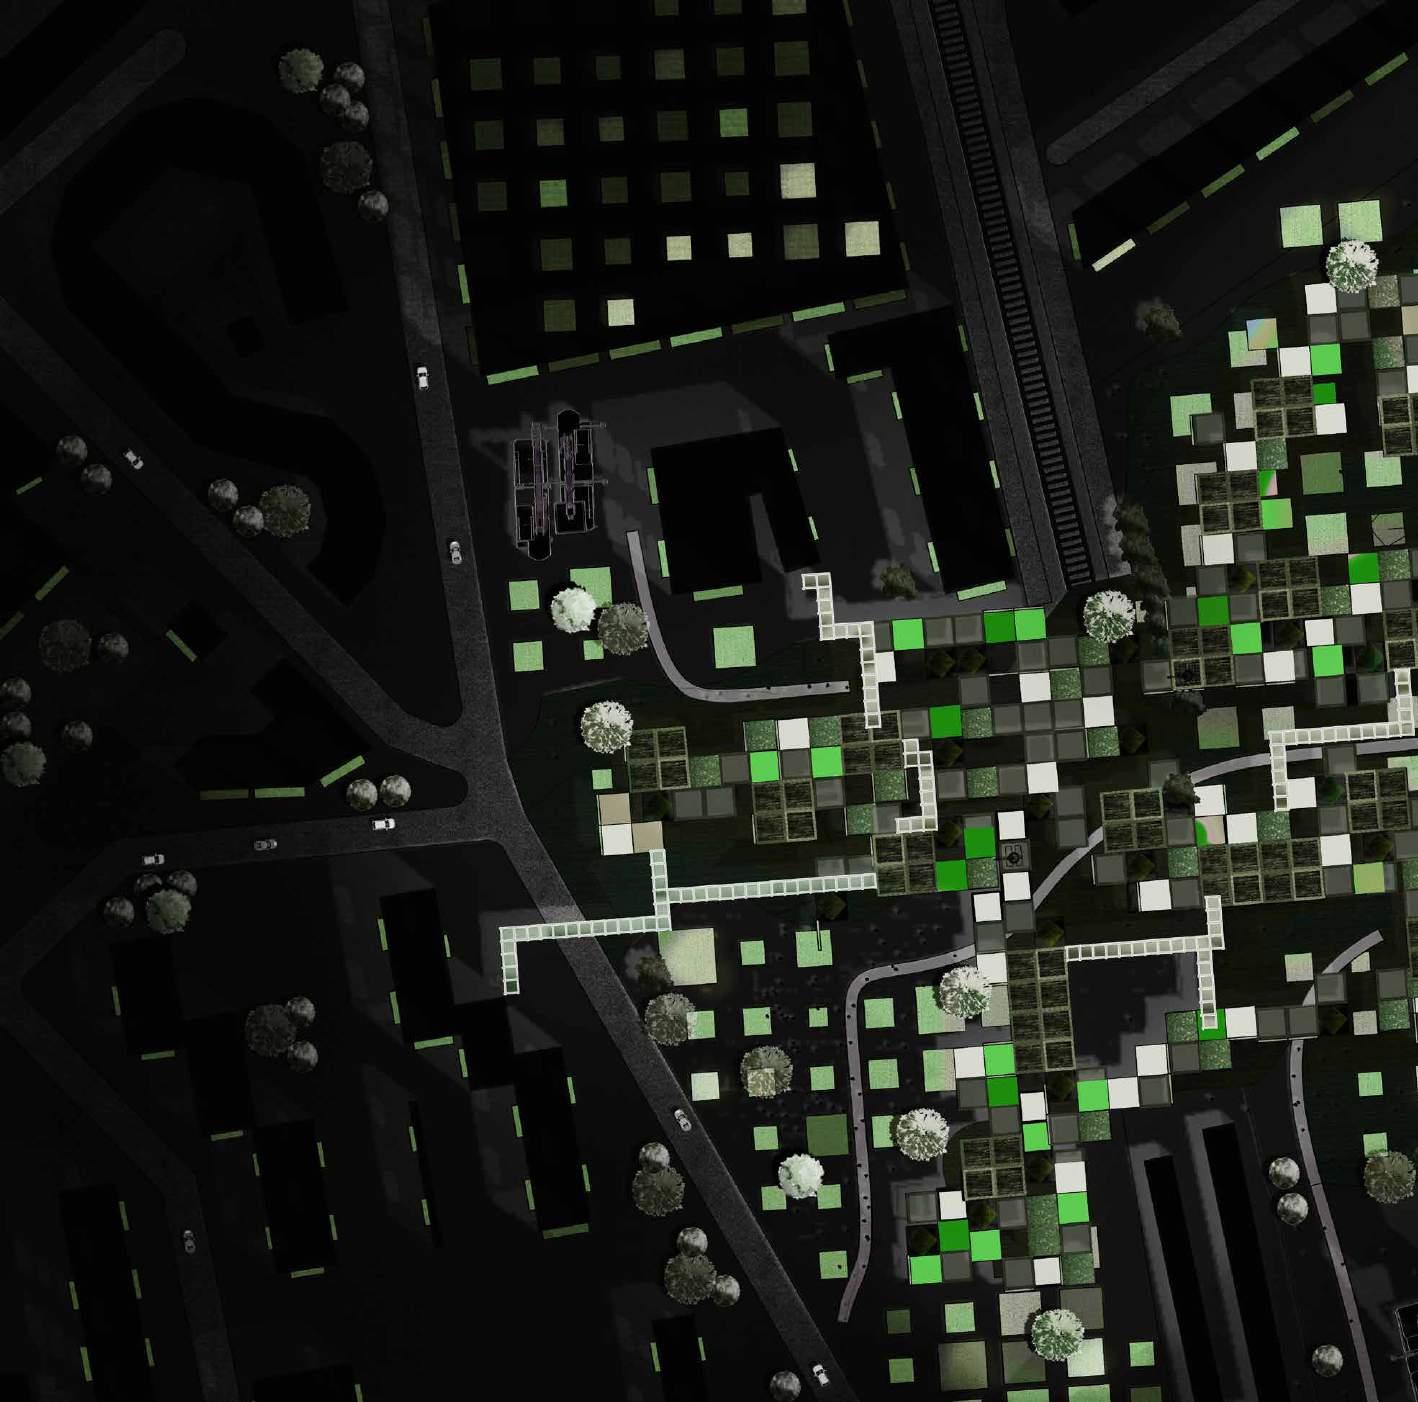
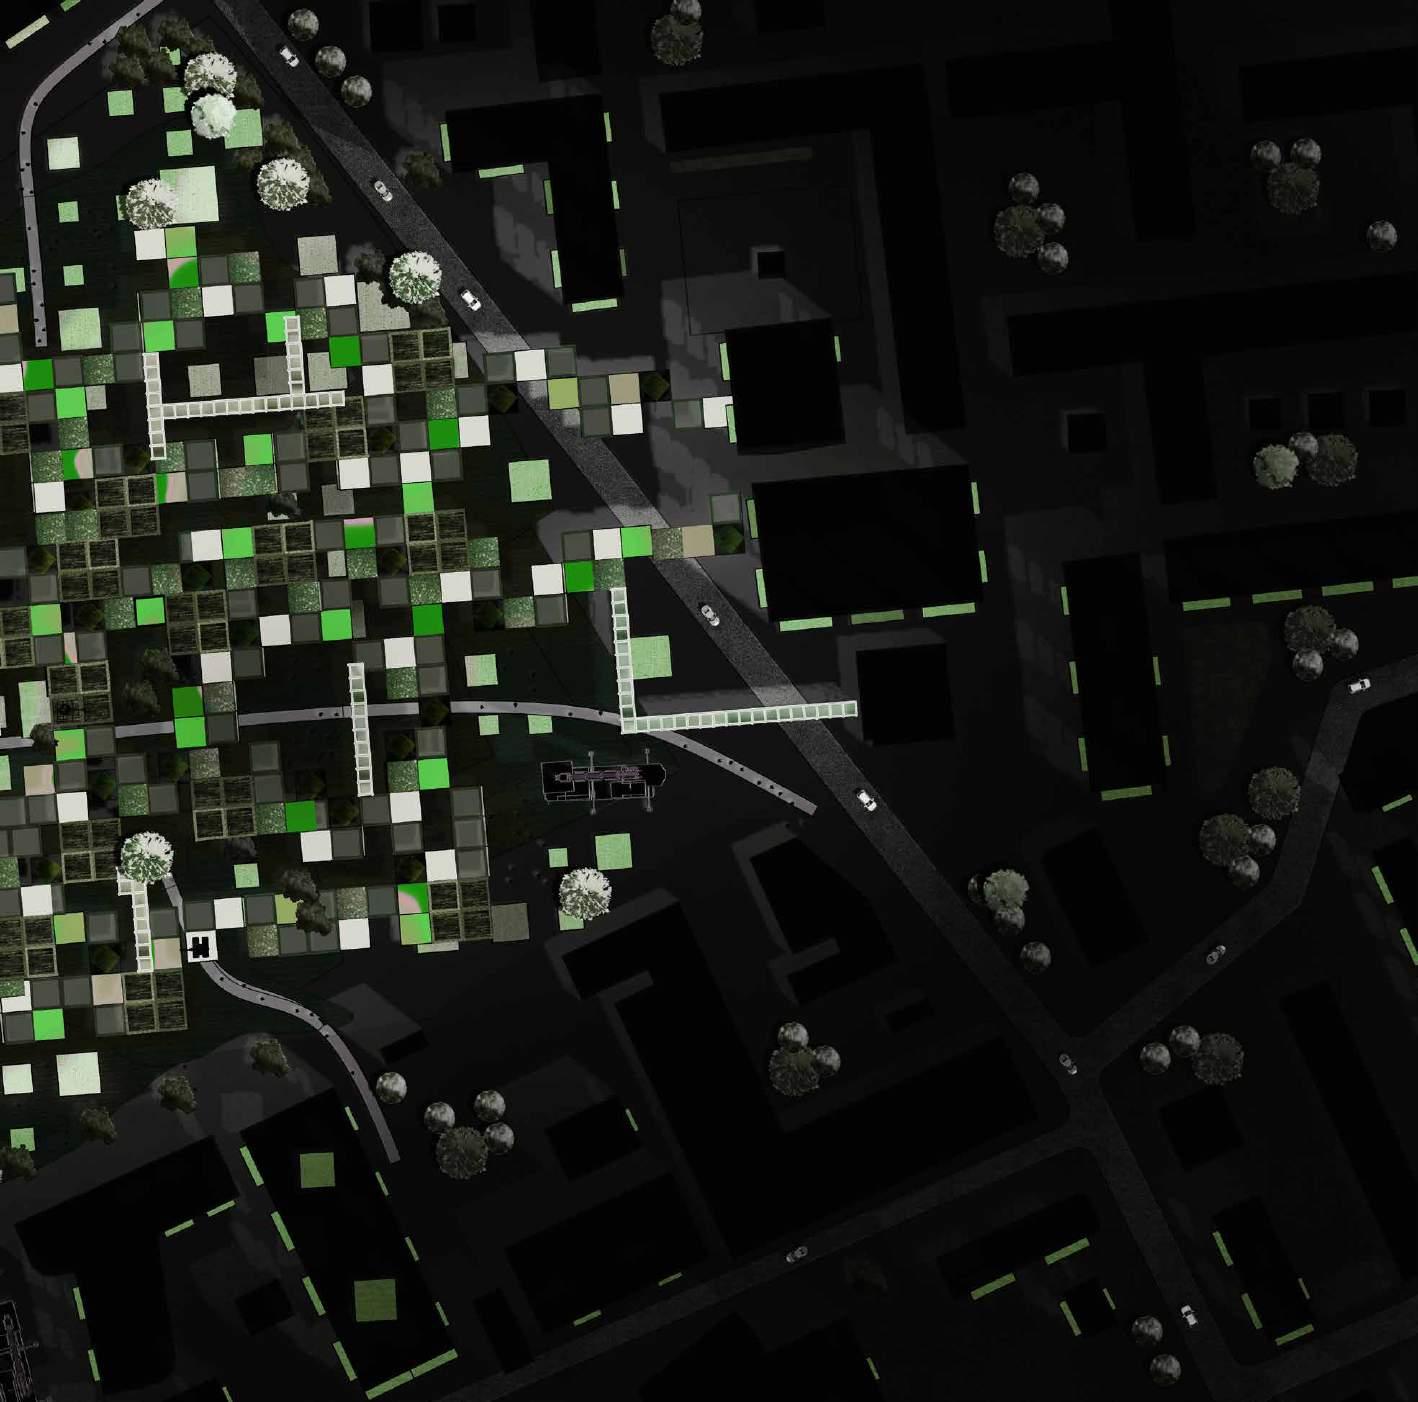
MASTERPLAN | Introducing Colours to Neighbourhood
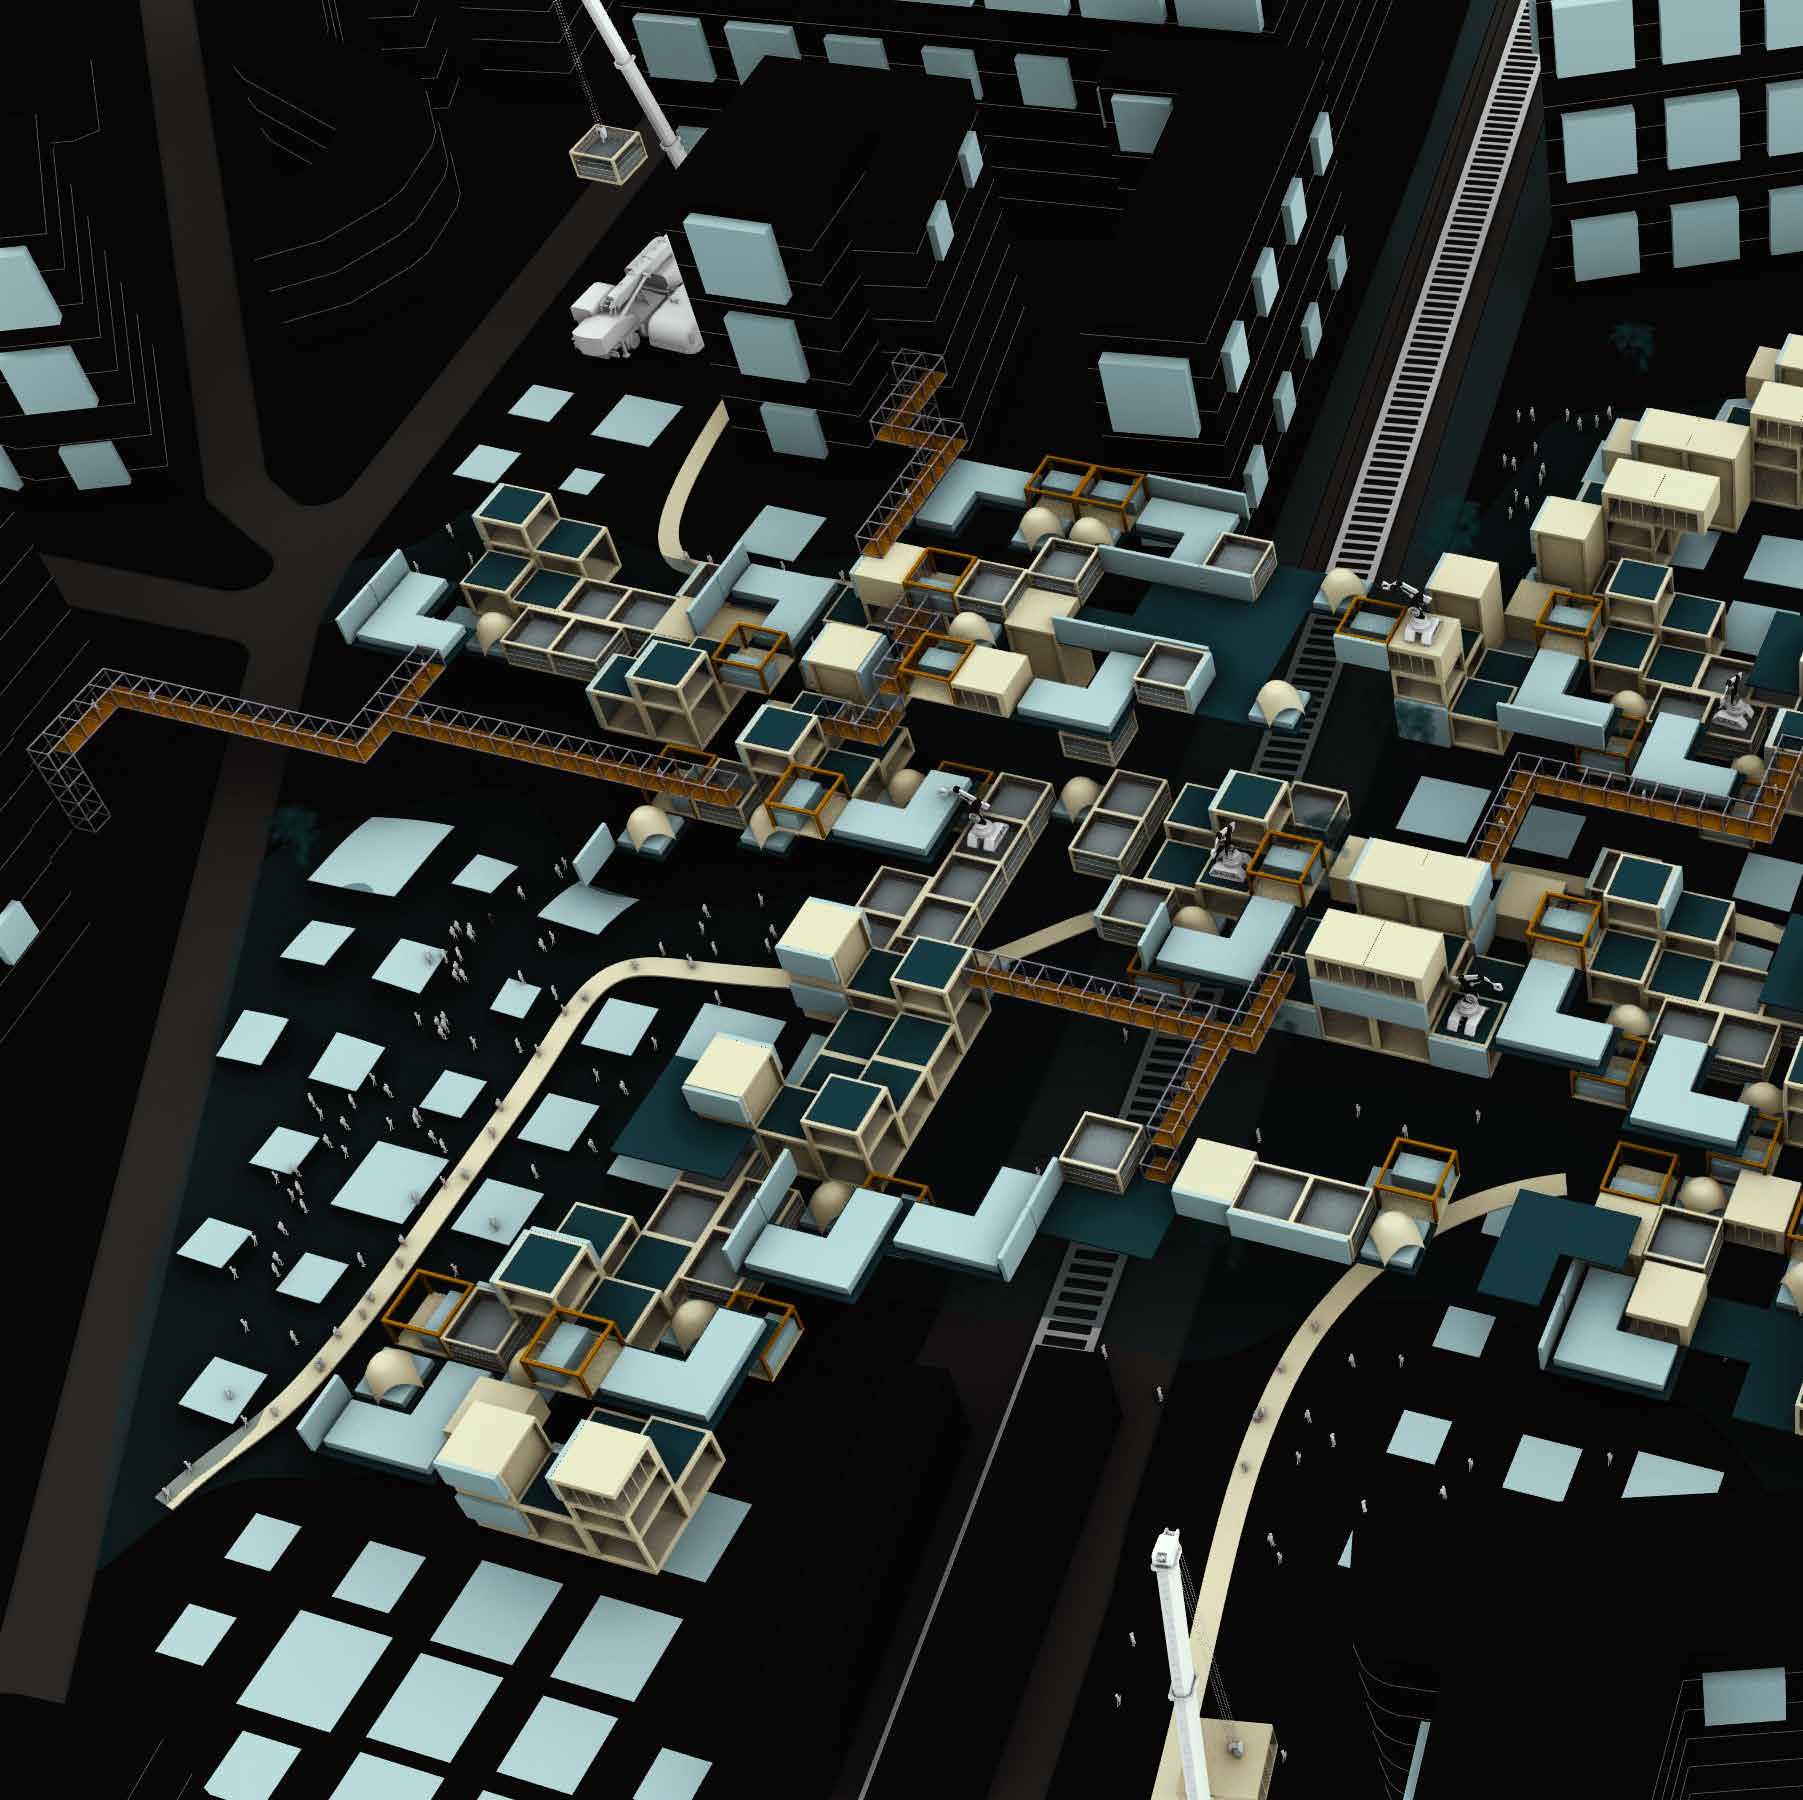
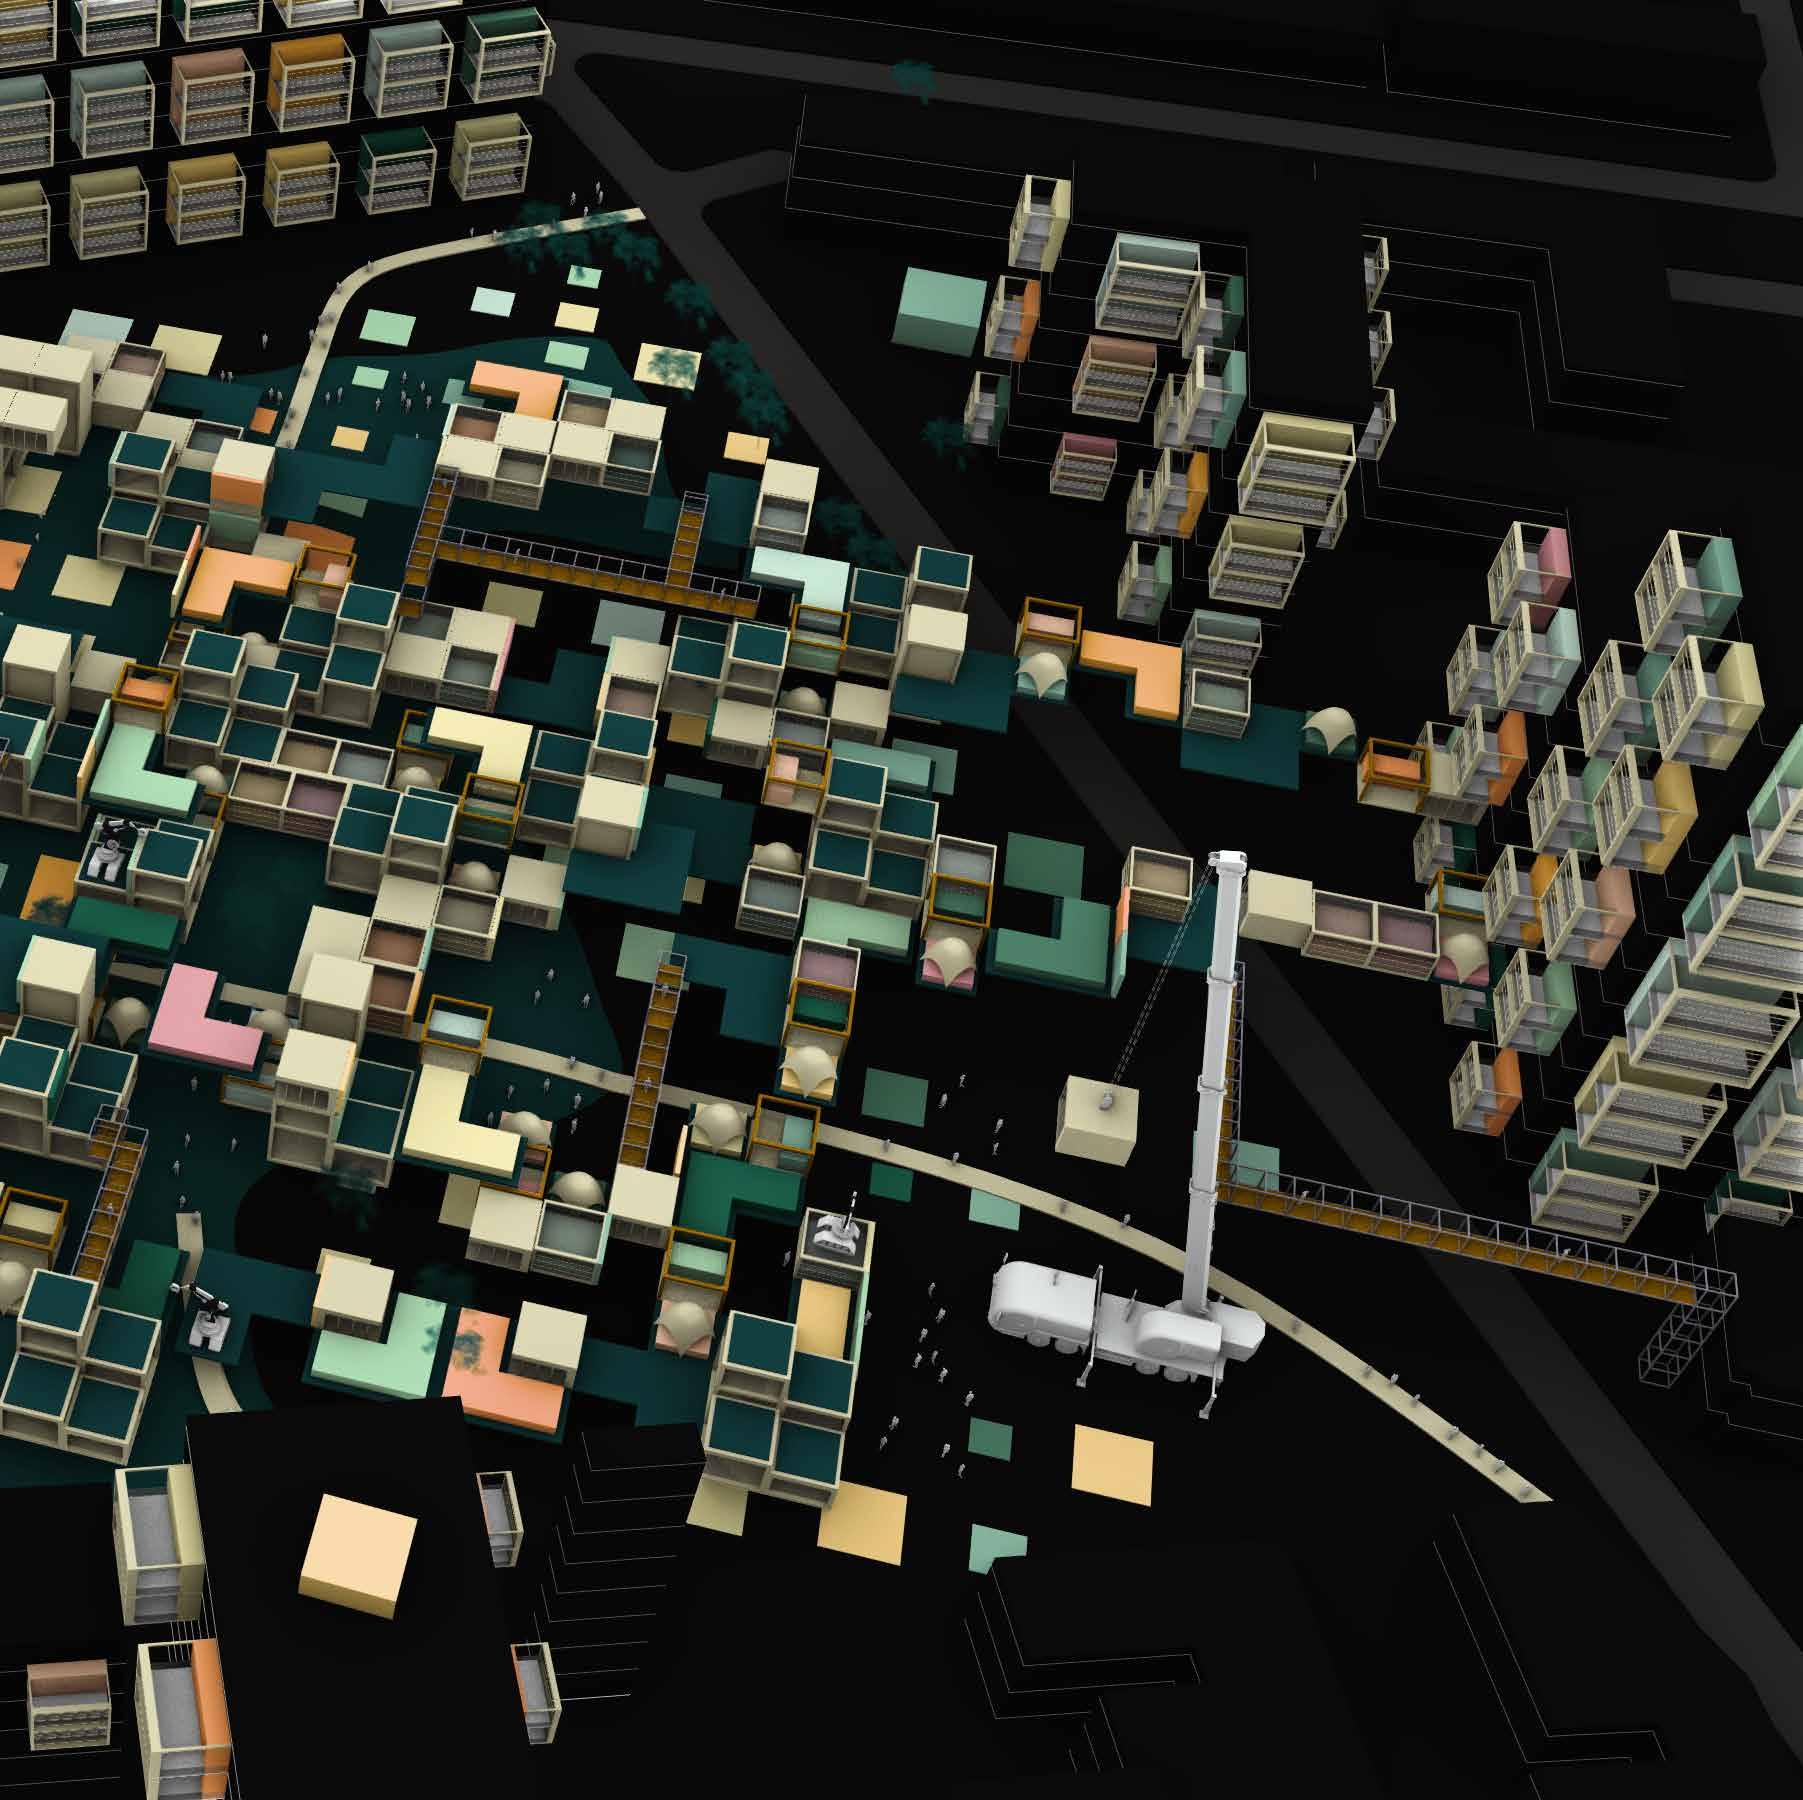
MASTERPLAN | Introducing Colours to Neighbourhood
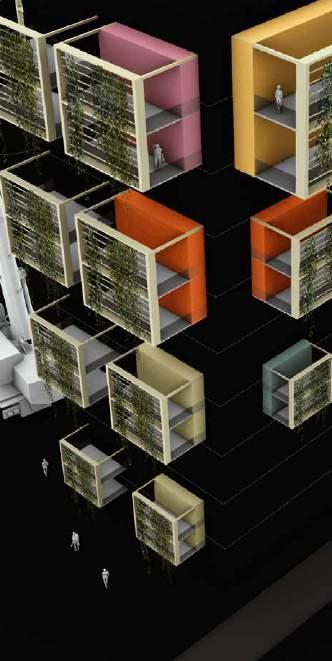

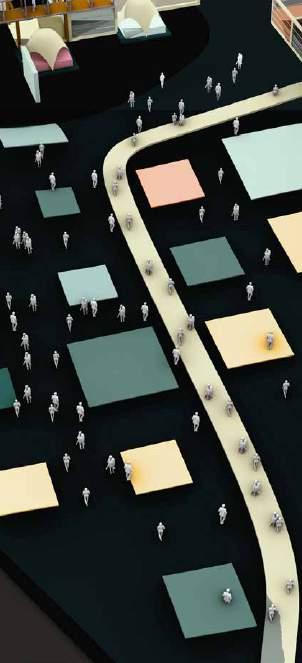
Zooming into Langdon Park because of its connectivity to underground station, Bus stop and nearby community resedences. Creating a food network that is acceseble from all types of transport system.For our intervention proposal, the plan was to integrate food into the city in form of a food network. From integration points, points away from shadow and production cubes we formulated a network of lines using the woolly algorithm.
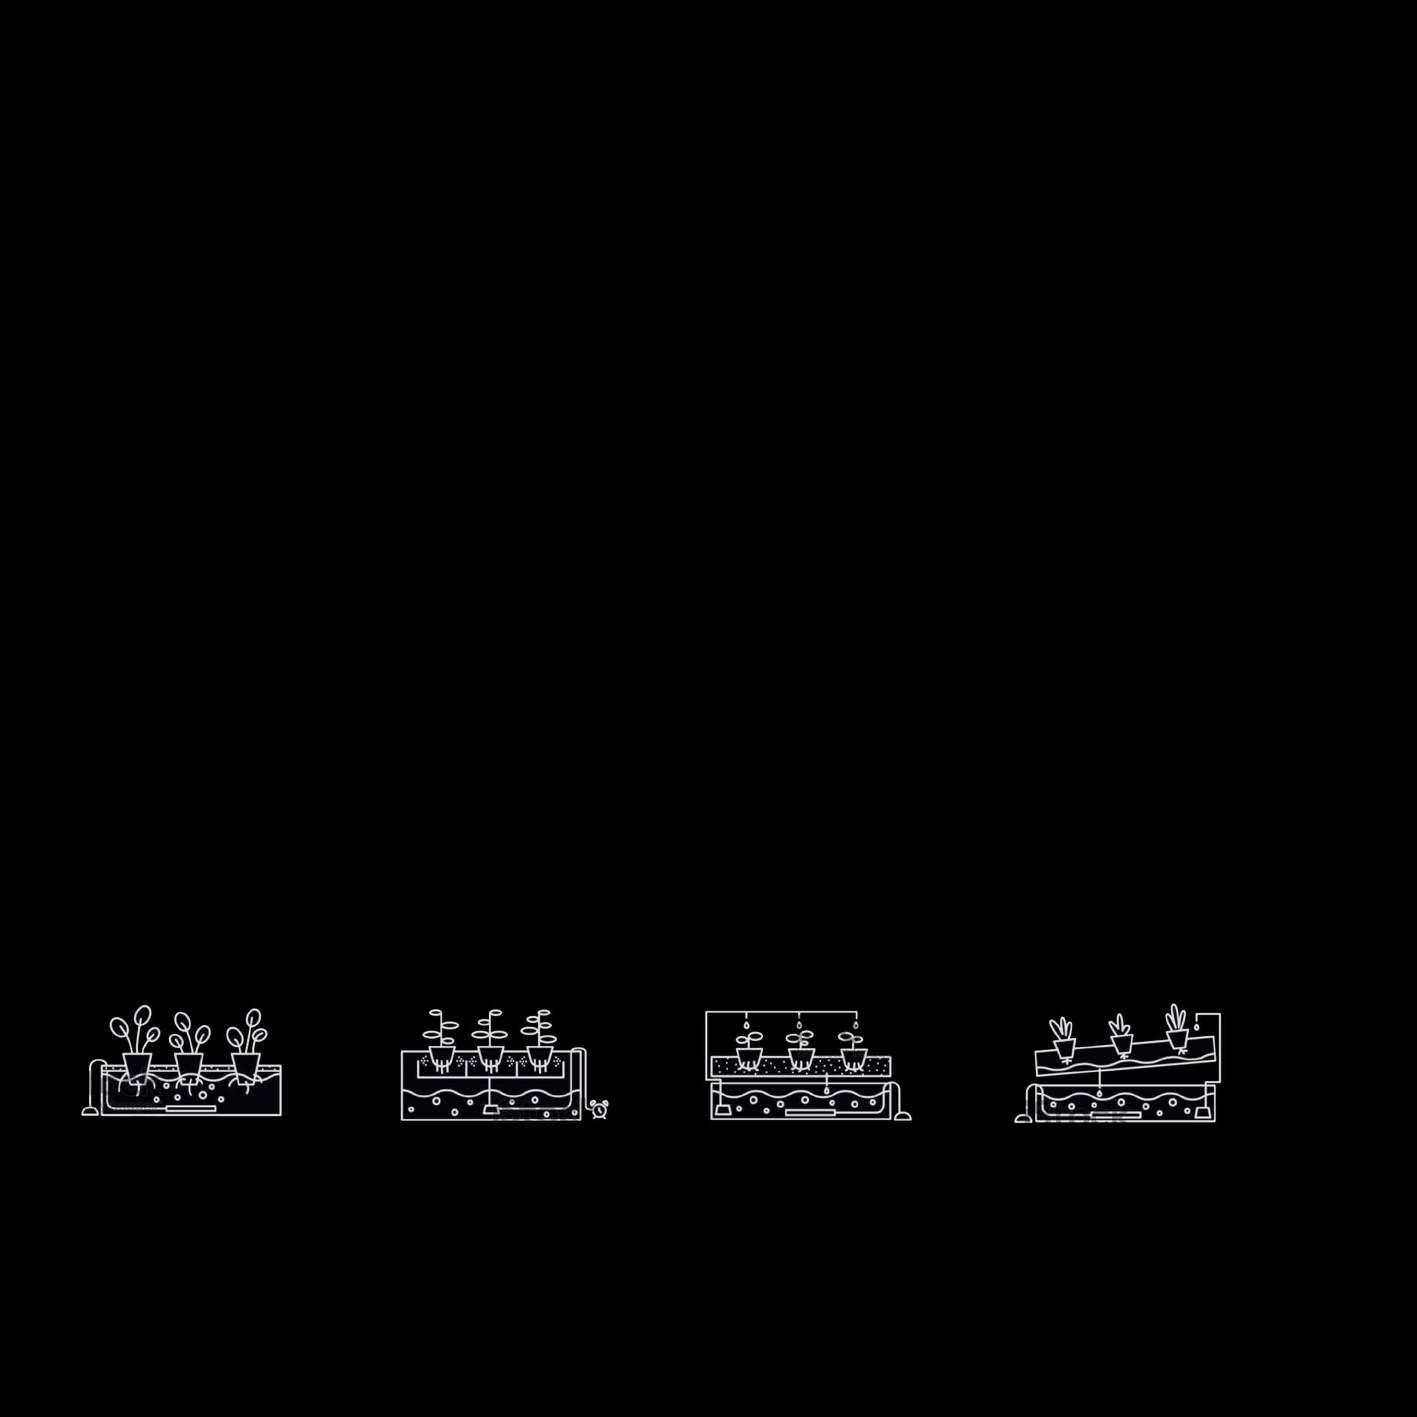
ROOF VERTICAL AUTOMATION ON GROUND
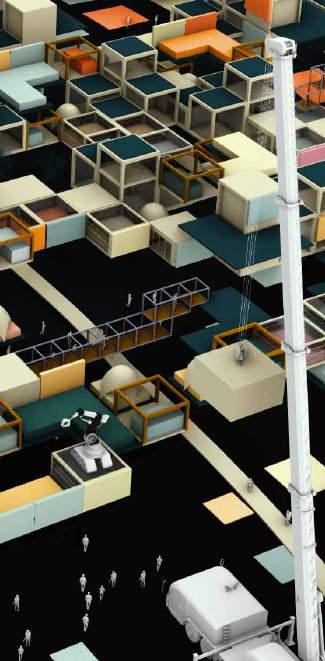
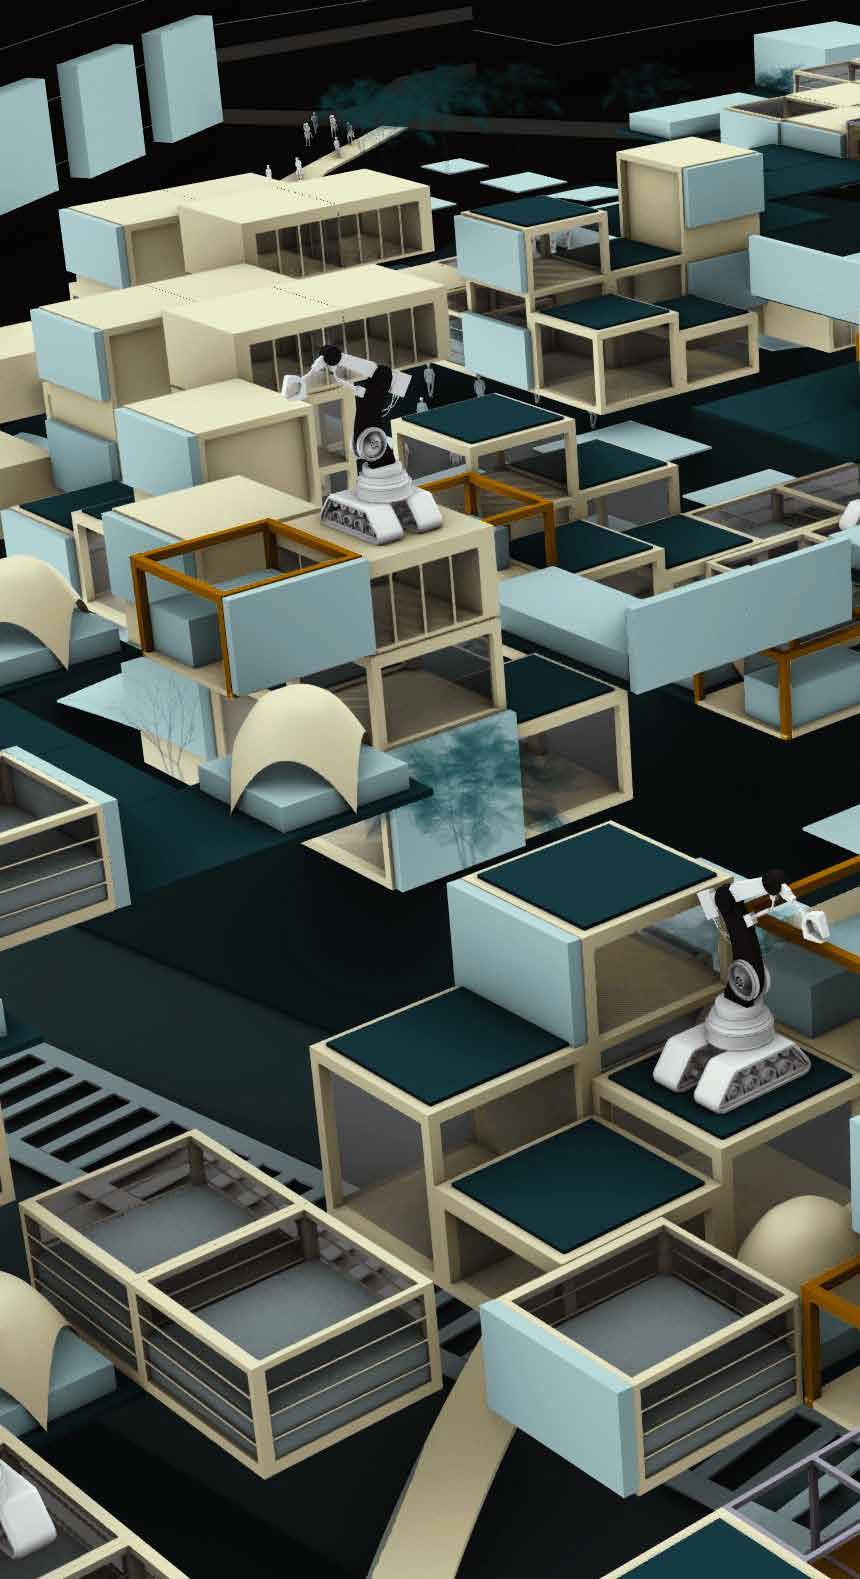
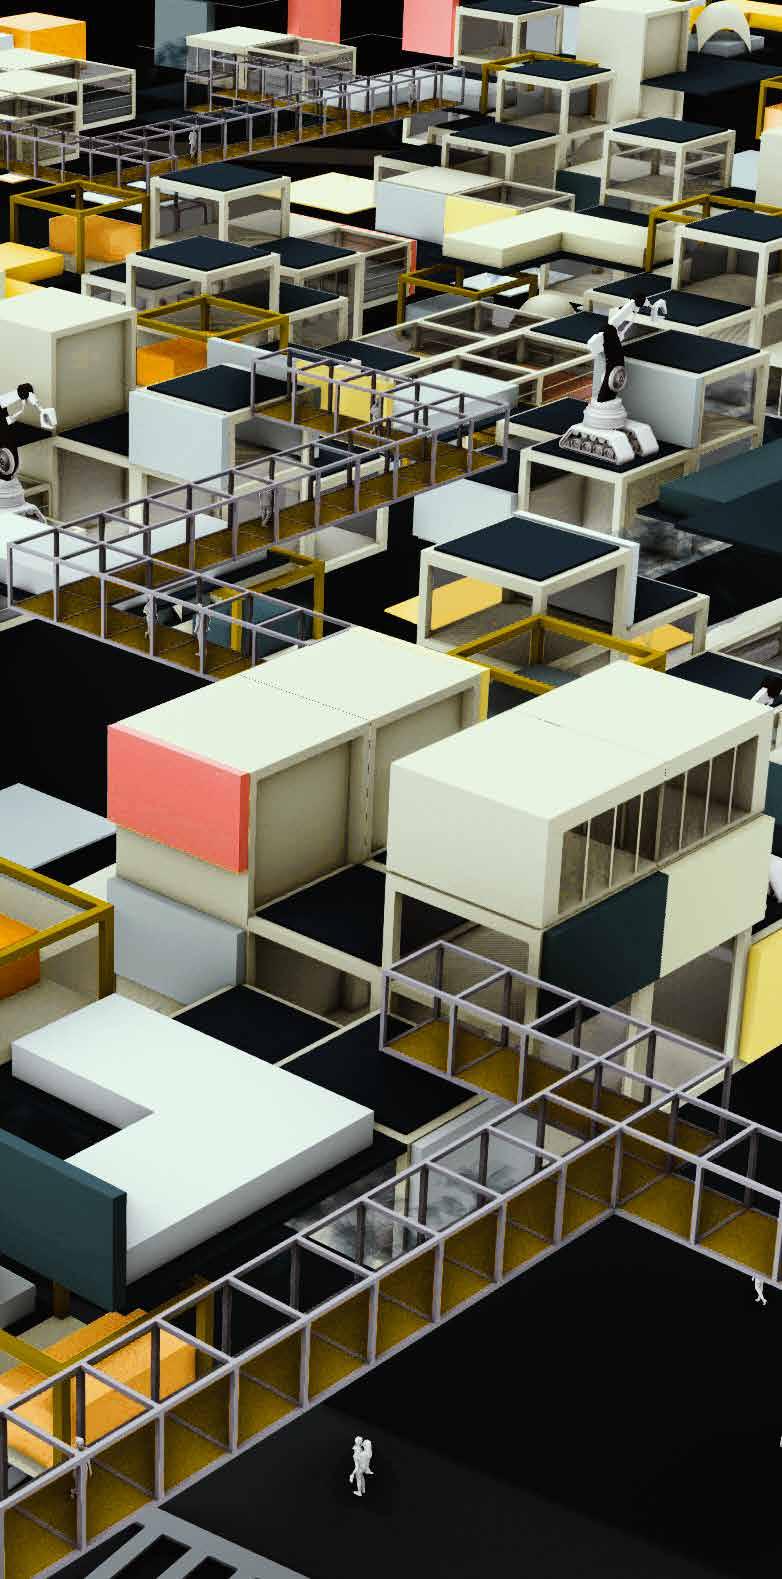
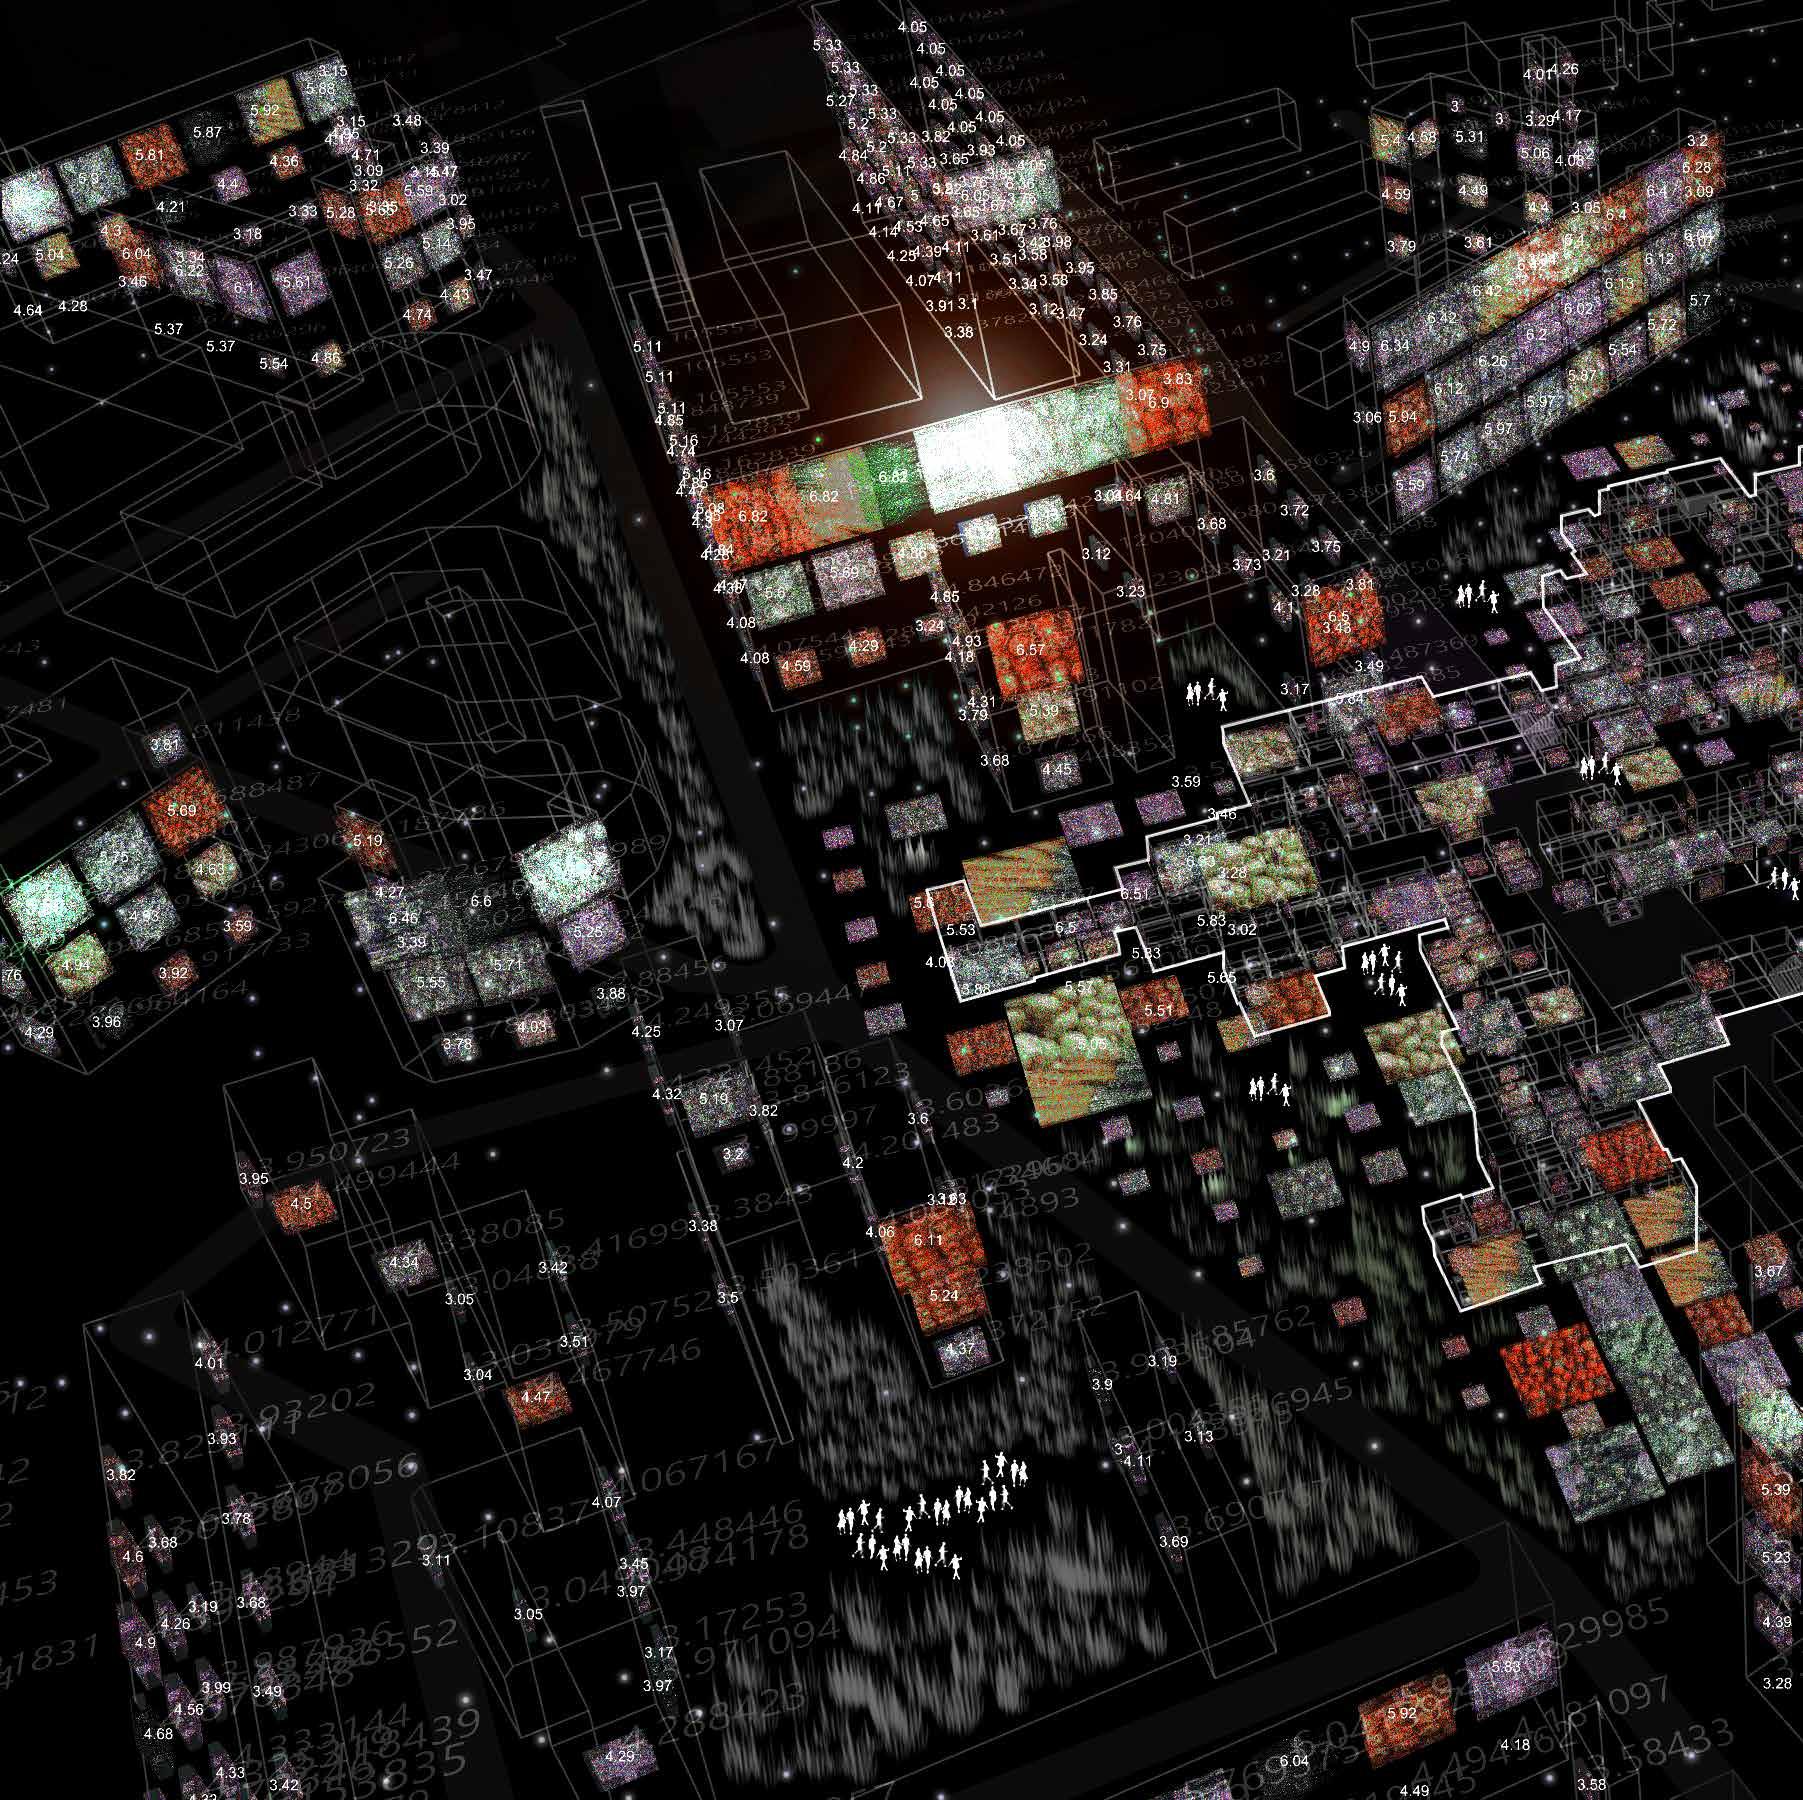
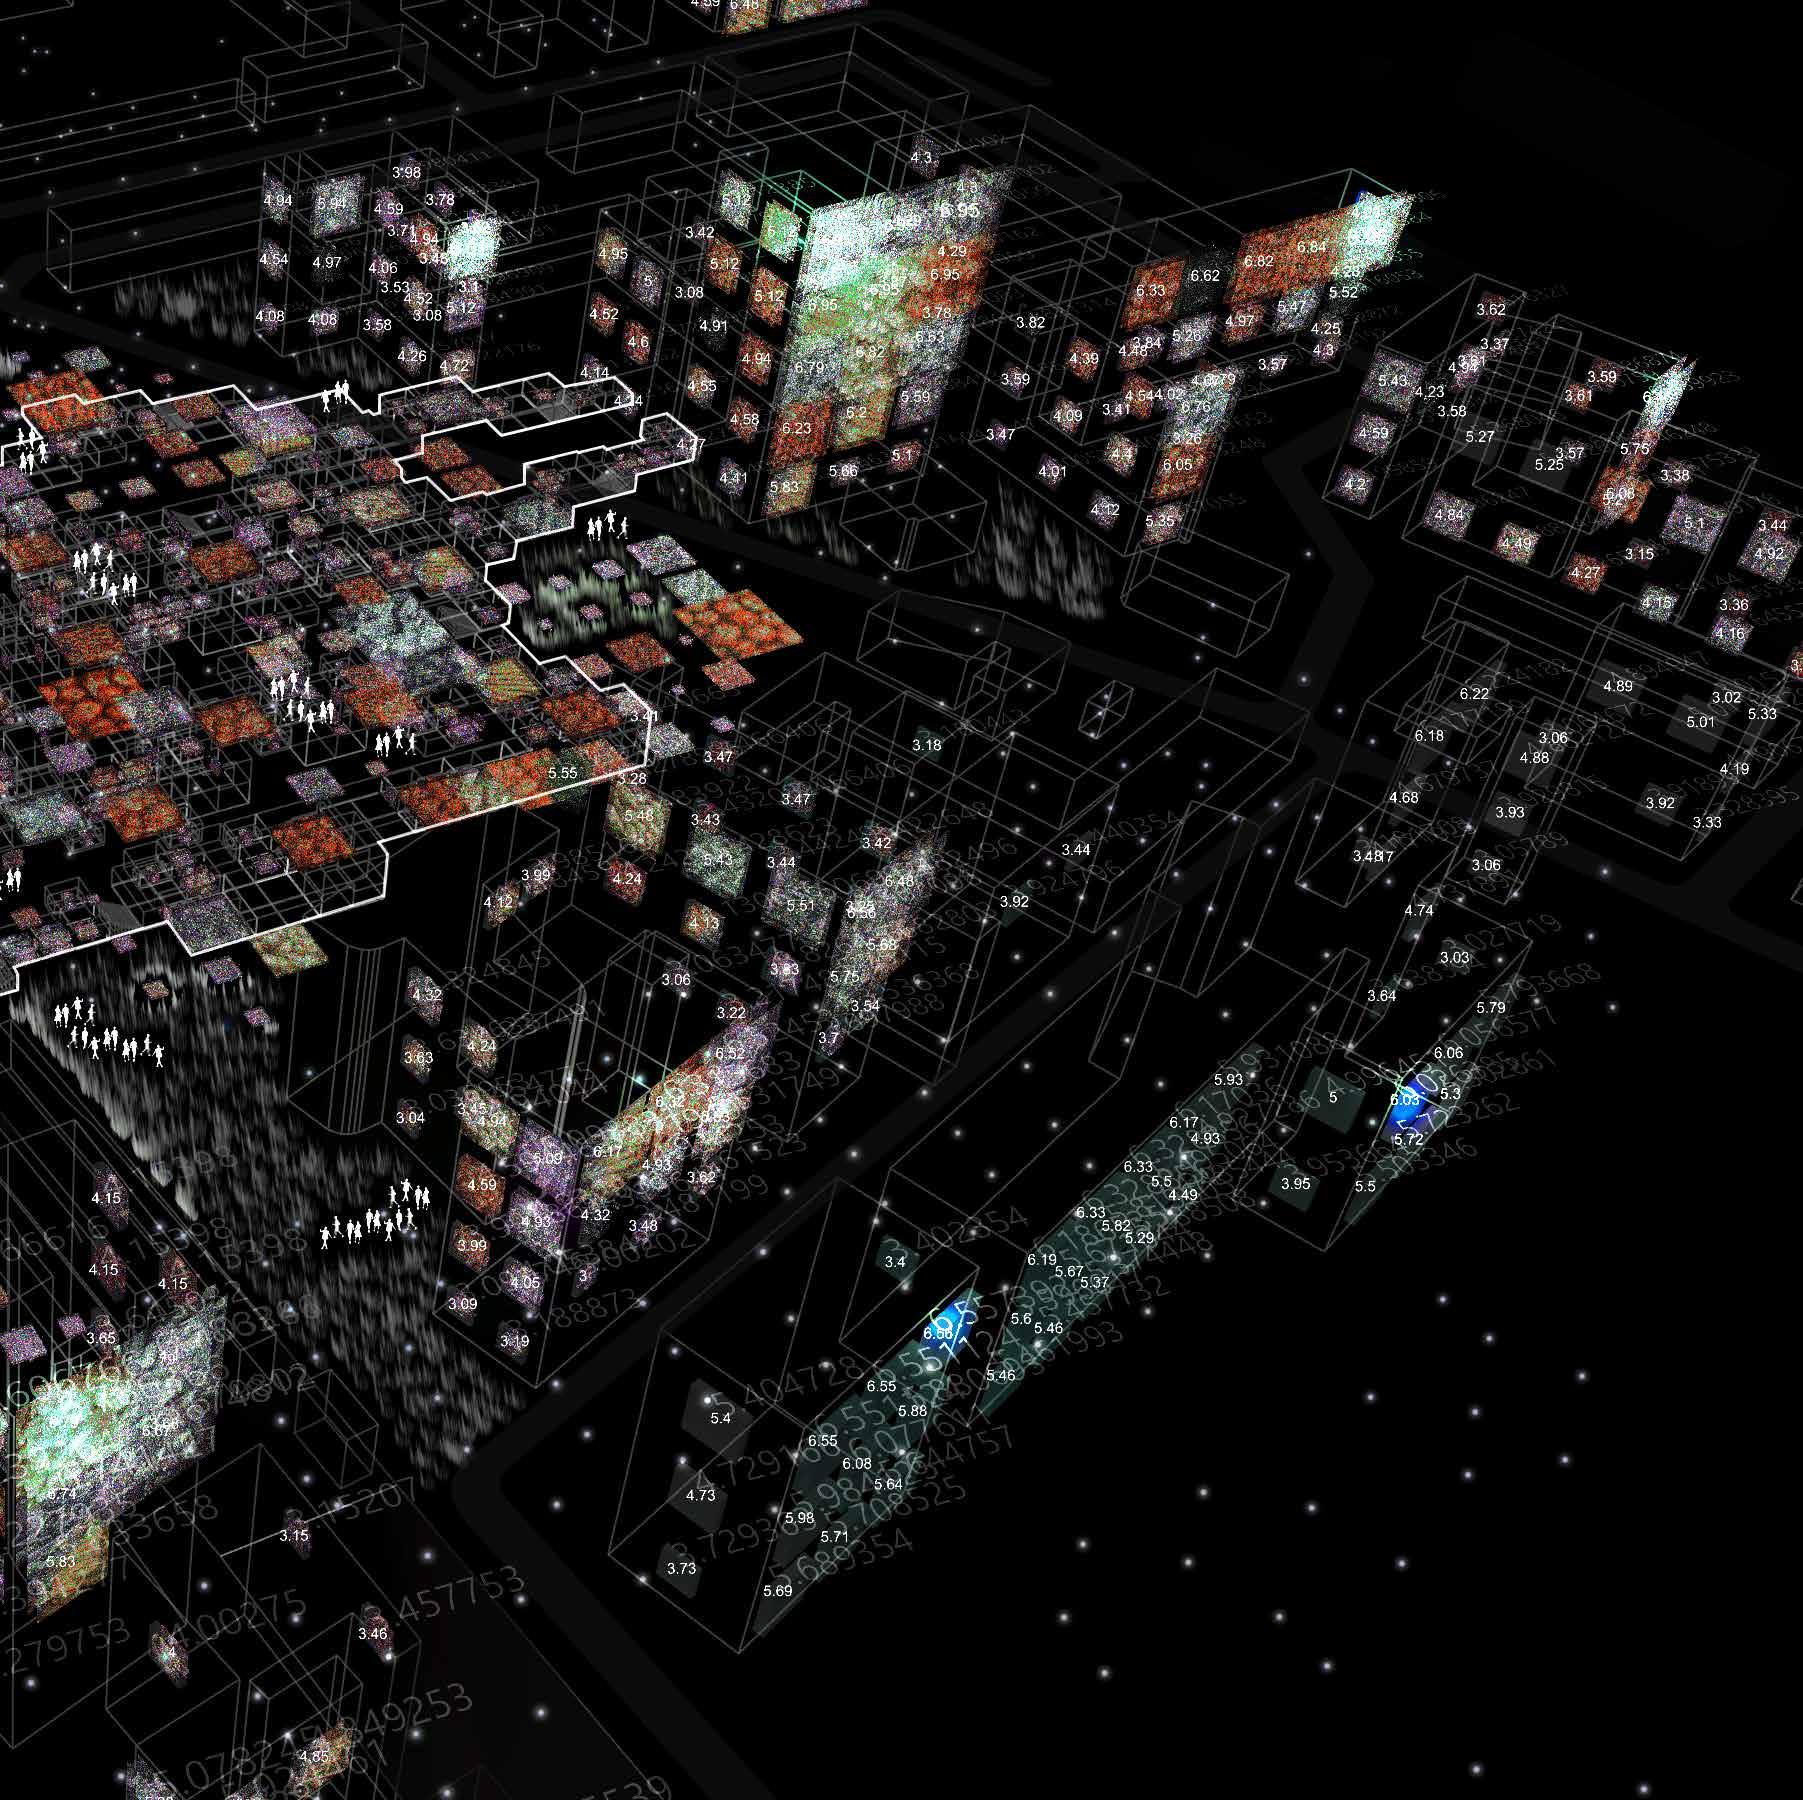
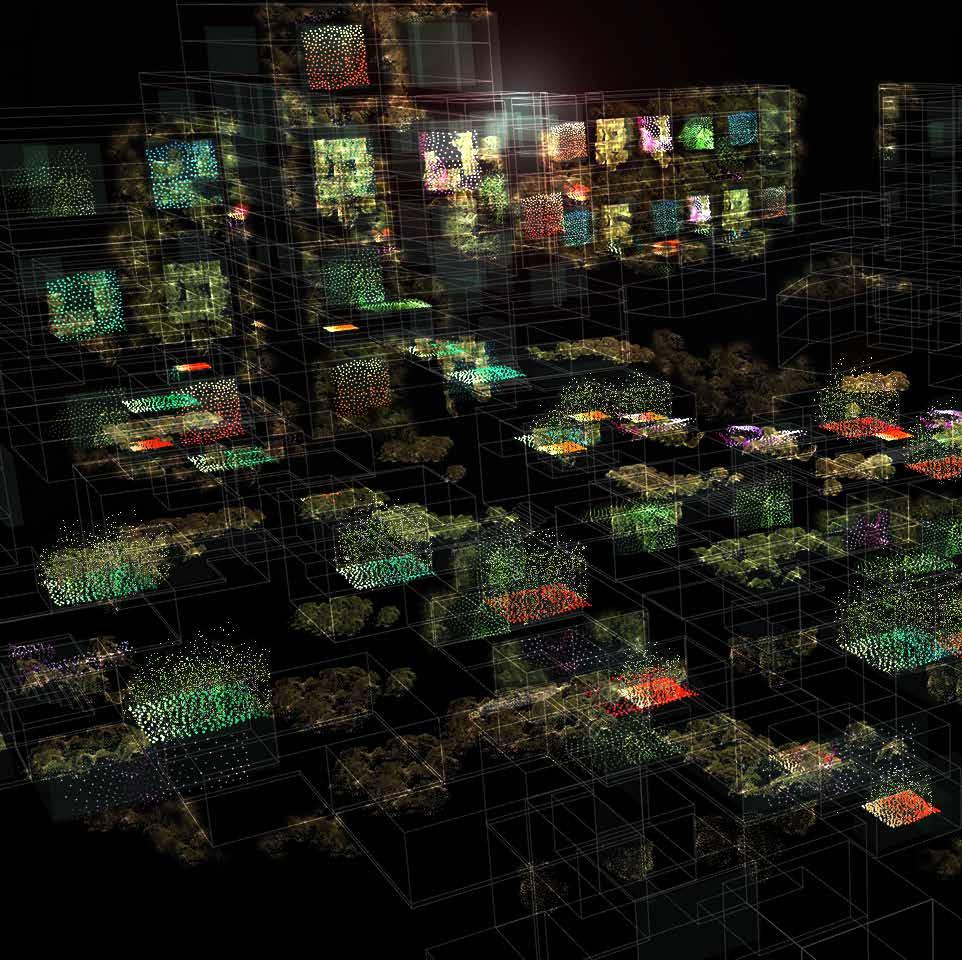
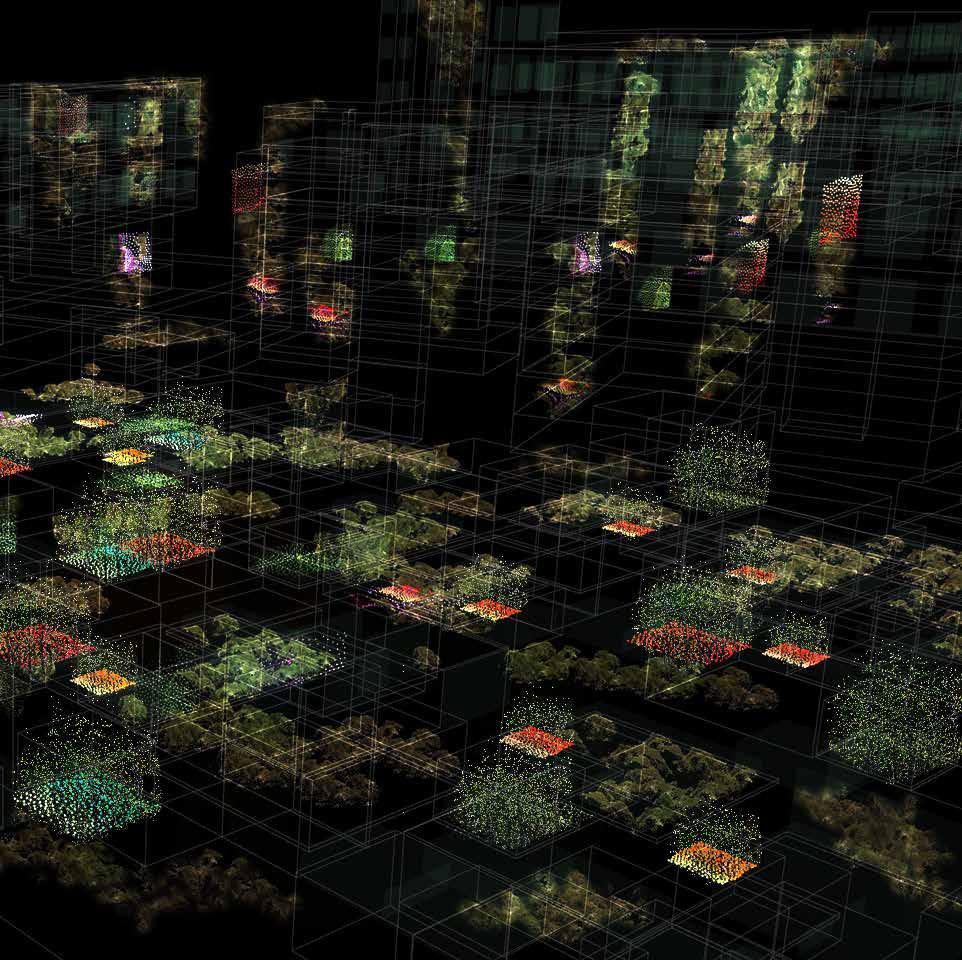
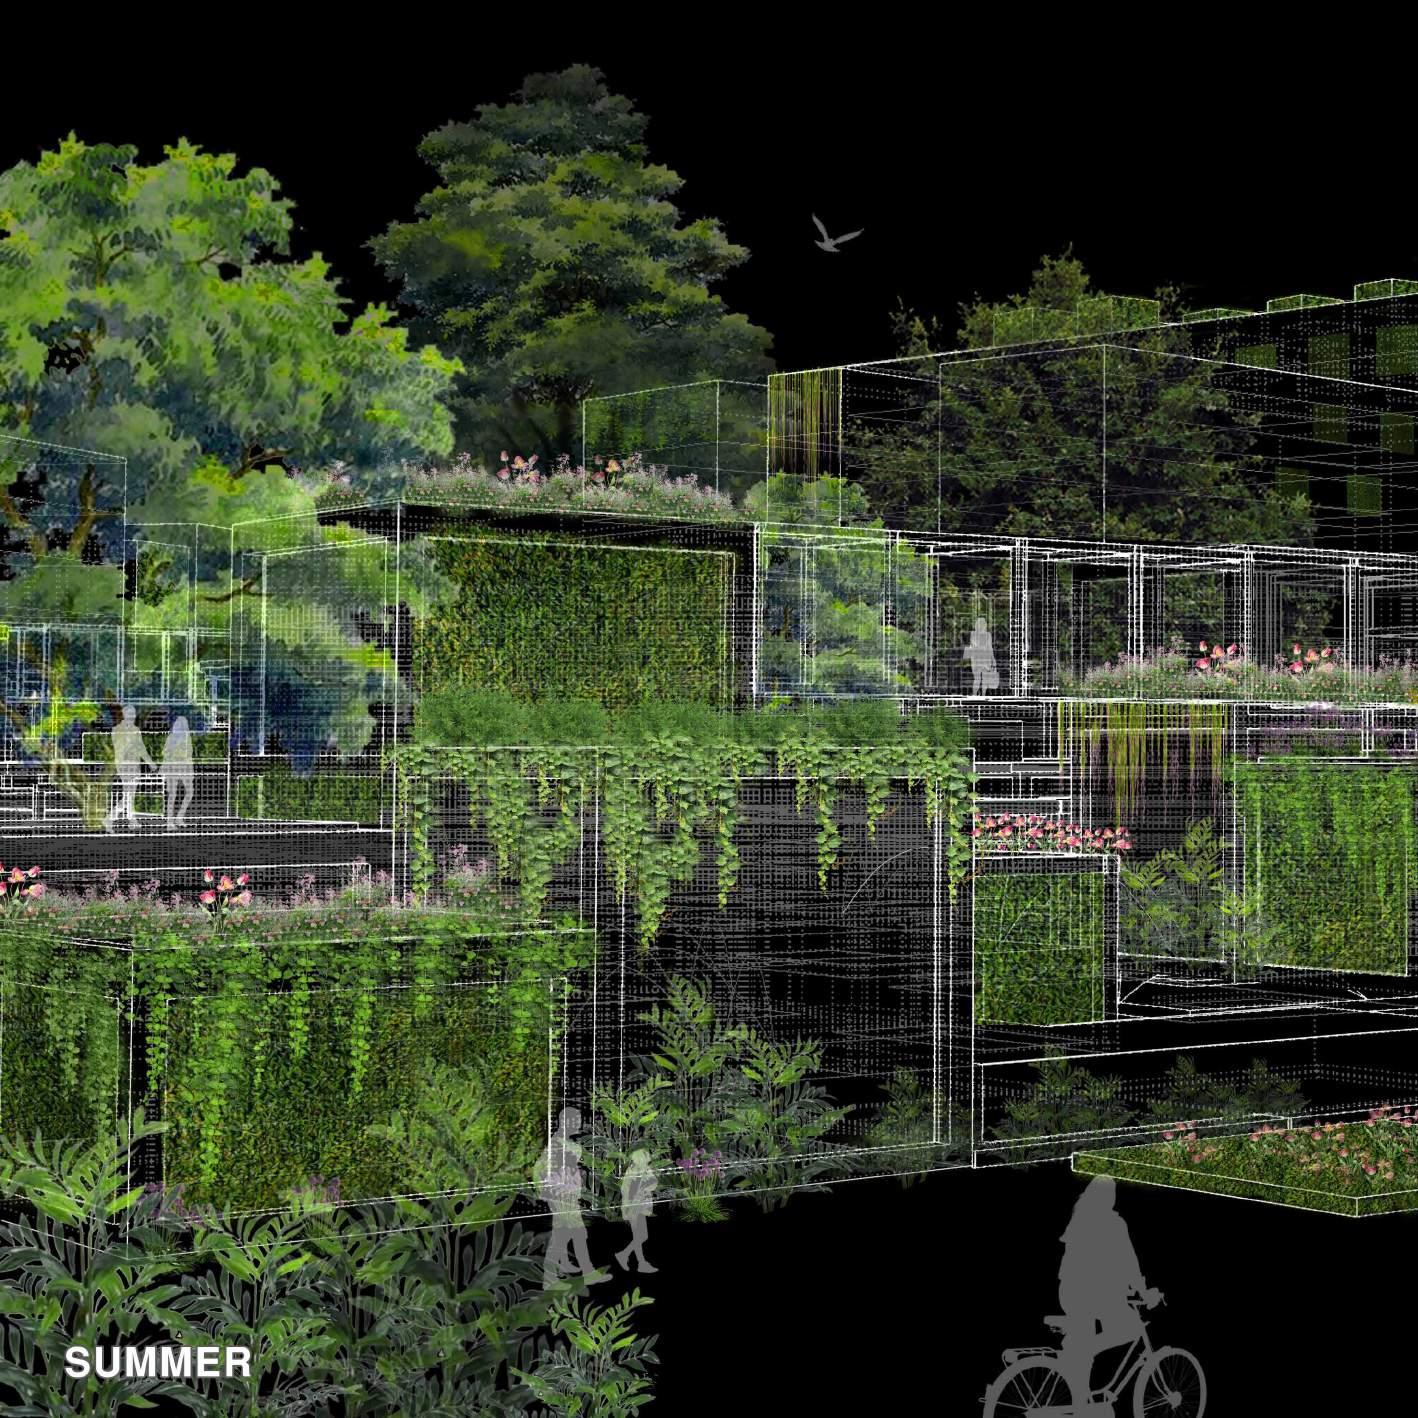
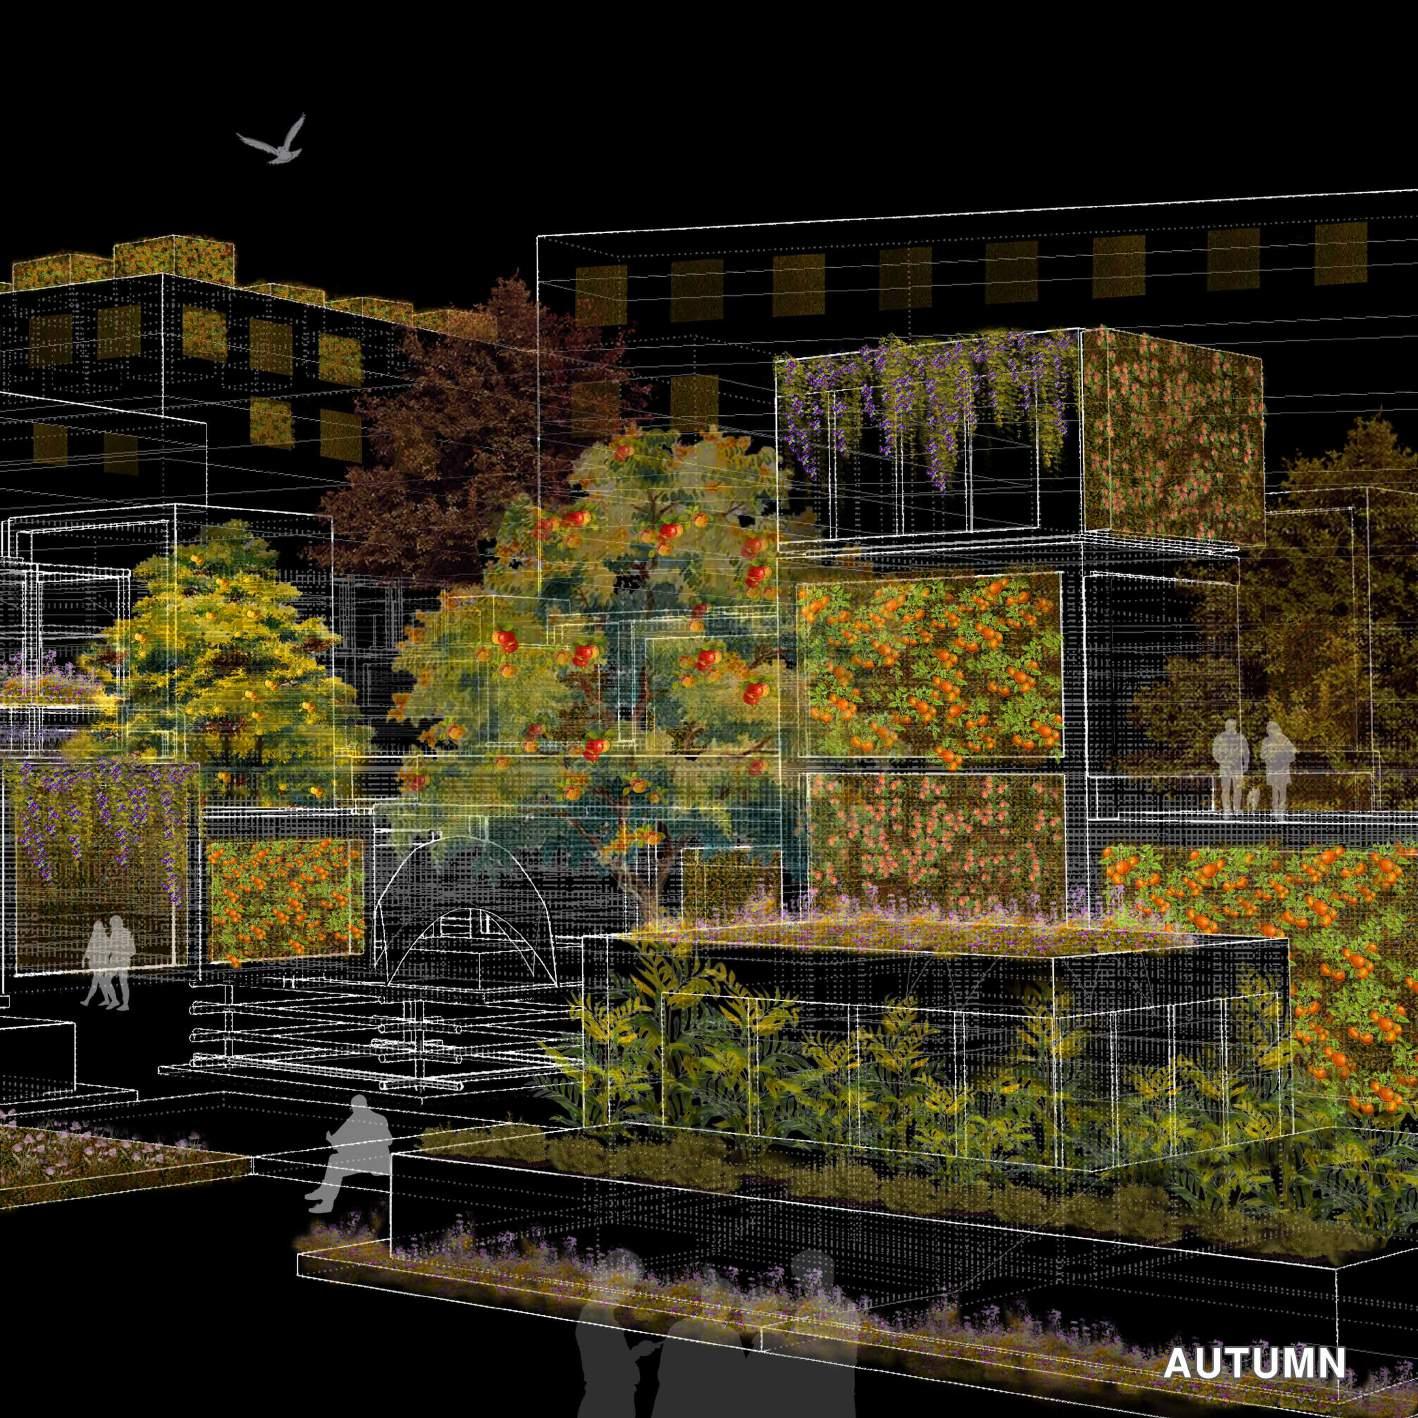
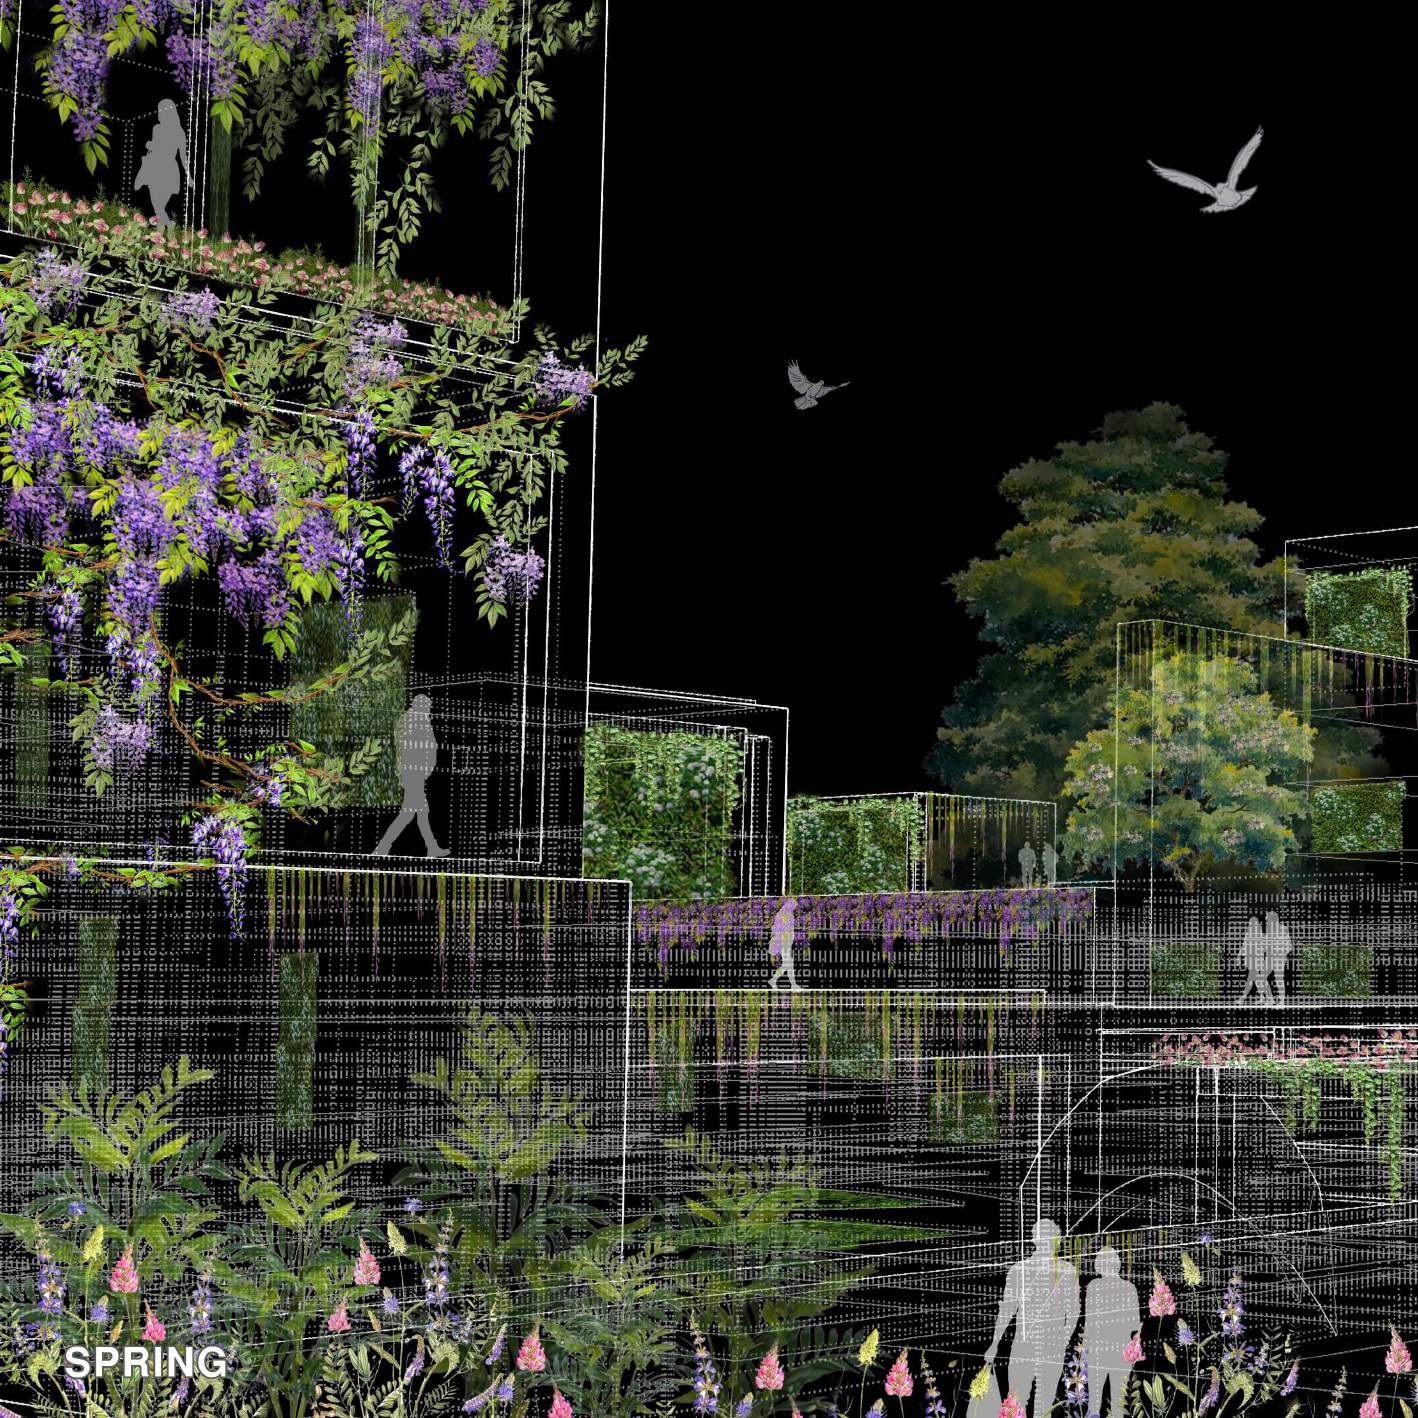
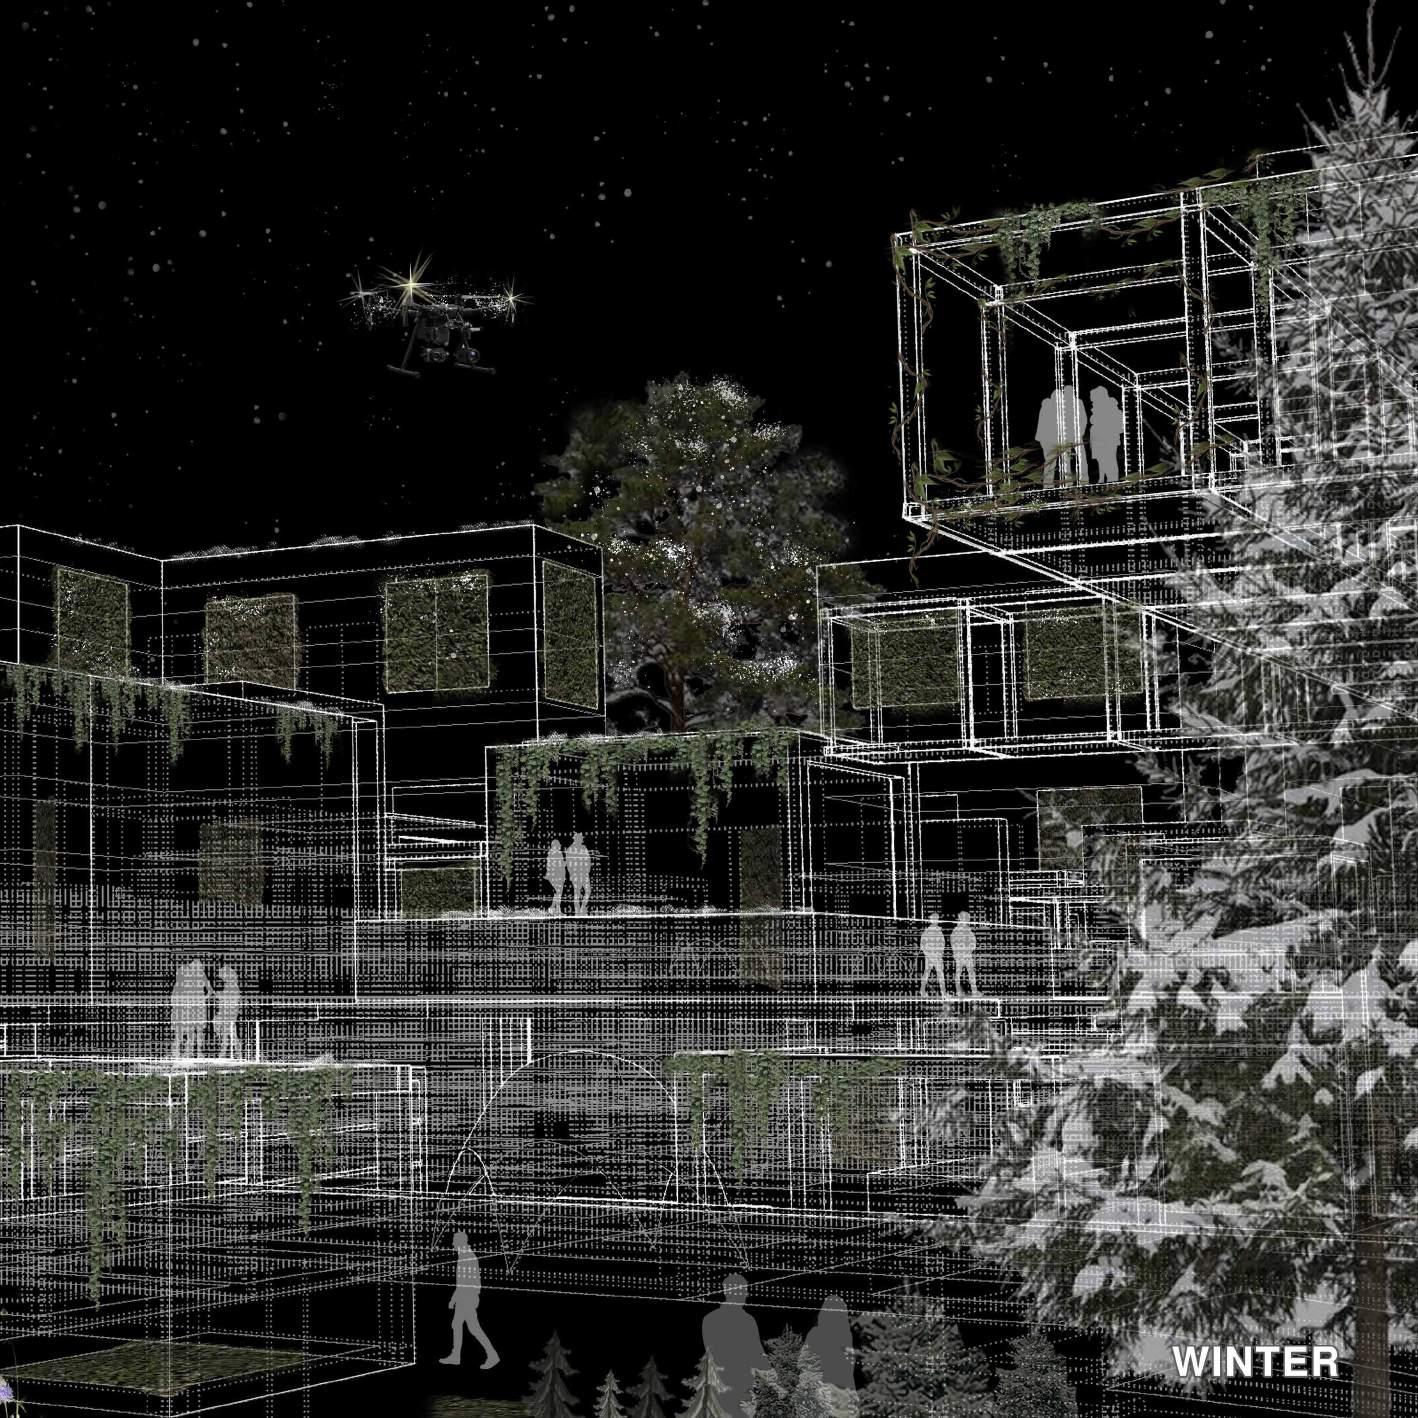
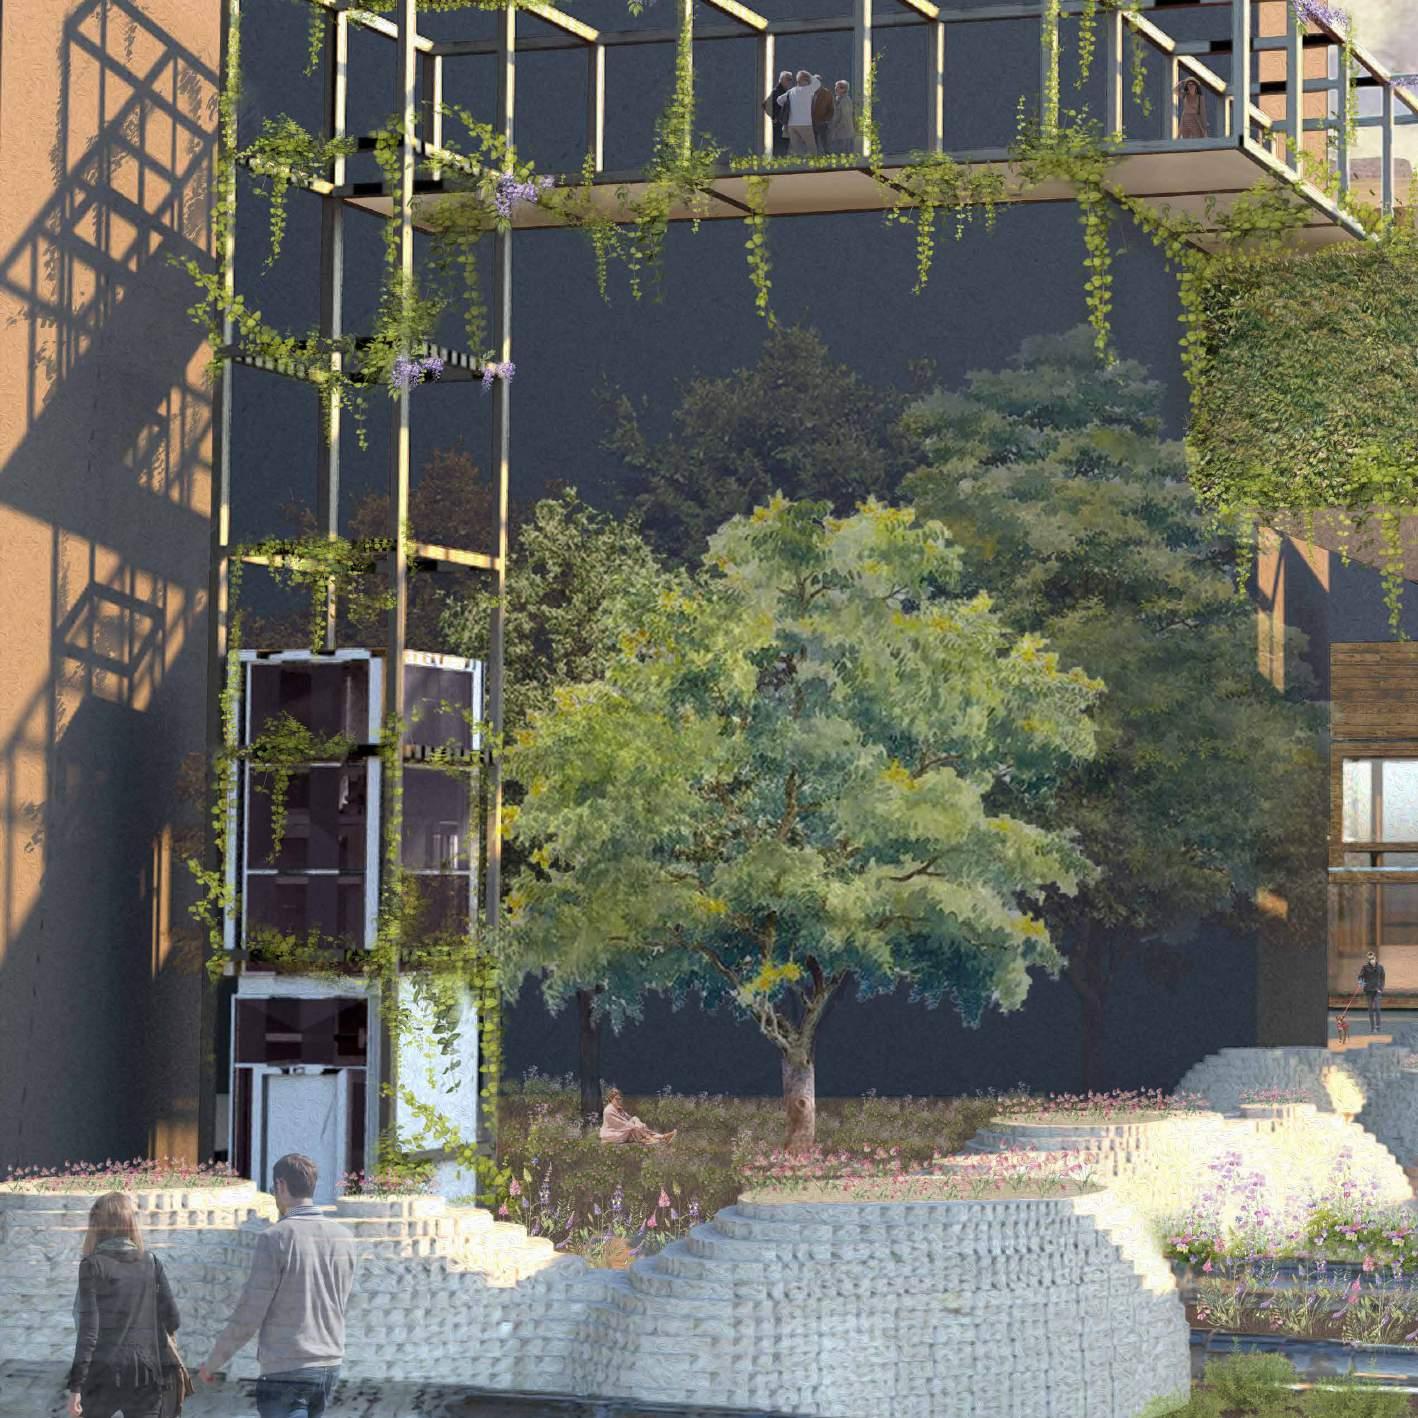
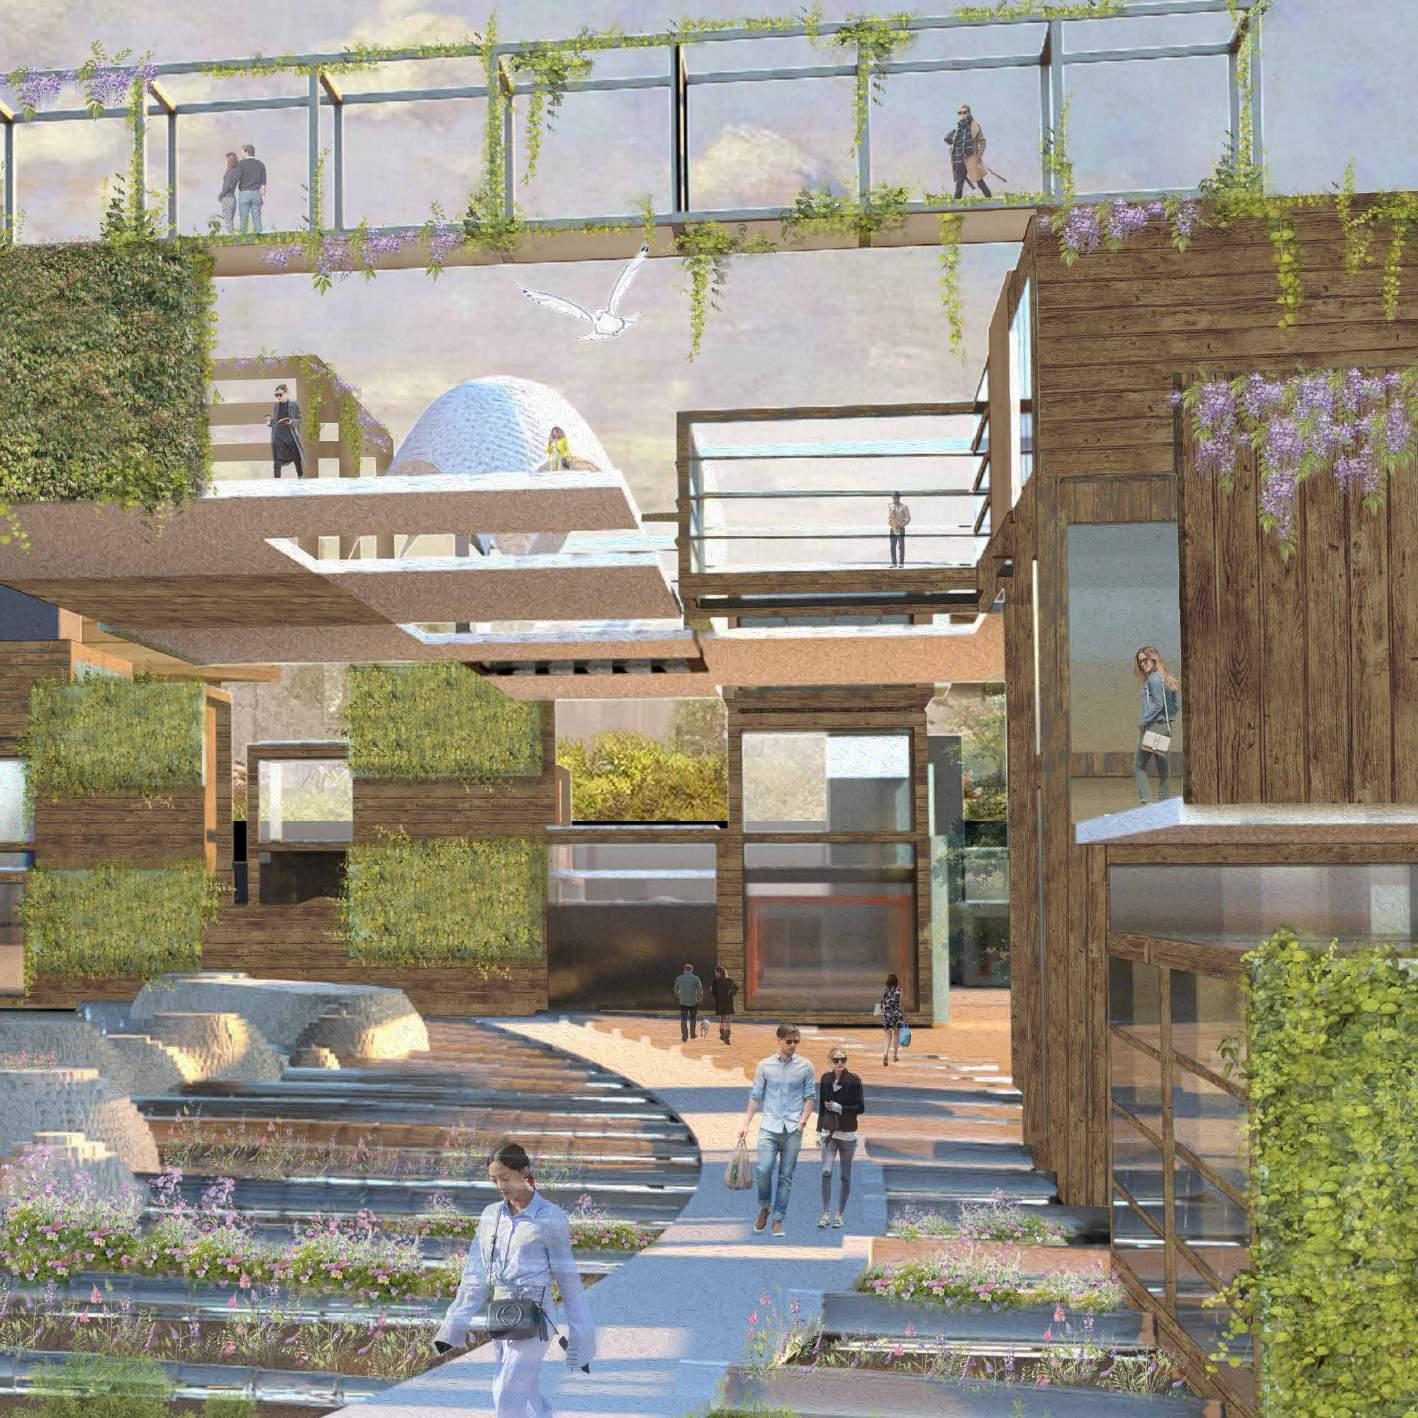
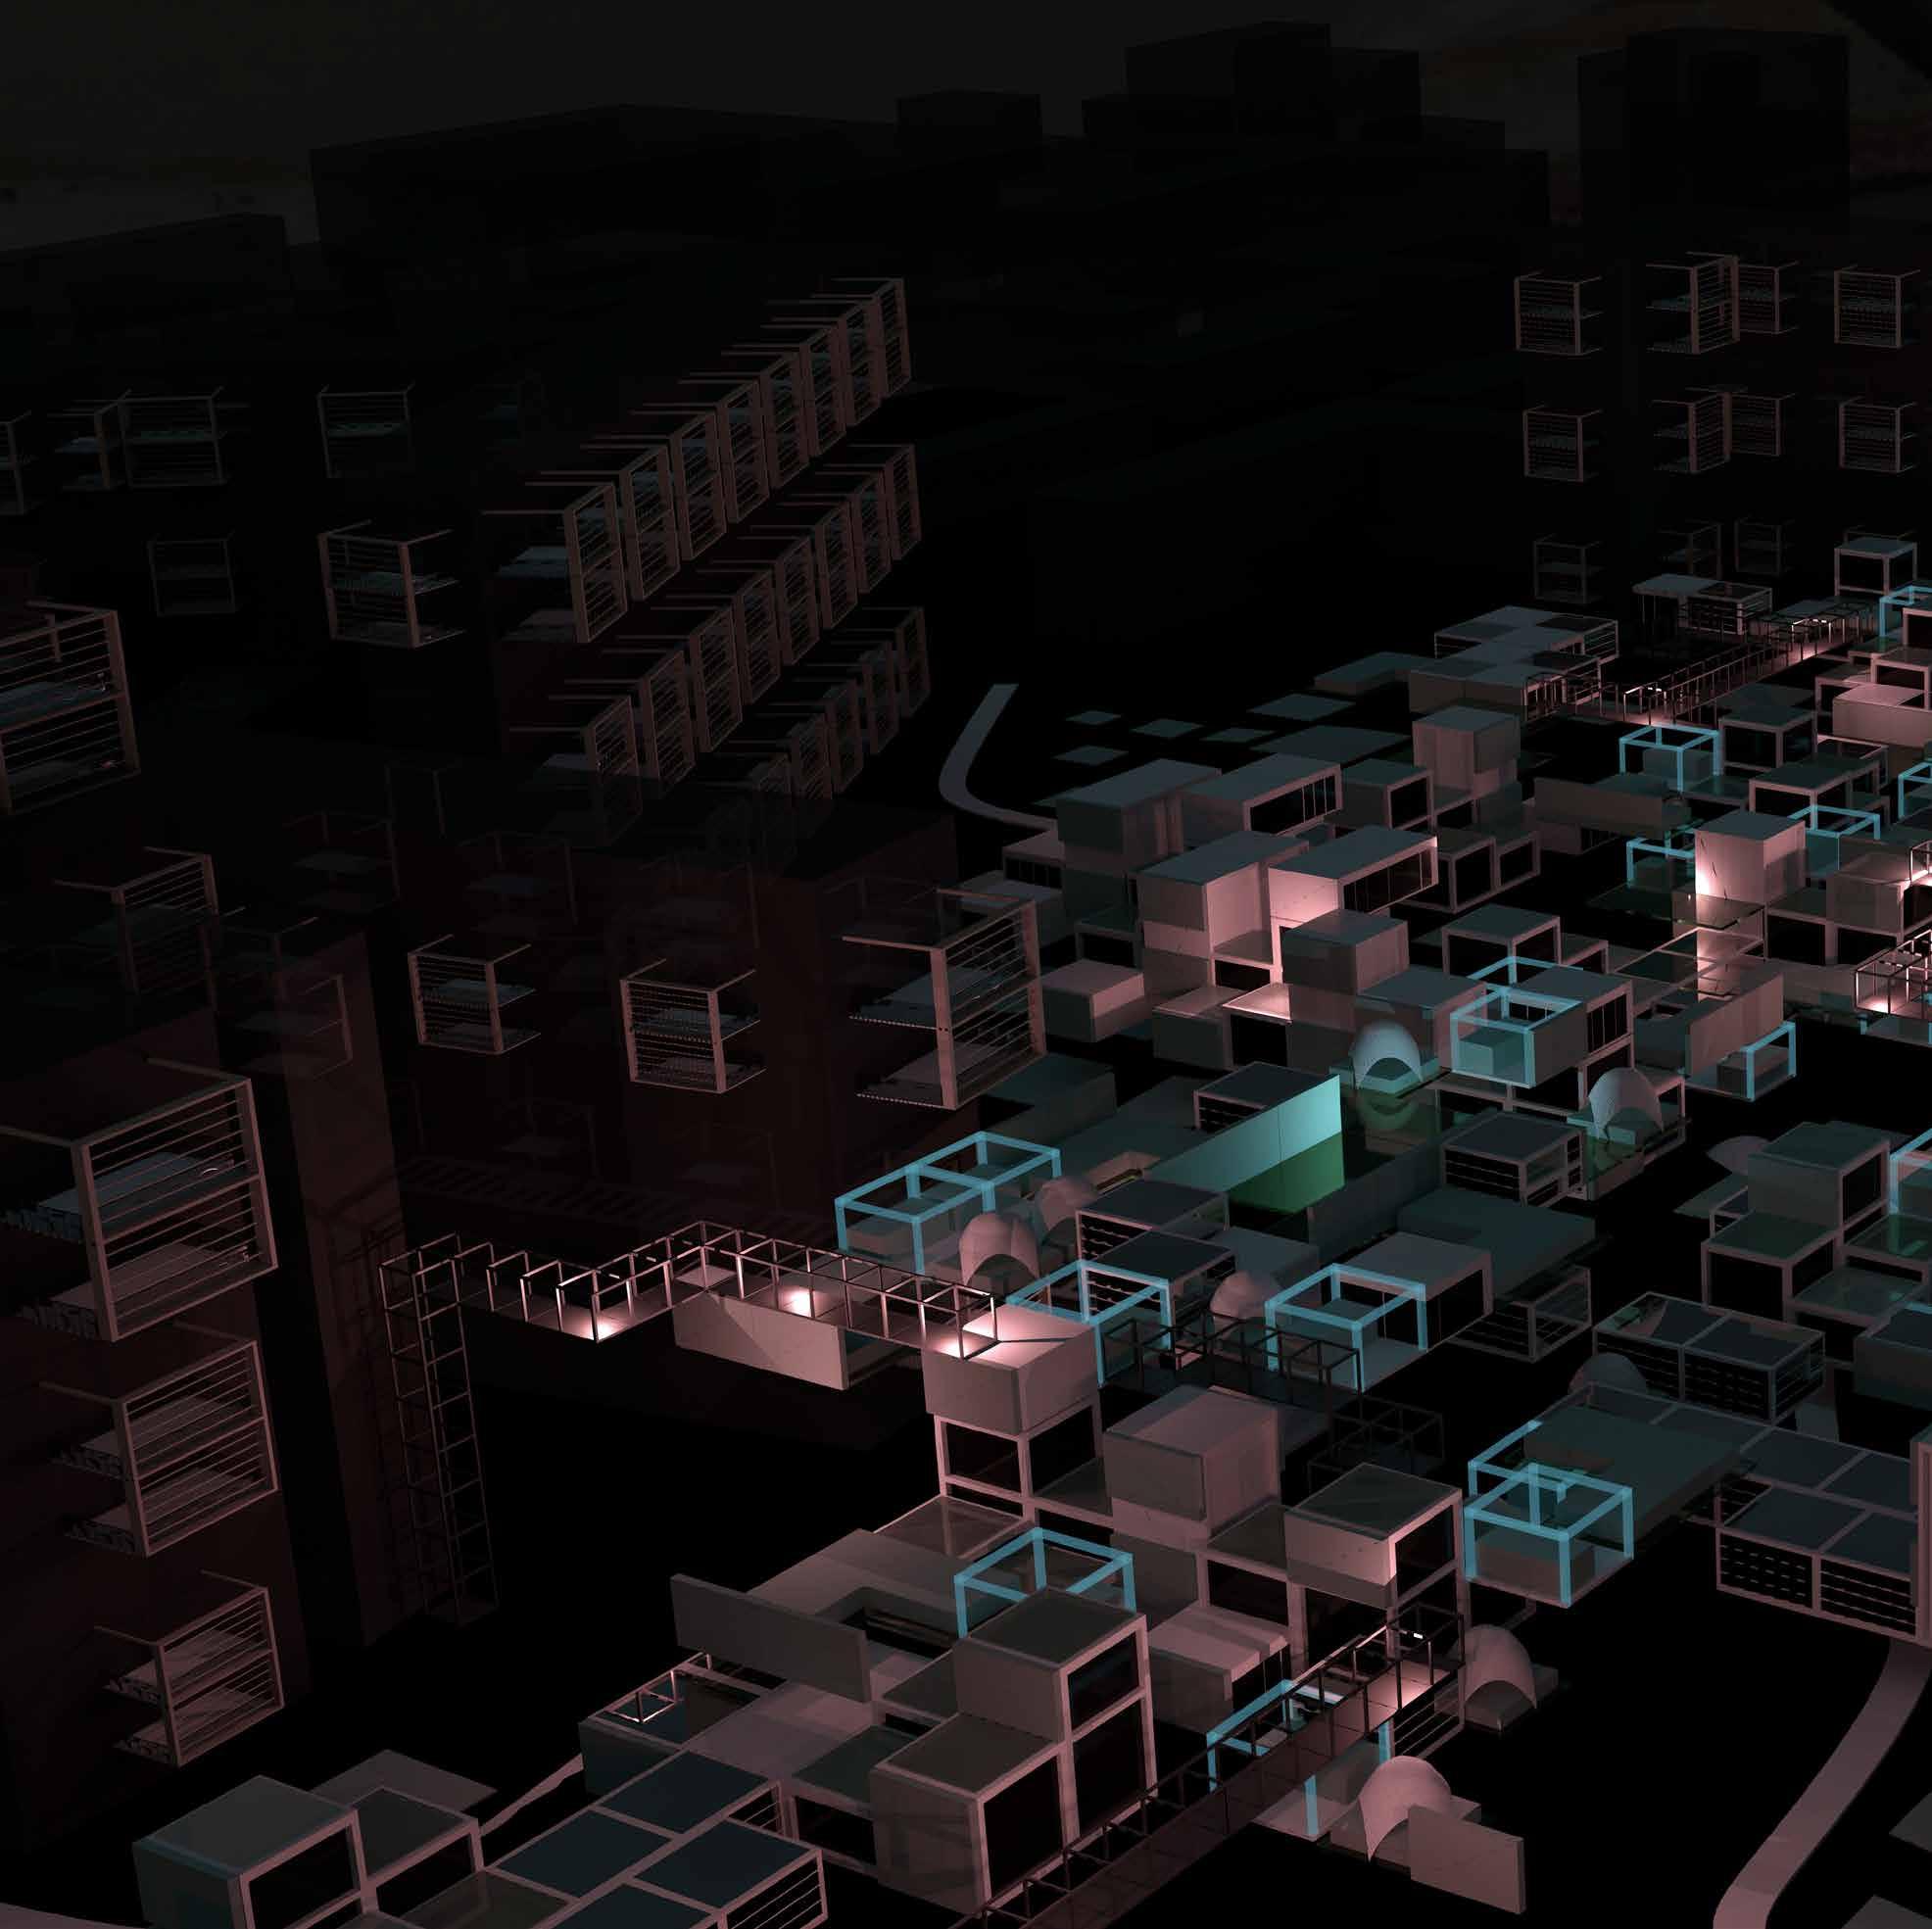
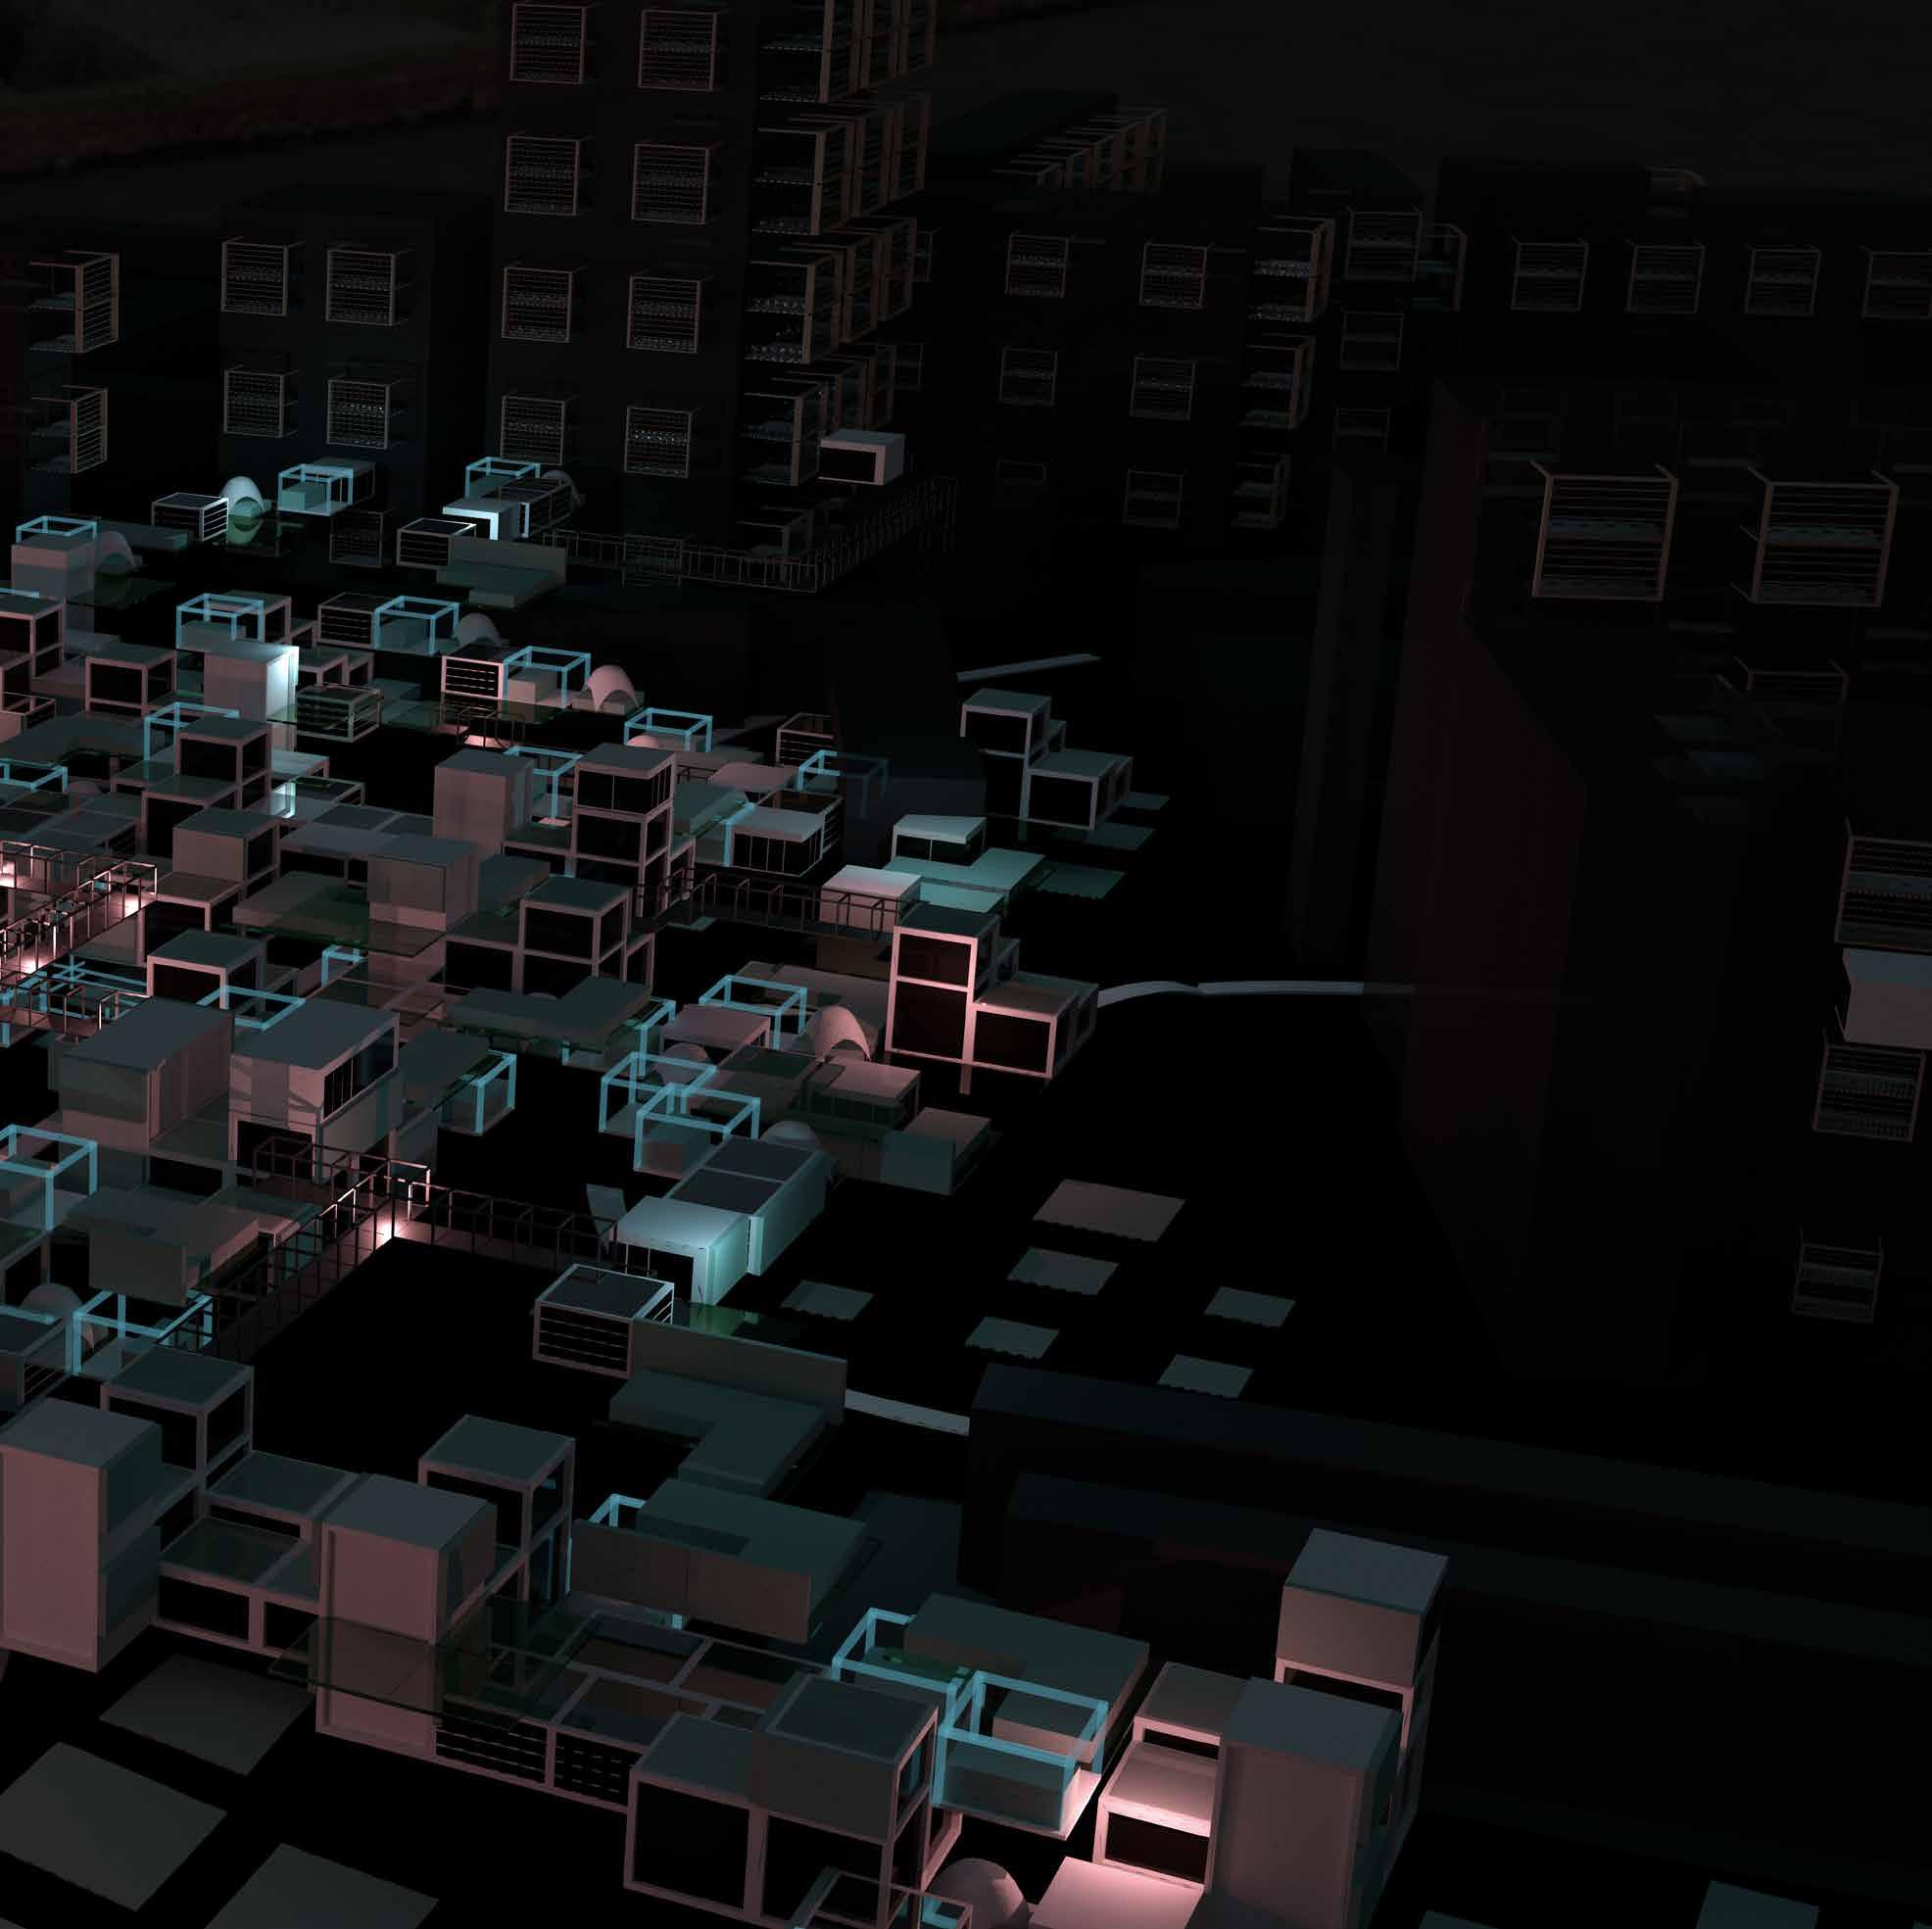
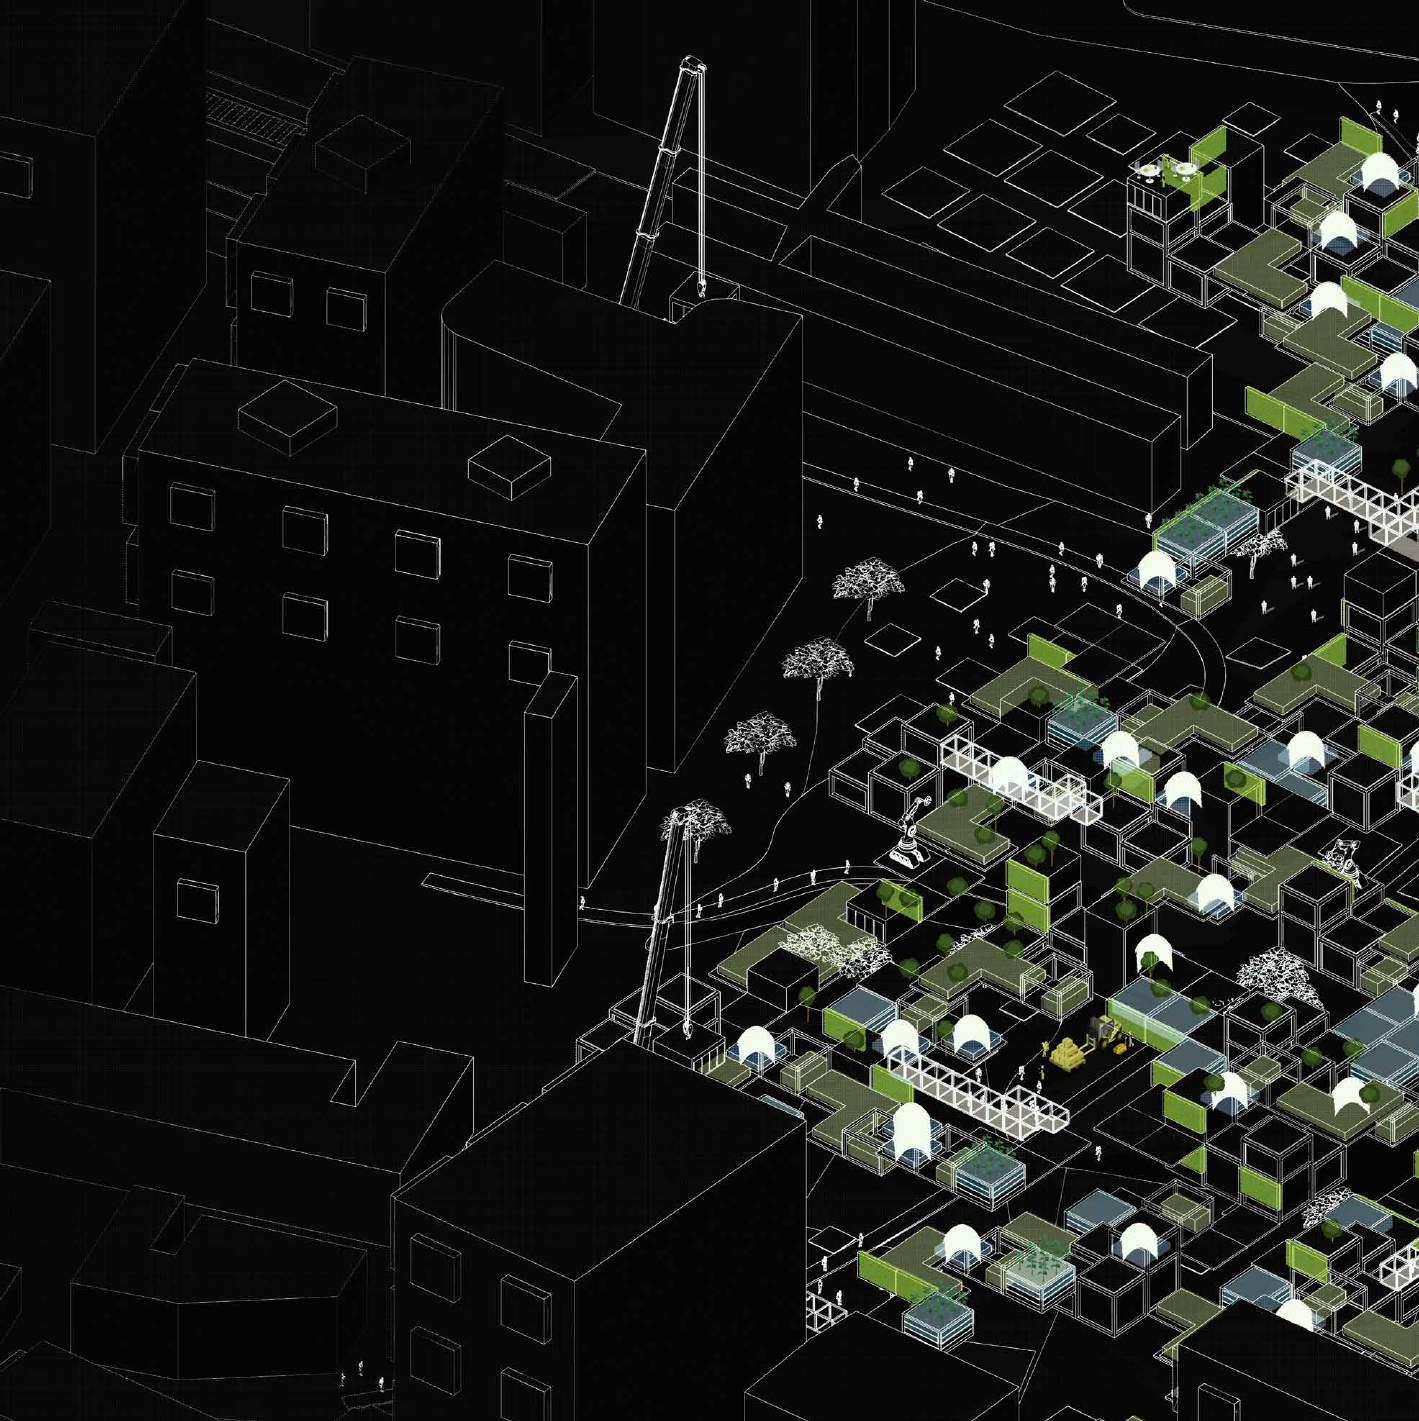
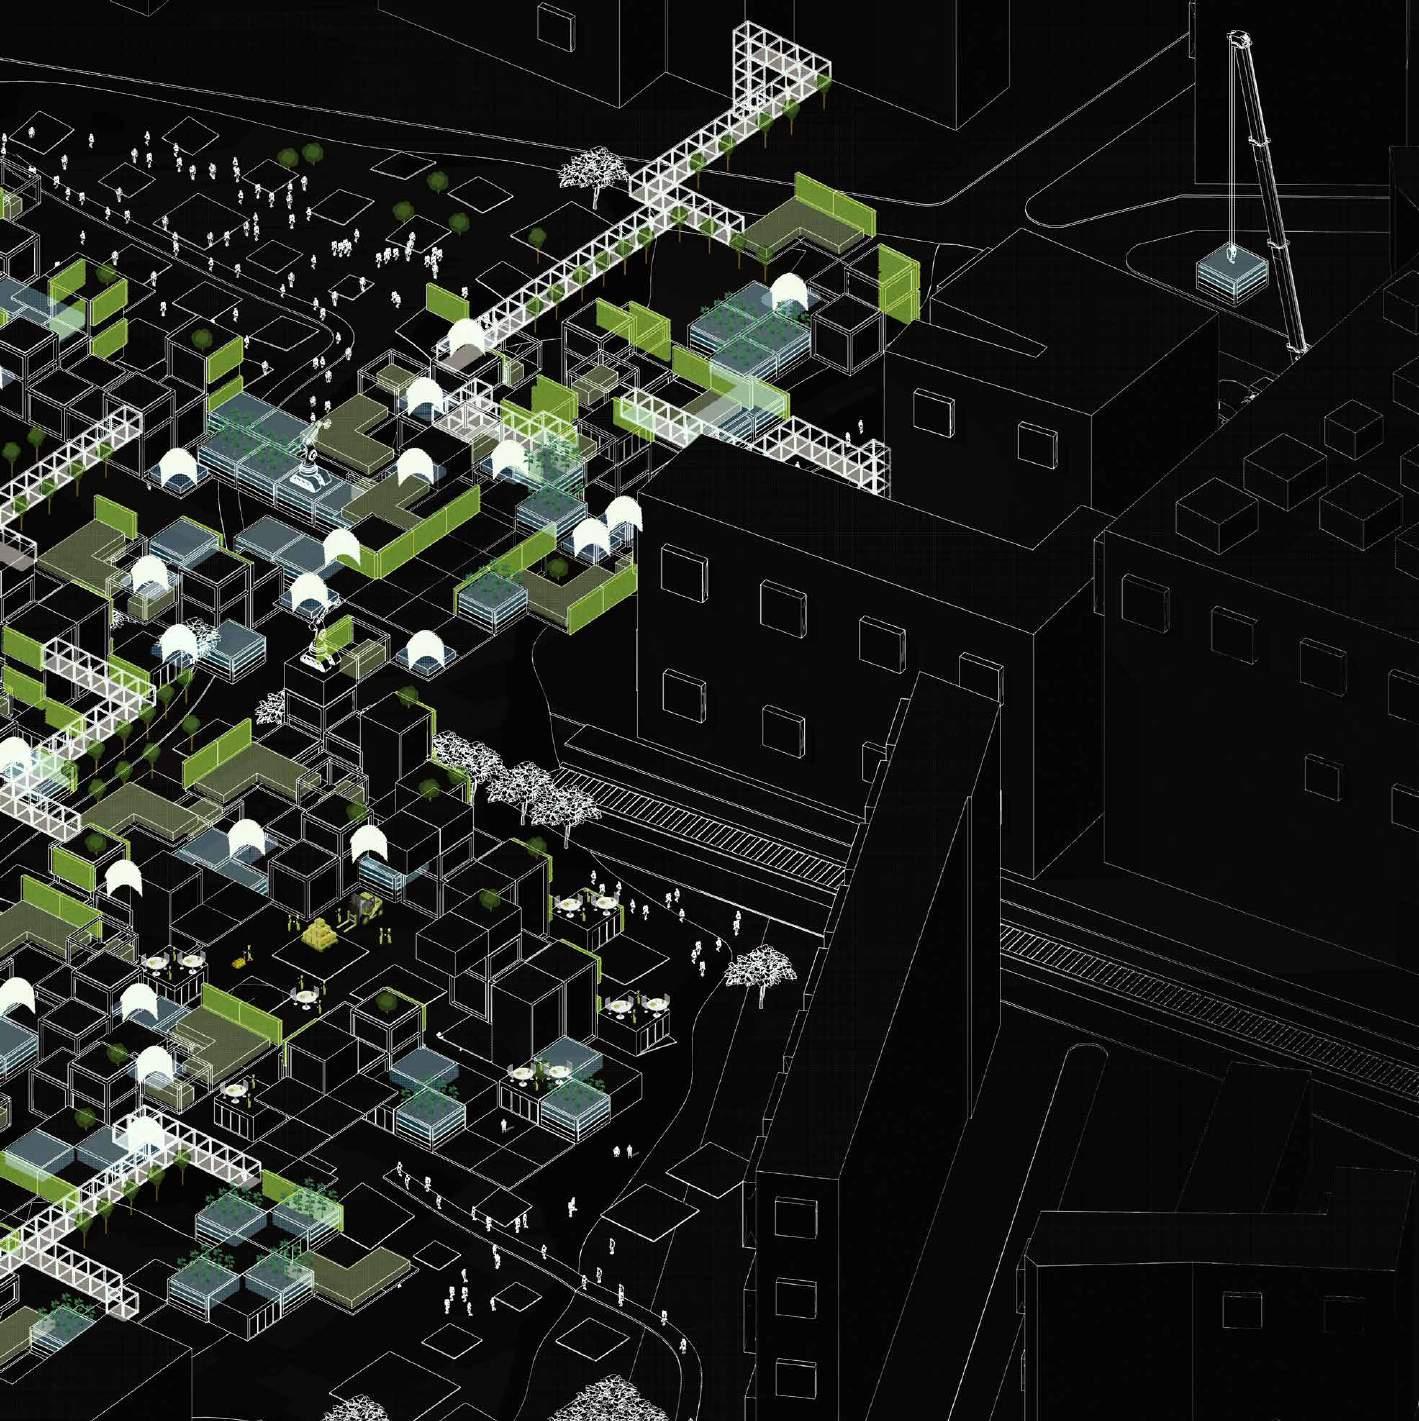
RENDERS | Agro-Matrix Axon View
RC 14: Machine Learning Urbanism
B-Pro Bartlett
AGRO-MATRIX
 Aashi Mathur
Mingze Chen Nermeen Abbas Zaidi Yanqi Zeng Shivani Sathiyamurthy