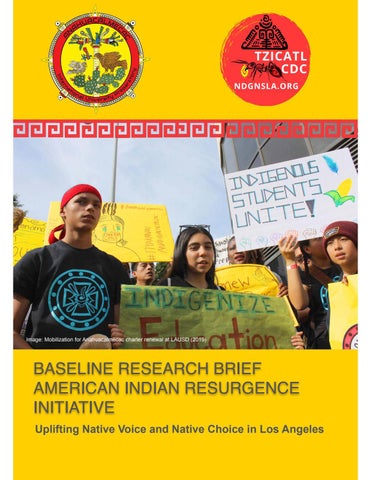
Image: Mobilization for Anahuacalmecac charter renewal at LAUSD (2019)
BASELINE RESEARCH BRIEF AMERICAN INDIAN RESURGENCE INITIATIVE Uplifting Native Voice and Native Choice in Los Angeles
2
Image: Executive Director, Marcos Aguilar and Educator teach math through the use of Maíz (2021)
3
CONTENT
Contributions, Acknowledgement and Disclaimer Executive Summary
6 - 7
Introduction
8-
Methodology
1
Results
11 - 1
Language Rights as a cornerstone of survival
16 - 19
Data & Information Gaps
20
Where do we go from here?
21 - 24
5
0
31 - 3
5
End notes
9
25 - 3
0
Silence in the Schools.
4
S
4
CONTRIBUTOR Gaspar Rivera-Salgado, UCLA Labor Center Silvia R. González, UCLA Latino Policy & Politics Initiative Marcos Aguilar, Semillas Sociedad Civil – Anahuacalmecac World School Minnie Ferguson, Semillas Sociedad Civil – Anahuacalmecac World School Reynaldo Macias, UCLA César E. Chavez Dept of Chicano/a and Central American Studies Shannon Speed, UCLA American Indian Studies Cente
ACKNOWLEDGEMENT This report was made possible by generous support from Semillas del Pueblo – Anahuacalmecac through a grant from the California Community Foundation. The authors would like to thank Ariana Hernandez, Norman de la Fuente, Laura Daza-Garcia, and in particular Victor Tran, for their research support. We are also thankful for Daniel Luu for design support, Elizabeth Pierce for copyediting, and Trinidad Ruiz for digital design This research brief is of the rst in a series that explores the language assets and needs of American Indian students in Los Angeles County to inform a data-driven educational interventions in collaboration with community partners and allies As Indigenous organizations, Tzicatl Community Development Corporation, Semillas Sociedad Civil, and Anahuacalmecac World School acknowledge the Gabrielino-Shoshone Band of Mission Indians, Shoshone-Kizh-Tongva peoples, and the Fernandeño Tataviam Mission Band of Indians as the traditional territory caretakers of Los Angeles basin and Southern Channel Islands.
DISCLAIMER
-
r
.
S
fi
S
S
.
The views expressed herein are those of the authors and not necessarily those of the University of California, Los Angeles, Semillas del Pueblo - Anahuacalme cac or Tzicatl Community Development Corporation. The contributors alone are responsible for the content of this report.
5
Image: Josue Rivas
6
EXECUTIVE SUMMARY In the fall of 2020, Tzicatl Community Development Corporation obtained a ve-year grant from the U.S. Department of Education to plan and implement the “American Indian Resurgence (AIR) Initiative: Uplifting Native Voice and Native Choice in Los Angeles.” This Initiative seeks to advance Indigenous Community-based resilience, regeneration, and resurgence, affecting the lives of thousands of Indigenous students across Los Angeles. Through the AIR Initiative, Tzicatl, along with Semillas Sociedad Civil and the Fernandeño Tataviam Band of Mission Indians Education and Cultural Learning Department, will build on their community assets and identify systemic barriers and Institutionalized failures of compulsory government schooling. With this research brief, we seek to identify, evaluate, and establish publicly available baseline data on student needs to inform data-driven educational interventions in collaboration with community partners and allies. As a starting point for this brief, we use publicly available census data to identify critical demographic trends about the American Indian population in Los Angeles. We then examine the spatial distribution of the American Indian population across neighborhoods and Los Angeles School Districts to enable community partners and allies to understand the communities and schools serving American Indian youth. Finally, we explore student enrollment data on American Indian youth in the Los Angeles Uni ed School District and learn more about their language needs. The goal of synthesizing the data in this report is to enable educational and service-providing institutions, community partners and allies to better understand the challenges in serving American Indian youth, to encourage advocacy for greater adequacy in the distribution of educational resources to these communities, and inform thoughtful long-term solutions that are tribally-driven and community centered. Our main ndings are
fi
fi
fi
fi
.
fi
:
fi
fi
fi
1. Persistent, endemic data and information gaps exist in regard to the American Indian population. Of cial data on the American Indian population is extremely limited, which obscures the presence and diversity of the American Indian population, as well as its evolving needs. Research on the consequences of more inclusive, census-based racial identity de nitions for Indigenous Peoples in general is lacking. Further, information on Indigenous languages in of cial data sources used for public resource allocation and decision-making for education policy is scarce. 2. Census-based products show an increase in the American Indian population that identify as multiracial and Latinx, particularly among those under 18. Neighborhoods with the most American Indian adults and youth include parts of central Lancaster in the Antelope Valley, followed by the unincorporated Val Verde community in Castaic, the southwestern part of the City of Covina, Alondra Park (also known as El Camino Village) in the South Bay region, and the northeast part of the City of Santa Clarita. The four uni ed school districts with the most American Indian population within its boundaries include LAUSD, Long Beach, Pomona, and Baldwin Park 3. American Community Survey data indicate that most American Indian and Alaska Native youths in Los Angeles under 18 reside in households that speak a language other than English at home. Publicly available enrollment data on English learners by language from the California Department of Education identi ed only 12 students who speak a Latin American Indigenous language in Los Angeles County, all of whom are served by
7
schools in the Los Angeles Uni ed School District. These data did not identify any students speaking a North American native language as their primary language.
Based on these ndings, we recommend 1. Innovations in the organizational culture and practices around data gathering practices related to ethnic, tribal and national origin designation and language. In particular, we recommend a commitment to language rights for Indigenous communities by all government agencies (federal, state, county, city, and local school district) and open-data policies that enable access to information on home language needs, including revitalization of Indigenous languages 2. Census data show the rapidly changing face of the local American Indian population; school districts should develop and implement new strategies that better and more accurately capture the changing demographic composition of American Indian students within a localized area of service (i.e. school districts, etc.) to address their speci c educational needs 3. Acquisition of new information and analyses on race, ethnicity and language topics to enable student and family-led systemic change. Speci cally collecting data from tribal and community membership directly as to their preferred methodologies and outcomes for their own language, tribe or nation. 4. There is a need to census (not sample) the Indigenous groups in Los Angeles and possibly California, as regards Indigenous identi cation, and language pro ciencies to provide services, and develop language revitalization and instruction programs where desired.
fi
fi
fi
fi
:
.
fi
.
fi
Image: Nahuatl teachers (left) Tata Cuaxtle Felix Evodio and (right) Juana de la Cruz Farias (2012)
8
INTRODUCTIO Tzicatl Community Development Corporation (Tzicatl CDC) was founded in Los Angeles in 2002. Its mission is to advance the rights of Indigenous Peoples through the reparation of community and advocacy for healthy ecosystems to cultivate Indigenous education and culture in ancestral lands. Tzicatl CDC cultivates and supports Indigenous education as a critical partner and sister organization to Semillas Sociedad Civil (Semillas), a 501(c)(3) nonpro t Indigenous educational organization, which operates the Anahuacalmecac International University Preparatory of North America (Anahuacalmecac) public charter school. In the fall of 2020, Tzicatl CDC obtained a ve-year grant from the U.S. Department of Education to implement the “American Indian Resurgence (AIR) Initiative: Uplifting Native Voice and Native Choice in Los Angeles." This Initiative seeks to advance Indigenous Communitybased resilience, regeneration, and resurgence, impacting the lives of thousands of Indigenous students across Los Angeles. The AIR Initiative: Native Youth to College through Community Pathways aims to increase access to and self-determination of quality, culturally relevant, evidence-based, and evidence-informed education and enrichment services for Native American students and parents. The Initiative is centered around privileging the lived experiences and aspirations of Native families in our communities. The Initiative aims to create opportunities for students to participate in the most appropriate services for themselves and their families. Its focus is rooted in our region’s unique Indigenous historical and cultural context and responsive to the urgent contemporary needs of Los Angeles area Native communities today The main goal of this Initiative is to uplift tribal self-determination in the Los Angeles area among middle and high school students and their families by providing access to high-quality and culturally relevant educational programs and services that cultivates a living Indigenous education ecosystem, support their Native identities within our unique geographical, historical,
fi
fi
N
.
Image: Minnie Ferguson, Director of Education, and community leaders demand Indigenous education at LAUSD headquarters.
fl
9
and cultural context, and create pathways to high school achievement and college enrollment. Tzicatl is spearheading this Initiative based on its extensive experience of providing administrative, convening, community outreach and educational service coordination to the Los Angeles region’s diverse Native families and communities. The AIR Initiative, Tzicatl, Semillas, and the Fernandeño Tataviam Band of Missions Indians Tribal Government seek to build on our shared community assets and identify systemic barriers and institutionalized failures of compulsory government schooling. Among the most impactful systemic failures of public education is the treatment of maternal and heritage languages. Examples of policies feeding such failures are California’s Proposition 227, which banned bilingual education for almost two decades after its passage in 1998 and federal education policies such as No Child Left Behind which drove an English-only, high-stakes imperative across the country. With forced-campus closures, the COVID-19 pandemic has widened an educational achievement gap, in particular for English learners. To overcome this gap, not only is systemic change imperative at the institutional level, but more importantly, Indigenous tribes, youth and families need to be able to re-establish an entire ecosystem rich in community, culture, and creativity where they can ourish. With this research brief, the AIR Initiative seeks to establish baseline data on student assets and needs to inform a series of data-driven educational interventions in collaboration with community partners and allies. As a starting point for this brief, we use publicly available census data about the American Indian population in Los Angeles to identify key demographic trends. We then examine the spatial distribution of the American Indian population across neighborhoods to enable community partners and allies to understand the communities and schools serving American Indian youth. Finally, we include student enrollment data on American Indian youth in the Los Angeles school system to learn more about their language needs. The goal of these analyses is to enable community partners and allies to better understand the communities and schools serving American Indian youth, encourage advocacy for greater adequacy in the distribution of educational resources to these communities, and inform thoughtful long-term solutions to increase college attainment by American Indian students.
Image: Corn planting ceremony at Anahuacalmecac. ( 2021)
9
10
METHODOLOG We used published data from the decennial censuses, and the most recent 2019 American Community Survey estimates for the rst part of the report. The U.S. Bureau of the Census classi es American Indians and Alaska Natives (AIAN) in three ways based on the options census respondents are provided with when completing a census form: (1) a single-race or “alone” count representing respondents who selected only the AIAN racial category in the survey instrument; (2) a multi-race or in-combination count representing those who self-reported being AIAN and some other race; (3) a more inclusive count of those who select AIAN alone or in combination (sum of 1 and 2 above). Following the research practices by Ong & Ong (2012), we use these three de nitions in our analysis.1 We compared county-level, census tract, block group level, and school district data as well as one-year, 5-year, and public-use microdata (PUMS) to assess data availability and examine consistency across datasets and geographies. As such, the analyses presented in the rst part of the report use various data sources and geographical scales; however, we consistently use ACS 5-year estimates
.
fi
fi
fi
Y
fi
fi
fi
The U.S. census collects limited data on North American Indigenous languages circumscribed to those within U.S. jurisdictions, with little concern, until recently, with Indigenous languages from Latin America. As such, we used information on student enrollment to examine both North American and Latinx Indigenous language diversity. We obtained data from DataQuest and represent annual K-12 public school enrollment by student ethnicity and grade level for the selected report level (state, county, district, or school) for the 2020-21 academic year. According to the California Department of Education (CDE), annual enrollment consists of the number of students enrolled on Census Day (the rst Wednesday in October), which are submitted and certi ed by local educational agencies (LEAs) and charter schools to the CDE as part of the annual Fall 1 data submission in the California Longitudinal Pupil Achievement Data System (CALPADS).2
11
RESULT Los Angeles is Indian Country Los Angeles County is home to the nation's largest population of American Indians and Alaska Natives (AIAN). This section presents available census data about the American Indian population in Los Angeles to identify critical demographic trends see Table 1. According to the latest 2019 5-year American Community Survey, almost 164,000 people self-identify as American Indian or Alaska Native called Los Angeles home (1.6 percent of the 10 million county population). The population has increased by roughly 18 percent in the past two decades, growing in modest numbers between 2000 (139,000) and 2010 (141,000), and then jumping in 2019 (164,000). The growth was concentrated among those who identify as multiracial rather than the single-race population, particularly among the young Table 1. American Indians and Alaska Natives Adults and Youth Population, 2000-201
All AIANs
Single Race or Alone AIANs
Multiracial AIAN
Data Year
Total
18 and over
Under 18
2000
138,696
68%
32%
2010
140,764
73%
27%
2019
163,933
77%
23%
Change 2000 to 2019
18%
33%
-14%
2000
76,988
67%
33%
2010
72,828
74%
26%
2019
74,480
78%
22%
Change 2000 to 2019
-3%
12%
-34%
2000
61,708
70%
30%
2010
67,936
73%
27%
2019
66,284
73%
27%
Change 2000 to 2019
7%
6%
12%
9
.
S
Source: Tabulated by authors from 2000 and 2010 decennial census; 2015-2019 5-year American Community Survey PUMS using PUMA geographies in Los Angeles County. Adapted from Ong & Ong (2012).
12
Between 2000 and 2019 the American Indian and Alaska Native population grew by 18 percent. However, the increase was accompanied by a decline (3 percent) in those that identify with a single-race AIANs as well as an increase in the number of multiracial (7 percent). The population is also aging, primarily amongst those that identify as single race. In 2000, about 67 percent of adults identi ed as single race and this share increased by 12 percent by 2019— half the increase experienced by those that identify as multiracial (6 percent). In 2000, more than one-third of the AIAN population was under the age of 18, by 2019 that share declined to 23 percent. The decline in youth was driven primarily by a drop (34 percent) in the share of youth that identify with a single race. Conversely, the share of youth who identify as multiracial grew by 12 percent between the two decades. A decline in Los Angeles’ American Indian population began in the 1970s, which coincided with the termination of the Voluntary Relocation Program by the Bureau of Indian Affairs.3 However, the drivers behind the notable demographic composition shifts in more recent decades are understudied largely in part due to incomplete vital records in Los Angeles and limited data about Indigenous People in general.4 Initial research suggests the aging of the population is not enough to offset the dramatic changes.5 Underneath the American Indian or Alaska Native stand an array of diverse cultures and languages. Changes to the way the Latinx Indigenous population are counted are likely signi cant drivers. Starting with the 2000 enumeration, the U.S. Bureau of the Census gave respondents the option to choose more than one race, shadowing societal changes around race, ethnicity, and self-identi cation. Across the country, the opportunity to mark more than one race impacted American Indians the most.6 In addition to fading stereotypes and cultural repression that previously curbed identi cation, more inclusive de nitions opened the door for whites of Indian descent to identify with American Indian ancestry.7 Changes to reporting forms and de nitions also enabled self-identi cation for Latinx Indigenous People.8 The number of AIANs that identi ed as Latinx or Hispanic increased considerably, from about 51,000 in 2000 to over 57,000 in 2019, an 11 percent increase. For American Indian and Alaska Natives youth as a whole, the majority (almost 56 percent) reside in households that speak a language other than English at home in 2019. Further, a majority of AIANs under 18 identify as Hispanic or Latinx (81 percent).
American Indians in the LA School Districts This section examines the distribution of the American Indian and Alaska Native population across neighborhoods and school districts in Los Angeles County to enable community partners and allies to understand the communities and schools serving American Indians. The data are from the 2019 5-year American Community Survey for the population who selected AIAN alone or in combination (the most inclusive count) within that school district, regardless of age.
fi
fi
fi
fi
fi
fi
fi
fi
fi
Map 1 shows the distribution of the AIAN population across Los Angeles. The top ve neighborhoods within the County home to AIAN adults and youth include: parts of central Lancaster in the Antelope Valley with almost 900 residents, followed by the unincorporated Val Verde community in Castaic with about 800 residents. In third place, with roughly 500 residents, neighborhoods with the most AIAN population include: the southwestern part of the City of Covina, as well as Alondra Park (also known as El Camino Village) in the South Bay region and the northeast part of the City of Santa Clarita adjacent to Castaic.
13
Map 1. AIAN Adults and Youths in Los Angeles Neighborhoods, 201
9
fi
.
As shown in Table 2, the four uni ed school districts with the most AIAN population within its boundaries include LAUSD (See Map 2), the second-largest school district in the U.S., followed by Long Beach, Pomona, and Baldwin Park. The top three elementary school districts include Palmdale, Sulphur Springs in Santa Clarita, and El Monte. The top three secondary school districts with the most AIAN population include Antelope Valley, William S. Hart in Santa Clarita, and El Monte
14
Table 2: AIAN Adults and Youths Living within School District Boundaries, 2019 Unified School Districts (over 2,500 total AIAN)
Total AIAN
Los Angeles Unified School District
68,682
Long Beach Unified School District
10,266
Pomona Unified School District
5,894
Baldwin Park Unified School District
4,987
Azusa Unified School District
2,998
Inglewood Unified School District
2,925
Pasadena Unified School District
2,591
Elementary School Districts (over 1,500 total AIAN) Palmdale Elementary School District
3,116
Sulphur Springs Union Elementary School District
2,824
El Monte City School District
2,399
Westside Union Elementary School District
2,174
Lancaster Elementary School District
1,863
Mountain View Elementary School District
1,761
Newhall Elementary School District
1,616
Saugus Union Elementary School District
1,583
Secondary School Districts Antelope Valley Union Joint High School District
8,004
William S. Hart Union High School District
7,465
El Monte Union High School District
4,456
Whittier Union High School District
4,037
Fullerton Joint Union High School District
3,743
Centinela Valley Union High School District
2,442
Alhambra Unified School District (9-12)
322
.
Source: American Community Survey 2019 5-year Table B02010 by School Districts, American Indian And Alaska Native Alone or In Combination with One Or More Other Races
15
9
Map 2: AIAN Adults and Youths within School District Boundaries, 201
16
Language Rights as a Cornerstone of Language Survival Indigenous language revitalization can transform the historical legacy of linguicide--the efforts by public education and government institutions to invisibilize and silence cultures and languages in the name of assimilation and social progress. As with data on Indigenous ethnicity, information on linguistic diversity is hard to nd in public data sources, in particular for Indigenous immigrants due to fears of discrimination or their legal status. A special tabulation by the U.S. Census Bureau estimates that between 2009-2013, an average of 1,205 Indigenous language speakers from Latin America resided in Los Angeles County and slightly more than 1,000 speak Navajo or another Native North American language. Nationally, many Indigenous American languages show demographic decline.10 Yet existing data collection approaches continue historical erasure policies by failing to recognize and report the diversity of Indigenous populations and complex languages.The following explores data on student enrollment data on American Indian youth in the Los Angeles school system to learn more about their language needs Understanding these needs is more critical than ever as English learners faltered amid California school closures during the COVID-19 pandemic11 and current laws place the burden of proof on educational institutions to show a need for aid to fund language accommodations. We start with enrollment data in public schools by ethnic designation for the 2020-2021 school year. Ethnic designation, as well tribal af liation, are useful measures to identify language needs. We then present information on English learners, a classi cation based on meeting mainstream English pro ciency. It is important to note that annual enrollment consists of the number of students enrolled on the rst Wednesday in October (known as Census Day), which are submitted and certi ed by local educational agencies.
Ethnic Designatio
fi
fi
fi
fi
n
.
fi
fi
fi
.
During the 2020-2021 school year, over 6 million students were enrolled in all California district and charter schools.12 Of these, more than 28,000 identi ed as American Indian or Alaska Natives13 (See Table 3). San Diego is the county with the most enrolled AIAN youth (2,557), followed closely by Los Angeles County (2,529) and then Riverside (1,788).14 The counties with the largest share of the student population that identify as American Indian or Alaska Natives are Alpine (41% out of 73 students), Del Norte (14% out of 4,247 students), and Inyo (11% out of 4,059 students)
17
Table 3. Enrollment in Public Schools by Ethnic Designation, 2020-21 California
LA County
LAUSD
5%
7%
8%
American Indian or Alaska Native
0.5%
0.2%
0.2%
Asian
10%
8%
4%
Filipino
2%
2%
2%
Hispanic or Latinx
55%
66%
74%
Pacific Islander
0%
0%
0%
White
22%
13%
10%
Two or More Races
4%
3%
2%
0.9%
0.6%
0.5%
African American
Not Reported
Source: 2020-21 Enrollment by Ethnic Designation, March 2021. Available at: https://dq.cde.ca.gov/dataquest/DQ/enrotherstart.aspx
English Learner In California, students are classi ed as English Learners if their overall performance level on the initial English Language Pro ciency Assessment for California (ELPAC) is “Novice” or “Intermediate.” Once English learners meet speci c pro ciency criteria, students are reclassi ed as uent English pro cient (RFEP).15 Table 4 displays data from the California Department of Education DataQuest website. About 2.1 million (or 35 %) of California’s public school K-12 students were assigned English learner status or reclassi ed as uent English pro cient during the 2020-2021 school year. 16 However, it is important to note that these classi cations are based on standard or mainstream English pro ciency, which exclude English linguistic experiences historically classi ed as “wrong” or “incorrect” because they diverge from the District’s de nition of mainstream English.17
fi
fi
fi
fi
fi
fi
s
fi
fl
fi
fi
fi
fi
fl
fi
Image: Cultural guide and Council of Trustee Gypsie Ayala closing a circle of student Aztec dancers.
18
Table 4. English Language Learners, 2020-2021 School Year California
LA County
LAUSD
3,539,171
749,646
260,780
257,651
83,616
39,781
English Learner
1,062,290
235,329
107,972
Reclassified Fluent English Proficient
1,053,625
296,977
151,423
84,211
24,534
15,035
6,002,523
1,390,342
574,996
English Only Initial Fluent English Proficient
To Be Determined Total
Source: 2020-21 Enrollment by English Language Acquisition Status (ELAS), March 2021. Available at: https:// data1.cde.ca.gov/dataquest/longtermel/ELAS.aspx?cds=1964733&agglevel=District&year=2020-21
Los Angeles is the county with the largest share of English learners or reclassi ed students (roughly 530,000 or 25 percent of the state). With almost 108,000 English language (EL) learners and more than 151,000 reclassi ed students,19 the Los Angeles Uni ed School District enrolled the most English learners of any district in the state during the 2020-2021 school year.20 The vast majority of English learners in the County and District identi ed Spanish as their native language (85 percent and 92 percent, respectively). Table 5 shows publicly available enrollment data on English learners by language also from the California Department of Education. These public data do not identify any EL that speak a North American native language in the whole state, highlighting how existing data collection approaches continue historical erasure policies by failing to recognize the diversity of Indigenous populations and their languages These student-level data identify about 4,500 EL student that speak a Latin American Indigenous language in California, all of which speak either Mixteco or Zapoteco. These data identify only 12 Latin American Indigenous students in Los Angeles County (9 Zapoteco and 3 Mixteco),21 all of which are served by schools in the Los Angeles School District (LAUSD). While Los Angeles County is ranked number one in the state in terms of the population under 18 years,22 of cial enrollment data rank Los Angeles County 12th in terms of number of Indigenous language learners. However, a recent report from the Los Angeles Times cites the L.A. Uni ed School District as stating that for the 2020-21 school year, the annual “mandatory surveys in which families are asked to indicate a student’s primary or home language” identi ed 389 students living in homes where the primary language was a Latin American Indigenous language.23
fi
fi
fi
fi
fi
.
fi
fi
fi
The Los Angeles Times reported 247 students living in homes where the Mayan languages of Guatemala, K’iche is the primary language. The report also identi ed 88 for Q’anjob’al, 21 Mam’, 17 for Akateco, one Jakalteko or Popti’, which are Mayan language spoken primarily in Guatemala and parts of Mexico. The Times also documented 12 students for Zapotec, a group of at least 50 languages and many more dialects spoken in Mexico.24 Finally, the report also indicated three students lived in homes where the primary language is Mixtec, a language complex with a large number of languages that are mutually intelligible.25 Data for this mandatory school survey is not publicly available but paints a very different picture from that reported by public student enrollment data.
19
Table 3. Enrollment in Public Schools by Ethnic Designation, 2020-21 County
Mixteco
Zapoteco
Total Reported
Sacramento
1
0
1
San Francisco
1
0
1
San Joaquin
1
0
1
Santa Clara
0
1
1
Shasta
1
0
1
Merced
3
0
3
Sonoma
3
0
3
Riverside
0
4
4
San Benito
8
0
8
Orange
5
5
10
Los Angeles
3
9
12
Solano
16
0
16
San Diego
16
1
17
Tulare
28
0
28
Madera
34
7
41
San Luis Obispo
111
1
112
Kern
105
21
126
Fresno
140
5
145
Santa Cruz
411
18
429
Monterey
569
8
577
Ventura
938
40
978
Santa Barbara
1,922
64
1,986
State Total
4,317
184
4,501
DATA AND INFORMATION GAP This baseline research identi es three critical data gaps. The original goal of this report was to catalogue and analyze available public sources for data from the Los Angeles Uni ed School District, the California Department of Education, and a variety of agencies and organizations, including youth-related, family and child welfare agencies and any other public agency intersecting with Indigenous children, youth and families in LA County to the greatest degree possible. A detailed assessment of these potential sources26 is needed and more research should be done to determine the usefulness of these public data regarding Indigenous children, youth and families A second research gap is related to changes in census-based data products. There were some important changes in the 2020 U.S. Census and American Community Survey to the category “American Indian.” Following a 1997 Of ce of Management and Budget directive, the U.S. Census Bureau has included Indigenous peoples from Mexico, Central America and South America under “American Indian” since the 2000 U.S. Census. However, it was not until 2020 that the survey forms for the decennial census and ACS added “Mayan” and “Aztec” as examples under the “American Indian” category. More speci cally, the 2020 Census made some slight changes in the list of options for the AIAN population Race question. The de nition of AIAN population now states that: American Indian or Alaskan Native -- Print name of enrolled or principal tribe(s), for example, Navajo Nation, Blackfeet Tribe, Mayan, Aztec, Native Village of Barrow Inupiat Traditional Government, Nome Eskimo community, etc. More research is needed to better understand the data that this change will produce and its potential consequences, especially concerning the large Indigenous Mexican and Guatemalan migrants in California
fi
fi
.
fi
fi
S
fi
fi
.
Finally, there is a critical gap on Indigenous languages in of cial data sources. For instance, statistics from the U.S. Census Bureau’s American Community Survey are based on a sample of the total population; as such, there may be languages spoken that are not reported because the ACS did not sample the households where those languages are spoken.27 Other challenges include fears of self-reporting and survey instruments that may limit choices, leading the person lling out the survey to not report their Indigenous language or report another language instead because they may feel their language is irrelevant. This acute data gap is pronounced for Indigenous immigrants due to fears of discrimination or legal status
.
fi
20
21
WHERE DO WE GO FROM HERE? Our ndings in this phase of the project relate to gaps in three areas: (1) Data; (2) Practice, particularly Instruction; and (3) Policy
ADDRESSING THE DATA GA The ndings are what we expected: the invisibility of American Indians within the U.S. jurisdiction and Indigenous groups from Latin America, is perpetuated by public agencies and policies that leave them out of data collection, recording and analysis. These ndings are not new but have been expressed for decades by American Indians.28 Based on limited data from the census-based products, we show that while Los Angeles County is home to the largest population of American Indians and Alaska Natives in the U.S., the population growth is likely driven primarily by the increase in multiracial American Indians and Alaska Natives and Latinx, particularly among the young. We also show that the majority of youth under the age of 18 reside in households that speak a language other than English at home. Further, these data show the vast majority of these youth identify with Hispanic or Latinx ethnicity. We also examined the spatial distribution of the American Indian population across Los Angeles to enable partners and allies to understand the communities and schools serving American Indians. We show the population is primarily located in the more rural desert communities in the northern county, as well as parts of the San Gabriel Valley and the South Bay region. These data from the Census show the rapidly changing face of the American Indian community in Los Angeles. Educational institutions, in particular school districts, should develop a strategy to capture the changing pro le of the Indigenous student population they serve to address their speci c educational needs
fi
P
.
.
fi
fi
fi
fi
fi
Publicly available data from the California Department of Education and the Los Angeles Uni ed School District (LAUSD) on the ethnic designation and Indigenous language speakers highlight the severe undercount and non-inclusion of small populations of Indigenous youth and their families. These student-level data do not identify any North American native languages and only identify a handful of Mixteco and Zapoteco English Learners served by the Los Angeles School District. These data gaps highlight how existing data collection approaches continue historical erasure policies by failing to recognize the diversity of Indigenous populations, their culture, and language.
22
Through this research, we were able to catalogue and analyze two main public sources on the American Indian population and students across Los Angeles to inform data-driven educational interventions in collaboration with community partners and allies. Our analysis of census-based data and student enrollment information from the Los Angeles Uni ed School District and the California Department of Education highlight the following critical information gaps: 1. There continues to be limited data on the American Indian population and available data obscures the diversity of the Indigenous population. 2. There is a paucity in research on the consequences of more inclusive census-based de nitions related to racial identity for Indigenous populations. 3. We also identi ed a critical gap on Indigenous languages in of cial data sources used for public resource allocation and decision-making. 4. There is a need to connect tribal af liation, Indigeneity and Indigenous language data. These two data points are currently collected separately in both federal and state data collection efforts, and so identi cation of the language abilities for speci c groups is dif cult to ascertain. 5. The primary data collection methods of the Federal and State Governments rely on sample surveys rather than full census counts, and so if there is not a minimum number of individuals or speakers of a language in the sample, or a wide dispersion of these populations, it is not possible to accurately report results. Consequently, a tremendous vacuum or undercount is taking place, and aggregation across languages or Indigenous tribal, or rst nation identi cations is necessary to even gain a gross pro le of these issues
ADDRESS THE PRACTICE/INSTRUCTIONAL GAP
fi
fi
fi
fi
fi
fi
fi
fi
fi
fi
fi
.
fi
fi
1. The current federal questions for Indigeneity and for Indigenous languages are driven by their relationship to English pro ciency and related policy needs (in government public Schooling and Voting). There is no literacy data currently being collected; nor is there any attempt at identifying bilinguals, or the relative pro ciency levels in each Indigenous [nonEnglish] language, mode and age of learning. 2. State educational language policies promote transitional bilingual education, which is built on a critical threshold of speakers within a grade-age range in a compact area (e.g., a school or neighborhood) in order to have a bilingual classroom. Whether there are instructional and curricular resources to carry out the transitional bilingual instruction, determines whether the classroom will be taught bilingually or as an English as a second language classroom with speakers of multiple non-English languages. Continued development of a non-English language is not a priority, even if it is an Indigenous language. So, revitalization of languages with diminishing numbers of speakers within the government public school system is barred by current practices and policies.
23
ADDRESSING THE POLICY GA There are three broad groups of Indigenous persons and Indigenous language speakers in the Los Angeles area(s)
P
.
.
.
:
.
fi
1. Indigenous Peoples traditionally from within the area, such as Gabrielino Shoshone, Kizh and Tongva, Tataviam, and Chumash, for which there are currently very few native speakers 2. American Indians from other parts of California and the US, particularly those of Federally recognized tribal nations, were relocated to Los Angeles and several other urban areas during the 1950s and 1960s, many of whom brought language and cultural practices and joined together for cross-cultural adaptations in these transplanted locations. Replenishment of speakers of these American Indian languages may be available in other locations (including through tribal government or reservation-based programs) of varying numbers 3. Indigenous migrants from outside the United States jurisdiction, and whom today would be identi ed as international migrants or immigrants from other nations in the hemisphere; Canada, and Mexico principally, and increasingly from Guatemala, El Salvador, Nicaragua, bringing in speakers of major languages from these areas, including Nahuatl (spread across 4 countries, and part of the Uto-Aztecan family that includes local Los Angeles Indigenous languages), Mixteco, Zapotec, and Maya (spread across six countries). The size of some of these Indigenous language populations from other national jurisdictions overwhelms the statistical numbers in the US. For example, there are over 1.5 million speakers of Nahuatl in Mexico alone, almost as great as the estimated “American Indian” population of the US 4. The number of Indigenous persons, who do not speak an Indigenous language is great but varies across Indigenous Peoples. The languages spoken by these Indigenous persons is often the colonial languages of English, or Spanish. There are also many who are bilingual in their Indigenous language(s) and the colonial languages of English and/or Spanish. Language revitalization efforts across many Indigenous Peoples in Canada, US, and México, are often based on the family units and community inter-generational linguo-cultural instruction
24
RECOMMENDATIONS Based on our ndings, we recommend several activities in data gathering, Instructional practice, and policy. 1. Innovations in the organizational culture, and practices around data gathering related to ethnic designation and language. In particular, we recommend a commitment to language rights for Indigenous communities and open-data policies that enable access to information regarding language needs. 2. Census data that captures the rapidly changing face of the American Indian population. Therefore, we propose that school districts develop a strategy to capture the changing pro le of the student populations they serve to address students’ speci c educational needs 3. Acquisition of new information and analyses on ethnicity and language topics to enable student and family-led systemic change. 4. There is a need to census (not sample) the Indigenous groups in Los Angeles, and possibly California, as regards to Indigenous identi cation, and language pro ciencies to provide services, and develop language revitalization and instruction programs where desired.
Image: Student & Community 10-mile march to LA County Office of Education Headquarters (2012)
fi
fi
fi
fi
.
fi
42
25
SILENCE IN THE SCHOOLS: UNSETTLING REALITIES OF SYSTEMIC ERASURE OF INDIGENOUS LANGUAGE STUDENTS IN LOS ANGELES HOW MANY INDIGENOUS LANGUAGES ARE SPOKEN IN LOS ANGELES COUNTY? HOW MANY INDIGENOUS CHILDREN SPEAK A NATIVE LANGUAGE AT HOME? HOW MANY INDIGENOUS LANGUAGES ARE TAUGHT IN LOS ANGELES SCHOOLS?
Image: Singing “America”, Kat Jefferson (Assiniboine Sioux/Coast Salish)
For over two decades, these lines of inquiry have driven the development of Anahuacalmecac as a unique design of autonomous, community-based Indigenous education. Central to Anahuacalmecac’s design is the persistent and systemic inclusion of Nahuatl language education as a key element of the plurilingual educational model. What remains unsettling, is the complete absence of any other models or proposals to address Indigenous language rights where it matters most, in the lives and education of Indigenous children and youths anywhere else. Indigenous language justice in schools is a central component of Indigenous educational justice. How can we recognize this right in Los Angeles schools if we do not af rm the existence of Indigenous language communities here? The limited data we have uncovered is unsettling, mostly because we know it to be vastly undercounting the true size and nature of Indigenous language communities today
fi
fi
.
Theories of knowledge in education, science and business commonly af rm that what cannot be measured, must not exist. Yet, among the many gifts and talents of Indigenous children and youth lie the untapped potentials of their maternal, home and heritage languages, even if they
are not measured. This report has documented that the failure to measure the existence of Indigenous language communities in schools is endemic not only to Los Angeles government schools, but throughout the state of California. Although this report does not assert that this endemic silencing of Indigenous children in schooling is intentional, we do recognize that California’s history and system of schooling is built upon over a century of overtly racist and linguicidal policy towards Indigenous languages and children. We also recognize that the state and federal governments’ recent language and educational policies established de facto English-only ecosystems hostile to Indigenous language rights and education thereby reaf rming the legacy of linguicide under the auspices of “quality education”. Language is land
LANGUAGE IS LAN Just as territories have been invaded, settled and colonized the world over by dominant political-cultural powers over the past ve hundred years, so too has language become the terrain of domination and control over the course of the last century through compulsory government schooling. As an autonomous Indigenous community-based educational organization, Semillas has long defended and allied with the resilience of California Native Americans – beginning with the founding of our school in accordance with the blessings of Chief Ya’ana Vera Rocha of the Gabrielino Shoshone Nation. How could anyone have possibly survived the methodical, multi-generational measures taken by the invaders of their lands at all? Surviving an outright legally declared campaign of extermination seems surreal when one contemplates the details of the written history of these violent campaigns to rid the “golden state” of its native peoples. Yet, nothing in the State of California’s curriculum adequately addresses these complexities to this day, leaving the burden to be placed on the growing wave of educators who like our temachtianimeh at Anahuacalmecac who have sought ways to address this gap with educational, historical, and social consciousness while encountering varying measures of recalcitrance and even hate-motivated attacks against us along the way. While state violence against multilingualism and Indigenous languages is nothing new, the resistance against linguicide continues to evolve in the face of the ongoing crisis referred to by UN experts as a “language extinction event.” The State of California does support research-backed multilingual education policy speci cally authorizing among other models, “Heritage Language or Indigenous Language” programs that provide instruction in English and another language for non-English speakers or students with limited literacy skills in their rst language. The State also authorizes, “Indigenous language programs (that) support endangered minority languages in which students may have limited receptive and no productive skills.”
.
l
fi
fi
D
fi
Far from blameless, this extinction is, in reality, part and parcel of the global colonization and exploitation of peoples and planet by dominant states, societies, and their corporate-colonial agents. Born of a community-based resistance against English-only law and educationa
fi
26
policies in the State of California, the community of Academia Semillas del Pueblo (Anahuacalmecac) brought their vision of transformative Indigenous education to life in 2002 by accessing the state’s charter law to create an autonomous community-based school to defend our community’s and our children’s fundamental human rights to maternal language, international language, and heritage language education. For this, Semillas has overcome attacks since 2006, including hate speech, terrorist threats of mass violence, and continual targeting for closure and disruption by government agencies. Our fundamental educational proposal, as outlined in this report, is that the rights of the child to self-recognition, self-realization, and self-determination as a member of an Indigenous family, community, tribe or nation ought to overcome latent or overt state agendas of deculturalization, assimilation, and linguicide, past or present. We also af rm that as Indigenous Peoples, our rights to our maternal and original languages are inalienable and inextinguishable. This is af rmed by the United Nations Declaration on the Rights of Indigenous Peoples as well as by the UN Convention on the Rights of the Child and other decrees of international law We know that more than men, mothers, and children are the targets of agendas of linguicide and deculturalization. Revitalizing maternal languages, therefore, necessarily demands that we uplift the women who embody these languages and the community ecosystems necessary for communities to thrive as linguistic social systems. We understand that Indigenous children can be better supported with social policy and institution building by advancing multilingual education that centers and privileges Indigenous maternal language teaching and learning as a fundamental mode and purpose of the transmission of community culture through education. This is best accomplished either through the full autonomy of the Indigenous language community or nation or through a protocol whereby government agencies seek proper free, prior and informed consent. In either case Indigenous Peoples must retain collective oversight and control over Indigenous education and institutions
.
fi
.
Image: Students outside LAUSD Headquarters demanding a right to Indigenous Education
fi
27
ASSIMILATION IS NOT EDUCATION Educational law in the United States, and in California for that matter, are not consistent with the internationally recognized human rights of Indigenous Peoples or children. In California, although existing law requires that all school districts determine "the primary language of each pupil enrolled in the school district,” this must only be done once upon enrollment. Existing law also requires that school districts thoroughly assess the language skills of all pupils whose primary language is other than English and that this assessment process must be conducted in consultation with parents and that, "assessments shall be conducted by persons who speak and understand English and the primary language of the pupils assessed, who are adequately trained and prepared to evaluate cultural and ethnic factors" as well as hold a valid, regular California teaching credential or meet other similar quali cations. It is concerning that this same state law also establishes that school district personnel are to determine when students have "no pro ciency in the primary language," at which point "then the pupil is not entitled to the protection of" state law After 2017, Proposition 227, state law that mandated “English Language in Public Schools”, was repealed by Proposition 58 also known as the California Education for a Global Economy, which explicitly recognizes that "California has the unique opportunity to provide all parents with the choice to have their children educated to high standards in English and one or more additional languages, including Native American languages" as a way to increase access to higher education and careers. However, even this modest reversal of the previous draconian English-only laws of California only requires that the language needs of students be measured by standards of pro ciency, content, and purpose of academic achievement primarily in English. Recognizing that the vast majority of Indigenous languages are oral, unwritten, nonstandardized, and culturally distinct expressions of the human experiences of native nations, the legal requirement that local educational agencies who may venture to attempt to recognize and offer Native American language programs would most likely not be able to allocate "suf cient resources" to these programs including certi cated teachers, necessary instructional materials, professional development, and parent and community engagement
.
fi
fi
fi
.
fi
fi
Existing California law in actuality still denies equal access to education, subverts existing recognized Indigenous language rights, and fails to provide for adequate funding for Indigenous pupils, families, communities, and nations with which to exercise those rights in the education of their children. In fact, as this study will evidence, one cannot even adequately determine the extent of the crisis of Indigenous linguicide because government educational institutions do not, and have not, adequately sought to determine the primary language of Indigenous pupils whose home language may be an Indigenous language of Latin American national origin instead preferring to categorize "English learners" as primarily Spanish language speakers. In the case of the vast majority of Indigenous pupils that may possess a home language other than English that is a Native American language, these core human linguistic and cultural rights are automatically stripped from the child as English is determined to be the "primary" language by educational bureaucrats who determine that these pupils have "no pro ciency in his or her primary language.” Current home language census forms, as required by the State of California actually dissuade parents from reporting Indigenous language use at home. State-required
fi
28
home language survey results are exclusively required to identify ENGLISH LEARNERS to be tracked towards English instruction and not to support the potential of multilingual education diversity.
THE LEGACIES WE LEAVE The Anahuacalmecac school community has inherited Nahuatl as a primary maternal language and Spanish as a secondary heritage language. Anahuacalmecac was co-founded by Tata Cuaxtle Felix Evodio, a Nahua spiritual leader, scholar and community organizer from Copalillo, Guerrero, Mexico. Parents of Anahuacalmecac students have reaf rmed the importance of teaching and learning Nahuatl in school through various means, most notably, through plebiscites conducted annually. In addition to Nahuatl, Spanish is also spoken as a heritage or home language by over fty percent of our students program-wide. Spanish is the second most spoken language in the world by some estimates due to its heritage as a language of empire across the world. In Latin America, Spanish is the of cial language of the vast majority of nation-states in the continent. In Mexico and Central America, the homelands of most of our students, Spanish re ects a unique cultural adaptation to and inclusion of various indigenous languages, particularly Nahuatl, in its modern expression. As such, every effort is made by Anahuacalmecac to re ect the particular forms of Spanish native to the North American linguistic lexicon. Additionally, Spanish has been spoken continually in the Los Angeles basin since at least 1769, when the Spanish colonizers rst institutionalized their invasion of these lands by their monarchy As a newcomer to the Los Angeles basin, English has imposed itself as the language of the American empire and the lexicon of power. As a result, the majority of our students speak English uently and suffer from the negative impact of English as a subtractive language in that as they become more uent, their maternal language becomes increasingly dif cult to sustain and enrich. This context of subtractive language survival or extinction is a product of the overdecade-long English-only legal policies in the State of California. Resistance to these laws gave impetus to the establishment and continuity of Anahuacalmecac. There are more than two dozen indigenous languages spoken today in Los Angeles county including Mesoamerican and South American indigenous languages. Yet, to this day, the only indigenous language taught for academic credit anywhere in a Los Angeles K-12 public school is Nahuatl at Anahuacalmecac World School
fi
fi
fi
fi
.
fi
fi
fl
.
fl
fl
.
fl
The California State Board of Education announced in late 2020 a new state policy roadmap for “English Learners” that af rms among other points that, “California schools prepare graduates with the linguistic, academic, and social skills and competencies they require for college, career, and civic participation in a global, diverse, and multilingual world, thus ensuring a thriving future for California.” A similar roadmap for Indigenous Language Learners or Indigenous Language Literacy would be important to focus on language assets instead of perceived English-language de cits perpetually centered in policy
fi
29
Transforming the educational ecosystem into one which is fertile and thriving for Indigenous language speakers and learners, will require that we be heard, seen and heeded. We are the inheritors of ecologies of knowledge born of this land, emerged of mountains and valleys across this hemisphere. We are descendants of sky and earth, literate in the clouds above and the waves that ripple over the sea. We are uent in the whispers of the winds and the secret songs we hear in the hills of El Sereno and across Los Angeles County when the traf c dies down or before the church bells ring. When we speak, promote and honor our maternal languages at home and in community, we strengthen our children and help sow las semillas del pueblo Toxinachtli The call to action now is to advocate for and organize the transformative educational experiences we would want to see in our childrens’ lives. To do so, we must recognize the vast diversity and existence of Indigenous language communities beginning with those of the native peoples of the greater Los Angeles area and inclusive of American Indian, Mexican and Central American migrant Indigenous communities here now. While our focus and demand is to address the Indigenous language justice of children and youth in educational systems, these will also be important to af rm in all other aspects of life.
Totlahtol tlitl Our language is re.
30
Image by Josue Rivas
fi
fl
fi
fi
.
Image: Josue Rivas .
30
31
END NOTES Ong, J. D., & Ong, P. M. (2012). The Status of American Indians/Alaska Natives in Los Angeles: Population Change & Components of Change (Technical Report 1; Los Angeles American Indian and Alaska Native Project). UCLA American Indian Studies Center. Retrieved December 26, 2020, from https://www.aisc.ucla.edu/research/pb1_memo1.aspx 1
California Department of Education. (n.d.). Annual Enrollment Downloadable Files - Accessing Educational Data (CA Dept of Education). Available at: https://www.cde.ca.gov/ds/ad/ enrolldowndata.asp 2
Ong, P. M., & Ong, J. D. (2012). The Status of American Indians/Alaska Natives in Los Angeles: American Indian Population Change at the Dawn of the 21st Century (Policy Brief 1; Los Angeles American Indian and Alaska Native Project). UCLA American Indian Studies Center. https://www.aisc.ucla.edu/research/pb1.aspx 3
Gonzalez, S. R. & V. Tran. (2021). Personal Communication, Memo 2 - Public Data on Indigenous Populations in Los Angeles County. https://docs.google.com/document/d/ 1_qXpBmrRndioLBOPNjg3zaZsBHQ3vm3Ohc0QUZkaKGw/edit?usp=sharing 4
Ong, P. M., & Ong, J. D. (2012). The Status of American Indians/Alaska Natives in Los Angeles: American Indian Population Change at the Dawn of the 21st Century (Policy Brief 1; Los Angeles American Indian and Alaska Native Project). UCLA American Indian Studies Center. https://www.aisc.ucla.edu/research/pb1.aspx 5
Parker, K., Horowitz, J.M., Morin, R., Lopez, M.H. (2015). Multiracial in America: Chapter 1: Race and Multiracial Americans in the U.S. Census. Pew Research Center. Available at:www.pewresearch.org/social-trends/2015/06/11/chapter-1-race-and-multiracial-americans-inthe-u-s-census/ 6
Liebler, C.A., Ortyl, T. (2014). More than One Million New American Indians in 2000: Who are they? Demography, 51, pp. 1101-1130. Available at: https://link.springer.com/article/10.1007/ s13524-014-0288-7 7
Gorton, H. E. (2021). Changes to the American Indian category on the 2020 U.S. Census. University of Arizona Bachelor’s Honor Thesis 8
U.S. Census Bureau. “Detailed Language Spoken at Home and Ability to Speak English for the Population 5 Years and Over: 2009-2013 American Community Survey,” available at: https://www.census.gov/data/tables/2013/demo/2009-2013-lang-tables.html 9
Cranney, S. (2019). “Which American Languages are Dying? Quantifying the Demographic Vulnerability of Indigenous Languages in the United States.” Lanugague Use Working Paper SESHDWP2019-08. U.S. Bureau of the Census. https://www.census.gov/library/working-papers/2019/demo/ SEHSD-WP2019-08.html
.
10
32
Ong, J. D., & Ong, P. M. (2012). The Status of American Indians/Alaska Natives in Los Angeles: Population Change & Components of Change (Technical Report 1; Los Angeles American Indian and Alaska Native Project). UCLA American Indian Studies Center. Retrieved December 26, 2020, from https://www.aisc.ucla.edu/research/pb1_memo1.aspx 1
California Department of Education. (n.d.). Annual Enrollment Downloadable Files - Accessing Educational Data (CA Dept of Education). Available at: https://www.cde.ca.gov/ds/ad/ enrolldowndata.asp 2
Ong, P. M., & Ong, J. D. (2012). The Status of American Indians/Alaska Natives in Los Angeles: American Indian Population Change at the Dawn of the 21st Century (Policy Brief 1; Los Angeles American Indian and Alaska Native Project). UCLA American Indian Studies Center. https://www.aisc.ucla.edu/research/pb1.aspx 3
Gonzalez, S. R. & V. Tran. (2021). Personal Communication, Memo 2 - Public Data on Indigenous Populations in Los Angeles County. https://docs.google.com/document/d/ 1_qXpBmrRndioLBOPNjg3zaZsBHQ3vm3Ohc0QUZkaKGw/edit?usp=sharing 4
Ong, P. M., & Ong, J. D. (2012). The Status of American Indians/Alaska Natives in Los Angeles: American Indian Population Change at the Dawn of the 21st Century (Policy Brief 1; Los Angeles American Indian and Alaska Native Project). UCLA American Indian Studies Center. https://www.aisc.ucla.edu/research/pb1.aspx 5
Parker, K., Horowitz, J.M., Morin, R., Lopez, M.H. (2015). Multiracial in America: Chapter 1: Race and Multiracial Americans in the U.S. Census. Pew Research Center. Available at:www.pewresearch.org/social-trends/2015/06/11/chapter-1-race-and-multiracial-americans-inthe-u-s-census/ 6
Liebler, C.A., Ortyl, T. (2014). More than One Million New American Indians in 2000: Who are they? Demography, 51, pp. 1101-1130. Available at: https://link.springer.com/article/10.1007/ s13524-014-0288-7 7
Gorton, H. E. (2021). Changes to the American Indian category on the 2020 U.S. Census. University of Arizona Bachelor’s Honor Thesis 8
9
U.S. Census Bureau. “Detailed Language Spoken at Home and Ability to Speak English for the Population 5 Years and Over: 2009-2013 American Community Survey,” available at: https://www.census.gov/data/tables/2013/demo/2009-2013-lang-tables.html Cranney, S. (2019). “Which American Languages are Dying? Quantifying the Demographic Vulnerability of Indigenous Languages in the United States.” Lanugague Use Working Paper SESHD-WP2019-08. U.S. Bureau of the Census. https://www.census.gov/library/workingpapers/2019/demo/SEHSD-WP2019-08.html
.
10
33
Esquivel, P. (2021). In California, a million English learners are at risk of intractable education loss. Los Angeles Times. Available at: https://www.latimes.com/california/story/2021-04-04/how-covid-distance-learning-hurt-californiaenglish-learners 11
California Department of Education. (2020). DataQuest: 2020-21 Enrollment by Ethnicity and Grade. Available at: https://dq.cde.ca.gov/dataquest/dqcensus/EnrEthGrd.aspx? cds=00&agglevel=state&year=2020-21#collapseTwo 12
Based on the federal de nition: “American Indian or Alaska Native: A person having origins in any of the original peoples of North and South America (including Central America), and who maintains a tribal af liation or community attachment.” https://www.cde.ca.gov/ds/dc/es/ refaq.asp#q9 13
Tabulated by authors using data from DataQuest, “Enrollment by Ethnicity” report option. See: California Department of Education. (2021). DataQuest: Enrollment by Ethnicity. Available at: https://dq.cde.ca.gov/dataquest/DQ/enrotherstart.aspx 14
Los Angeles Uni ed School District Division of Instruction. (2018). 2018 Master Plan for English Learners and Standard English Learners. Available at: https://achieve.lausd.net/cms/lib/ CA01000043/Centricity/domain/22/el%20sel%20master%20plan/ 2018%20Master%20Plan%20for%20EL%20and%20SEL.pdf 15
Tabulated by authors as the sum of “English Learner (EL)” and “Reclassi ed Fluent English Pro cient (RFEP)” See: California Department of Education. (2021). DataQuest: 2020-21 Enrollment by English Learner (EL) and Reclassi ed Fluent English Pro cient (RFEP). Available at: https://data1.cde.ca.gov/dataquest/longtermel/ELAS.aspx? cds=00&agglevel=State&year=2020 16
17 Los
Angeles Uni ed School District Division of Instruction. (2018). 2018 Master Plan for English Learners and Standard English Learners. Available at: https://achieve.lausd.net/cms/lib/ CA01000043/Centricity/domain/22/el%20sel%20master%20plan/ 2018%20Master%20Plan%20for%20EL%20and%20SEL.pdf California Department of Education. (2021). DataQuest: 2020-21 Enrollment by English Learner (EL) by Language by Grade Los Angeles County. Available at: https://dq.cde.ca.gov/ dataquest/SpringData/StudentsByLanguage.aspx? Level=County&TheYear=2020-21&SubGroup=All&ShortYear=2021&GenderGroup=B&CDSCod e=19000000000000&RecordType=EL
fi
fi
fi
fi
fi
fi
fi
fi
18
34
19California
Department of Education. (2021). 2020-21 Enrollment by English Language Acquisition Status (ELAS). Available at: https://data1.cde.ca.gov/dataquest/longtermel/ ElasLevels.aspx?cds=19&agglevel=county&year=2020-21 Note the ELAS data cited in footnote 11, reports about 10,000 fewer English Learners from those reported by the CDE Educational Demographics Unit available here: https:// d q . c d e . c a . g o v / d a t a q u e s t / L C / L C O t h e r D i s t r i c t . a s p x ? dType=all&co=All%20Counties&TheYear=2020-21&sortby=c 20
California Department of Education. (2021). DataQuest: 2020-21 English Learner Students by Language by Grade. Available at: https://dq.cde.ca.gov/dataquest/SpringData/ S t u d e n t s B y L a n g u a g e . a s p x ? Level=County&TheYear=2020-21&SubGroup=All&ShortYear=2021&GenderGroup=B&CDSCod e=19000000000000&RecordType=EL 21
Population Reference Bureau. (n.d.). KidsData: 2020 Child Population by County. Available at: https://www.kidsdata.org/topic/32/child-population/ table#fmt=139&loc=2,127,347,1763,331,348,336,171,321,345,357,332,324,369,358,362,360,3 37,327,364,356,217,353,328,354,323,352,320,339,334,365,343,330,367,344,355,366,368,265, 349,361,4,273,59,370,326,333,322,341,338,350,342,329,325,359,351,363,340,335&tf=110&so rtColumnId=1&sortType=desc 22
Miller, L. (2021). Zapotec in 90006, K’iche’ in 90057: New map highlights L.A.’s Indigenous communities. Los Angeles Times. https://www.latimes.com/california/story/2021-07-07/la-meIndigenous-map-los-angeles 23
Broadwell, George Aaron; García Guzmán, Moisés; Lillehaugen, Brooke Danielle; Lopez, Felipe H.; Plumb, May Helena; & Zarafonetis, Mike. (2020). Ticha Collaboration with Indigenous communities to build digital resources on Zapotec language and history. https:// ticha.haverford.edu/en/context 24
DiCanio, C., Benn, J. and R. Castillo García (2018). The phonetics of information structure in Yoloxóchitl Mixtec. Journal of Phonetics68: 50-6 25
Gonzalez, S. R. & V. Tran. (2021). Personal Communication, Memo 2 - Public Data on Indigenous Populations in Los Angeles County. https://docs.google.com/document/d/ 1_qXpBmrRndioLBOPNjg3zaZsBHQ3vm3Ohc0QUZkaKGw/edit?usp=sharin 26
U.S. Census Bureau. “Detailed Language Spoken at Home and Ability to Speak English for the Population 5 Years and Over: 2009-2013 American Community Survey.” Available at: https://www.census.gov/data/tables/2013/demo/2009-2013-lang-tables.html 27
g
8
/
https://www.ncai.org/policy-research-center/research-data/data
28
35
AMERICAN INDIAN RESURGENCE INITIATIVE
@NDGNSLA
Native Youth to College Community Pathways
NATIVE YOUTH 2 COLLEGE JOIN OUR DIGITAL SUPPORT COMMUNITY TODAY
GO TO NDGNSLA.ORG GET HELP TO GO TO COLLEGE ACCESS TO HIGH-QUALITY & CULTURALLY RELEVANT EDUCATIONAL PROGRAMS & SERVICES
JOIN A COLLEGE-GOING COMMUNITY OPEN TO AMERICAN INDIAN YOUTH ACROSS LOS ANGELES COUNTY