The North Carolina School of Science and Mathematics – Durham Journal of Student STEM Research
Front Cover
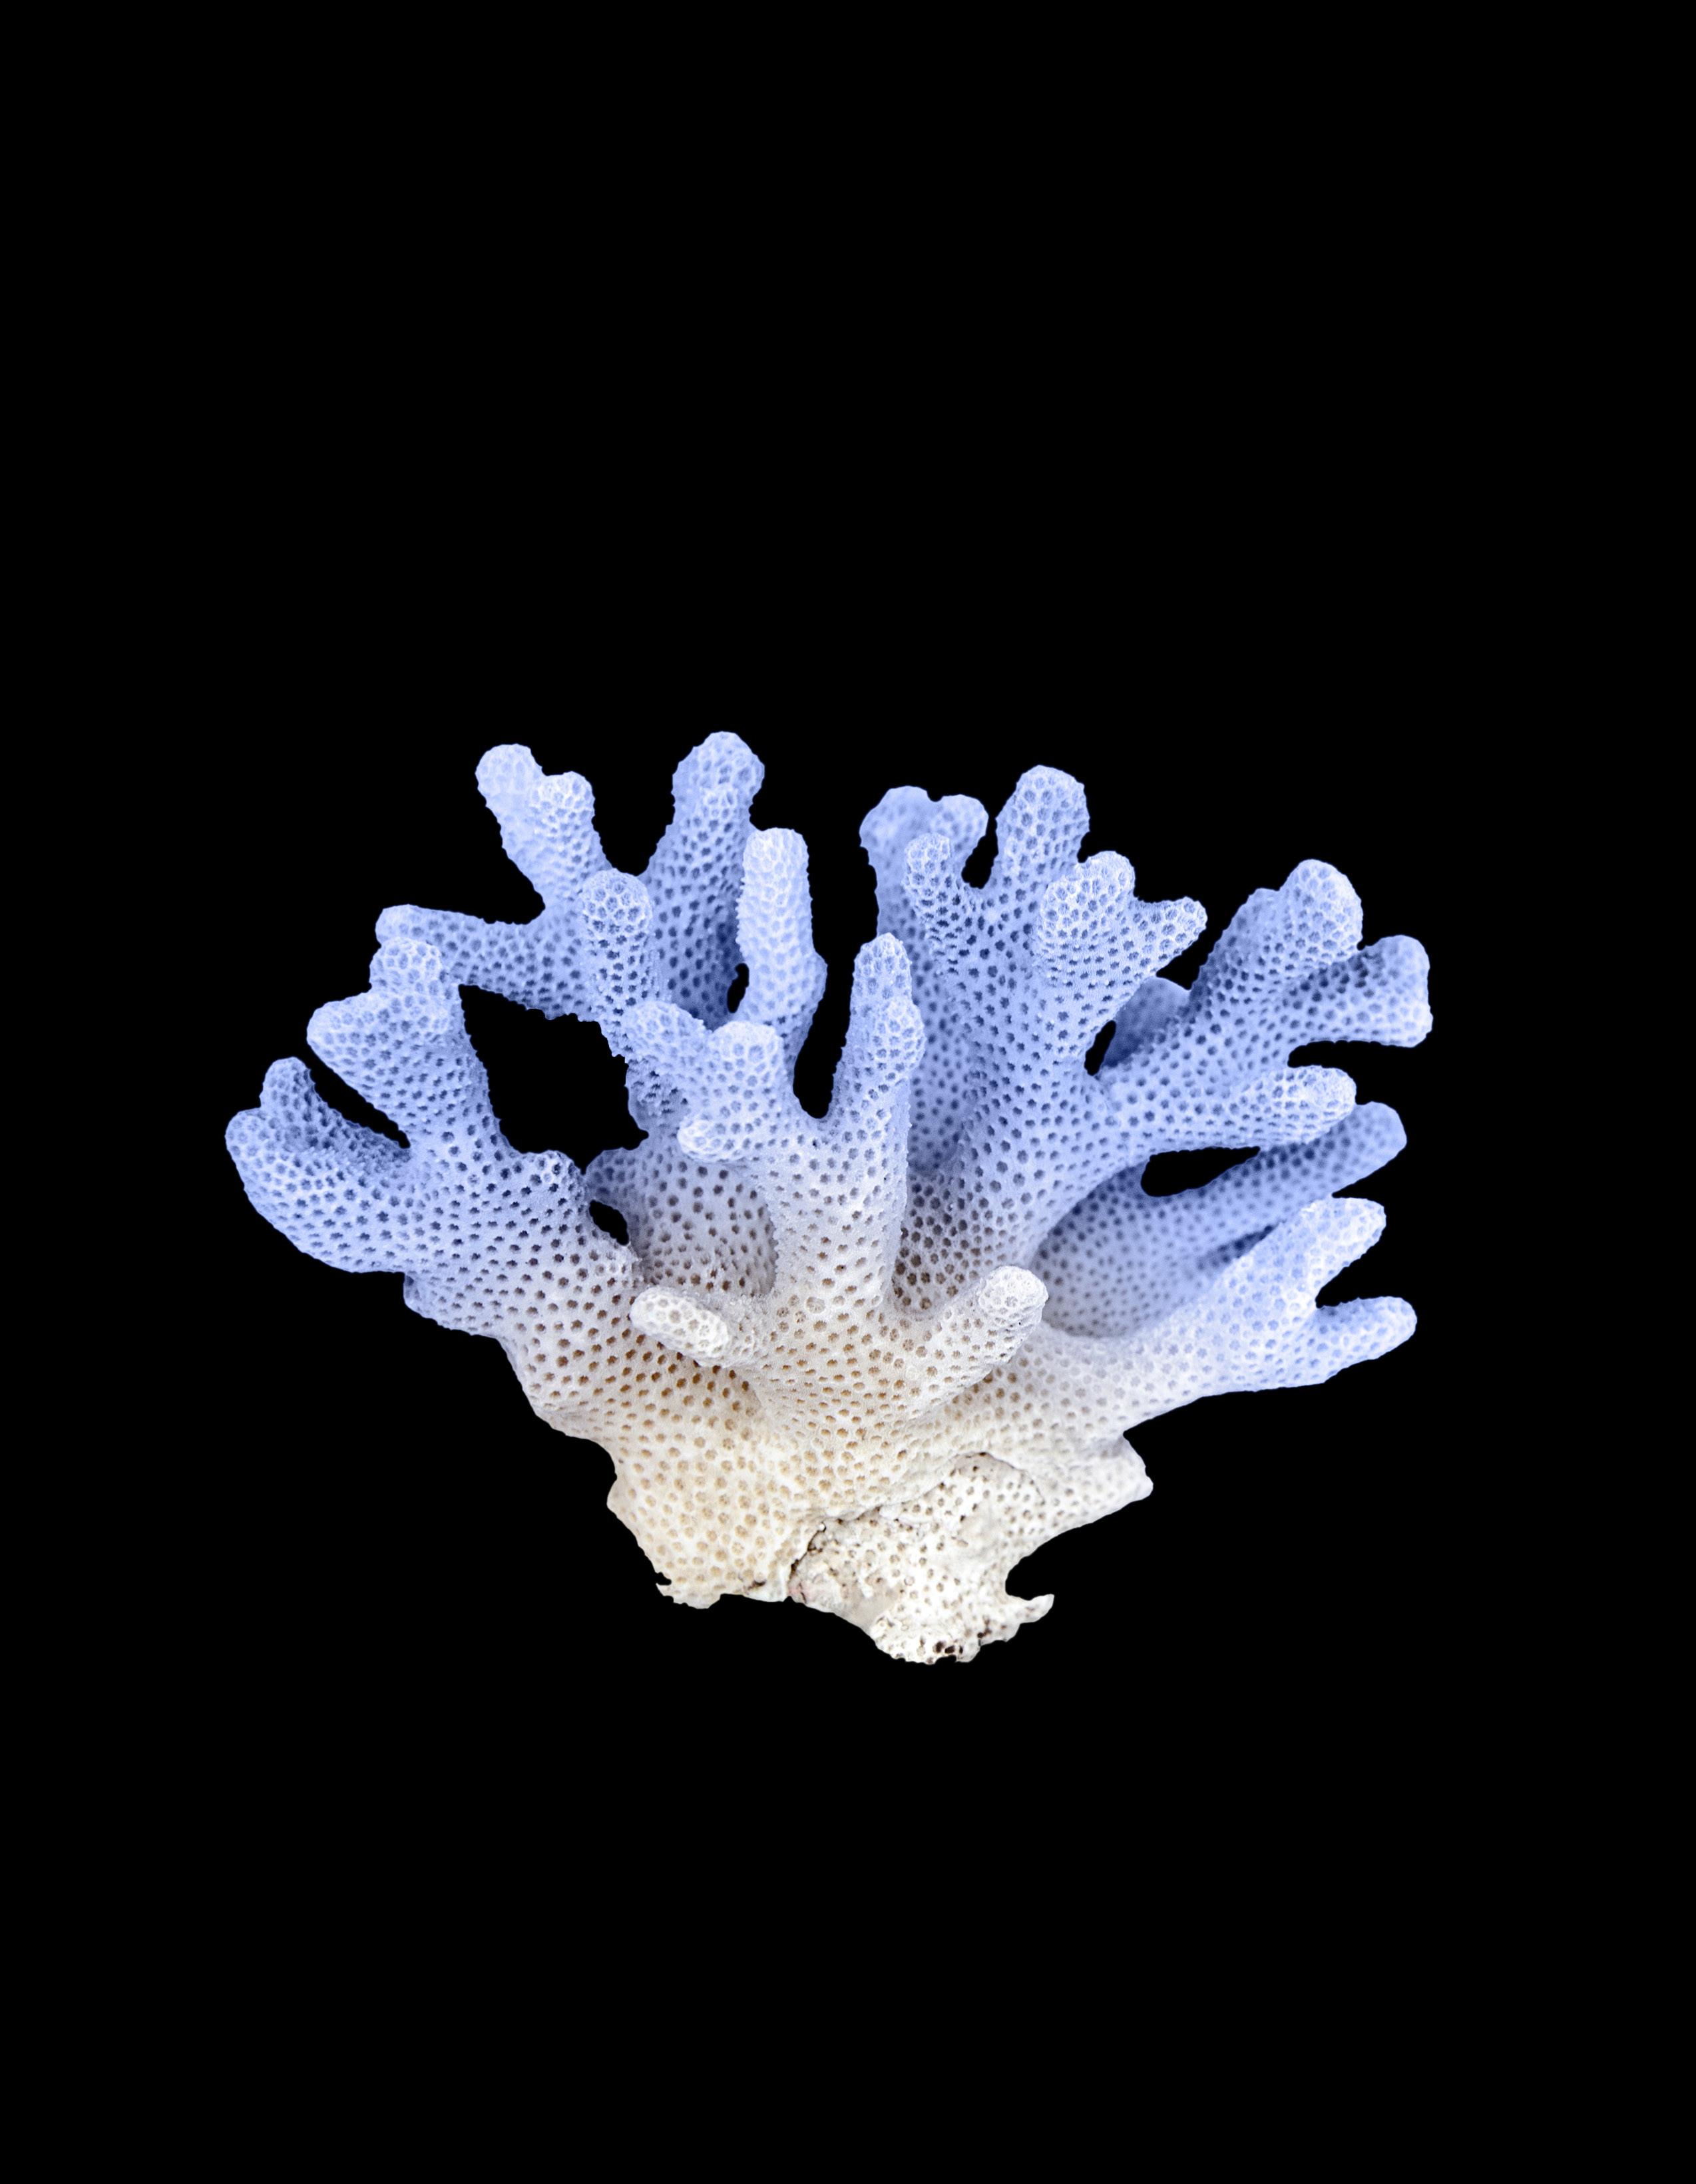
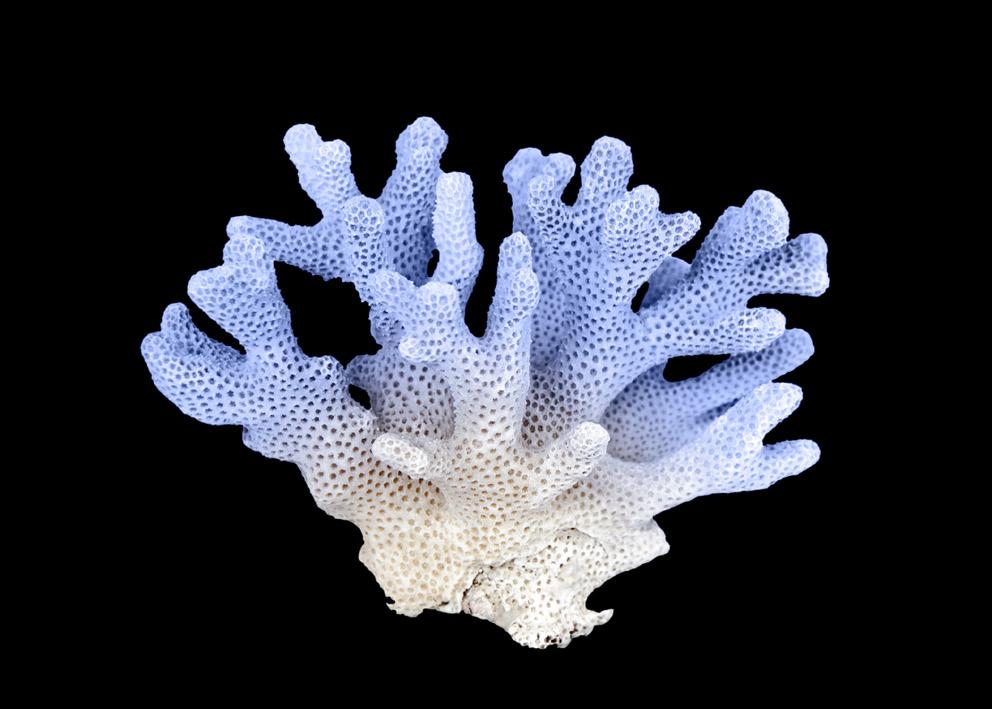
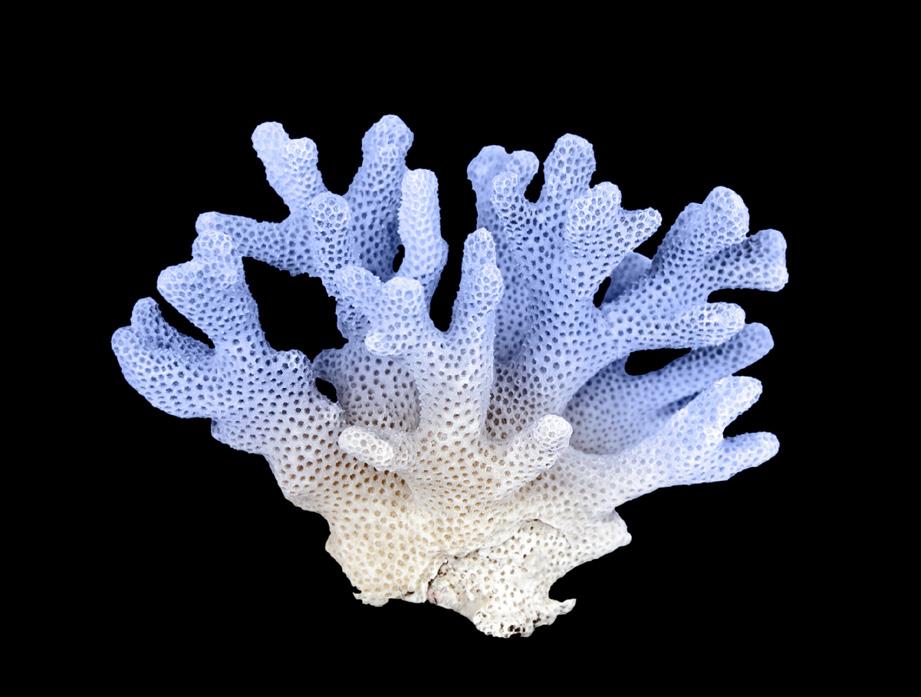
At first glance, this coral appears still and singular, but it is the product of countless living polyps, working in quiet coordination. Each tiny structure plays a role in sustaining the whole, forming a delicate system that supports entire ecosystems beneath the surface; one that, once lost, cannot easily be rebuilt.
Credit: iStock, under Standard License
Biology Section
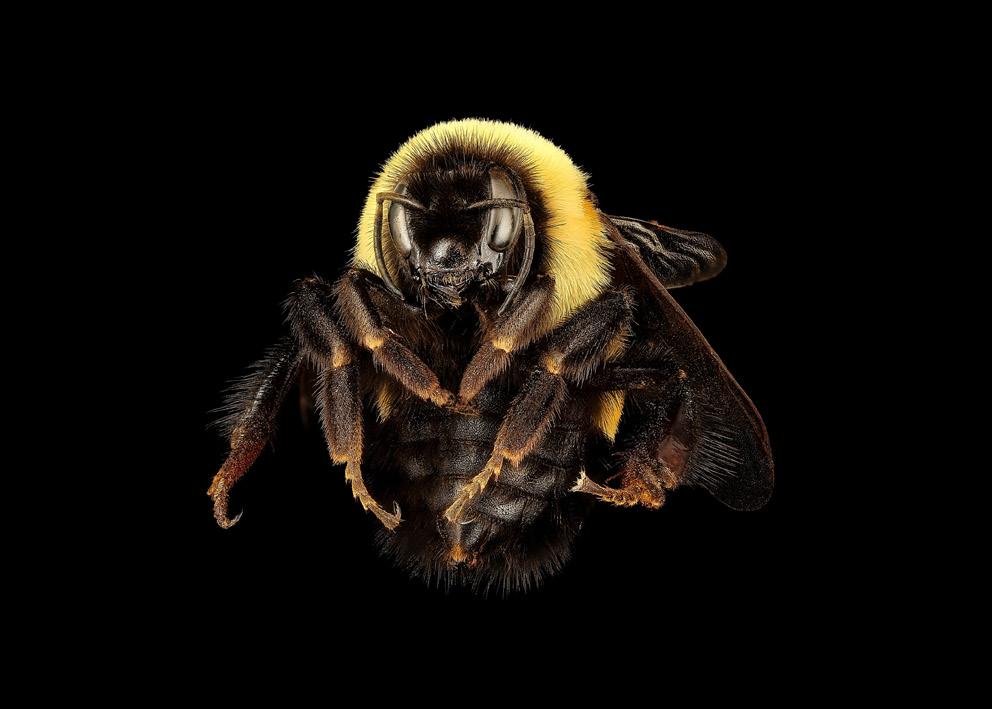
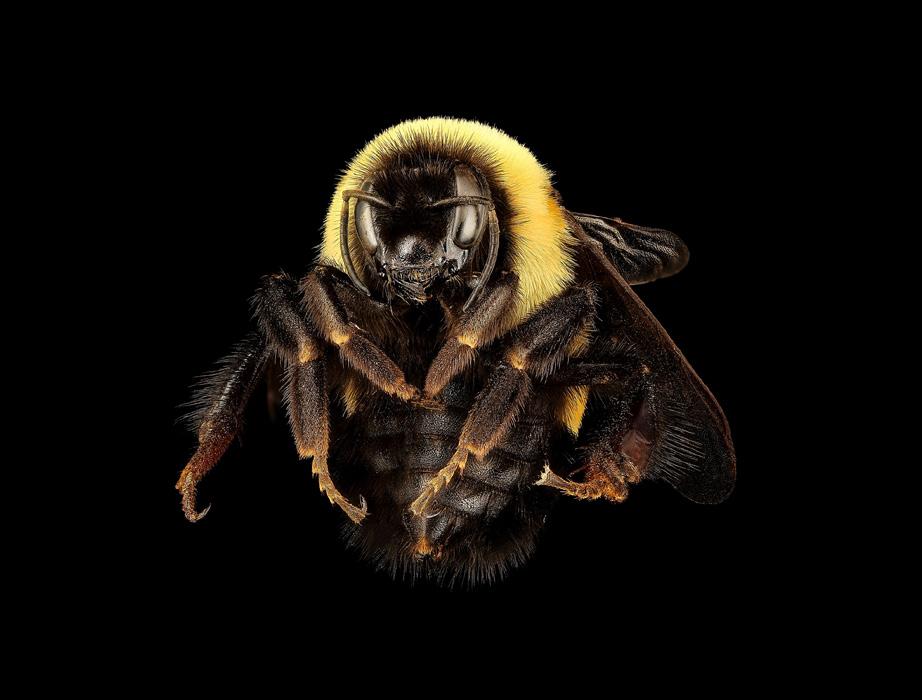
The image shows a close-up of a queen Bombus affinis, once a common bumblebee species but now endangered. Despite its small size, it serves as an essential pollinator, moving from flower to flower, and helping sustain the delicate biological systems that support plant life, food webs, and ultimately, human life.
Credit: Sam Droege, Public Domain
Chemistry Section
The image shows a Belousov–Zhabotinsky (B-Z) reaction forming spiral wave patterns in a petri dish, driven by periodic changes in the oxidation states of chemical species over time. These oscillations arise from nonlinear reaction kinetics and diffusion, producing a self-organizing chemical system.
Credit: Felice Frankel, used with permission
Engineering Section
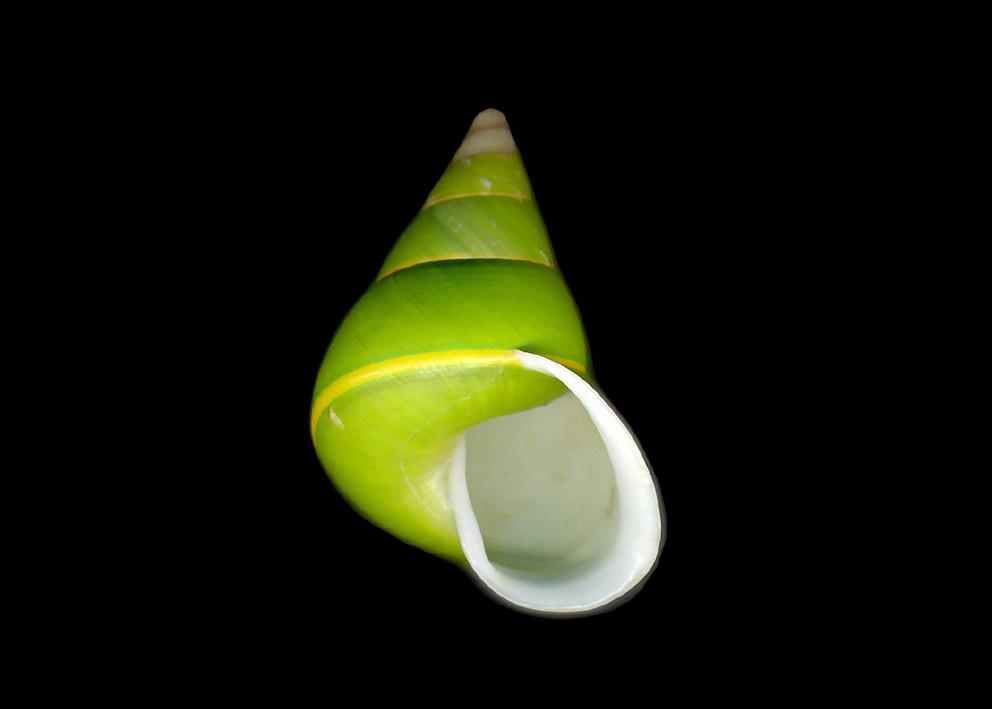
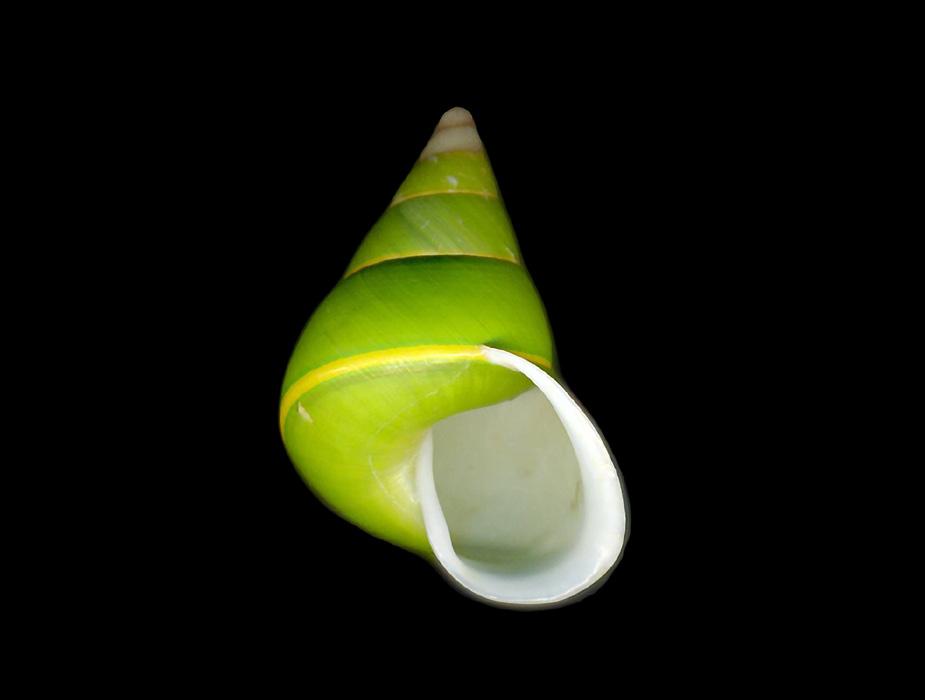
The image shows the endangered land snail Papuina pulcherrima (also known as Papustyla pulcherrima) from Manus Island, Papua New Guinea, characterized by its smooth, spiraled shell and vibrant green coloration. The shell, composed primarily of calcium carbonate, forms through a biomineralization system that creates a lightweight yet resilient and efficient structure.
Credit: Tim Ross, Public Domain
Mathematics and Computer Science Section
The image shows a synthetic bismuth crystal with stepped, geometric formations and an iridescent surface created by a thin layer of oxidation. Its staircase-like structure reflects iterative growth patterns and fractal-like, self-similar geometry, where repeating forms emerge at different scales within a selforganizing system.
Credit: Heinrich Pniok, Public Domain
Physics Section
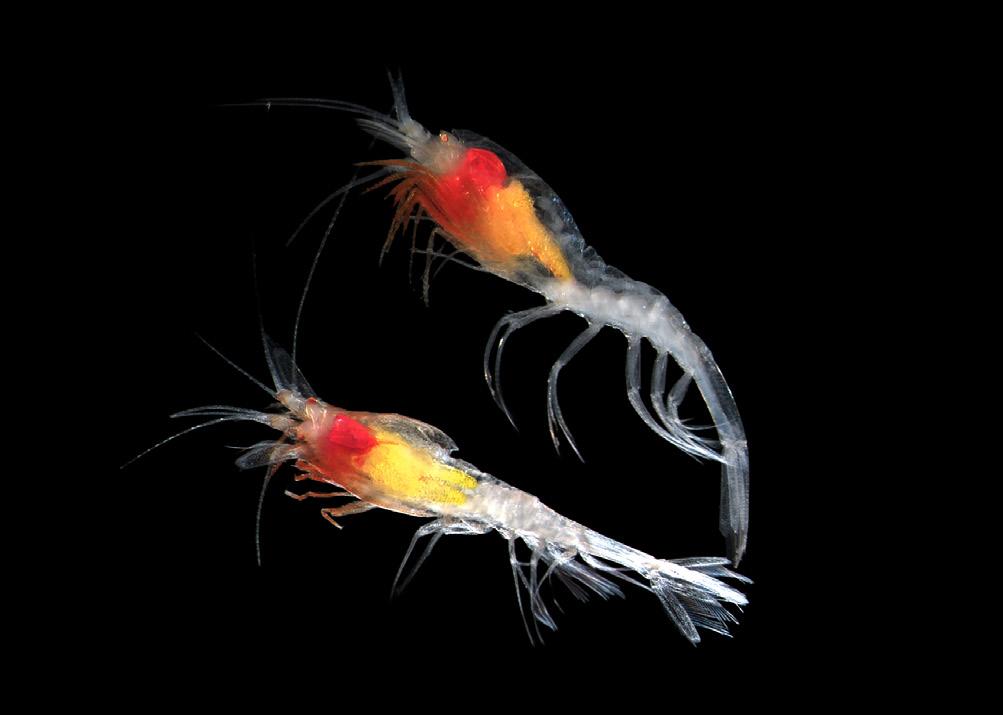
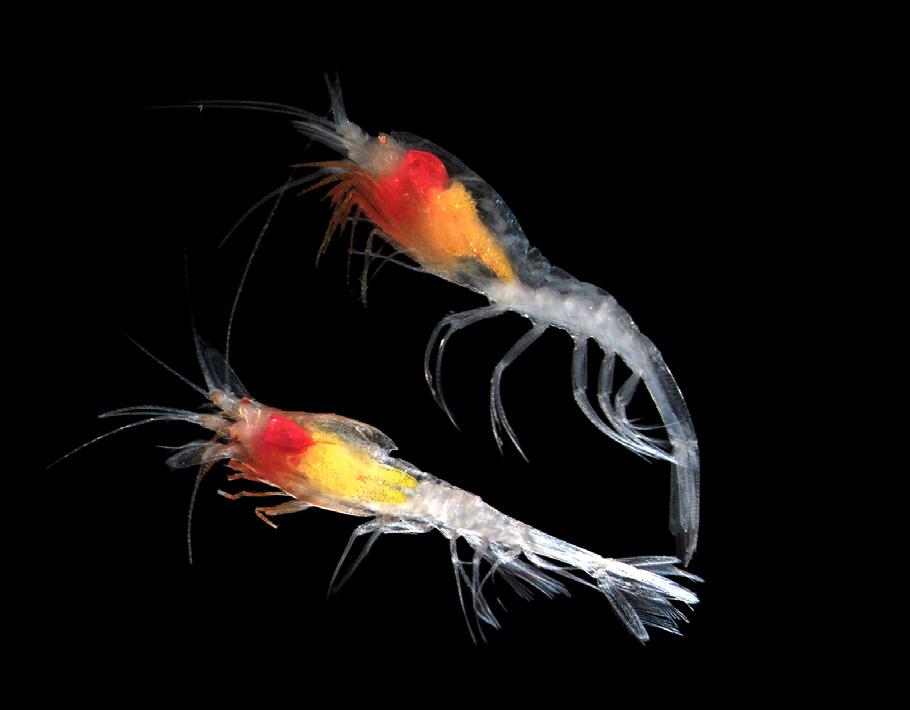
The image shows Hymenodora glacialis, a translucent pelagic shrimp inhabiting the cold waters of the Canada Basin in the Beaufort Sea. It uses its thoracic and abdominal appendages to move through the water column, generating thrust while minimizing drag within a lowenergy system.
11 Blocking the Wnt Signaling Pathway to Prevent Skin Cancer and Metastasis Using Porcupine Inhibitors in Unio crassus
LYDIA LE, 2026
18 Comparing the Effects of Phospholipase A₂ Inhibition and Dexamethasone Treatment in the Recovery of the Neuromuscular Junction in Brachial Plexus Injury of Procambarus clarkii
MANNY PRICE, 2026
29 Investigating the Effects of Rapamycin and Abscisic Acid to Improve Desiccation Resistance in Sphagnum carolinianum
JIYA ZAVERI, 2026
Chemistry
37 The Design, Synthesis, and Evaluation of Profluoracil: A Small Molecule Dihydrofolate Reductase Inhibitor for Psoriasis Treatment
LUCAS RODRIGUEZ CHIAPPETTA, 2026
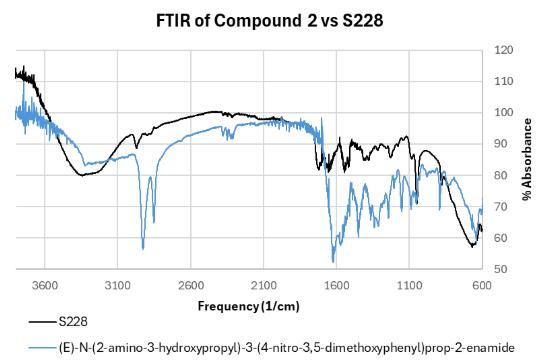
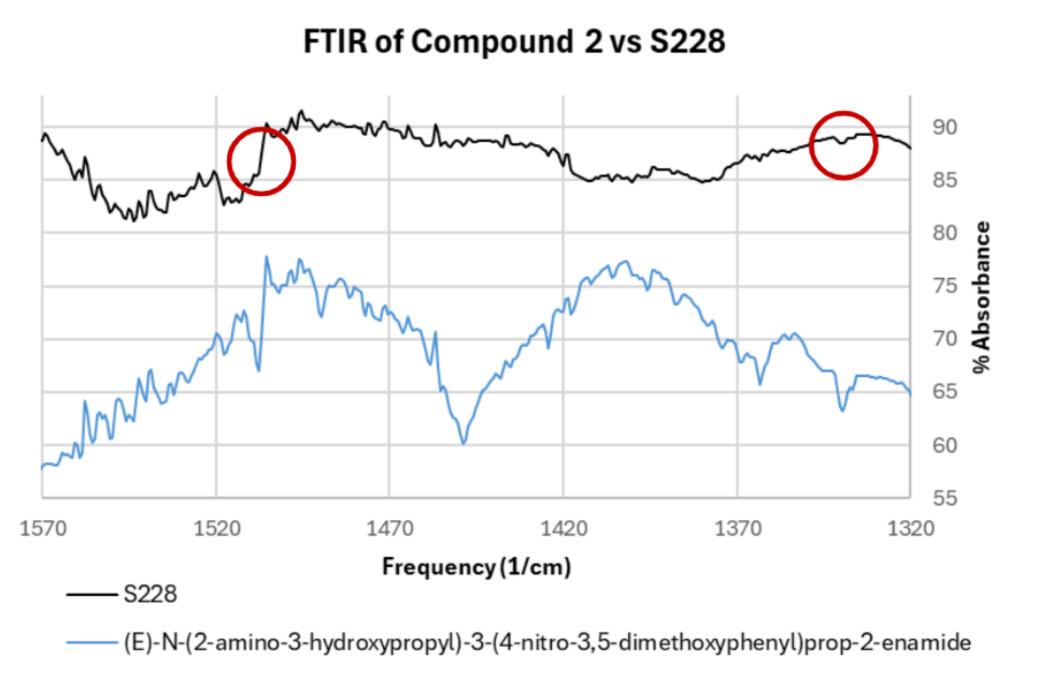
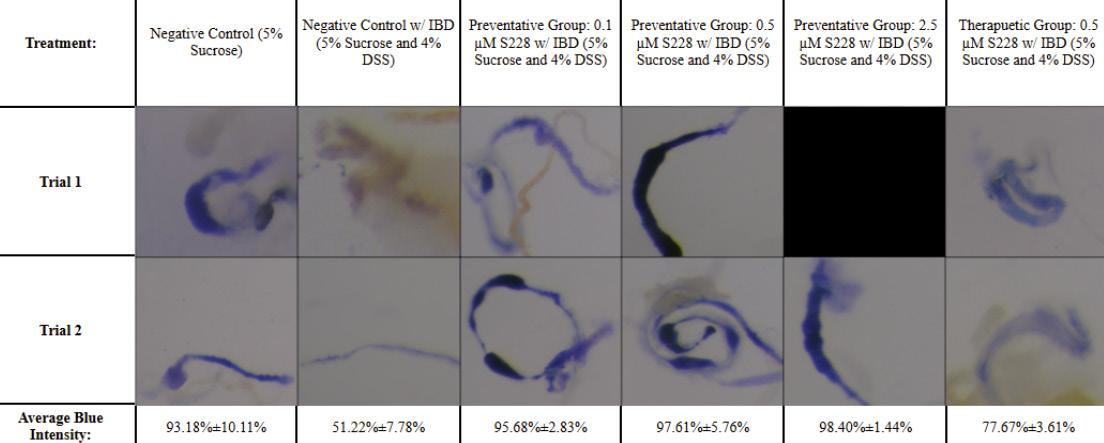
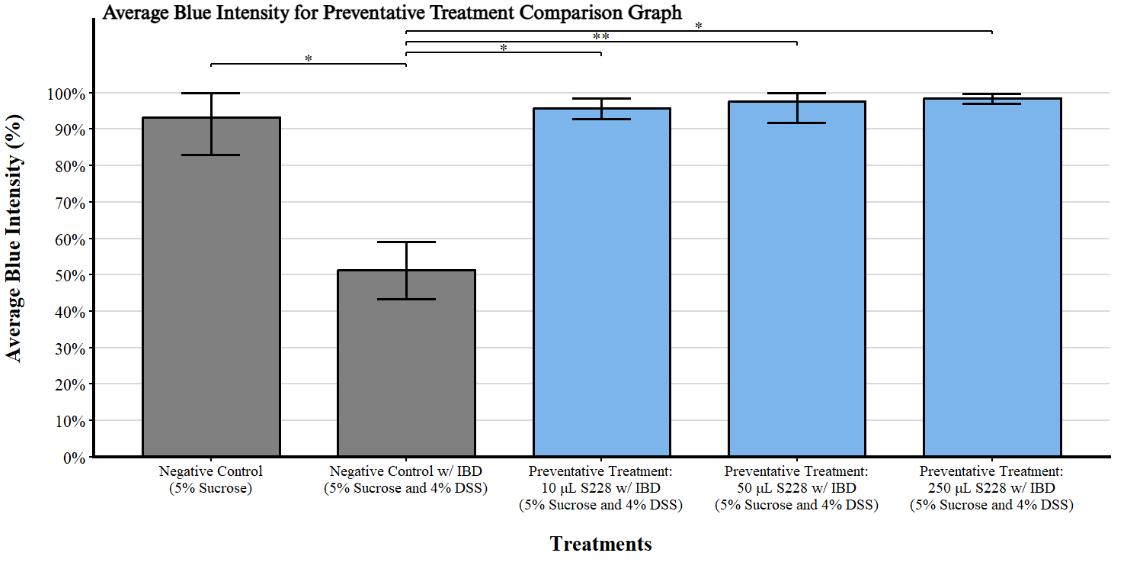
46 Design, Synthesis, and Testing of a Novel 3,5-Dimethoxycinnamic Acid-based Cathepsin C Inhibitor for the Treatment of Inflammatory Bowel Disease
FILLIP FUŇÁK, 2026
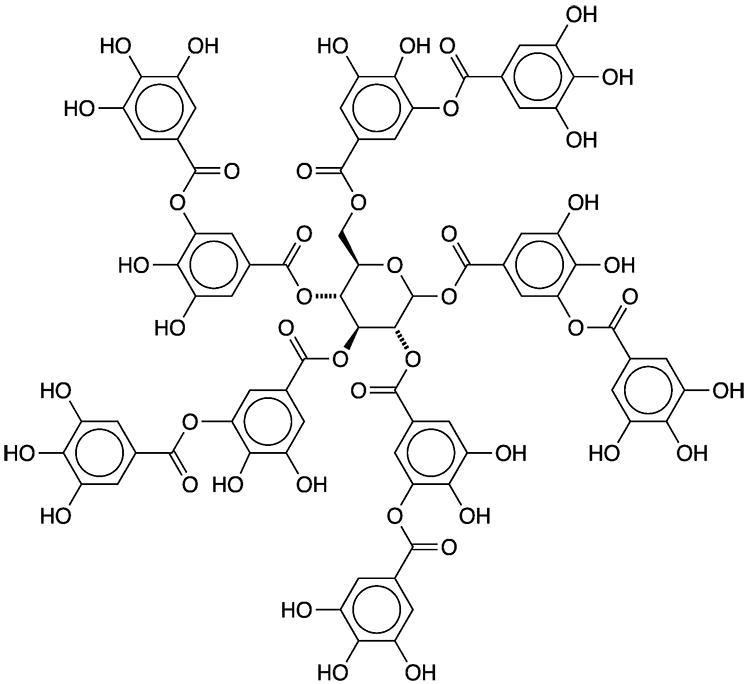
60 Tannic Acid Loaded pHEMA-Quaternary Chitosan Hydrogels for Use as Antimicrobial Contact Lenses
REBEKAH SWITZER, 2026
Engineering
68 Design, Control, and Experimental Validation of a Precision Linear Actuator-Sting System for Supersonic Wind Tunnel Testing
SANIKA AGARKAR, 2026
75 Impact of Microneedle Formulation and Design on Drug Release Kinetics
HILARY CHEN, 2026
Mathematics and Computer Science
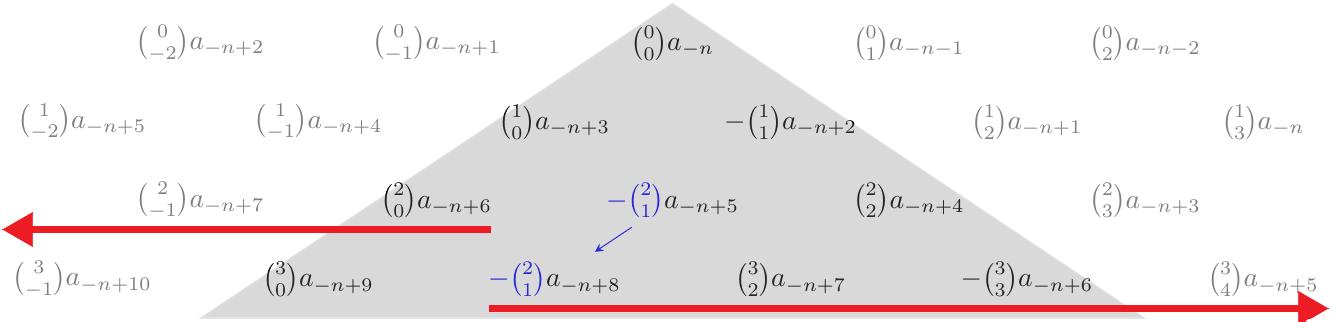
82 An Elementary Derivation of the Explicit Formula For Negatively Indexed Elements of the Narayana's Cows Sequence
NATHANIEL D’ANNUNZIO, 2026
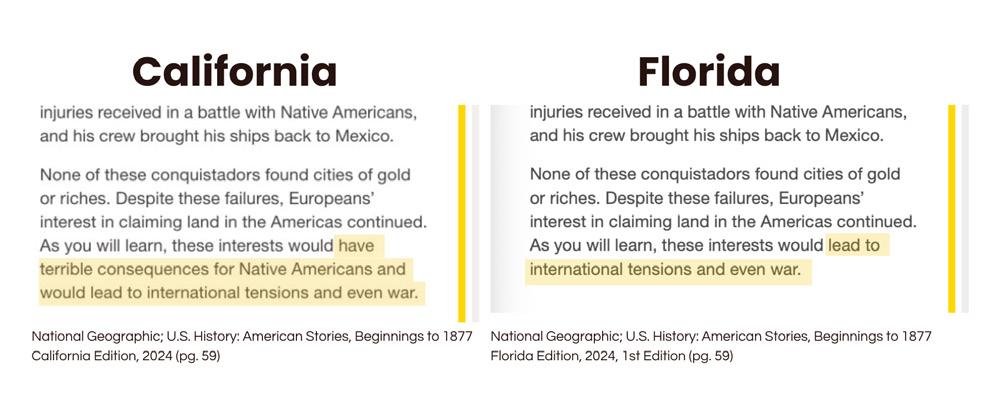
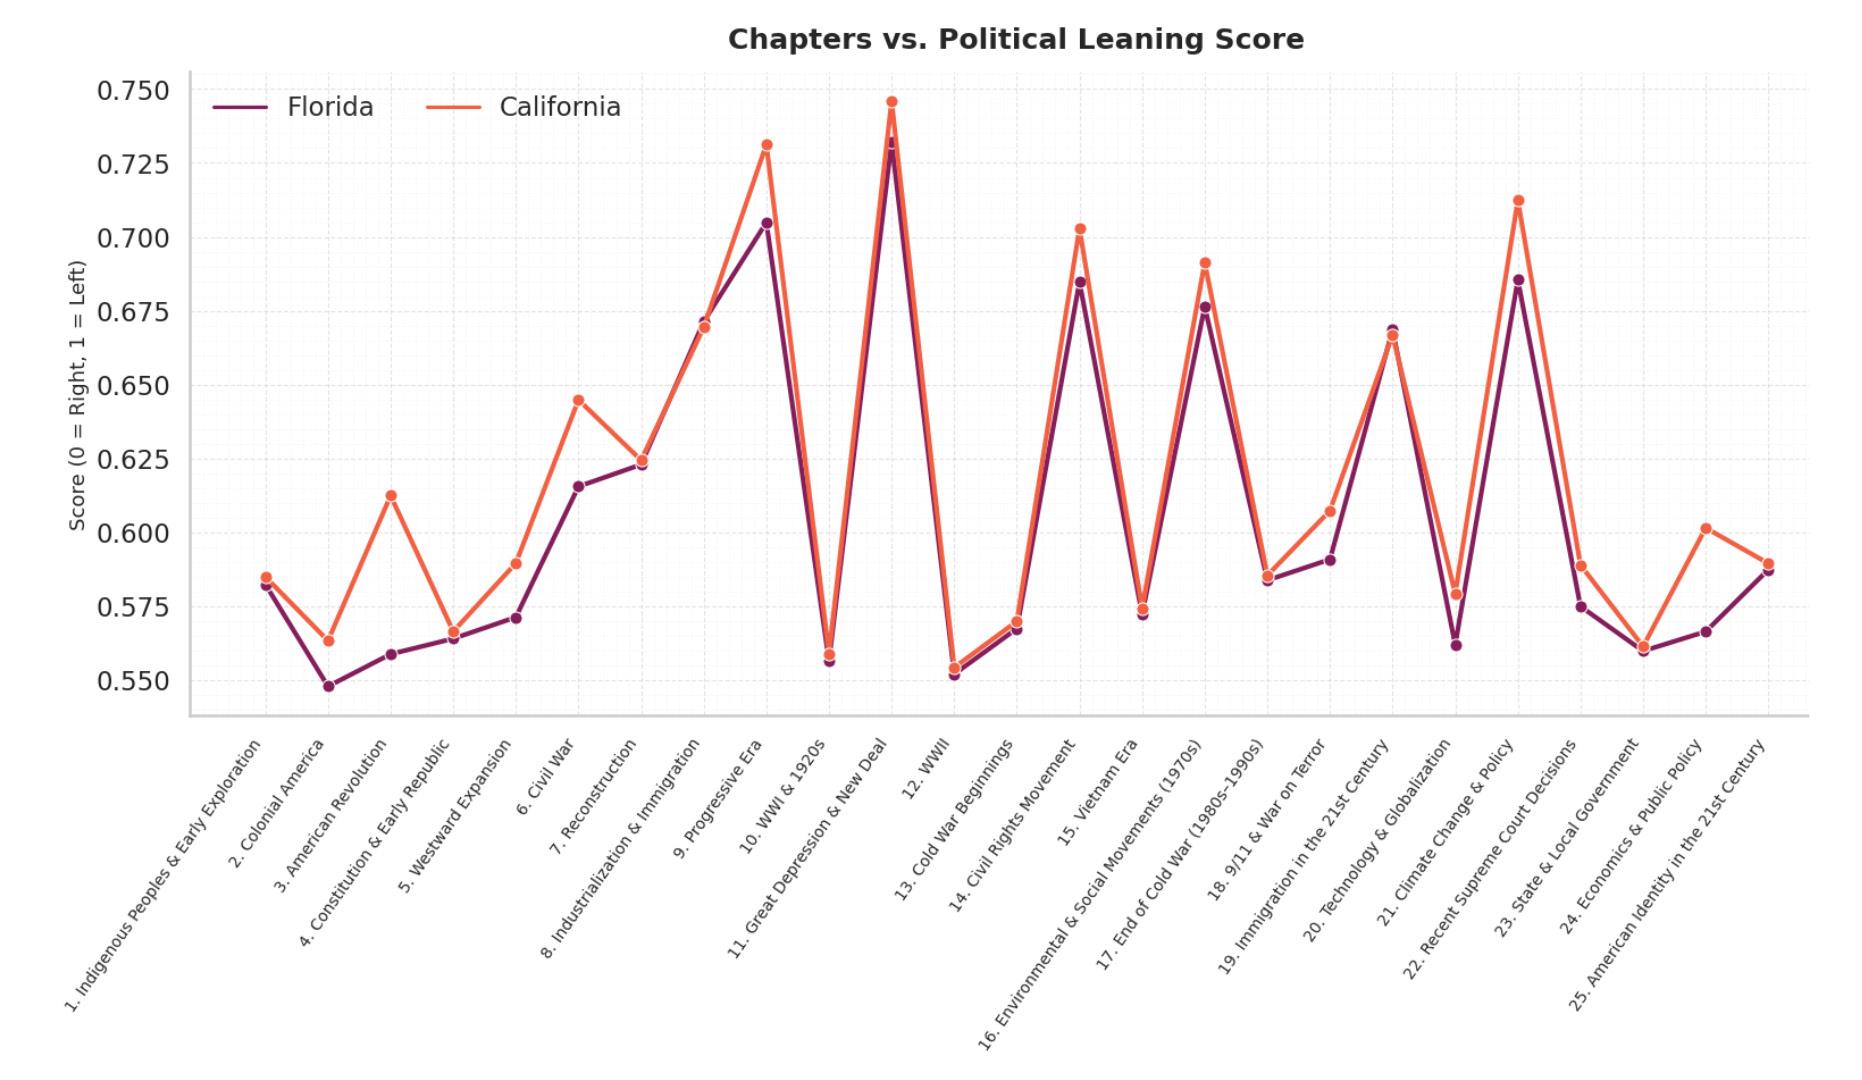
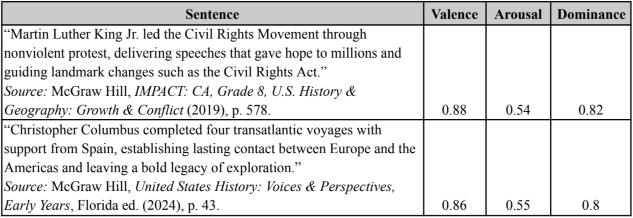
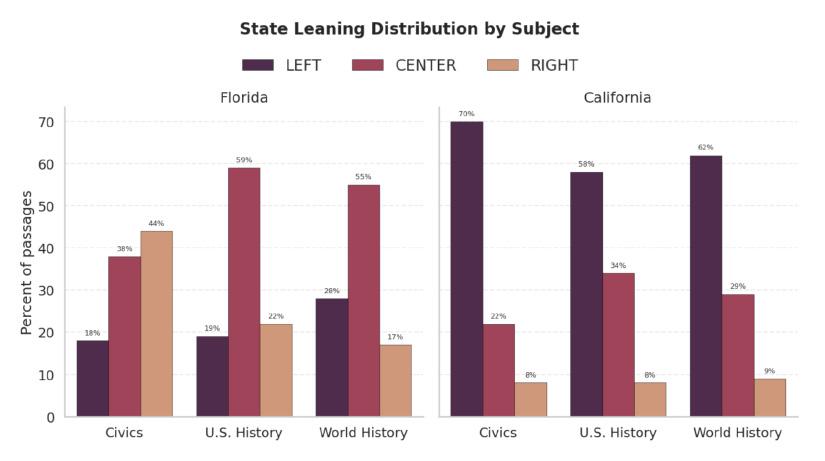
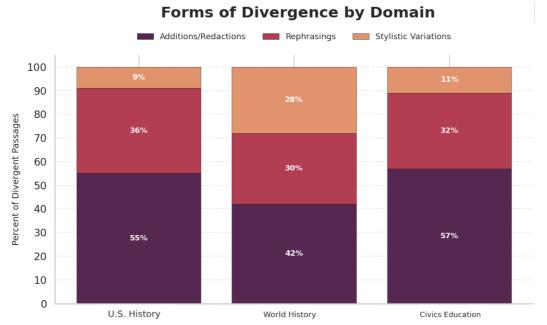
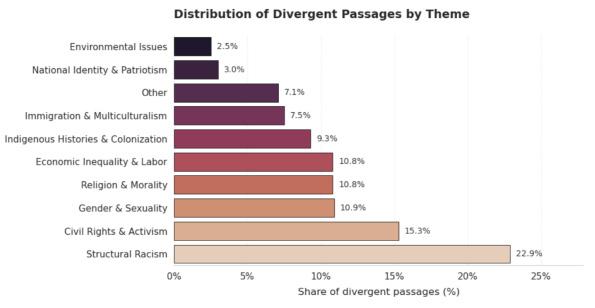
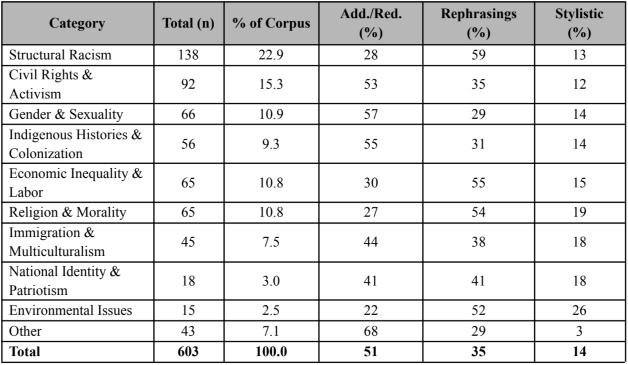
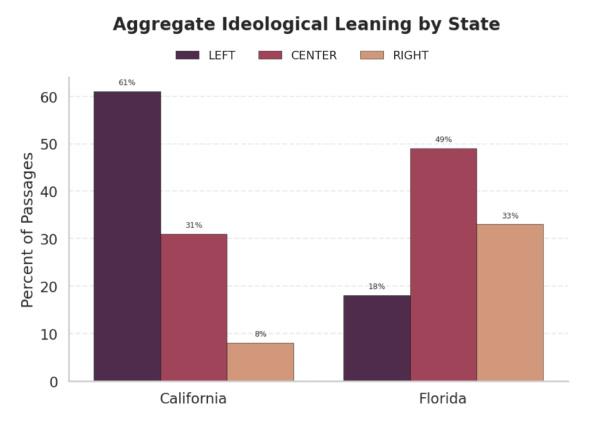
90 Teaching Two Americas: A Machine Learning-Based Comparative Analysis of Political Framing in California and Florida Textbooks
SNEHA KHETAN, 2026
Physics
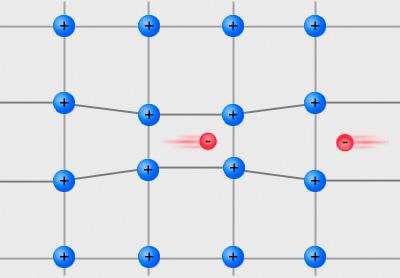
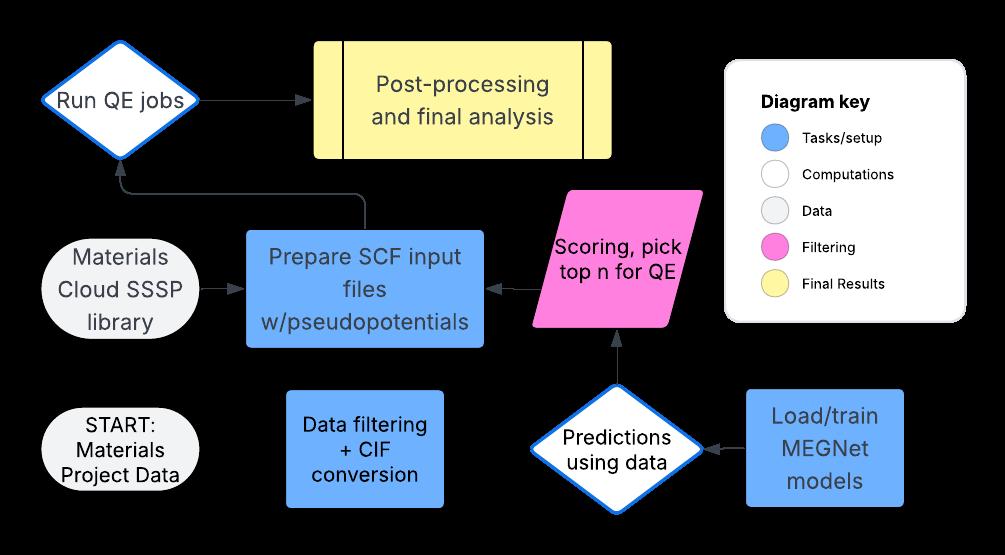
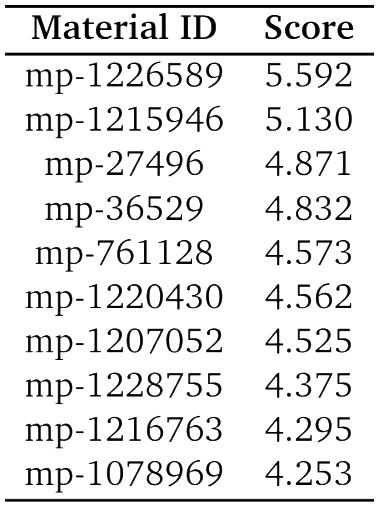
104 Design of a Hybrid ML-DFT Based Workflow for Materials Search
ANJANI GANESH ATTADA, 2027 ONLINE
114 Effects of Frequency and Microstructure Orientation Patterns on Micro-Acoustofluidics
CYNTHIA BALIN, 2026
Featured Article
126 An Interview with Felice Frankel
LETTER from the CHANCELLOR
“The most beautiful experience we can have is the mysterious. It is the fundamental emotion that stands at the cradle of true art and true science.”
I am proud to introduce the fifteenth edition of the North Carolina School of Science and Mathematics’ Durham Campus (NCSSM Durham) scientific journal, Broad Street Scientific. Each year students at NCSSM conduct significant scientific research, and Broad Street Scientific is a student-led and student-produced showcase of some of the impressive research being done by students on our Durham campus.
Opened in 1980, NCSSM was the nation’s first public residential high school where students study a specialized curriculum emphasizing science and mathematics. Teaching students to do research and providing them with opportunities to conduct high-level research in biology, chemistry, physics, computational science, engineering and computer science, mathematics, humanities, and the social sciences is a critical component of NCSSM’s mission to educate academically talented students to become state, national, and global leaders in science, technology, engineering, and mathematics. Today, nearly 90% of NCSSM students conduct research during their two years at NCSSM and I am grateful for our talented NCSSM faculty and mentors at institutions across
~ Albert Einstein
our state who provide these incredible opportunities for students, on two campuses and in our online program, to learn research methods and conduct high quality research. I am proud that at NCSSM, we are investing in developing the next generation of scientists and researchers who will use science to help develop new technologies and solve our most challenging problems for many years to come. I hope that as a country we remember the criticality of investing in scientific research, which is the bedrock of innovation, opportunity, and solving our greatest challenges, the ones we know of and the ones we’ve yet to discover. Amazing things happen when you bring talented researchers together with incredible faculty and mentors. I am excited that this year’s publication of Broad Street Scientific provides another opportunity to share with the broader community the outstanding research being conducted by NCSSM students.
I would like to thank all of the students and faculty involved in producing Broad Street Scientific, particularly faculty sponsors Dr. Jonathan Bennett, Dr. Mike Falvo, Dr. Lauren Wagner, and senior editors Ankit Biswas, Joshua Chilukuri, and John Guo. Explore and enjoy!
Dr. Todd Roberts Chancellor
WORDS from the EDITORS
Welcome to Broad Street Scientific, NCSSM Durham's official journal of student research in science, technology, engineering, and mathematics. With 15 years of student discoveries under its belt, the Broad Street Scientific continues to be a stalwart force in the NCSSM community, allowing students to spread their scientific creativity and knowledge into the wider world.
This past year, we introduced a new semester-long Independent Study offering, allowing our editors to devote significantly more time to the peer-review process. In addition, we streamlined the submission process to the journal for a smoother experience for authors and completely revamped our style guide for a new generation of Broad Street Scientific. These changes collectively help the journal continue excelling at its mission of highlighting student research conducted at NCSSM.
It is this idea of preservation that permeates the journal’s theme for 2025-2026: A System Worth Saving. Across disciplines, from the complex yet fragile food chains that support every organism on the planet, to the intertwined jungle of treaties and policies to keep night skies lightfree for astronomical observations, there are ordinary systems in plain sight that hold up the world we live in— systems worth saving.
Systems underlie the realm of biology, whether it be marine biomes or the hierarchical organization of bee swarms. This year’s chosen biology papers explore systems of signals within our cells, systems of strategies to prevent ecosystem desiccation, and systems of drug interplay within our bodies. The authors found systems in mussels, crayfish, and moss because the lives of all living things are systems worth saving.
Likewise, chemistry is a melting pot of multiple disciplines that drip into our everyday lives, and this year’s chemistry papers prove exactly this. From drug components that complete a whole when synthesized, or the multifaceted interaction between bodily functional structures, the authors showcase systems that have the capacity to improve quality of life around the world.
Engineering distinguishes itself from other sciences through a focus on building systems themselves. This year’s papers pushed the limits of student ingenuity by designing systems to test bladeless turbines and creating composite microneedles for improved drug delivery. The authors of the engineering papers have created systems worth preserving.
Math and computer science, too, are unique in the sense that they offer tools to understand how these vital systems function. Under every system worth saving is a pattern, pulsing beneath the surface. Some patterns are engraved into numbers, cascading in triangular sequences, while others surface in the language of education. Our authors have spotted these patterns hiding in the dark, and they have glimpsed the beauty of the system.
This year’s physics articles echo the theme through hidden systems that sustain progress and life itself. From saving subtle internal flows that quietly sustain the mind to discovering transformative materials that sustain a technology-driven world, these projects highlight the importance of networks. Together, these projects aim to preserve systems of high importance in the growing future.
This year, the journal also selected external and studentsubmitted photography to embody our theme: A System Worth Saving. From the bleached coral on the front cover—a devastating phenomenon driven by climate change—to the beauty found in the organized geometric shapes of natural bismuth, the natural world is full of interconnected systems in which individual parts come together to make up a whole greater than their sum.
Over this past year, the journal has worked hard to tell these stories and communicate the importance of these vital systems. The thread of these systems run across all fields and sciences—a sentiment echoed by the vast interdisciplinarity of this year’s papers. We would like to thank the authors for choosing to share these stories with us.
We would also like to thank the faculty, staff, and administration of NCSSM, particularly Chancellor Dr. Todd Roberts, Dean of Science Dr. Amy Sheck, and Director of Mentorship and Research for the Durham Campus Dr. Sarah Shoemaker. Through their work, they continue to preserve a collaborative and nurturing environment for the hundreds of future scientists, innovators, and changemakers attending NCSSM. We would also like to thank Dr. Jonathan Bennett, Dr. Michael Falvo, and Dr. Lauren Wagner for their tireless contributions and invaluable guidelines throughout this process. Finally, we would like to dearly thank Felice Frankel for a deeply insightful conversation on science communication and photography.
BROAD STREET SCIENTIFIC STAFF
Editors-in-Chief
Ankit Biswas, 2026
Joshua Chilikuri, 2026
John Guo, 2026
Publication Editors
Sid Bajpai, 2027
Casey Foeller, 2026
Nina Jing, 2027
Rishi Karumanchi, 2027
Oviya Selvakumar, 2027
Eric Zheng, 2027
Biology Editors
Sreeja Appala, 2027
Aarnav Gorantla, 2027
Emily Tang, 2027
Chemistry Editors
Vihaan Kinra, 2027
Aanya Prashanth, 2027
Engineering Editors
Ahnaf Azad, 2027
Sunny Shin, 2027
Mathematics and Computer Science Editors
Physics Editors
Kevin Luo, 2027
Tanay Vinaykya, 2027
Ekansh Bhatia, 2027
Grisham Paimagam, 2027
Faculty Advisors
Dr. Jonathan Bennett
Dr. Michael Falvo
Dr. Lauren Wagner
INFINITE HEARTBEAT
Kae Saotome
Kae Saotome was selected as the winner of the 2026 Broad Street Scientific Essay Contest. Her award included the opportunity to interview Felice Frankel, research scientist at the Massachusetts Institute of Technology in the Department of Chemical Engineering with additional support from Mechanical Engineering.
In a glass chamber filled with translucent red liquid, a single, delicate heart tissue the size of a walnut beats at a steady rate, capturing the whole world’s attention. The 2025 World Expo, held in Osaka, Kansai, Japan, showcased the world’s first “artificial heart” developed entirely from induced pluripotent stem cells (iPSCs)—living human cells (The Yomiuri Shimbun, 2025). This groundbreaking innovation attracted a plethora of visitors from around the world, eager to view the promising symbol of life.
By definition, iPSCs are cells initially extracted from adult somatic cells—body cells that are not reproductive cells—that are modified back to their original, embryonic stem cell-like state, in which the cells can differentiate or develop into any type of cell in the body again (UCLA BSCRC, n.d.). Initially produced in 2006 by the Yamanaka Lab at Kyoto University in Japan (Ye et al., 2013), iPSCs’ ability to function as any specific body cell has expanded the scope of scientific research into treatments for chronic diseases, such as Parkinson’s disease and diabetes.
Each year, it is reported that approximately 17.9 million people lose their lives globally from cardiovascular diseases (World Health Organization: WHO, 2019). Until recent years, treatments for such diseases had been largely limited to drug intake or a heart transplant, which highly depends on the amount of organ donor availability, making it detrimental for fast-progressing heart failures. With iPSCs, however, stem cells can successfully differentiate into essential cardiovascular cells such as cardiomyocytes, which are cardiac muscle cells responsible for beating the heart (Cho et al., 2021). These cardiomyocytes can be injected directly into the heart using a needle, replacing dysfunctional cardiac muscle cells and enhancing the heart's performance. However, injected cells typically have low survival rates, with only 0.1% to 5% surviving inside the heart, lowering the efficacy of iPSC-derived cardiomyocytes. This has led to the development of an iPSC-based cardiac patch—a small, thin sheet the size of a postage stamp with millions of iPSCs grown on it—designed to be implanted directly onto the surface of the human heart. The structure of these patches allows for an increase in the cell-cell interaction of cardiomyocytes, leading to a significant increase in cell survival rates
(Duan, 2020). Additionally, iPSC-based cardiac patches have demonstrated improved performance of the heart compared to the direct injection method. In a 2020 study, a group of female Lewis rats experiencing heart failure was implanted with cardiac patches on their left anterior descending artery, a crucial portion of the heart that supplies the whole heart muscle with oxygen-rich blood. After the 4-week observation period, the survival of the rats showed a striking result: 100% of the rats implanted with a cardiac patch survived, along with a significantly stabilized cardiac rhythm (Yeung et al., 2019).
The iPSCs’ ability to differentiate into any human body cell provides endless applications for treating patients. For example, hospitals and transfusion centers in urgent need of blood can utilize iPSC-derived blood cells, alleviating the shortage of blood donor supplies. The nearly limitless supply of iPSCs that can be created also allows thousands of chemical compounds to be tested at once, helping scientists find new medical uses for pre-existing drugs.
In 1982, Jarvik-7, the first artificial heart made from aluminum and polyurethane materials, attracted global attention as it was implanted into a human patient for the first time in history (Khan & Jehangir, 2014). 43 years later, an artificial heart created entirely from living human cells was revealed to the public at the 2025 World Expo. With the discovery of iPSCs, artificial hearts can be engineered at scales never imagined before. Innovations such as the cardiac patch are just the beginning of an era in which cardiovascular diseases can be treated in a relatively safe and ethical way. There are still challenges that remain in making an iPSC-derived treatment method more accessible to patients, however. A major obstacle is that the production process is expensive, with costs ranging from 10,000 to 20,000 USD (Del Carmen Ortuño-Costela et al., 2019). Furthermore, it takes between 4 and 6 months for the iPSC to be ready for cell differentiation, minimizing the ease of accessibility for a larger population. Currently, iPSC production is also strictly regulated within a research laboratory; nonetheless, ongoing clinical trials are expected to make the process more approachable for the public. Regardless of the intrinsic obstacles that remain in utilizing iPSC
technology, being able to introduce it to the public in the near future will undeniably advance a diverse number of fields in healthcare and medicine.
The gently pulsing iPSC heart showcased at Osaka’s World Expo powerfully portrayed life itself and the scientific progress of mankind. Osaka University’s Emeritus Professor Yoshiki Sawa, the executive producer of the iPSC heart’s display pavilion, hoped that the innovation would inspire children to reshape their future and to deeply cherish the meaning of life. As Dr. Yoshiki Sawa stated, “Seeing a living, beating heart up close will likely be a first for many people. I hope they feel the presence of life—and a sense of gratitude” (Fujii, 2025).
Today, inventions that felt like a dream decades ago are a reality, and it is our imagination that truly shapes and drives the world. With a single heartbeat, an infinite number of imaginations and ideas arise, every one of them capable of setting in motion the future’s rhythm.
References
Cho, S., Lee, C., Skylar-Scott, M. A., Heilshorn, S. C., & Wu, J. C. (2021). Reconstructing the heart using iPSCs: Engineering strategies and applications. Journal of Molecular and Cellular Cardiology, 157, 56–65. https:// doi.org/10.1016/j.yjmcc.2021.04.006
Del Carmen Ortuño-Costela, M., Cerrada, V., GarcíaLópez, M., & Gallardo, M. E. (2019). The challenge of bringing IPSCs to the patient. International Journal of Molecular Sciences, 20(24), 6305. https://doi. org/10.3390/ijms20246305
Duan, B. (2020). Concise review: Harnessing iPSCderived cells for ischemic heart disease treatment. Journal of Translational Internal Medicine, 8(1), 20–25. https://doi.org/10.2478/jtim-2020-0004
Fujii, M. (2025, August 12). Preview Report: Pasona Group Pavilion “Pasona Natureverse” at Expo 2025 Osaka, Kansai — Highlights and Exhibits that Invite Us to Reflect on Life. Mice Times Online. https://micetimes.jp/en/ report-pasona-group-pavilion-pasona-expo-2025/
Khan, S., & Jehangir, W. (2014). Evolution of Artificial Hearts: An Overview and History. Cardiology Research, 5(5), 121–125. https://doi.org/10.14740/cr354w
The Yomiuri Shimbun. (2025, April 14). 2025 Expo Osaka: Next-Generation Technologies Displayed by Japanese Companies ; Robots, IPS ‘Heart’ showcased. The Japan News by the Yomiuri Shimbun. https://japannews.yomiuri. co.jp/science-nature/technology/20250414-248963/
World Health Organization: WHO. (2019, June 11). Cardiovascular diseases. https://www.who.int/healthtopics/cardiovascular-diseases
Ye, L., Swingen, C., & Zhang, J. (2013). Induced pluripotent stem cells and their potential for basic and clinical sciences. Current Cardiology Reviews, 9(1), 63–72. https://doi.org/10.2174/157340313805076278
Yeung, E., Fukunishi, T., Bai, Y., Bedja, D., Pitaktong, I., Mattson, G., Jeyaram, A., Lui, C., Ong, C. S., Inoue, T., Matsushita, H., Abdollahi, S., Jay, S. M., & Hibino, N. (2019). Cardiac regeneration using human‐induced pluripotent stem cell‐derived biomaterial‐free 3D‐bioprinted cardiac patch in vivo. Journal of Tissue Engineering and Regenerative Medicine, 13(11), 2031–2039. https://doi.org/10.1002/term.2954
PHOTOGRAPHY
Nolan Sheldon, Soham Kela, Zora Lentz, and Victoria Li
Nolan Sheldon, Soham Kela, Zora Lentz, and Victoria Li were selected as the winners of the 2026 Broad Street Scientific Photo Contest. Their awards included the opportunity to have their photographs featured in the 2026 volume of the Broad Street Scientific.
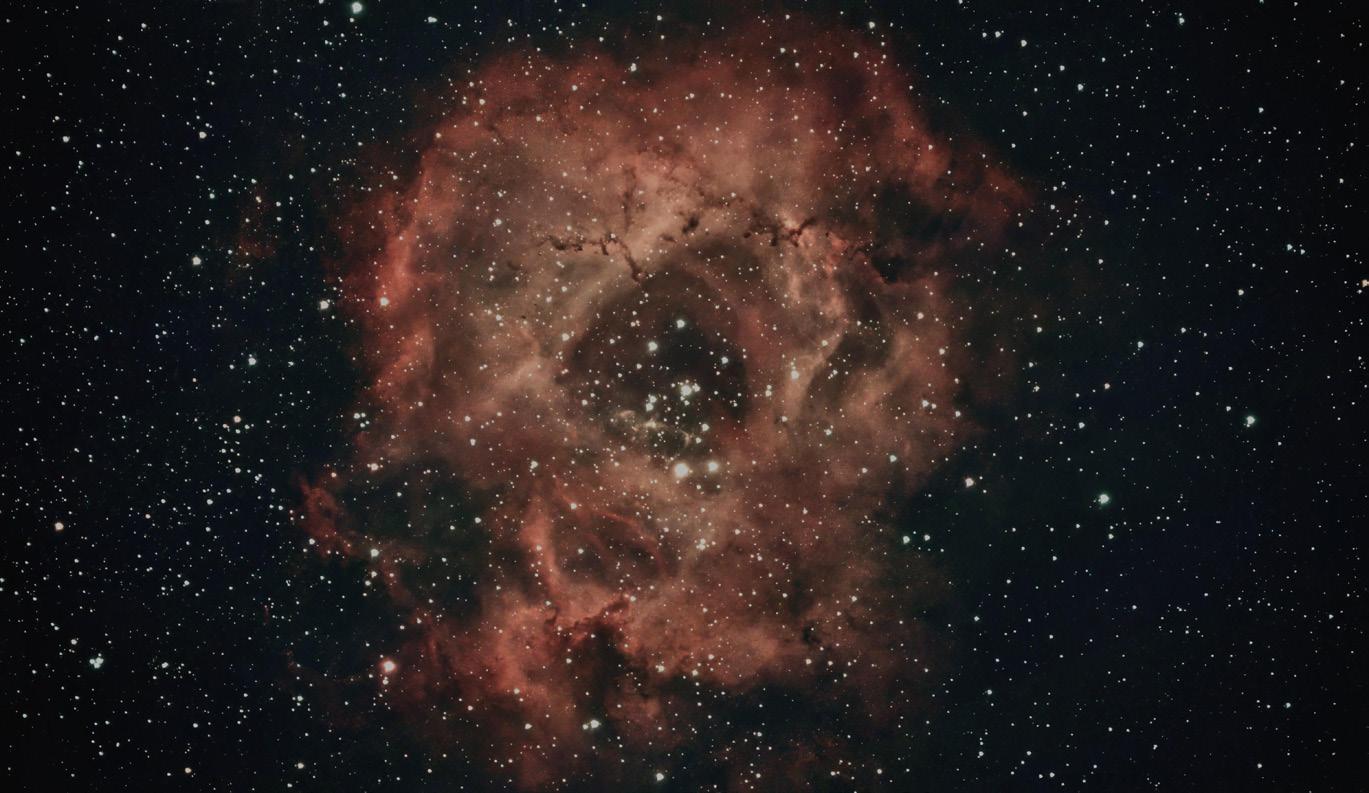
The image features the Rosette Nebula, a region of interstellar atomic hydrogen in the constellation Monoceros. At a distance of 5,200 light-years, the open cluster of stars in the central cavity sculpts out the rose-like structure that gives the nebula its name.
The photo frames a Heliconius melpomene—a Postman butterfly—on a branch. Its wings are folded, revealing its orange-and-white stripes that make it so recognizable. The butterfly is the single point of color in the image, its bright colors indicating to otherwise harmful predators the poison stored within its body.
Rosette Nebula by Nolan Sheldon
Butterfly Gardens by Soham Kela
This image features Polytrichum juniperinum, commonly known as juniper haircap moss. The species of moss is found on every continent, including Antarctica. It looks almost luminous, the light reflecting off each leaf.
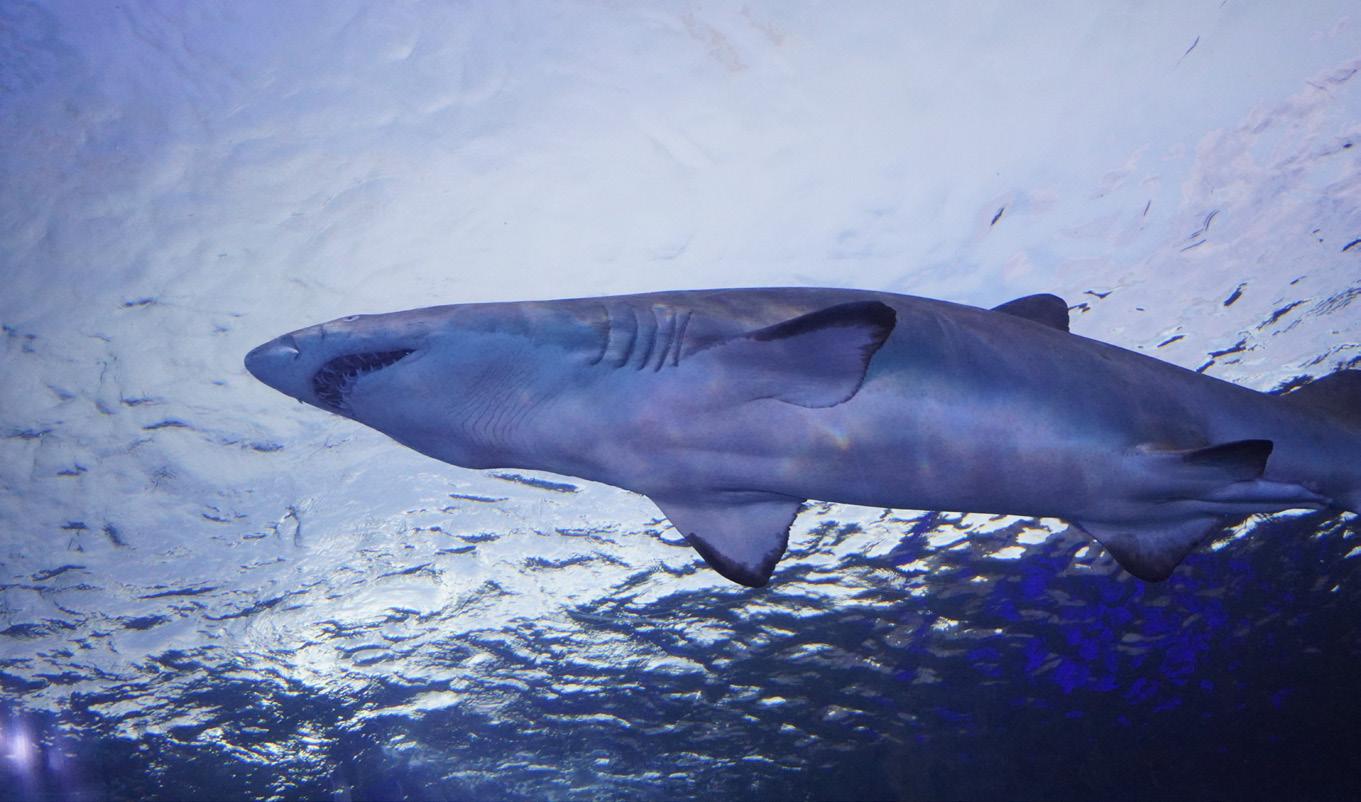
This photo features a sand tiger shark moving effortlessly through the waters of Ripley's Aquarium of Canada. Stoic, the apex predator calmly glides through the blue-lit depths, as if the world above the surface is of no concern whatsoever.
Juniper Haircap Moss by Zora Lentz
Silent Shark Glide by Victoria Li
BLOCKING THE WNT SIGNALING PATHWAY TO PREVENT SKIN CANCER AND METASTASIS USING PORCUPINE INHIBITORS IN UNIO CRASSUS
Lydia Le
Abstract
Skin cancer is the most common cancer in the world, driven by dysregulated cellular signaling pathways, most notably the Wnt pathway. The annual cost of treating skin cancers in the United States is estimated at $8.1 billion, with $4.8 billion for nonmelanoma types and $3.3 billion for melanoma types. Surgery for skin cancer is often highly invasive, ranging from wide local excisions to limb amputation. Unio crassus, a freshwater mussel capable of developing both transmissible and non-transmissible cancers, served as a model organism to investigate the effects of Porcupine (PORCN) inhibition on Wnt-mediated skin cancer progression. To induce unregulated cancer cell growth, mussels were exposed to ultraviolet (UV) radiation to dysregulate the Wnt signaling pathway and were subsequently treated with a Porcupine inhibitor. Skin cancer formation and cellular proliferation were assessed using 5-aminolevulinic acid (5-ALA) fluorescence and toluidine blue staining. UV-exposed mussels exhibited 5-ALA fluorescence and a highly concentrated toluidine blue intensity, confirming DNA damage and uncontrolled cell growth. Treatment with Porcupine inhibitor significantly reduced both fluorescence and staining intensity, indicating suppression of Wnt-driven skin cancer proliferation. Statistical analysis revealed significant differences among the control, ultraviolet-only, and Porcupine inhibitor-treated groups (Kruskal-Wallis, p < 0.05; ANOVA, p = 0.0175). These results demonstrate that Porcupine inhibition effectively suppresses the Wnt signaling pathway, reducing skin cancer growth and micrometastasis in Unio crassus. This study supports the feasibility of targeting the Wnt pathway for skin cancer prevention and supports Unio crassus as a practical in vivo model for investigating cancer therapies.
1. Introduction
1.1 Skin Cancer & Surgery
With over 2 million new cases projected in the United States in 2024 alone, cancer continues to be a major public health challenge, impacting individuals (NCI, 2015). Cancer is a disease in which some of the body’s cells grow uncontrollably and spread to other body parts. These cells may form skin cancer, which is a lump of tissue. Skin cancer spreads into, or invades, nearby tissues and can travel to distant sites in the body to form new tumors, a process known as metastasis. A major risk factor for skin cancer development is exposure to UV radiation, either from the sun or other sources (American Cancer Society, 2024). According to Cancer Research UK, excessive exposure to UV radiation is the leading cause of skin cancer (Cancer Research UK, 2018). Accumulated DNA damage in skin cells can cause cells to grow out of control and misinterpret their function (Cancer Research UK, 2014).
Surgery is a common approach to skin cancer treatment, and surgical resection can be performed for many types of cancer. Current surgical visualization techniques, such as the use of 5-aminolevulinic acid (5-ALA) fluorescence, help distinguish malignant from healthy tissue, yet
complete resection remains challenging, particularly in cases of diffuse or invasive lesions. Developing adjunct therapies that prevent recurrence following surgery is, therefore, a critical area of investigation.
1.2 Metastasis
In metastasis, cancer cells break away from the original skin cancer, travel through the blood or lymph system, and form a new cancer in other organs or tissues throughout the body (NCI, 2011). Micrometastases are small collections of cancer cells that have been shed from an original cancer and spread to another part of the body through the lymphovascular system (Zhang & Ge, 2013). While surgeons do attempt to remove cancerous skin cancers in their entirety during surgery, leaving behind a small group of cancer cells forming micrometastases is plausible.
1.3 Cell-to-Cell Communication
Cell-to-cell communication, more commonly known as cell signaling, describes how cells interact and communicate with each other in the body (Alberts et al., 2002). When cell-to-cell communication is disrupted, it can lead to many diseases and dysfunctions
(Regenerative Medical Institute, 2025). Consequently, cell-to-cell communication has a critical role during skin cancer development and progression, allowing cancer cells to reprogram not only the surrounding skin cancer microenvironment but also cells located at distant sites. In select cancer cells, the signals sent to regulate growth or initiate apoptosis get short-circuited, resulting in rapid cell growth that may lead to skin cancer. While healthy cells communicate to divide and thrive, cancer cells may hijack those signaling pathways and utilize them in harmful ways to facilitate their growth and metastasis.
1.4 Wnt Signaling Pathway
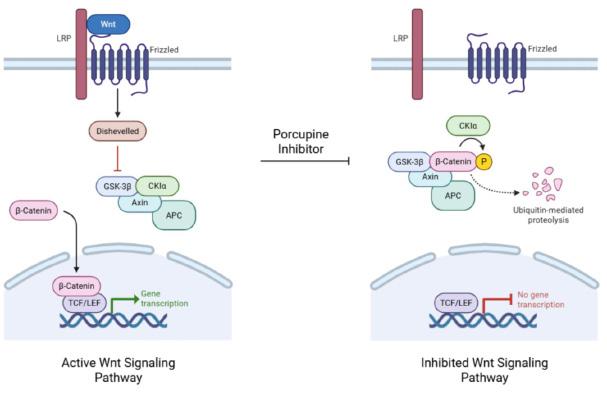
In healthy tissue, Wnt signaling controls stem cell renewal and differentiation, but aberrant activation can drive cancer initiation and progression (Fig. 1). In skin cancer, upregulation of Wnt/β-catenin signaling promotes tumor cell proliferation, invasion, and resistance to apoptosis.
Figure 1: Porcupine inhibitors block Wnt ligand secretion, preventing β-catenin stabilization and downstream gene transcription in the Wnt/β-catenin signaling pathway. Image created by the student researcher using BioRender, 2025.
1.5 Unio crassus
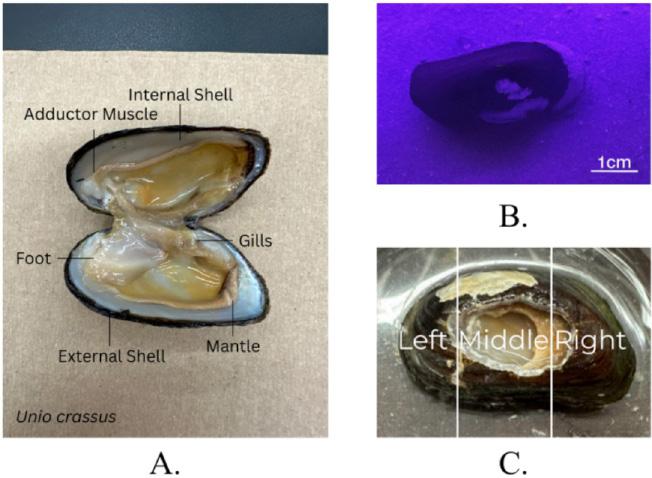
Unio crassus, the thick-shelled river mussel, is a species of freshwater mussel, an aquatic bivalve mollusk in the family Unionidae, the river mussels (Figure 2A). Before inducing Unio crassus with cancer, it needs to be anesthetized so that the organism can open its shell for UV radiation. When the mussel is anesthetized, its shell opens, and the mussel is relaxed enough that it can then be exposed to UV light to induce cancer. Moreover, this model organism is known to develop spontaneous skin cancers, particularly when cultured under intensive laboratory conditions (Tissot et al., 2023) (Fig. 2B). This allows for the study of skin cancers that naturally arise
and evolve without genetic modification (Shlyakhtina et al., 2021) (Fig. 2C). The Wnt signaling pathway regulates axial patterning and is involved in the formation of Unio crassus Unio crassus can develop skin cancers and contains the Wnt cellular pathway. Unio crassus is used to induced to develop cancer for this study.
Figure 2: A) A dissection of Unio crassus was conducted to learn its anatomy and physiology. Diagram created by the researcher using Canva, 2025. B) A photo of Unio crassus in a fully set-up tank showing its foot. Photo taken by the student researcher, 2025. C) Preparation of a window in the shell of Unio crassus using a Dremel tool. The Unio crassus tissue was divided into three regions (left, middle, right) to evaluate differences in how distinct anatomical areas were affected. Photo taken by the student researcher, 2025.
1.6 Porcupine Inhibitors and Palmitoylation
In the Wnt signaling pathway, Porcupine (PORCN) is a membrane-bound O-acyltransferase that is essential for the secretion and activity of Wnt proteins (Proffitt & Virshup, 2012). Specifically, PORCN is responsible for palmitoylation, a type of lipid modification on Wnt proteins (Liu, Qi et al., 2022). This modification is crucial for activating the Wnt signaling pathway by binding to its receptors (Liu, Xiao, et al., 2022). Targeting Porcupine inhibits cancer by blocking the Wnt signaling pathway, which is often overactive in cancer cells (Liu et al., 2013). Specifically, Porcupine inhibitors prevent the palmitoylation of Wnt proteins, a necessary step for their release from the cell and subsequent activation of the Wnt pathway (Shah et al., 2021). Porcupine inhibitors like LGK974 bind to and inhibit the PORCN enzyme, preventing Wnt ligands from being palmitoylated and secreted (Shah et al., 2021). This disruption in Wnt ligand secretion blocks the Wnt signaling pathway (Groenewald et al., 2023). PORCN adds a palmitoleic acid molecule, a type of fatty acid, to Wnt proteins, specifically at a serine
residue, which is essential for their release from the cell and subsequent signaling (Tuladhar et al., 2019). This serine residue modification is necessary for Wnt proteins to bind their receptors and activate downstream cellular responses (Liu, Xiao, et al., 2022).
1.7 Hypothesis
Studies have shown that targeting components of the Wnt pathway, such as Porcupine (PORCN), can reduce skin cancer growth and metastasis in preclinical models, suggesting that this pathway is promising. In this study, Porcupine inhibitors will be added to the cancer site after Wnt signaling pathway dysregulation to prevent skin cancer and micrometastasis in Unio crassus. Researchers predict that if Porcupine is blocked, this will prevent the secretion of Wnt ligands, blocking Wnt signaling, and then this will reduce skin cancer and inhibit micrometastasis. This study is the first to investigate the use of Porcupine inhibitors to block Wnt-mediated skin cancer in Unio crassus. This study hypothesizes that Porcupine inhibition suppresses Wnt signaling, thereby reducing skin cancer growth and micrometastasis. The null hypothesis is that Porcupine inhibition has no significant effect on Wnt signaling activity or micrometastasis in Unio crassus.
2. Materials and Methods
2.1
Unio crassus Growth and Maintenance
Approximately 16 kg of sand was collected from Wilmington, North Carolina (April 19, 2025), and autoclaved at standard sterilization conditions for 15 minutes to eliminate microbial contaminants, including bacteria and spores, and to minimize the introduction of external biological variables. The sand was evenly distributed into 2 tanks and allowed to settle for 36 hours before introducing Unio crassus obtained from Carolina Biological. Each tank was equipped with an external air pump connected to a submerged air stone to provide continuous aeration. Mussels were fed finely ground fish food and algae wafers twice weekly.
2.2 Dremeling and Experimental Groups
Mussels were anesthetized via cold shock by placing them in ice water for 2 hours. Previous trials with magnesium chloride, heat shock, and menthol proved ineffective; cold water anesthesia minimized stress and allowed safe handling. A 28,000 RPM Model 275 Type 5 single-speed Dremel tool with a diamond drill bit was used to create a 3 x 2 cm window in each shell, avoiding the adductor muscles to allow for exposure to UV light. The shell surface was sterilized with ethanol
before and after drilling. The window was covered with parafilm, and the paraffin melted at 200°C to prevent contamination. Mussels were randomly assigned (n = 10 per group) to three experimental groups: UV-exposed without Porcupine inhibitor treatment, UV-exposed with Porcupine inhibitor treatment, and an untreated control group with no UV exposure or Porcupine inhibitor treatment.
2.3 Ultraviolet Exposure
Mussels were exposed to ultraviolet radiation at 312 nm using a Fotodyne FOTO UB-21 Transilluminator, equipped with a 21 x 21 cm filter glass surface. Each mussel was exposed to UV light for 1 hour through the shell window. After exposure, mussels were returned to the tanks for 24 hours to recover from UV exposure.
2.4 5-Aminolevulinic Acid Hydrochloride Dye and
Image J
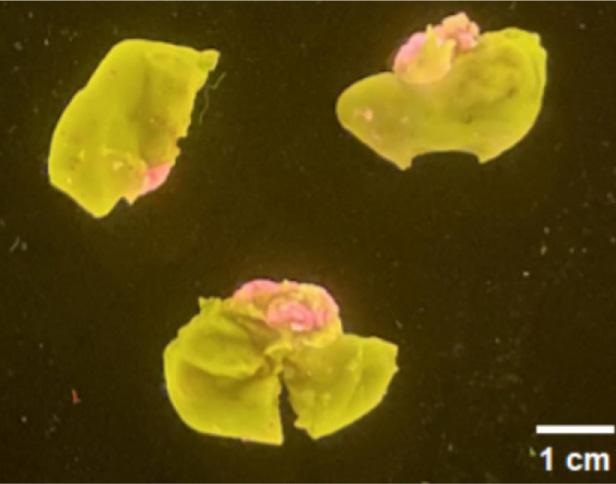
To visualize cancerous cell regions, 5-aminolevulinic acid hydrochloride (5-ALA) was injected into the mussel foot tissue at a dosage of 20 mg/kg body weight (Wen et al., 2020) (Fig. 3). The 5-ALA dye stock was diluted with deionized water under sterile conditions. Following the injection, mussels were maintained for 24 hours before dissection. Fluorescence imaging was conducted using ImageJ to quantify fluorescent pink regions indicative of cancer cell accumulation in the mussel tissue.
Figure 3: Mussels treated with 5-ALA dye show pink fluorescence, indicating cancer cells. Photo taken by the student researcher, 2025.
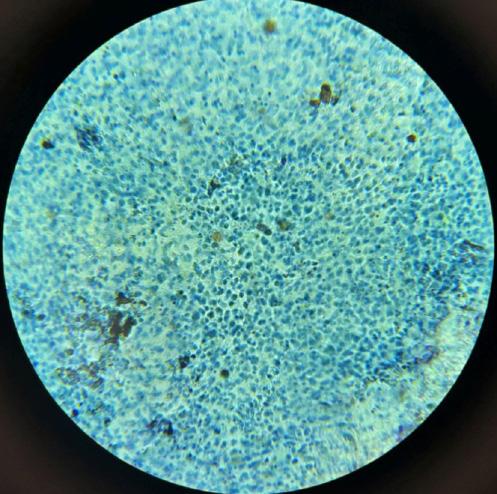
Tissues were also stained with toluidine blue to identify areas of high nucleic acid content, characteristic of rapidly dividing cancer cells (Fig. 4). The procedure
included slicing thin tissue from the mussel organism, adding hydrochloric acid (HCl) for 4 minutes to soften, adding Carnoy’s solution for 4 minutes to fix the cells, and using toluidine blue to stain the mussel tissue. ImageJ was used to quantify the photos taken of each tissue sample dyed by 5-ALA and toluidine blue. Using the RGB channel function in ImageJ, each image was separated into red, green, and blue channels to measure color-specific pixel intensity. This allowed for the mean intensity of each toluidine blue and 5-ALA sample to be recorded. Toluidine blue used the mean Blue intensity, and 5-ALA used the Red mean intensity because toluidine blue stains blue and 5-ALA fluoresces pink. The data were then recorded into Excel to be further analyzed.
Figure 4: Mussel tissue stained with toluidine blue to differentiate cancerous cells and measure for uncontrolled cell growth. Photo taken by the student researcher using a compound light microscope at 40x, 2025.
2.5 Porcupine Inhibitor
Porcupine Inhibitor C-59, used at a concentration of 5 mg/kg, was injected into the mussel’s foot tissue every day for 1 week to inhibit the Wnt signaling pathway and suppress further cancerous skin growth (Paul et al., 2025). Tissue toluidine blue staining and 5-ALA were again used post-treatment to confirm a reduction in blue-stained cancerous regions, and no pink fluorescence, indicating decreased nucleic acid content and reduced skin cancer cells.
Mussel mass was measured before treatment and converted from grams to kilograms for dose normalization. For all of the groups, 5-aminolevulinic acid (5-ALA) was
administered at a target dose of 20 mg·kg-1 body mass. For the Porcupine inhibitor-treated group, the inhibitor was administered at 5 mg·kg-1 body mass. Injection volumes were calculated based on individual mussel mass and the known concentrations of the prepared stock solutions. Final volumes were converted to microliters (µL) to ensure consistent dosing across all individuals.
2.6 Statistical Analysis
Data were quantified using ImageJ and Microsoft Excel. A Shapiro-Wilk test was used to check if the data were normally distributed. Mean fluorescence intensity and toluidine blue staining density were compared across treatment groups using one-way ANOVA and Kruskal-Wallis tests, followed by Tukey’s post hoc test to determine significant differences.
3. Results
3.1 Toluidine Blue Staining
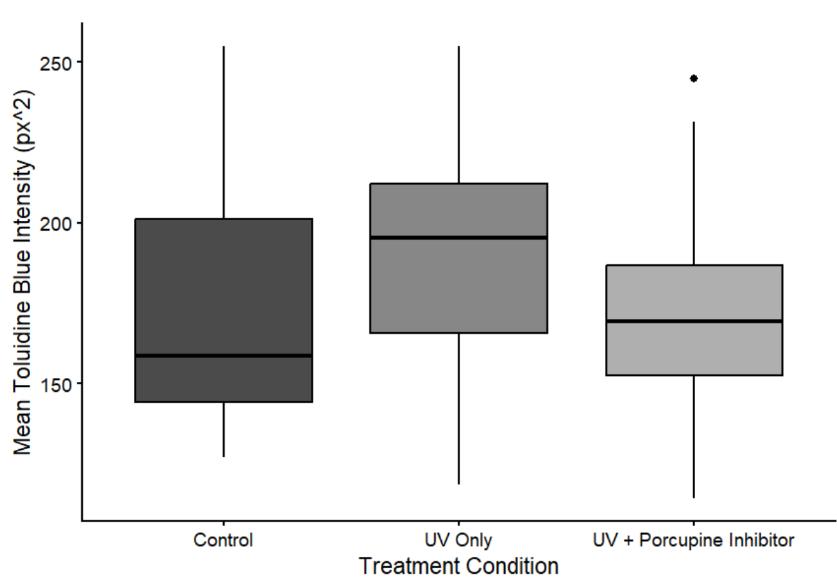
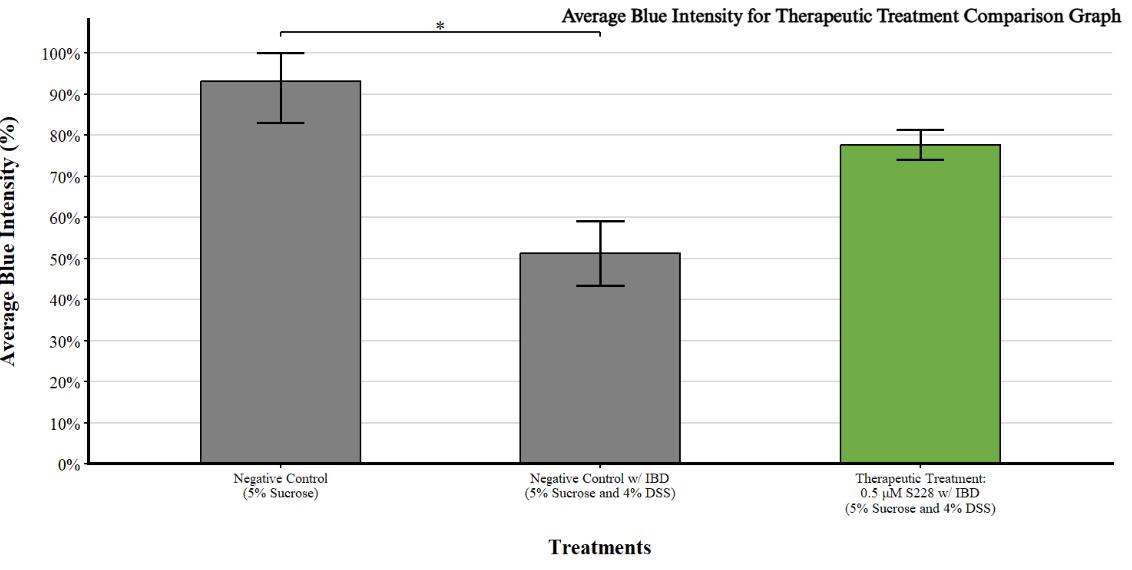
Toluidine blue staining was analyzed in both cell and mussel tissue samples to assess mean staining intensity across treatment conditions (UV Only, UV + Porcupine Inhibitor, and Control) (Fig. 5).
Figure 5: Toluidine blue staining intensity across treatment groups. Mean staining intensities were not normally distributed (Shapiro–Wilk, p < 0.01); therefore, a Kruskal-Wallis test was used and revealed a significant difference among groups (χ 2 = 6.84, df = 2, p = 0.033, n = 30). Graph created by the student researcher using RStudio, 2025.
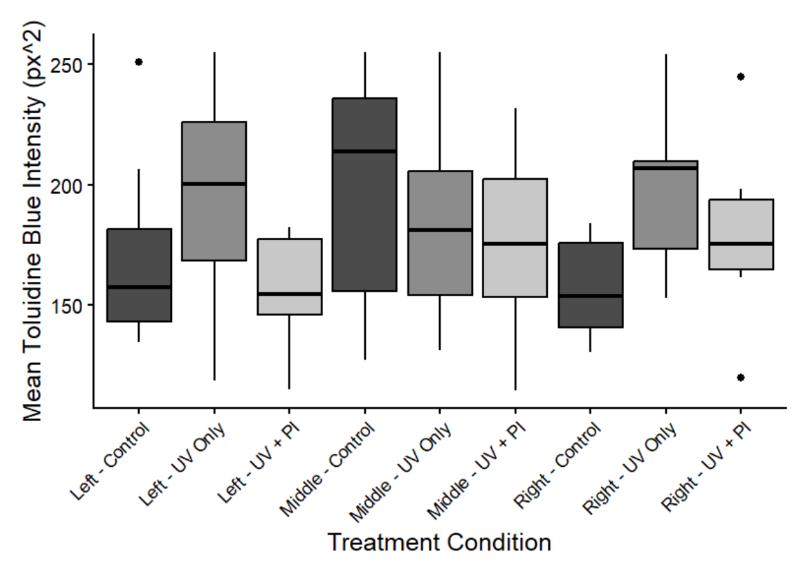
To further assess spatial variation, toluidine blue staining was analyzed by tissue region (Left, Middle, and Right) (Fig. 6). This approach helps determine whether staining intensity differences are localized to specific anatomical regions of the mussel, which may correspond
to function or structural differences in tissue composition.
Figure 6: Toluidine blue staining intensity across three mussel tissue regions. Mean intensities were not normally distributed (Shapiro–Wilk, p < 0.01); therefore, a Kruskal–Wallis test was used and revealed a significant difference among regions across experimental groups (χ 2 = 6.84, df = 2, p = 0.033, n = 30). Graph created by the student researcher using RStudio, 2025.
Together, these results demonstrate that toluidine blue staining intensity differences are localized primarily to the left region of mussel tissue. This spatial variation may reflect differences in tissue density, cellular composition, or accessibility of dye binding sites across regions.
3.2 5-ALA Fluorescence
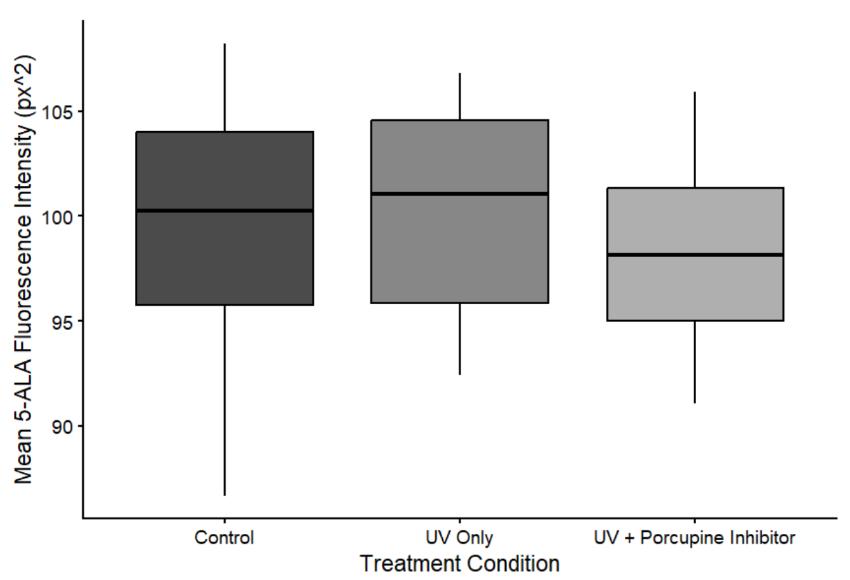
5-ALA fluorescence intensity was measured across the UV Only, UV + Porcupine Inhibitor, and Control groups to evaluate potential differences in metabolic or structural activity (n = 30) (Figure 7).
Figure 7. 5-ALA fluorescence intensity in cells across treatment groups. Data were normally distributed (Shapiro–Wilk, p = 0.44); therefore, a one-way ANOVA revealed a significant difference among groups (F = 0.203, df = 2, n = 30, p = 0.018). Post-hoc Tukey’s HSD analysis indicated that the UV + Porcupine Inhibitor group differed significantly from the Control (p < 0.05), suggesting decreased 5-ALA fluorescence under inhibitor treatment. Graph created by the student researcher using RStudio, 2025.
4. Discussion
Exposure of Unio crassus to ultraviolet (UV) radiation successfully induced skin cancer cell proliferation, evident by increased 5-aminolevulinic acid (5-ALA) fluorescence and intensified toluidine blue staining. 5-ALA dye, which accumulates in rapidly dividing or metabolically active cells, produced strong pink fluorescence in mussel tissues exposed to UV light, confirming cancer cell formation. In contrast, control specimens without UV exposure did not fluoresce, indicating the absence of malignant activity. Toluidine blue staining provided further evidence of cancerous transformation. UV-exposed mussels exhibited darker and more extensive blue staining compared to the negative control, reflecting higher nucleic acid content associated with uncontrolled cell division.
Following treatment with the Porcupine inhibitor, a marked reduction in toluidine blue intensity was observed, suggesting suppression of skin cancer cell proliferation. Similarly, 5-ALA fluorescence was substantially reduced in the inhibitor-treated group, further supporting the inhibition of Wnt-driven cancer activity. These findings support the hypothesis that Porcupine inhibition can effectively block the Wnt signaling pathway, thereby preventing or reducing skin cancer formation and metastasis in Unio crassus. Since Porcupine (PORCN) is required for the secretion of Wnt ligands, its inhibition disrupts downstream β-catenin signaling and reduces the transcription of oncogenic target genes. This mechanism
aligns with previous studies demonstrating that aberrant Wnt activity promotes cancer growth, while its inhibition suppresses metastasis and cell proliferation in other model organisms.
Although these results demonstrate a clear inhibitory trend, some limitations should be noted. The oneweek post-treatment observation period may not fully capture long-term effects on skin cancer recurrence or metastasis. Further research should focus on optimizing and expanding sample size, and confirming Wnt pathway suppression through molecular markers such as β-catenin or Cyclin D1 expression.
5. Future Directions
Future research should focus on quantifying downstream pathway components such as β-catenin and Cyclin D1 to confirm molecular inhibition, as well as testing different inhibitor concentrations and exposure durations to determine optimal treatment conditions. Ultimately, this work provides a foundation for developing affordable, targeted cancer therapies that may have applications across both invertebrate and human systems.
6. Conclusions
This study demonstrated that exposure to ultraviolet (UV) radiation induces cancer-like cellular changes in Unio crassus, evidenced by increased 5-aminolevulinic acid (5-ALA) fluorescence and toluidine blue staining intensity. Treatment with a Porcupine (PORCN) inhibitor significantly reduced both fluorescence and staining intensity, indicating that inhibition of the Wnt signaling pathway effectively suppresses tumor cell proliferation. The findings also validate Unio crassus as a viable and cost-effective model organism for studying skin cancer progression and therapeutic interventions.
7. Acknowledgements and Data Availability
Thank you to the NCSSM Foundation, the Burroughs Welcome Fund, and GlaxoSmithKline for funding my project. A special thank you to Dr. Mallory, my mentor, for her guidance and amazing support throughout this process, and to Dr. Monahan for her help during the Summer Research and Innovation Program (SRIP). Thank you to the Research in Biology classes of 2025 and 2026 for their laughter, conversation, and shared hope. Additionally, thank you to Hilary Chen, the Biology Teaching Assistant, who was always there for me. All data used in this project were generated by the author. The data are not publicly available. The data may be made available upon request to the author.
8. Bibliography
Alberts, B., Johnson, A., Lewis, J., Raff, M., Roberts, K., & Walter, P. (2002). General principles of cell communication. Molecular Biology of the Cell. 4th edition.
NCI Dictionary of Cancer Terms. (2025). Cancer statistics.
NCI Dictionary of Cancer Terms. (2011). Definition of metastasis.
Groenewald, W., Lund, A. H., & Gay, D. M. (2023). The Role of WNT Pathway Mutations in Cancer Development and an Overview of Therapeutic Options. Cells, 12(7), 990. https://doi.org/10.3390/cells12070990
Cancer Research UK. (2023). How does cancer start?
Cancer Research UK. (2025). How does obesity cause cancer?
Liu, J., Pan, S., et al. (2013). Targeting Wnt-driven cancer through the inhibition of Porcupine by LGK974. Proceedings of the National Academy of Sciences of the United States of America, 110(50), 20224–20229. https://doi. org/10.1073/pnas.1314239110
Liu, J., Xiao, Q., Xiao, J., et al. (2022). Wnt/β-catenin signalling: Function, biological mechanisms, and therapeutic opportunities. Signal Transduction and Targeted Therapy, 7, Article 3. https://doi.org/10.1038/ s41392-021-00762-6
Liu, Y., Qi, X., Donnelly, L., Elghobashi-Meinhardt, N., Long, T., Zhou, R. W., Sun, Y., Wang, B., & Li, X. (2022). Mechanisms and inhibition of Porcupine-mediated Wnt acylation. Nature, 607(7920), 816–822. https://doi. org/10.1038/s41586-022-04952-2
Orbeck, K. (2025). What is Cell-to-Cell Communication, and Why Does It Matter? Regenerative Medical Institute
Paul, M. A., Wainwright, C. L., Hector, E. E., Ryberg, E., Leslie, S. J., & Walsh, S. K. (2025). Short-Term Oral Administration of the Porcupine Inhibitor, Wnt-c59, Improves the Structural and Functional Features of Experimental HFpEF. Pharmacology research & perspectives, 13(1), e70054. https://doi.org/10.1002/prp2.70054
Proffitt, K. D., & Virshup, D. M. (2012). Precise regulation of porcupine activity is required for physiological Wnt signaling. The Journal of Biological Chemistry, 287(41), 34167–34178. https://doi.org/10.1074/jbc.M112.381970
Shah, K., Panchal, S., & Patel, B. (2021). Porcupine inhibitors: Novel and emerging anti-cancer therapeutics targeting the Wnt signaling pathway. Pharmacological research, 167, 105532. https://doi.org/10.1016/j. phrs.2021.105532
Shlyakhtina, Y., Moran, K. L., & Portal, M. M. (2021). Genetic and Non-Genetic Mechanisms Underlying Cancer Evolution. Cancers, 13(6), 1380. https://doi.org/10.3390/ cancers13061380
Stummer, W., Pichlmeier, U., Meinel, T., Wiestler, O. D., Zanella, F., Reulen, H. J., & ALA-Glioma Study Group (2006). Fluorescence-guided surgery with 5-aminolevulinic acid for resection of malignant glioma: a randomised controlled multicentre phase III trial. The Lancet. Oncology, 7(5), 392–401. https://doi.org/10.1016/ S1470-2045(06)70665-9
Tissot, S., Guimard, L., Meliani, J., Boutry, J., Dujon, A. M., Capp, J.-P., Tökölyi, J., Biro, P. A., Beckmann, C., Fontenille, L., Do Khoa, N., Hamede, R., Roche, B., Ujvari, B., Nedelcu, A. M., & Thomas, F. (2023). The impact of food availability on tumorigenesis is evolutionarily conserved. Scientific Reports, 13(1), 19825. https://doi.org/10.1038/s41598-02346896-1
Tuladhar, R., Yarravarapu, N., Ma, Y., Zhang, C., Herbert, J., Kim, J., Chen, C., & Lum, L. (2019). Stereoselective fatty acylation is essential for the release of lipidated WNT proteins from the acyltransferase Porcupine (PORCN). Journal of Biological Chemistry, 294(16), 6273–6282. https://doi.org/10.1074/jbc.RA118.007268
American Cancer Society. (2024). UV (Ultraviolet) Radiation and Cancer Risk.
Wen, P. Y., Weller, M., et al. (2025). Glioblastoma in adults: A Society for Neuro-Oncology (SNO) and European Society of Neuro-Oncology (EANO) consensus review on current management and future directions. Neurooncology, 27(11), 2751–2788. https://doi.org/10.1093/ neuonc/noaf177
COMPARING THE EFFECTS OF PHOSPHOLIPASE A₂ INHIBITION AND DEXAMETHASONE TREATMENT
IN THE
RECOVERY OF THE NEUROMUSCULAR JUNCTION IN BRACHIAL PLEXUS INJURY OF
PROCAMBARUS CLARKII
Manny Price
Abstract
High-trauma injuries in sports and vehicle collisions have rapidly increased in the past decade. Brachial plexus injuries (BPI) are a major disruption in neural connections, often resulting in paralysis of the upper limb and subsequently the lower limb and hand due to the disturbance in the peripheral nerve pathways. Despite advances in surgical repair, rapid functional recovery remains hindered by inflammation and axon degeneration. This study investigates whether the lipoprotein-associated phospholipase A₂ (Lp-PLA₂) inhibition with Darapladib (DP) and Dexamethasone (DEX), a corticosteroid therapy, can assist in axon regeneration and neuromuscular junction recovery following nerve injury. Procambarus clarkii were used as a regenerative model due to their accessible abdominal ganglia, neuromuscular junction physiology, and structural parallels to the human sternum. They were assigned to seven conditions: uninjured and injured controls, vehicle controls, and treatments. Their neural recovery was measured using flip-reflex times, while electrophysiological recordings measured the firing amplitude of neurons in a specific nerve root of the crayfish ganglia. Results showed that Lp-PLA₂ inhibition with DP and DEX independently improved recovery times and enhanced postinjury neural spike activity compared with controls, with DP having the greatest effect. Combined treatment barely increased neural responsiveness, suggesting that the drugs were more effective individually. These findings suggest that Lp-PLA₂ inhibition and corticosteroid therapy can accelerate nerve recovery following injury. The existing translational models for human BPIs are limited, and these data provide insight into how anti-inflammatory and neuromuscular pathways can be targeted to improve axon regeneration, neuromuscular junction activity, and behavioral recovery outcomes in peripheral nerve trauma.
1. Introduction
1.1
Brachial Plexus Injuries
The prevalence of brachial plexus injuries is an important neurological concern, as high-impact trauma events continue to increase around the world. Over 1.5-2.0 per 100,000 individuals in the United States are affected by BPI each year, with the majority aged 15–25 years age group most susceptible to vehicular and sports trauma (Breyer et al., 2021; and Dawson et al., 2023). This trend is corroborated in a review of 60,101 polytrauma cases from the Yale School of Medicine (Dawson et al., 2023), where 159 brachial plexus injuries were identified, with 82% occurring in males with a mean age of 34.6 years.
The brachial plexus (BP) is a network of nerves consisting of roots from the cervical spine (C5-T1 roots) that extend to the shoulder and upper limb regions. A brachial plexus injury involves sudden damage to the nerve network in the neck extending down into the arm and hand (Cleveland Clinic, 2024). The most common injury to the brachial plexus is a rupture, when the nerves
are torn from the surrounding shoulder and arm, leading to severe pain, little movement, and eventually paralysis.
In this study, a drop apparatus is used to induce an injury that models a brachial plexus rupture, highlighting a specific nerve root tear, and analyzed through electrophysiological and behavioral recording assays. There is a demand for targeted prevention strategies and early intervention, especially since no cost-effective rapid treatment currently exists to prevent nerve degeneration following BP rupture injuries (Muskegon Surgery Center, n.d.). This research aims to address that therapeutic gap by exploring novel pharmacological interventions to facilitate nerve regeneration.
Cervical nerve root surgery (CNRS) involves reattachment through surgery and grafting in the brachial plexus nerve roots (C5-T1), restoring motor function. CNRS is the most direct and complex approach for treating severe brachial plexus injuries when treatments have failed or surgery is deemed necessary, especially involving ruptures. Selective
nerve root injection (SNRI) is an image-guided procedure composed of steroid medication and an anesthetic that focuses on the epidural injections, injecting into the space outside the nerve root. The injection goes in hand with a fluoroscopy machine, providing X-ray images for accurate and precise placement of the needle. SNRI is currently one of the few less invasive options clinically available for severe brachial plexus injuries, particularly in cases involving nerve root avulsion (Muskegon Surgery Center, n.d.). Without surgery, pharmacological treatment may become the primary method for accelerating recovery and improving nerve regeneration.
1.3 Crayfish to Study the Brachial Plexus
Procambarus clarkii, commonly known as the crayfish, are freshwater crustaceans native to regions ranging from Louisiana to North Carolina. Crayfish have become an increasingly important model organism for regenerative and neuroscience research due to their well-established and researched nervous system, high resilience to pressure-filled environments, and ability to regenerate peripheral nerves following injury (Mengal et al., 2025; Chapman et al., 2014). The crayfish nervous system is simple and accessible, composed of a ganglia chain that controls their precise motor movements, such as swimmeret movement.
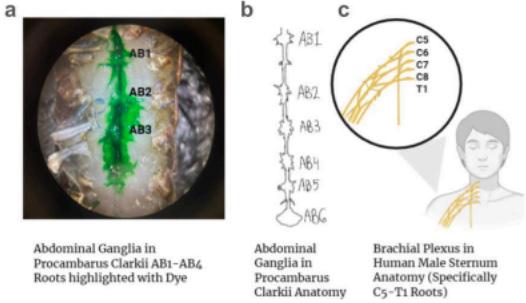
In crayfish, the way that the nerve regeneration process functions is analogous to those in mammals and peripheral nerve repair, specifically in brachial plexus injuries (Nevmerzhytska et al., 2023). The abdominal ganglia and AB1 nerve root in this case serve as an analog to the C5 nerve root in the sternum of humans, which is responsible for muscle contraction in the upper and lower limbs (Figure 1). When the AB1 nerve root is injured, the damaged nerves need a lengthy recovery process to repair synaptic connections and re-establish coordinated tail reflexes (Figure 1) (Chapman et al., 2014; Breyer et al., 2021; Nevmerzhytska et al., 2023).
Figure 1 (with 1a, 1b, and 1c). Comparative anatomy of crayfish abdominal ganglia and the human brachial plexus. Figure 1a shows abdominal ganglia (AB1–AB4) in Procambarus clarkii, with neural roots highlighted using fluorescent dye. Figure 1b presents a schematic representation of the Procambarus clarkii abdominal nerve cord and ganglia. Figure 1c illustrates the human brachial plexus anatomy at the sternum, specifically the C5–T1 spinal nerve roots. AB1 is shown as anatomically analogous to the C5 spinal nerve root. Schematic images were created using BioRender (1b, 1c), and taken by student researcher (1a), 2025.
For neuroscience research and neurodegeneration, crayfish offer advantages for experimentation: their nerve cords and ganglia are easily accessible for direct electrophysiological recordings and observation, their behavioral responses are measurable, and peripheral nerve regeneration occurs within 1-4 weeks. All of these advantages allow for an accurate and precise recording of the neuromuscular junction and neural recovery (Mengal et al., 2025).
1.4 Phospholipase A₂ Inhibition (DP) and Corticosteroid Therapy (DEX)
The injection includes a lipoprotein-associated phospholipase A₂ (Lp-PLA₂) inhibitor and a corticosteroid therapy, which targets inflammation through complementary but distinct mechanisms. Lp-PLA₂ is an enzyme that catalyzes the hydrolysis of phospholipids, generating pro-inflammatory lipid mediators that contribute to neural damage following injury.
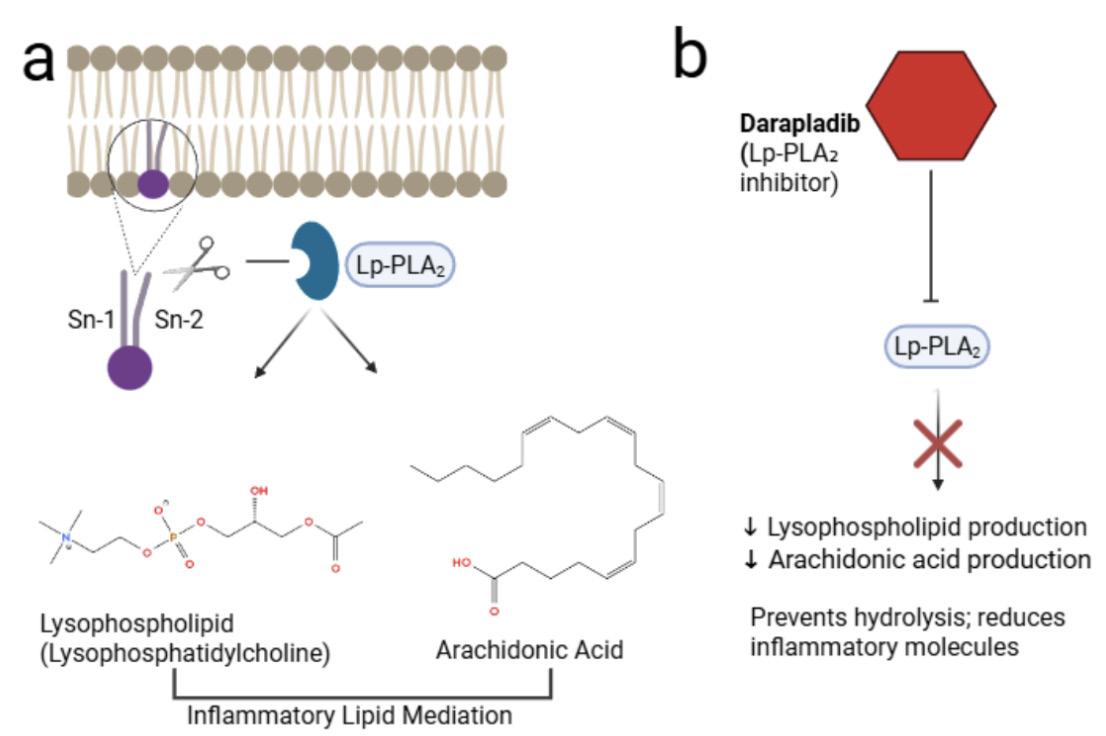
Figure 2: Mechanism of Lp-PLA2 inhibition by Darapladib. (a) Under physiological conditions, Lp-PLA2 hydrolyzes the Sn-2 fatty acid chain of membrane phospholipids, releasing arachidonic acid and lysophosphatidylcholine, both of which act as inflammatory lipid mediators. (b) Darapladib selectively inhibits Lp-PLA2, preventing lipid hydrolysis and reducing the production of these pro-inflammatory molecules, potentially offering neuroprotective benefits. Image made in Biorender and chemical makeup made on MolView by student researcher, 2025.
Under normal conditions, Lp-PLA₂ hydrolyzes the Sn-2 fatty acid chain of membrane phospholipids, releasing arachidonic acid, a fatty acid that plays a crucial role in inflammatory pathways, and lysophospholipids, phospholipids missing a fatty acid chain (Figure 2). DP selectively inhibits the Lp-PLA₂ activity, directly preventing phospholipid hydrolysis and reducing the production of these inflammatory mediators. While DP may have primarily been studied in the context of atherosclerosis, its ability to limit lipid-mediated inflammation suggests potential neuroprotective effects in nerve injury and degeneration (Cojocaru et al., 2010).
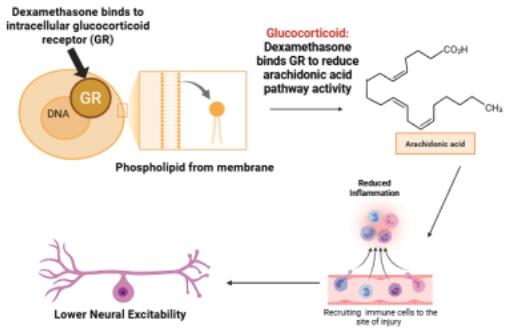
Figure 3: Dexamethasone mechanism binds to glucocorticoid receptors to suppress inflammatory signaling and reduce neural excitability. The reduced inflammatory signals flowing through and outside the cell result in lower neural excitability and show the potential neuroprotective effects in crayfish that DEX could implement with its anti-inflammatory action. Image created in Biorender and chemical makeup made on MolView by student researcher, 2025.
Dexamethasone (DEX) is a corticosteroid with potent anti-inflammatory effects. Upon entering the cell, DEX binds to the glucocorticoid receptors (GR), and the resulting complex translocates into the nucleus (Figure 3). The GR complex changes gene transcription to suppress inflammatory signaling pathways, including cytokine production and immune cell activation. Rather than directly inhibiting PLA₂ enzymatic activity, DEX acts upstream by inducing anti-inflammatory mediators such as lipocortin-1 (Annexin A1), which contributes to a general reduction in inflammatory responses. This overall suppression of inflammation leads to decreased immune cell recruitment, reduced tissue damage, and lower neural excitability, supporting its potential neuroprotective role (Figure 3)(Barnes et al., 1996).
Advancements in nerve regeneration, particularly through interventions like Lp-PLA₂ inhibition with DP and broad anti-inflammatory modulation with DEX, represent promising strategies to improve both the rate and quality of recovery. The goal of these injections is to decrease inflammation, support neuromuscular junction function, and accelerate axonal regeneration. By combining a direct enzymatic inhibitor (DP) with a general anti-inflammatory agent (DEX), this approach aims to enhance recovery outcomes through complementary mechanisms (Crisafulli et al., 2018; Nevmerzhytska et al., 2023). While studies using LpPLA₂ inhibitors and corticosteroids in model organisms have shown promise, translating these findings to human hand rehabilitation is still an area of ongoing research (Vest, 2020). This project investigates the combined use
of Lp-PLA₂ inhibition and DEX therapy in improving axon regeneration and neuromuscular function at the AB1 root in the crayfish.
1.5 Crayfish Ganglia to Study Drug Effects
The therapeutic usage of the phospholipase A₂ inhibitor DP and the corticosteroid DEX is critical in helping to accelerate nerve regeneration after the injury in the AB1 nerve root. The combination of these two therapies was hypothesized to accelerate the nerve recovery process. It does so by reducing inflammation in the swimmeret system and stabilizing the neurons inside the neuromuscular junction, allowing for a more rapid recovery time following injury. Through tracking righting reflex times, measuring spike amplitude, and logging action potential fluctuation, this study aims to compare and investigate the effects of DP and DEX in a regenerative setting in crayfish. These findings can be utilized to develop more accelerated therapeutic strategies with insights leading to treatment of human brachial plexus injuries, where the recovery of fine motor control and precise movements is challenging.
The goal is to create more effective and targeted rehabilitation strategies that restore basic hand function and address the specialized neuromuscular demands of individuals with high functional needs. This approach promises to provide new insights into improving the standard of care for BPI patients, shortening recovery times, and enhancing the quality of life for individuals suffering from hand injuries. Most brachial plexus injury research relies on mammalian models, while Lp-PLA₂ inhibition remains unexplored in invertebrates, and no current therapies achieve accelerated recovery timelines (Vest et. al, 2020).
1.6
Hypothesis
Hypothesis: If a brachial plexus injury is induced in crayfish, the righting reflex will be significantly impaired, resulting in a measurable increase in the time required for the crayfish to return to an upright position. The null hypothesis is that a mimicked brachial plexus injury in crayfish will have no significant effect on the time required for the crayfish to complete the righting reflex.
2. Methodology
2.1
Crayfish Care
Based on the observational methods described by Palillo, the study does not explicitly state that crayfish were housed individually or kept together in shared housing conditions (Palillo, 2022). As this may impact
the stress levels, a 7-day acclimation period was allowed where the crayfish were housed in small groups (small tank: 7 crayfish, large tank: 10 crayfish), male to female ratio 1:1, with crayfish to shelters to hiding structures at a ratio of 1:1:1. The crayfish were kept in environments set at 70 degrees using aquarium heaters (AquaMiracle), and the dark-light cycle was set to be controlled by the timers implemented in the lights at 8 dark hours-16 light hours every 24-hour cycle. Multicolored aquarium backgrounds were taped to the side of the tank proximate to sunlight before the fish inhabited the tanks. Aquarium tank tube lining (Imagitarium) was connected to an air pump (Tetra Whisper), which then led to a stone and circulated the water through the filters (Whisper) and allowed for a steady current, mimicking a freshwater ecosystem. Animals were fed crustacean pellets (Invert Aquatics) daily at 1:30 PM. Six 20-gallon tanks were tested for levels of ammonia (0ppm), pH level (7.0), hardness (moderate), nitrate (0ppm), and nitrite (0ppm) levels for 5 consecutive days before inhabiting. The tanks were set up with 10 cm of multicolored aquarium rocks (GloFish), with black nursery flower pots set up as shelters and hiding spots, and Elodea, an aquatic plant, as a consumption source. These tanks were filled with spring water and dechlorinated tap water at a ratio of 6:1 gallons, as well as a treated water mix that sat for 24 hours with the water dechlorinator jump start (Prime Conditioner), and filled to 14 cm below the top of the tank. Duct taping plastic nursery flower pots and containers were added to any open areas to make sure the habitat was secure.
2.2 Drop Assay
The drop assay was constructed to deliver a consistent targeted impact to the abdominal ganglia in the crayfish.
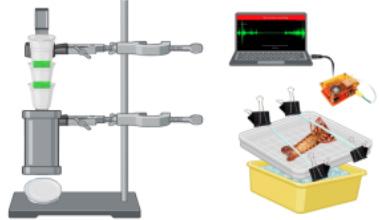
This assay utilized a vertical guide rail (chemical lab stand) to serve as the structural support and foundation for this contraption. To create the chute, plastic cups were cut and secured to the rail using modeling clay to form a funnel or path for the weight to fall through. A 9-centimeter hole, measured from the diameter of the circular weight, was made with a 20-inch, metal-saw-cut PVC pipe, to ensure that the weight traveled in a single direction. A small latch was used to release the weight to ensure control, and a Vernier force sensor was placed directly beneath the molds to give force readings and make sure that the force of the weight was the exact same each time that the weight dropped.
This entire setup of the drop contraption was aligned to directly impact the abdominal ganglia, specifically the abdominal ganglia nerve root 1 (AB1). This was done through a silicone mold mix (LET’s RESIN), that was made by mixing different silicone rubbers together, to be poured into a glass petri dish containing the crayfish.
These were molded to the dorsal and ventral sides of deceased crayfish (of 1 day). Then, they were set into the refrigerator for 24 hours to allow the rubber to set into its shape. There were three different sizes of crayfish placed into the mix to allow for variety in size. The molds were cut in half horizontally and separated. These molds were designed to expose the abdominal region while simultaneously containing the anesthetized crayfish.
To minimize movement, the crayfish were placed into plastic containers with 2-inch holes poked in the lids to maintain steady airflow. The containers were then submerged in ice baths for approximately 15 minutes. This amount of time was chosen because it induces anesthesia, and crayfish do not become hyperactive or over-exposed to the anesthetic (Seichter et al., 2014).
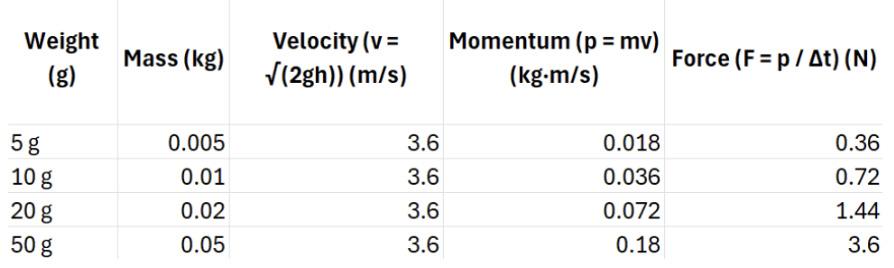
Following the anesthetization, the crayfish was positioned carefully beneath the drop assay in the silicone molds, ensuring that the abdominal region was exposed, and the AB1 nerve root was directly aligned with the trajectory of the PVC pipe. The weight of 20-grams was chosen because during trials, the 5 and 10-gram weights did not produce a tail-bending response, whereas the 20gram weight generated a sufficient non-lethal force from the sensor to activate a neural response of tail-bending, without causing fatality or permanent nerve damage. The weight was released from a height of 26 inches (from the highest cup to the force sensor), traveled through the PVC pipe, and struck the nerve root and swimmerets in the abdominal region (Figure 4).
Figure 4: Drop assay results showing the momentum and impact force of objects of varying mass. Velocity (v) was calculated using v=sqrt(2gh), momentum (p) as p=mv, and force (F) as F=p/Δt. Data collected and generated by student researcher using Excel, 2025.
After the weight drop, the crayfish was carefully removed from the molds and placed in a securing plate (Fig. 5). This was made up of a dissection tray, a tube lining, and chip clips, with two parallel tube linings running across the tray to hold the crayfish down, adjusted by the clips on both sides of the tray.
Figure 5: 1) Drop assay 2) Securing plate for neural recording 3) Action potential recordings and Spikerbox setup, image created in Biorender, made by student researcher.
2.3 Action Potential Recording Protocol
After the crayfish are carefully contained on the iced dissection tray held down by the tube linings, a compound microscope is used to identify the AB1 (nerve root 1) in the abdominal ganglia of the crayfish. After identification, a livestock green marker (Stoelting) is used to label the place where the electrode will be inserted to measure action potentials.
A completely soldered Neuron SpikerBox (Backyard Brains) was used to track action potential recordings with the red cord (electrode lead), which connects the SpikerBox to the AB1 nerve root. All three electrodes in the Neuron Spikerbox had specific positions for each neural recording assay. The red positive electrode was placed in the AB1 nerve root in the nerve fiber where spikes travel. The white reference electrode was placed in the saline near the ganglion. The black electrical ground electrode was placed in the dissection tray to stabilize and remove the 60Hz noise (Backyard Brains).
To record 30 seconds of neural activity, or action potentials, a software visual Spike Recorder (Backyard Brains Spike Recorder) is used. Following these 30 seconds, the crayfish is then either injected with a drug or baseline treatment, or not treated at all, with the injection group being placed into a second round of recordings measuring neural activity before and after injection.
Action potential amplitude was quantified as a measure of neuronal excitability, reflecting the intensity of electrical signaling along the AB1 nerve root. Changes in amplitude were interpreted as alterations in firing strength rather than changes in nerve structure or regenerative status. Reduced amplitude was therefore considered indicative of suppressed excitability, which may correspond to reduced inflammatory signaling following injury.
2.4 Drug Development
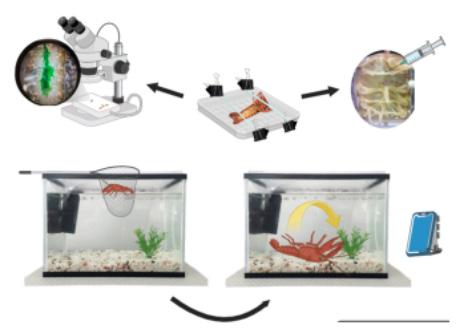
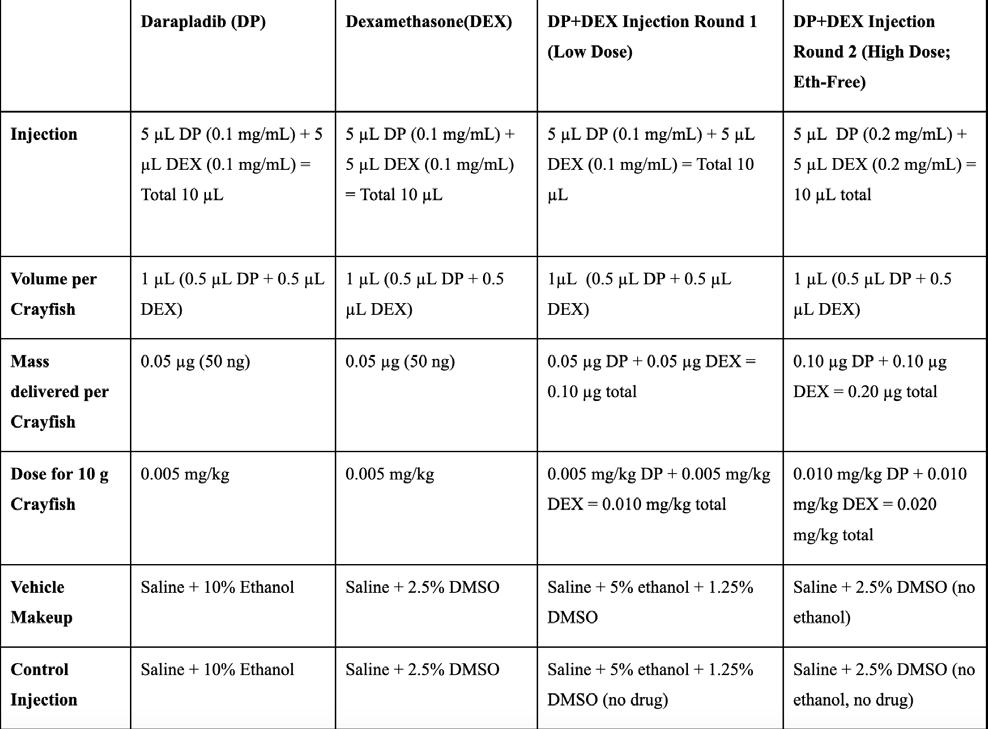
DP and DEX were administered through an injection in the abdominal ganglia at doses (Figure 6). Each crayfish received a 1µL injection targeting the AB1 nerve root, delivering 0.005-0.02 mg/kg depending on the treatment group. Vehicle-matched saline, ethanol, and DMSO controls were used for all drug formulations.
Figure 6: Injections protocol (top) and righting reflex assay visuals (bottom) Image created in Biorender, made by student researcher, 2025.
To standardize drug delivery and minimize protocolrelated deaths, a constant injection volume of 1 µL per crayfish was used for all treatment and control groups. Pilot testing with larger injection volumes resulted in increased mortality and caused different physiological responses, including prolonged immobility and loss of righting behavior, indicating volume-related stress independent of drug effects. Injection volume was then held constant across all groups to ensure that observed differences in behavioral and electrophysiological outcomes reflected the drug intervention effects rather than injection-related confounding variables. All drugs were prepared as concentrated stock solutions and diluted into vehicle solutions to achieve the desired mass per injection while maintaining the 1 µL injection volume. Vehicle-matched controls (saline with ethanol and/or DMSO) were used for any effects of pure drug exposure. An initial combined DP+DEX preparation (Injection Round 1) used lower stock concentrations but did not produce sufficiently robust changes in righting reflex assay times.
A second combined preparation (Injection Round 2) was performed using higher stock concentrations after the initial low-dose preparation failed to produce sufficiently robust righting reflex changes, allowing increased effective dosing while maintaining a constant injection volume.
For the second preparation of the combined treatments, there were 0.010 mg/kg of DP and 0.010 mg/kg of DEX in the new combined injection, due to the needed increase in drug concentration to result in a higher or lower corresponding Righting Reflex Assay time (Fig. 7).
Figure 7: Table depicts all information regarding injection concentration and dilution amounts from the injection protocol after the drop assay in between electrophysiological recordings and before the righting reflex assay. Table made by student researcher, 2025.
2.5 Righting Reflex Assay (RRA)
Based on Teng (2024), a tank for the assay was set up and constructed with a 14-inch water level below the top of the tank, lined with 10 centimeters of aquarium rocks at the bottom of the tank, with a water treatment timeline of 24 hours, and acclimated for 7 days prior to the crayfish inhabiting the water. The setup of the tank included an air pump, air stone, and filter (Tetra Whisper), as well as a cut-off PVC pipe with a larger diameter to serve as hiding places and black nursery flower pots for social isolation. In the center of the tank, there was a level surface of aquarium rock and a wide enough space for the assay to take place.
After the action potentials are recorded, the crayfish is carefully transported to a fishnet (FishLab, Figure 6), where the bottom of the net is placed into the water for 30 seconds to give time for the crayfish to re-acclimate before using a set of metal tongs (Hiash) to flip the crayfish from dorsal side up to ventral side up on the
floor of the aquarium tank. On the outside of the tank, there is a phone directly placed in front of the center of the tank, allowing the assay to be recorded. Modeling clay (Crayola) is used to hold the phone in place, which records for 30 seconds in which the crayfish re-acclimates and finally captures the amount of time the assay takes (Figure 6).
Once the crayfish is placed ventral side up, the tongs are released, and a video camera tracks the time for the crayfish to initiate coordinated swimmeret activity and successfully right itself from ventral to dorsal orientation. The timer is stopped when the animal has completed its maneuver and swims away from the point of origin in the tank (Figure 6).
The timing of the righting reflex assay will be conducted in two phases: the Early Phase is done 3 minutes after testing, and the Middle Phase, where the RRA tracks the enhanced swimming coordination after 72 hours, to track if the recovery time has improved. The same conditions and steps for anesthesia are taken between phases.
2.7 Statistical Analysis
Normality of distribution and homogeneity of variances were assessed using the Shapiro–Wilk test and Levene’s test, respectively. When data did not meet assumptions of normality, non-parametric analyses were applied. A Kruskal–Wallis + Dunn’s test with Bonferroni correction was used to identify specific differences between treatments. For pre- and post-injury comparisons within the same individuals, paired t-tests were used when data were normally distributed, and Wilcoxon signed-rank tests were used for non-normal data. Outliers were identified using the interquartile range (IQR) method and verified through residual inspection. All statistical analyses were conducted using RStudio. Data were reported as mean ± standard deviation (SD), and statistical significance was set at p < 0.05 (*).
3. Results
3.1 Drop Assay
Dropping progressively heavier weights from a fixed height resulted in a proportional increase in calculated impact force upon collision (Figure 4). This trend aligns with the momentum relationship (F = m Δv / Δt), where increasing mass directly increases force when velocity and contact time are constant. The 50 g weight produced was ten times larger than the impact force of the 5 g weight, consistent with the expected linear scaling of force with mass. Because drop height was held constant, impact velocity remained constant across trials, resulting in linear scaling of momentum and calculated force with
object mass. This relationship validated the drop assay as a reliable method for standardizing mechanical injury input with object mass.
3.2 Electrophysiological Recordings
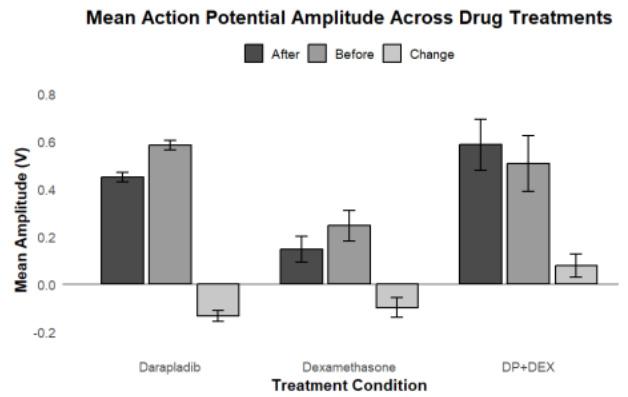
Darapladib significantly reduced mean action potential amplitude (−0.133 V), showing the strongest inhibitory effect on neural firing (Figure 8). DEX caused a smaller, non-significant decrease (−0.098 V), consistent with its anti-inflammatory action. The combined DP+DEX (high dose) treatment signaled for a mild, non-significant increase (+0.079 V), indicating a partial counteraction between the drugs.
The baseline (“Before”) recordings were collected post-injury and after stabilizing in the action potential recording setup but before any drug injection. Following the drug administration and a standardized postinjection period, recordings were repeated from the same preparation (“After”). Mean action potential amplitude was calculated through the Backyard Brains software for each condition, and the change was determined as the difference between post treatment and baseline values for each individual.
Figure 8: Mean action potential amplitude across drug treatments. Mean amplitude before treatment (light grey), after treatment (medium grey), and change in amplitude (dark grey) in DP (n = 11), DEX (n = 11), and DP+DEX (n = 11) treatments. Error bars = ±SEM. Line at y = 0 signifies no change. Positive values indicate increased amplitude; negative values indicate decreased amplitude. Normality using Shapiro–Wilk tests. Paired t-tests showed significant decrease for DP (t(11) = −5.714, p = 0.0293), while DEX (t(11) = −2.322, p = 0.0809) and DP+DEX (t(11) = 1.626, p = 0.1426) not significant. Data analyzed by student researcher, graphs performed in RStudio, 2025.
3.3 Righting Reflex Assay
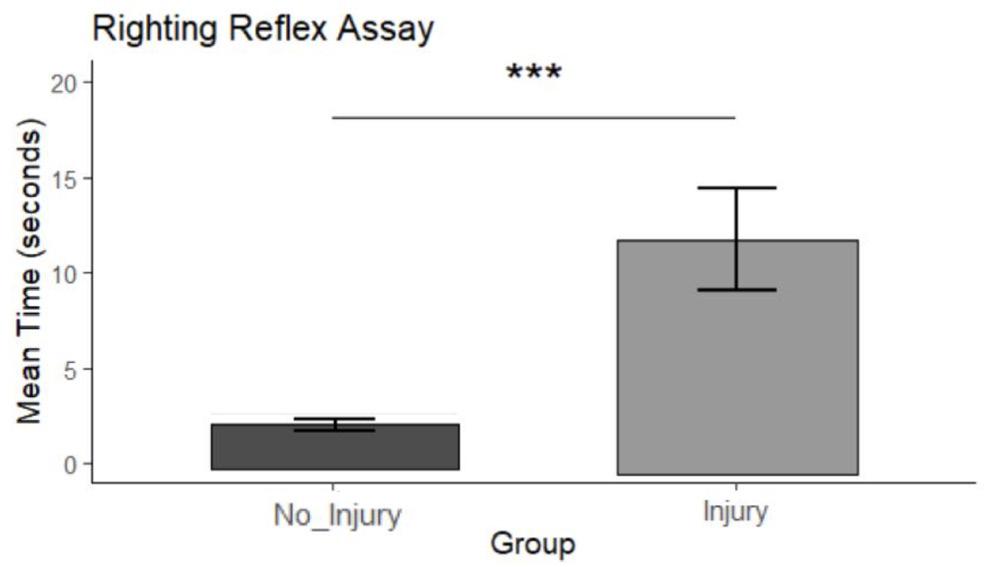
The righting reflex assay showed that crayfish in the Injury group took significantly longer to complete the reflex compared to the No_Injury group (24.00 ± 11.23 s vs. 14.70 ± 10.53 s, t(9) = 6.18, p = 0.0002, ***). This result confirms that the injury effectively impaired motor coordination and neural response time, validating the injury model for subsequent drug testing (Fig. 9).
Figure 9: Early Phase. The righting reflex assay showed that crayfish in the Injury group took significantly longer to complete the reflex compared to the No_ Injury group (24.00 ± 11.23 s vs. 14.70 ± 10.53 s, t(9) = 6.18, p = 0.0002, ***). Graph made in RStudio by student researcher, 2025.
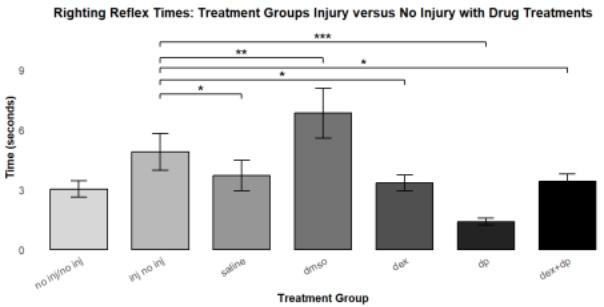
After establishing the injury effect, seven treatment conditions were compared, including Injury no Injection, Saline, DMSO, DEX, DP, and DP+DEX. A Kruskal–Wallis test revealed a significant overall difference among treatments (χ2 = 29.456, df = 6, p = 4.99×10-⁵). Post-hoc pairwise Wilcoxon tests showed that DP-treated crayfish had significantly faster righting times compared to Injury no Injection (p = 0.0007, ***), indicating strong restorative effects on neural function. Other treatments showed partial or non-significant recovery (Fig. 10).
Figure 10: Late Phase. A Kruskal–Wallis test revealed a significant overall difference among treatments (χ2 = 29.456, df = 6, p = 4.99×10-⁵). Post-hoc pairwise Wilcoxon tests showed that DP-treated crayfish had significantly faster righting times compared to Injury no Injection (p = 0.0007, ***), indicating strong restorative effects on neural function. Other treatments showed partial or non-significant recovery. Graph made in RStudio by student researcher, 2025.
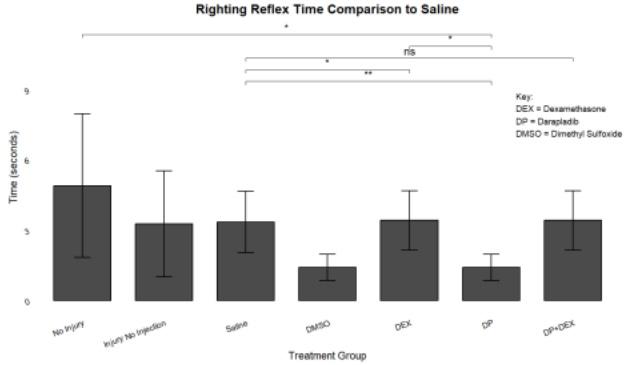
Figure 11: Late Phase. Righting reflex assay time comparison to saline injection. Kruskal–Wallis test revealed a significant overall difference among treatments (χ² = 29.456, df = 6, p = 4.99×10-⁵). Post-hoc pairwise Wilcoxon tests using Bonferroni correction showed that Darapladib-treated crayfish (DP) compared to Saline (p = 0.002, **). DEX treatment compared to Saline (p = 0.076), combined DP+DEX (p = 0.004, **). DP and DEX difference (p = 0.018, *). Between No Injury & DP (p = 0.44). Mean righting reflex times (±SD) are shown with error bars representing ±1 standard deviation. Asterisks denote levels of significance (p < 0.05 = *, p < 0.01 = **, p < 0.001 = ***). Graph made in RStudio by student researcher, 2025.
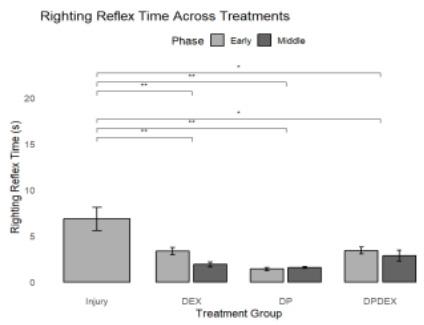
The time-course analysis of righting reflex performance in the Early and Middle phases revealed that both DEX and DP independently improved recovery compared to Injury no Injection (p < 0.01), while DP + DEX failed to enhance performance in the early phase (p ≈ 0.054). By the middle phase (72 h post-injury), all treatments produced significant recovery relative to the untreated injury control, and differences between drug groups were no longer significant (Fig. 12).
Figure 12: Righting reflex time across early and middle phases compared to baseline. Graph made in RStudio by student researcher, 2025.
4. Discussion
The weight-drop injury to peripheral nerves was measured using the weight-drop apparatus (Figure 4, Figure 5). The results showed that as the weight increased, the momentum and impact force increased proportionally with weight, and showed that the heaviest weight brought the greatest mechanical stress to the nerve and surrounding tissue, which mimicked the rupture injury condition. The 20-gram weight was selected based on force sensor measurements, and the resulting injury was localized and did not affect other parts of the crayfish. This weight produced moderate, reproducible injuries sufficient to translate to impacted neuronal responses. The impact velocity remained constant (close to 3.6 m/s), which kept mass as the primary factor of the severity of the injury. This established a reproducible injury model for evaluating pharmacological interventions (Figure 7).
Neuronal activity in the neuromuscular junction was measured using Spikerbox recordings (Figure 8). DP, DEX, and combined DP+DEX treatments produced distinct changes in action potential amplitude relative to baseline, reflecting differences in neuronal firing intensity. Importantly, these measurements do not directly assess nerve regeneration; rather, they analyze reductions in action potential amplitude, which indicate suppressed neuronal excitability, which was hypothesized to correspond to reduced inflammatory signaling at the injury site. These results reveal that DP accelerates nerve regeneration the quickest, DEX provides slight to moderate suppression, and combination therapy balances and keeps the normal excitability for these neurons to regenerate (Figure 8). This suggests that modulation of neuronal activity may contribute to an environment supporting recovery by limiting inflammation (Figure 8).
Functional recovery was assessed via righting reflex
(Figures 9-12). Simulated nerve trauma delayed righting reflex performance, confirming the effective injury induction (Figure 9). DP was noted to restore function the most efficiently, producing significantly faster responses than untreated injury and other drug injections (p < 0.01) (Figure 10). DP also had significantly faster righting times compared to saline (p=0.002), indicating enhanced neural recovery. (Figure 11) From these results, it is inferred that DP facilitates the pathway associated with preserving axonal membrane and reducing oxidative stress, which enables faster neural recovery after injury. DEX exhibited moderate benefit, while the combined treatment DP+DEX (high dose) did not show rapid effects; in early recovery phases, it may have temporarily disrupted DP’s neuroprotective action (Figure 12). It is effective in reducing inflammation, but it acts on just the corticosteroid receptors and does not focus on the lipidmediated neural degradation (Crisafulli, 2018). By the 72-hour (Middle) phase, all drug-treated groups showed comparable functional recovery, suggesting that initial drug injections primarily accelerate early recovery rather than changing the outcomes (Figure 12).
These results suggest that DP accelerates nerve regeneration and supports early-stage recovery following brachial plexus and peripheral nerve injuries (Figure 12). Since DP focuses on conserved lipid-signaling pathways involved in neuroinflammation and membrane repair, the results suggest potential applications in higherorder vertebrates, where there are similar nerve injury mechanisms with similar regeneration patterns (Vest et al., 2020; Nevmerzhytska et al., 2023). Overall, these results highlight the crayfish as a valuable model for exploring drug interventions in neural trauma and recovery. This work not only proposes DP as a viable candidate for accelerating peripheral nerve repair but also establishes Procambarus clarkii as an accessible bridge between invertebrate regeneration and mammalian neurorehabilitation. The model’s simplicity and reproducibility could democratize preclinical neurotrauma research in resource-limited settings.
5. Future Directions
In future studies, quantification of specific enzymes and pathways within the neuromuscular junction may gather further evidence supporting how DP accelerates the recovery time from a mimicked brachial plexus injury. Measuring phospholipase Lp-PLA₂ activity and inflammatory cytokine levels could help identify the biochemical pathways underlying DP’s effects on nerve regeneration. Also, further trials could provide a better confirmation of improved recovery, and trials with other anti-inflammatory agents could help evaluate potential
outcomes confirming axonal repair and synaptic function. Ultimately, expanding this model to other mammalian studies could translate potential and advance DP as an even more reliable treatment for brachial plexus injuries.
6. Conclusion
This study provides promising evidence for peripheral nerve injury research seeking reproducible models, unclear mechanisms of early neuroprotection, and inconsistent outcomes with pharmacological interventions (Nagano, 1998). Several key outcomes of this research support previous neurophysiology findings, yet also open the door to new insights into drug interactions at the neuromuscular junction (Crisafulli, 2018). To our knowledge, this study is the first of its kind to directly compare DP, DEX, and their combined effect (high dose) on both electrophysiological activity and functional recovery following controlled brachial plexus–type injury. This study takes a novel approach to combine weight-drop, neural amplitude, and righting reflex data into a network in an under-researched organism. This data shows how early drug intervention, specifically Darapladib, can accelerate recovery without any dramatic negative effects. It contributes to the fields of neurophysiology, electrophysiology, neuropharmacology, and regenerative medicine. Overall, the study highlights the continued investigation and comparison of targeted early-phase interventions for nerve injuries to inform clinical strategists in improving patient outcomes globally.
7. Acknowledgements and Data Availability
Funding for this research was provided by the NCSSM Foundation, the Burroughs Wellcome Fund, and GlaxoSmithKline. I extend heartfelt thanks to Mrs. Vanessa Gonzalez for inspiring this work; I hope my research contributes to improving the lives of individuals recovering from brachial plexus injuries.
This work is dedicated to my late grandmother, Virginia, who has always been my #1 supporter and has encouraged me to chase discovery. I miss your unconditional love and guidance deeply. Special thanks to Dr. Kimberly Monahan for her mentorship, time, and generosity, and to Dr. Heather Mallory, Dr. Erin Quinlan, Dr. Lauren Wagner, Mrs. Shalane Hairston, Dr. Michael Falvo, and Mr. Antonio Lopez for their invaluable support. I also thank the NCSSM Research in Biology Program and my classmates for their collaboration and encouragement. For their constant inspiration and advice, I acknowledge Dr. William Nessly, Mr. Ryan Severance, Mrs. Michele Fudge, Dr. Christine Belledin, Dr. Ashley Loftis, and Dr. Adalynn Harris. Finally, to all
multi-sport athletes, musicians, and active individuals: care for your body, and never let an injury stop you from doing what you love.
8. Citations
Barnes, J. P. (1996). Mechanisms of action of glucocorticoids in asthma. American Journal of Respiratory and Critical Care Medicine, 154(2), S21–S27. https://doi.org/10.1164/ ajrccm/154.2_Pt_2.S21
Breyer, J. M., Vergara, P., & Perez, A. (2021). Epidemiology of adult brachial plexus injuries. In A. Y. Shin & N. Pulos (Eds.), Operative brachial plexus surgery (pp. 63-68). Springer. https://doi.org/10.1007/978-3-030-69517-0_5
Chapman, A. R., Fujisawa, T., Lee, K. K., Andrews, J. P., Anand, A., Sandeman, D., Ferry, A. V., Stewart, S., Marshall, L., Strachan, F. E., Gray, A., Newby, D. E., Shah, A. S. V., & Mills, N. L. (2019). Novel high-sensitivity cardiac troponin I assay in patients with suspected acute coronary syndrome. Heart, 105, 616-622. https://doi. org/10.1136/heartjnl-2018-314093
Cleveland Clinic. (2024, October 16). Brachial plexus injury.
Cojocaru, M., Cojocaru, I. M., & Silosi, I. (2010). Lipoprotein-associated phospholipase A2 as a predictive biomarker of sub-clinical inflammation in cardiovascular diseases. Maedica, 5(1), 51.
Crisafulli, U., Xavier, A. M., dos Santos, F. B., Cambiaghi, T. D., Chang, S. Y., Porcionatto, M., Castilho, B. A., Malnic, B., & Glezer, I. (2018). Topical dexamethasone administration impairs protein synthesis and neuronal regeneration in the olfactory epithelium. Frontiers in Molecular Neuroscience, 11. https://doi.org/10.3389/ fnmol.2018.00050
Dawson, S. E., Gross, J. N., Berns, J. M., Weinzerl, T., Adkinson, J. M., & Borschel, G. H. (2023). Supraclavicular approach to the brachial plexus. Plastic and Reconstructive Surgery. Global open, 11(1), e4771.
Mengal, K., Kor, G., Kozak, P., & Niksirat, H. (2025). Higher levels of limb loss and temperature accelerate limb regeneration in marbled crayfish (Procambarus virginalis). Acta Zoologica. https://doi.org/10.1111/ azo.70015
Muskegon Surgery Center. (n.d.). Patient education: Spinal injections (SNRI).
Nagano, A. (1998). Treatment of brachial plexus injury. Journal of Orthopaedic Science, 3(1), 71-80. https://doi. org/10.1007/s007760050024
Nevmerzhytska, N. M., Yaremenko, L. M., & Grabovyi, O. M. (2023). Review of fundamental and modern concepts of peripheral nerve regeneration. Neurophysiology, 55, 1-7. https://doi.org/10.1007/s11062-025-09955-z
Palillo, J. A., Mollenkopf, D., Marsh, A. E., Wittum, T. E., James, J. P. B., Reichley, S. R., Ghosh, S., Palillo, M. B. & Malbrue, R. (2022). Detection of zoonotic bacteria and Paragonimus kellicotti in red swamp crayfish (Procambarus clarkii) and the assessment of traditional crayfish boils. Journal of Food Protection, 85(10), 1388-1396. https://doi. org/10.4315/jfp-22-035
Seichter, H. A., Blumenthal, F., & SmarandacheWellmann, C. R. (2014). The swimmeret system of crayfish: a practical guide for the dissection of the nerve cord and extracellular recordings of the motor pattern. Journal of Visualized Experiments, 93, e52109. https:// doi.org/10.3791/52109
Teng, M. Z., Merenick, D., Jessel, A., Ganshorn, H., & Pang, D. S. J. (2024). Consistency in reporting of loss of righting reflex for assessment of general anesthesia in rats and mice: A systematic review. Comparative Medicine, 74(1), 12-18. https://doi.org/10.30802/AALAS-CM-23-000063
Vest, M., Guida, A., Colombini, C., Cordes, K., Pena, D., Maki, M., Briones, M., Antonio, S., Hollifield, C., Tian, E., James, L., Borashan, C., Woodson, J., Rovig, J., Shihadeh, H., Karabachev, A., Brosious, J., & Pistorio, A. (2020). Closing the gap between mammalian and invertebrate peripheral nerve injury: Protocol for a novel nerve repair. JMIR Research Protocols, 9(8), e18706. https://doi. org/10.2196/18706
INVESTIGATING THE EFFECTS OF RAPAMYCIN AND ABSCISIC ACID TO IMPROVE DESICCATION RESISTANCE IN SPHAGNUM CAROLINIANUM
Jiya Zaveri
Abstract
As climate change accelerates drought and environmental decline, restoring damaged ecosystems has become increasingly urgent. Drawing inspiration from Syntrichia caninervis and tardigrades, both established desiccationtolerant organisms, this project investigates whether Sphagnum carolinianum, a North Carolina native and desiccationintolerant moss, can be strengthened against dehydration by adapting extremophile survival strategies. In S. caninervis, autophagy enables survival under desiccation by recycling damaged cellular components and maintaining energy balance, while in tardigrades, the sugar trehalose stabilizes proteins and membranes during extreme water loss. To activate these protective pathways, S. carolinianum samples were treated with rapamycin (which induces autophagy) and abscisic acid (which promotes trehalose production). Water loss, pigmentation and ion leakage were measured during desiccation to assess the effects of the treatment. Both rapamycin and ABA treatments reduced water loss compared to controls. ABA treatment reduced pigmentation loss, and both treatments showed trends toward lower ion leakage. Subsequent trehalose quantification revealed significantly higher trehalose levels in ABA-treated samples. These findings suggest that activating autophagy and trehalose-related pathways can enhance drought tolerance in mosses. Strengthening S. carolinianum against desiccation holds promise for ecosystem restoration, water-efficient agriculture, and understanding how extremophile defense mechanisms can be adapted in less resilient species.
1. Introduction
1.1 Water Scarcity
The global water crisis is one of humanity’s most significant resource shortages. Almost 4 billion people experience water scarcity for more than one month per year, and by 2050, this number is expected to exceed 5 billion (Cusick & E&E News, 2022; Mekonnen & Hoekstra, 2016). Only approximately 3 percent of the world’s water is freshwater, with more than two-thirds of that stored in glaciers and ice caps, leaving less than 1 percent readily available for human use (UN-Water, n.d.).
The profound social implications of the water crisis must also be considered. Seemingly temporary water shortages have already had lasting effects in areas such as Cape Town, South Africa; the Aral Sea Basin in Uzbekistan; and the ongoing water shortage in this author’s hometown of Bangalore, India, where overuse of groundwater and lakes leaves Bangalore at real risk for long-term scarcity (World Green Building Council, 2023).
1.2 Deforestation and Desertification
Every year, we lose 10 million hectares of forest to deforestation (Butler, 2024). As a result, desertification, in which fertile land becomes increasingly unproductive, has followed a similar trend. An estimated 24 billion tons of fertile soil are lost
to desertification each year, which is 35 times faster than it was before the late 20th century (Food and Agriculture Organization, 2019; Kuzma, 2023).
Even when land does not become a full desert, it can still suffer severe degradation. Soil that is left bare, without any plant cover, is easily eroded by wind and rain. Losing the top layer of soil reduces fertility, making it harder for the land to hold water, limiting crop growth, and directly affecting human survival and food security by damaging ecosystems (Food and Agriculture Organization, 2019; UN-Water, n.d.).
1.3 Mosses and their Significance in Ecological Restoration
Mosses are among the few species that can thrive under extreme environmental conditions. As pioneer species, they are instrumental to ecosystem restoration. Studies have shown that mosses can help restore degraded land by forming dense mats that act like sponges. These mats increase soil infiltration and reduce surface runoff, particularly in rocky and desertified regions, by absorbing water and nutrients and preventing erosion (Tu et al., 2022). With the ability to retain up to 20 times their dry weight in water, they function as microreservoirs, holding water in place of soil, helping reduce erosion across environments (Weston et al., 2015; Tu et al., 2022).
1.4 Sphagnum carolinianum
Sphagnum mosses are typically desiccation-intolerant, so they inhabit wetland ecosystems and bog areas as a result of this trait (Hájek & Vicherová, 2014). Sphagnum is a keystone genus, regulating water levels and global carbon cycles, which makes it crucial to support selfsustaining ecosystems (Rydin & Jeglum, 2013). S. carolinianum was established as a model for desiccation tolerance research and was used to study treatments aimed at improving desiccation resistance due to its intolerance, its locality, and the presence of some of the same drought-response pathways as previously studied in other plants, like abscisic acid (ABA) signaling and trehalose metabolism (Silva et al., 2021). Establishing it as a model species opens new directions for studying drought resistance in desiccation-intolerant species.
The moss was treated with two drugs: rapamycin, known to increase autophagy, and abscisic acid, known to increase trehalose production (Nibau et al., 2022). This study seeks to exploit these pathways by applying ABA and rapamycin externally to improve desiccation tolerance in S. carolinianum.
1.5 Autophagy
This study aims to enhance drought resistance in S. carolinianum by targeting the cellular process of autophagy. This process, “self-eating”, serves as a protective mechanism for cells, recycling cellular materials to sustain energy and viability during drought stress (Mugume et al., 2020; Cao et al., 2023; Silva et al., 2021). It is amplified when the organism faces stress such as drought.
Autophagy has been studied in Syntrichia caninervis, a desert moss known to survive in extreme arid environments. Silencing autophagy-related genes (ATG genes) during desiccation resulted in much lower survival in the moss (Cao et al., 2023; Silva et al., 2021). During rehydration, high autophagic activity was observed, suggesting that this process plays a role in helping the moss recover and survive periods of drought. Although the presence of this pathway is not confirmed in S. carolinianum, manipulating autophagy has been shown to alter stress responses, growth and development in other mosses (Mugume et al., 2020). This study aims to increase ATG gene expression and improve the moss’s ability to survive water loss via rapamycin treatment (Mugume et al., 2020).
1.6 Trehalose Production
Trehalose is a sugar that can form a glass-like layer around cells, held together by hydrogen bonds. This layer
helps protect cells from drying out or freezing (Tapia & Koshland, 2014). Trehalose is found in tardigrades, yeast, and resurrection plants (plants that can survive losing almost all their water and then recover). In all of these cases, trehalose helps the organism survive water stress. Although the trehalose pathway has not been confirmed in S. carolinianum, it has been found in mosses of close relation.
ABA is a plant hormone that encourages trehalose production and influences stomatal closure to increase tolerance to drying. Previous work has shown that applying ABA externally can boost trehalose in rice plants (Zhu et al., 2022). This study is attempting to do the same in S. carolinianum.
1.7
Hypothesis
This study hypothesizes that treating S. carolinianum with rapamycin to trigger autophagy and with ABA to boost trehalose production will help its drought tolerance. Specifically, the treatments are expected to reduce water loss, pigment loss, and cell damage as measured by ion leakage; improve recovery after dehydration; and increase trehalose production. The null hypothesis is that these treatments will not make a noticeable difference in survivability or trehalose production.
2. Methods
2.1 Plant Growth
Locally collected S. carolinianum moss clumps were provided by Carolina Biological and soaked and rinsed in 2 to 2.5 L of spring water in a metal tray for 10 minutes to remove dirt and contaminants. After cleaning, shoots were either placed in petri dishes (1 g per dish) for pretreatment or in small plastic containers for continued growth. Moss was watered with 10 ml/g of spring water every day and grown at room temperature, with access to direct sunlight (Silva et al., 2021).
2.2
Treatment Application
Moss samples grew for 11 days before treatment was applied. A 1 mM stock solution of rapamycin (AdipoGen) was prepared in dimethyl sulfoxide (DMSO). For treatments, the stock was diluted to a final concentration of 1 μM in deionized water (Mugume et al., 2020; Tolosa et al., 2023). Similarly, a 100 mM stock solution of abscisic acid (Thermo Fisher) was prepared in DMSO and diluted to 100 μM in deionized water (Nibau et al., 2022; Zhu et al., 2022). Across 4 groups, 10 mL of treatment per gram of S. carolinianum was applied for 24 hours (n = 5): moss treated with (1) rapamycin, (2) ABA, (3) DMSO,
and (4) double-distilled water (ddH2O). After 31 days of growth, treatment was applied to new samples across 3 groups (n = 10): (1) ABA, (2) DMSO, and (3) ddH2 O for the colorimetric assay. After treatment application, S. carolinianum shoots were desiccated using the air-dry method (Silva et al., 2021).
2.3 Water Loss and Pigmentation Measurement
S. carolinianum samples were blotted and weighed before desiccation, and then again at 2h, 4h, 6h, and 24 h during drying. After rehydration with 10 mL of water per sample, they were weighed at the same time points. Water loss was quantified using a percent change formula (Equation 1). Green pigmentation was quantified using ImageJ analysis, with results normalized and expressed as a percent change (Equation 2). Samples were photographed before desiccation and after rehydration at 0h, 2h, 4h, 6h, and 24h to document changes in pigmentation over time.
Equation 1: Formula used to calculate water loss: Water loss was calculated as the percent change from the initial weight at time 0 h, where W0h represents the weight at time 0 h and Wt represents the weight at each desiccation or rehydration time point. (Silva et al., 2021). Image created by student researcher, 2025.
water (S0), vortexed for 15 minutes, and conductivity was measured using a Vernier conductivity probe and LoggerPro software (S1). The samples were then boiled for 15 minutes and vortexed at room temperature for 20 minutes to lyse the cells, after which conductivity was measured again (S2) (Hatsugai et al., 2018; Cao et al., 2024). Ion leakage was calculated using an ion leakage formula (Hatsugai et al., 2018; Cao et al., 2024).
2.5 Anthrone Color Assay
Sugar content was measured at 24 h and 48 h using the anthrone colorimetric assay (Van Handel, 1985). To create the sugar fraction for each sample, 100 mg of tissue was frozen at –26 °C for 10 minutes, then homogenized with glass beads in 0.6 mL of sodium sulfate for 10 minutes. Following homogenization, 1 mL of cold methanol was added, and the samples were vortexed thoroughly. The samples were then centrifuged, and the supernatant was transferred to a new tube. The remaining pellet was resuspended in 0.6 mL of water, then 2 mL of cold methanol was added, and the sample was vortexed. After a second centrifugation, the supernatant was collected and combined with the first extract. The combined extract was concentrated by evaporation to a final volume of 1 mL (Van Handel, 1985).
For trehalose isolation, sucrose, glucose, and fructose were removed by mixing 100 μL of the sugar fraction with 50 μL of 1 M HCl and heating in a 90 °C water bath for 7 minutes. Samples were removed from heat, neutralized with 50 μL of 1 M NaOH, and reheated at 90 °C for 7 minutes.
Equation 2: A) Formula used to normalize pigmentation data to account for lighting differences. Weighted green values (Gw) were calculated by assigning additional weight to the green channel (G) relative to the total red (R), green (G), and blue (B) channel intensities. B) Formula used to invert the weighted green value (Gi = 1 – G w) to reflect pigment loss. C) Formula used to calculate percent survivability (St) relative to the initial time point (2h). Data were normalized to Gi,2h. Image created by student researcher, 2025.
2.4 Ion Leakage Assays
Ion leakage was measured to assess cell membrane stability and quantify cellular damage resulting from desiccation stress by analyzing the conductivity of the water in which cells were lysed (Hatsugai et al., 2018; Cao et al., 2024). After 24 hours of desiccation, samples were placed into tubes containing 10 mL of deionized
After cooling, for sugar detection, anthrone reagent was added to bring the total volume to 5 mL, and samples were heated again at 90 °C for 17 minutes. Absorbance was measured after cooling to room temperature (Van Handel, 1985).
Standard solutions and the blank were processed in parallel with the sugar fractions, following the same heating steps and timings. The only difference was that the initial volume used was 50 μL of sugar fraction, while all other reagent volumes and conditions remained the same. This change was made to accommodate the high concentration of standards relative to the sample sugar fractions, ensuring they fall within the assay’s measurable range (Van Handel, 1985).
200 μL of each sample solution was pipetted into well plates along with standard solutions at known concentrations and a blank, and the plates were read in a spectrophotometer at 620 nm.
Standard trehalose solutions (1, 1.5, 2, 3, and 5 mg/mL) were prepared in 25% ethanol, and ddH2 O was used as the blank. The anthrone reagent was prepared by dissolving 750 mg of anthrone in 530 mL of 70% sulfuric acid. The reagent was stored at 6°C.
2.6 Statistical Analysis
All data were analyzed using RStudio. Data for each variable were first assessed for normality using the Shapiro-Wilk test. Water loss and pigmentation data were not normally distributed, so a Kruskal-Wallis test was performed, followed by Dunn’s post hoc tests for pairwise comparisons. Ion leakage and trehalose data were normally distributed, so one-way Analysis of Variance (ANOVA) tests were conducted, followed by Tukey’s Honest Significant Difference (HSD) test for pairwise comparisons. Statistical significance was defined as p < 0.05 for all analyses. Error bars in graphs represent the standard error of the mean (SEM).
3. Results
3.1 Survivability Analysis via Water Loss
Quantification
Water-loss measurements during desiccation at 0h, 2h, 4h, 6h, and 24h (Figure 1) revealed significant differences between treatment groups in all but the 24h desiccation case. At 2h, the rapamycin (Rapm) group exhibited significantly lower water loss than the ddH2 O control group, and the abscisic acid (ABA) group showed significantly lower water loss than the DMSO control (DMSO) and the ddH2O control group (control). At 4h and 6h, both rapamycin and ABA differed considerably from the DMSO and control groups. By 24h, no pairwise comparisons were significant. All measurements were performed on S. carolinianum (n = 5).
Figure 1. Water Loss: Shows the average water loss (%) across moss replicates at 2 h, 4 h, 6 h, and 24 h (n=5). At 2 h: *Rapm significant from control (p=0.0279); *ABA significant from DMSO (p = 0.0117); **ABA significant from control (p = 0.00667). At 4h: *Rapm significant from DMSO (p = 0.0280); Rapm significant from control (p = 0.0176); *ABA significant from DMSO (p = 0.0176); *ABA significant from control (p = 0.0166). At 6h: *Rapm significant from DMSO (p = 0.0180); Rapm significant from control (p = 0.0176); *ABA significant from DMSO (p = 0.0176); *ABA significant from control (p = 0.0176). Error bars indicate SEM. Dunn’s test was performed to determine statistical significance. Graphs and statistics produced using RStudio. Created by student researcher, 2025.
3.2 Survivability Analysis via Green Pigment Quantification
Pigmentation loss measurements during desiccation at 0 h, 2 h, 4 h, 6 h, and 24 h (Figure 2) revealed significant differences between treatment groups at specific time points. At 6 h, ABA showed significantly lower pigmentation loss than the control. By 24 h, ABA differed significantly from DMSO and the control groups. All other pairwise comparisons at all other time points were non-significant. All measurements were performed on S. carolinianum (n = 5).
Figure 2. Pigmentation Loss: Shows the average green pigmentation loss (%) across moss replicates at 2 h, 4 h, 6 h, and 24 h (n=5). At 6 h: *ABA significant from control (p = 0.0327). At 24h: *ABA significant from DMSO (p = 0.0116); *ABA significant from control (p = 0.0277). Error bars indicate SEM. Dunn’s test was performed to determine statistical significance. Graphs and statistics produced using RStudio. Created by student researcher, 2025.
3.3 Cell Damage Quantification via Ion Leakage Assay
Ion leakage was measured after 24 hours of desiccation (Figure 3). Portions of each sample (200–250 mg) were lysed in ddH2O, and the conductivity of the resulting solution was recorded. Higher conductivity indicated greater cell damage, as evidenced by increased ion release into the surrounding medium. Although no statistical significance was observed due to a large margin of error, both Rapm and ABA showed a general downward trend in conductivity compared with both control groups. All measurements were performed on S. carolinianum (n = 5).
Figure 3. Ion Leakage: Shows the conductivity of water sample cells that were lysed in (n=5). Significance was not determined for any of the groups shown (p = 0.105). Error bars indicate SEM. Tukey’s test was performed to determine statistical significance. Graphs and statistics produced using RStudio. Created by student researcher, 2025.
3.4 Trehalose Quantification via Colorimetric Assay
Sugar concentration was quantified using the anthrone colorimetric assay after samples were desiccated for 24 hours (Figure 4a) and 48 hours (Figure 4b). Glucose, fructose and sucrose were removed from sugar fractions before samples were treated with anthrone reagent and analyzed spectrophotometrically to determine relative sugar content. Values were calculated using a six-point calibration curve generated from known standards and a blank. ABA showed a significantly higher trehalose concentration than both the DMSO and control groups. Data were analyzed using a one-way ANOVA followed by Tukey’s post hoc pairwise comparisons. Error bars represent the standard error of the mean (SEM). All measurements were performed on S. carolinianum (n = 10).
Figure 4. Anthrone colorimetric assay: A) Concentration of trehalose after comparison to known solutions after 24 hours of desiccation (n=10). ****ABA significant from DMSO (p < 1e-7); ****ABA significant from control (p < 1e-7). B) Concentration of trehalose after comparison to known solutions after 48 hours of desiccation (n=10). ****ABA significant from DMSO (p < 1e-7); ****ABA significant from control (p = 2×10⁻⁷). Error bars indicate SEM. Tukey’s test was performed to determine statistical significance. Graphs and statistics produced using RStudio. Created by student researcher, 2025.
4. Discussion
4.1 Overview
The hypothesis that rapamycin and abscisic acid (ABA) would have a positive impact on desiccation tolerance and survival in S. carolinianum was supported by the data. Enhanced tolerance in treated groups was shown across multiple assays. This study’s findings demonstrate that external soaking of both treatments can be an effective method to activate stress-response pathways (Zhu et al., 2022).
4.2 Water Loss
At the early stages of desiccation (2, 4, and 6 hours), both treatments showed reduced water loss compared to the control groups, suggesting improved short-term water retention (Figure 1). Water loss was quantified gravimetrically by weighing moss samples before and after desiccation to calculate water retention percentages. Rapamycin enhanced water retention and survival by activating autophagy-related drought responses (Tolosa et al., 2023; Mugume et al., 2020). ABA treatment upregulated trehalose production (Figure 4) and induced stomatal closure, further helping the moss conserve water (Nibau et al., 2022).
4.3 Pigmentation Loss
Later in desiccation (6 hours and 24 hours), reduced pigmentation was observed in ABA-treated groups compared to controls, suggesting that ABA protects chlorophyll and slows pigment degradation. This effect is likely linked to the observed increase in trehalose production (Figure 4), which stabilizes membranes and photosynthetic structures under stress (Tapia & Koshland, 2014). These findings are consistent with previous studies showing that ABA protects chloroplasts and photosynthetic systems during dehydration (Zhu et al., 2022; Silva et al., 2021).
4.4 Ion Leakage
Ion leakage measurements showed a trend toward lower conductivity in the treatment groups, indicating less ion leakage and, therefore, less cell damage. Rapamycin decreased the measured value by approximately 52–53% relative to DMSO and water controls, and ABA reduced it by about 46% relative to the same controls. However, these differences were not statistically significant, likely due to high variability and a large margin of error. This variability may result from uneven tissue density or slight differences in sample size. Increasing the sample size
may help clarify these trends and provide more reliable conclusions (Hatsugai et al., 2018; Cao et al., 2024).
4.5 Trehalose Accumulation
ABA caused a significant increase in trehalose concentration at both 24 and 48 hours, with higher values at 24 hours showing a strong early effect. Rapamycin was not included in this assay since autophagy and trehalose production act through separate pathways (Tolosa et al., 2023). These results show that ABA strongly activates sugar-based stress protection. Linking these physiological observations to known molecular mechanisms, ABA increased trehalose synthesis and triggered stomatal closure to conserve water and protect membranes (Nibau et al., 2022; Tapia & Koshland, 2014).
4.6 Broader Implications
These findings show that external treatments can enhance stress responses in desiccation-intolerant mosses such as S. carolinianum. Improving drought tolerance by amplifying trehalose production or promoting autophagy could help create more resilient primary and secondary successors that can restore degraded ecosystems and inform plant stress research (Food and Agriculture Organization, 2019; Silva et al., 2021). This work also relates to broader drought and water scarcity issues in regions worldwide that face shortages (Food and Agriculture Organization, 2019).
4.7 Limitations and Future Directions
This study was limited by the lack of a fully sequenced and annotated S. carolinianum genome. Future work should include sequencing and annotation of the S. carolinianum genome to enable gene expression analysis of the ATG and TREH pathways, thereby confirming the molecular basis of these results (Mugume et al., 2020). In the pigmentation quantification assay, using fluoroscopy equipment could improve the accuracy of pigment readings and allow quantification of green pigment during rehydration, as the presence of water in rehydrated samples led to highly inaccurate color readings in ImageJ. Long-term desiccation and rehydration cycles were not tested due to uncontrollable lab space limitations in a high school setting. Testing longer cycles and combining treatments with other stress hormones, such as ethylene and jasmonic acid, could further reveal whether multiple treatments enhance tolerance (Zhu et al., 2022).
5. Conclusion
As shortages and land degradation continue to worsen, understanding and enhancing plant resilience is becoming increasingly critical. This study provides new insight into the mechanisms of desiccation tolerance by examining the effects of rapamycin and abscisic acid (ABA) on a desiccation-intolerant moss species.
The findings show that rapamycin improved survivability by enhancing water retention, suggesting that the external application activates autophagic pathways. ABA also showed improved water retention, enhanced chlorophyll stability and higher trehalose production. Ion leakage decreased in both treatment groups; however, the difference did not reach statistical significance.
This research is the first to study S. carolinianum and establishes it as a model for autophagy and trehalose production in mosses. These findings can be implemented not only to improve desiccation tolerance in other plant species but also to support efforts to address land degradation and desertification. Continuing to explore these stress-response pathways could transform how we approach ecosystem recovery and provide environmental benefits worldwide.
Acknowledgements and Data Availability
This project was supported by the NCSSM Foundation, the Burroughs Wellcome Fund, and GlaxoSmithKline. A special thanks to Dr. Heather Mallory for her incredible tutelage, guidance, and encouragement throughout this project, and to Dr. Kimberly Monahan and Dr. Tim Anglin for their constant support. For their friendship, warm chatter, and genuine kindness, the author thanks NCSSM’s Research in Biology class of 2026 and Shivani Ramkumar. The author acknowledges Anna Tringale for their thoughtful advice, feedback, extraordinary sense of humor, and incredibly inspiring work. Additionally, the author extends her gratitude to Hazel Cochran for listening to every frustration, idea and success. Finally, to the people of Bangalore, the author offers her most heartfelt thanks and the hope that resilience always finds its way back to you. Data for this study were not made available to the public.
Citations
Butler, R.A. (2024, December 30). The year in tropical rainforests: 2024. Mongabay.
Cao, T., Haxim, Y., Liu, X., Yang, Q., Hawar, A., Waheed, A., Li, X., & Zhang, D. (2023). ScATG8 gene cloned from desert moss Syntrichia caninervis exhibits multiple stress tolerance. Plants, 13(1), 59.
Cao, Y., Cao, T., Li, X., Liu, X., Liang, Y., Hawar, A., Yang, R., & Zhang, D. (2024). Autophagy functions as a cytoprotective mechanism by regulating programmed cell death during desiccation in Syntrichia caninervis Plant Physiology and Biochemistry, 211, 108620.
Cusick, D., & E&E News. (2022). 5 billion people will face water shortages by 2050, U.N. says. Scientific American.
Food and Agriculture Organization. (2017). Water use by agriculture and energy generation.
Food and Agriculture Organization. (2019). Every year, 24 billion tons of fertile soils are lost due to erosion.
Hájek, T., & Vicherová, E. (2014). Desiccation tolerance of Sphagnum revisited: A puzzle resolved. Plant Biology, 16(4), 765–773.
Hatsugai, N., Yamada, K., Goto-Yamada, S., NaraNishimura, I., & Hara-Nishimura, I. (2018). Quantification of plant cell death by electrolyte leakage. Plant Methods, 14, 49.
Kuzma, S., Saccoccia, L., & Chertock, M. (2023). 25 countries, housing one-quarter of the population, face extremely high water stress. World Resources Institute.
Mekonnen, M. M., & Hoekstra, A. Y. (2016). Four billion people facing severe water scarcity. Science Advances, 2(2), e1500323.
Mugume, Y., Kazibwe, Z., & Bassham, D. C. (2020). Target of rapamycin in control of autophagy: Puppet master and signal integrator. International Journal of Molecular Sciences, 21(21), 8259.
Nibau, C., van de Koot, W., Spiliotis, D., Williams, K., Kramaric, T., Beckmann, M., Mur, L., Hiwatashi, Y., & Doonan, J. H. (2022). Molecular and physiological responses to desiccation indicate the abscisic acid pathway is conserved in the peat moss, Sphagnum Journal of Experimental Botany, 73(13), 4576–4591.
Rydin, H., & Jeglum, J. (2013). The biology of peatlands (2nd ed.). Cambridge University Press.
Silva, A. T., Gao, B., Fisher, K. M., Mishler, B. D., Ekwealor, J. T. B., Stark, L. R., Delaux, P.-M., Goffinet, B., & Oliver, M. J. (2021). To dry perchance to live: Insights from the genome of the desiccation-tolerant biocrust moss Syntrichia caninervis. The Plant Journal, 105(5), 1339–1356.
Tapia, H., & Koshland, D. E. (2014). Trehalose is a versatile and long-lived chaperone for desiccation tolerance. Current Biology, 24(23), 2758–2766.
Tolosa, J., Fernandez-Villalba, E., Ruiz, R., CarmonaAbellan, M., Escobar-Peso, A., Alcazar, A., & Herrero, M. T. (2023). Inhibition of the mammalian target of rapamycin (mTOR): A potential therapeutic strategy for multiple system atrophy. Journal of Neurology, 270, 1–12.
Tu, N., Dai, Q., Yan, Y., Peng, X., Meng, W., & Cen, L. (2022). Effects of moss overlay on soil patch infiltration and runoff in karst rocky desertification slope land. Water, 14(21), 3429.
UN-Water. (n.d.). Water scarcity.
Van Handel, E. (1985). Rapid determination of glycogen and sugars in mosquitoes. Journal of the American Mosquito Control Association, 1(3), 299–301.
Weston, D. J., Timm, C. M., Walker, A. P., Gu, L., Muchero, W., Schmutz, J., & S. D. (2015). Sphagnum physiology in the context of changing climate. Plant, Cell & Environment, 38, 1737–1751.
World Green Building Council. (2023). Water guide 2023.
Zhu, A., Li, J., Fu, W., Wang, W., Tao, L., Fu, G., Chen, T., & Feng, B. (2022). Abscisic acid improves rice thermotolerance by affecting trehalose metabolism. International Journal of Molecular Sciences, 23(18), 10615.
THE DESIGN, SYNTHESIS, AND EVALUATION OF PROFLUORACIL: A SMALL MOLECULE DIHYDROFOLATE
REDUCTASE INHIBITOR FOR PSORIASIS TREATMENT
Lucas Rodriguez Chiappetta
Abstract
Psoriasis is a chronic inflammatory skin disease that significantly impacts quality of life, causing both psychological and physical distress. Classical dihydrofolate reductase (DHFR) inhibitors, such as methotrexate and pemetrexed, have provided effective treatment for the condition; however, cellular resistance and hepatotoxicity limit their long-term usability. Unlike classical inhibitors, nonclassical ones do not rely on active transport to enter cells, bypassing common cellular resistance mechanisms. This project investigated the development of profluoracil, a less toxic, higher-affinity, nonclassical inhibitor that incorporated a propargyl-linked fluorinated uracil scaffold. Propargyl-linked fluoracil derivatives can exhibit high affinity for the DHFR binding site while avoiding the need for classical folate mimics, whose structures inherently cause toxic effects. Using Schrödinger’s Maestro Suite for computational design and testing, profluoracil was discovered and then synthesized via a Sonogashira cross-coupling reaction. The compound was characterized by thin-layer chromatography (TLC) analysis, and subsequent DHFR inhibition by profluoracil was evaluated relative to a methotrexate control, yielding 85% inhibition at low nanomolar concentrations. Results from an Escherichia coli cytotoxicity assay indicated that profluoracil demonstrates lower toxicity than methotrexate at high nanomolar to low micromolar concentrations. Preliminary testing suggested that profluoracil exhibits comparable— or possibly greater—potency than methotrexate, along with fewer side effects, offering a more effective, less toxic, nonclassical alternative to existing DHFR inhibitors.
1. Introduction
1.1 Psoriasis Background
Psoriasis is a chronic autoimmune disorder affecting approximately 125 million people worldwide, representing around 3% of the global population (Garg et al., 2024). As shown in Figure 1, the disease is characterized by thickened, inflamed, and scaly patches that often itch and burn. Treating psoriasis is challenging—topical ointments are pungent and tedious to apply to emerging breakouts, while oral therapeutics can cause harmful side effects, including liver and immune system damage (Garg et al., 2024). Psoriasis severely impairs quality of life, causing physical discomfort and psychological distress; patients reported lowered self-image resulting from the disease (Garg et al., 2024; Raimondi et al., 2019). Because psoriasis is cyclical, individuals may experience flare-ups lasting weeks to months, followed by periods of remission. These flareups are commonly triggered by infection, stress, or adverse reactions to medication. Specifically, Streptococcus infections often trigger disease activity through an immune response in which T-cells attack healthy skin
cells, while lithium and NSAID medications can heighten disease prevalence by increasing the production of proinflammatory substances (Kim et al., 2010). At its core, psoriasis is driven by an overactive immune system, in which keratinocytes—cells that trigger inflammation— play a crucial role in its development (Ortiz-Lopez et al., 2022). When activated, keratinocytes release a variety of signaling molecules, including cytokines, in response to immune stimuli. This signaling creates a ripple effect, with keratinocytes proliferating rapidly, leading to epidermal thickening and the formation of characteristic patches (Ortiz-Lopez et al., 2022; Yap et al., 2025). Given its impact on mental health and the limitations of current treatment, inhibiting specific targets whose function promotes cellular proliferation is a crucial area for the development of potent therapeutics.
1: Psoriasis on the back showing characteristic patches. Image accessed from “Psoriasis of the Back” in October 2025, Wikipedia.
1.2 Function of Dihydrofolate Reductase Inhibition
Dihydrofolate reductase (DHFR) is a ubiquitous enzyme found in all living organisms. It plays a crucial role in one-carbon metabolism: a series of reactions that deliver one-carbon units to various molecules, such as lipids, amino acids, and nucleic acids, as shown in Figure 2 (Gao et al., 2019).
Figure 2: Simple schematic representation of onecarbon metabolism highlighting dihydrofolate reductase (DHFR) in the reduction of dihydrofolate (DHF) to tetrahydrofolate (THF). Red text indicates DHFR inhibitors, which disrupt the progression of one-carbon metabolism; green arrows indicate DHFR-catalyzed reactions. Image created by student researcher using Canva, 2025.
DHFR catalyzes the reduction of folate to dihydrofolate (DHF) and, more importantly, the NADPH-dependent reduction of DHF to tetrahydrofolate (THF), which is essential for nucleotide production (Gao et al., 2019). THF serves as a carrier of one-carbon units required for the synthesis of purine and thymidylate, precursors of DNA replication. As a result, inhibiting DHFR disrupts nucleotide synthesis, slowing DNA replication and preventing uncontrolled cell proliferation (Raimondi et at., 2019; Gao et al., 2019). Ultimately, this leads to
apoptosis in rapidly dividing cells (Tezgin et al., 2024). The pathogenesis of psoriasis is characterized by keratinocyte hyperproliferation; DHFR inhibition offers an effective strategy to counteract this process (Kalhor et al., 2025). By preventing THF formation, DHFR inhibition reduces nucleotide synthesis, thereby limiting DNA replication and subsequent keratinocyte proliferation, slowing the progression of psoriasis (Raimondi et al., 2019).
1.3 Classical and Nonclassical Dihydrofolate Reductase Inhibition
Dihydrofolate reductase inhibitors are categorized into two types: classical and nonclassical antifolates, as shown in Figure 3. Classical inhibitors, such as methotrexate (MTX), consist of a pterin ring, aromatic ring (specifically a p-aminobenzoic ring in MTX), and a charged glutamate tail (Algul et al., 2011). These compounds mimic the structure of DHF, the natural substrate of DHFR, allowing competitive binding to the enzyme’s active site (Kalhor et al., 2025). Specifically, when bound to human dihydrofolate reductase (hDHFR), these molecules participate in both hydrogen bonding and hydrophobic interactions, rendering them remarkably potent (Algul et al., 2011).
Figure 3: Comparison of classical (methotrexate) and nonclassical (trimethoprim) antifolate properties. Image created by student researcher using Marvin Chemical Drawing, 2025.
Classical inhibitors are highly polar, which prevents them from passing through the cell membrane by passive diffusion; therefore, they require the reduced folate carrier (RFC) to enter (Tezgin et al., 2024). Efflux pumps—transport proteins that expel toxic compounds from cells—contribute to cellular resistance mechanisms; specifically, their overexpression often prevents classical inhibitors, such as methotrexate, from reaching their
Figure
targets (Gao et al., 2019; Tezgin et al., 2024). Furthermore, alterations in drug uptake can lead to cellular resistance: fewer drug molecules enter the cell, requiring higher doses to achieve the same effect, thereby increasing the accumulation of toxicity (Katturajan et al., 2021; Rana et al., 2020).
In terms of inhibition and efficacy, classical inhibitors outperform other candidates; however, their success is hindered by toxicity (Katturajan et al., 2021). Specifically, these drugs exhibit considerable amounts of hepatotoxicity, causing both acute and chronic liver damage (Friedman et al., 2019). Even low doses of these antifolates, when administered over prolonged periods, can have adverse effects, raising concerns about longterm use (Katturajan et al., 2021).
Alternatively, nonclassical antifolates, such as propargyl-linked antifolates (PLAs) and 1,3-diamino7H-pyrrol[3,2-f] quinazoline derivatives, are structurally different from their classical counterparts (Algul et al., 2011). Nonclassical inhibitors replace the aminobenzoic acid and glutamic acid components with lipophilic replacements. The lipophilic nature, combined with the absence of charged rings present in classical antifolates, facilitates passive diffusion (Gao et al., 2019; Reeve et al., 2016; Wróbel et al., 2019). They do not have to rely on an RFC to transport across the cell, which decreases the likelihood of efflux or transporter resistance. Although structurally smaller, nonclassical structures exhibit high DHFR potency. Nonclassical structures promote favorable hydrogen bonding and pi–pi stacking interactions with key amino acids within the DHFR active site (Algul et al., 2011; Reeve et al., 2016). Some existing nonclassicals, such as trimetrexate, a common chemotherapy agent, exhibit IC 50 values that are significantly lower than those of methotrexate (Algul et al., 2016). This indicates that lower concentrations are needed to achieve complete DHFR inhibition, reflecting the greater potency of these compounds (Serra et al., 2004). Additionally, nonclassical inhibitors avoid common mechanisms that promote drug accumulation in healthy cells, thereby reducing overall toxicity (Wróbel et al., 2019).
1.4 Propargyl-linked Antifolates for Safer Psoriasis Treatment
New nonclassical antifolates targeting DHFR have been synthesized and tested in recent years, with propargyllinked antifolates (PLAs) emerging as a particularly promising subgroup, as shown in Figure 4 (Algul et al., 2011; Tezgin et al., 2024). PLAs show potential due to their smaller structures and passive diffusion mechanisms, which reduce susceptibility to cellular resistance and enable facile synthetic routes. Their charge distributions and lipophilicity further minimize recognition and
expulsion by efflux pumps (Reeve et al., 2016; Scocchera et al., 2016). Recently tested propargyl-linked antifolates exhibited exceptional nanomolar potency relative to both classical and nonclassical treatment, with reported IC 50 values in the low nanomolar range (Algul et al., 2011; Tezgin et al., 2024). The extended propargyl group promotes favorable interactions with key residues in the DHFR active site, resulting in stronger binding. Despite these advancements, many existing nonclassicals still exhibit limited efficacy and significant toxicity; thus, the continued development of safer, higher-affinity DHFR inhibitors is necessary.
4: Standard propargyl-linked antifolate. Image created by student researcher using Marvin Chemical Drawing, 2025.
1.5 Specific Aim
This project aims to design, synthesize, and evaluate a small molecule DHFR inhibitor that exhibits higher affinity, lower cellular resistance, and reduced side effects relative to various nonclassical antifolates for the treatment of psoriasis.
2. Methodology
Evaluation of potential DHFR inhibitors proceeded in three stages: computational design, including docking of known and newly identified compounds; synthesis of the most promising candidate based on computational testing; and in vitro inhibition and cytotoxicity assays of the synthesized compound.
2.1 Computational Design
Computational design was split into two stages: docking known inhibitors, followed by docking potential inhibitors. All computational design and modeling were
Figure
performed in Schrödinger’s Maestro Suite using a crystal structure of human dihydrofolate reductase (hDHFR) (PDB:5SDB), which is shown in Figure 5.
Stage one included the design, preparation, and docking of existing classical and nonclassical antifolates against hDHFR (e.g., methotrexate, pemetrexed, pralatrexate). These known compounds provided insight into the structures of potent inhibitors and served as benchmarks for binding and pharmacokinetic comparison with potential inhibitors.
Stage two involved the development, preparation, and docking of potential drug candidates, including both purine and fluoracil models. Initial docking tests were performed using purine structures; ~50 of these structures were designed with different linkers and tails (e.g., an ether linker with a glutamate tail) to facilitate favorable interactions while maintaining a smaller structure. The second round of discovered nonclassicals included iodo and bromo compounds reacting with 5–fluoro–1–propargyl-uracil, as shown in Figure 6. Twelve of these simpler structures were designed, prepared, and tested, and results were stored and compared with both known inhibitors and the earlier purine structures. The best candidates, as determined by docking scores, were selected for further analysis. “QikProp,” a Schrödinger tool that measures pharmacokinetic properties, was used to simulate these candidates and compare the results with those of known inhibitors (Tezgin et al., 2024; Reeve et al., 2016).
Figure 5: Pose view of methotrexate bound in the DHFR active site (PDB:5SDB). Image created by student researcher using Schrödinger’s Maestro Suite and Canva, 2025.
2.2 Synthesis of Profluoracil
All chemicals and reagents were purchased from Sigma Aldrich, St. Louis, MO, unless otherwise specified. Based on computational data, profluoracil was selected for synthesis via a Sonogashira cross-coupling reaction, as described by Mino et al., (2011), with minimal
modifications to reaction conditions and chemical substitutions, shown in Figure 6. Sonogashira coupling is a carbon-carbon bond-forming reaction in which a terminal alkyne is coupled to an aryl halide (in this case, a bromide) using a palladium catalyst and, in some cases, a copper co-catalyst. The name profluoracil reflects the molecule’s structural features. The prefix “pro–” denotes the presence of a propargyl linker, “fluor–” refers to the fluorinated substituent incorporated into the molecule, and the suffix “-acil” comes from the uracil-based core. Profluoracil was prepared by combining 2 mol% (0.00246 g) tris(dibenzylideneacetone)dipalladium(0), 4 mol% (0.0030 g) triphenylphosphine, 2 mol% (0.00076 g) copper (I) iodide, 2.0 equivalent (34.6 μM) triethylamine, 1.2 equivalent (0.025 g) 5-fluoro-1propargyl-uracil, 1.0 equivalent (0.02676 g) 5’-bromo2’-hydroxyacetephenone, and approximately 2.0 mL of DMSO-d6. The components were placed into a 5 mL micro reaction vessel under nitrogen to ensure an inert atmosphere, shown in Figure 7. The reaction mixture was stirred for 48 hours at approximately 100°C, with the temperature held constant, and monitored by TLC. Upon completion by TLC, the crude product was approximately 3.5 mL, and the Rf values were calculated.
Figure 6: Procedure for the synthesis of profluoracil. Image created by student researcher using Marvin Chemical Drawing, 2025.
Figure 7: Image of experiment setup. Image created by student researcher in Adobe Photoshop & Canva, 2025.
2.3 Dihydrofolate Reductase Activity Assay
Following the successful synthesis of profluoracil, a dihydrofolate reductase assay kit (Sigma-Aldrich, catalog number CS0340) was used to quantify the DHFR inhibition by profluoracil relative to a methotrexate control using a recombinant DHFR enzyme expressed in E. coli. All assay data were analyzed using a UV-1700 PharmaSpec Shimadzu UV-Vis Spectrophotometer, with a kinetic program set to 335 nm, running every 5 seconds for 5 minutes at 22°C. Stock solutions of methotrexate and profluoracil at different concentrations were prepared by serial dilution. All stock solutions and reaction reagents were kept on ice, except for the assay buffer. Samples were prepared from 1x assay buffer, DHFR enzyme, NADPH, DHFR acid, and test inhibitors at the volumes listed in Table 1. The spectrophotometer was used to measure absorbance at 335 nm. As DHFR catalyzes the reaction, absorbance at 340 nm decreases. In the presence of an inhibitor, a decrease in absorbance indicates DHFR inhibition.
Table 1: Reaction scheme for volumes of DHFR activity detection and DHFR activity inhibition for both methotrexate control (concentrations tested: 100 μM, 10 μM, and 1 μM) and profluoracil (concentrations tested: 10 μM, 5 μM, 1 μM, 0.1 μM, 0.01 μM, and 0.005 μM). Image created by student researcher in Google Docs, 2025.
2.4 Cytotoxicity Assay
Profluoracil was tested for antimicrobial activity compared to a methotrexate control. Both profluoracil and methotrexate were tested against Escherichia coli suspended in Luria-Bertani broth, a liquid culture environment used to grow and maintain E. coli and other bacteria. Using a previously created E. coli culture, a small amount of growing E. coli were placed into broth and incubated in a water bath at 37°C for 18 hours to promote bacterial growth. Dilutions of 100, 10, and 1 μM MTX, and 1000, 500, 100, 10, 1, and 0.1 μM profluoracil were created. 100 μL of each dilution was then added to 8 microcentrifuge tubes, containing 600 μL of the 18-hourcultured broth. These tubes were then incubated in a water bath at 37°C for 20 hours. Using a Vernier SpectroVis Plus Spectrophotometer connected to LoggerPro, the OD600 (optical density at 600 nm) was measured to determine the solution’s turbidity and assess whether the bacteria survived. First, a blank-cuvette calibration with water
was performed to prepare the instrument. Then, 700 μL of each bacterial microcentrifuge solution containing both methotrexate and profluoracil was added to different curved cuvettes, which was then placed into the instrument. The optical density of each microcentrifuge tube at their respective concentrations was measured using the spectrophotometer.
3. Results
3.1 Computational Data
Results from computational testing for both known (UCP1162, trimethoprim) and discovered nonclassical inhibitors (profluoracil, probromoben, promethylacetephen, probromoacetephen) include docking scores, predicted values for blockage of HERG K+ channels (QPlogHERG), and predicted human oral absorption (Percent Human Oral Absorption). Results are shown in Table 2. Structural and computational analyses revealed that the fluorinated uracil scaffold and propargyl linker enabled the nonclassical inhibitor compounds that we modeled to extend into DHFR’s hydrophobic pocket, forming strong hydrogen bonding and hydrophobic interactions with key residues. These properties contributed to the exceptional docking score (-10.654) and favorable pharmacokinetic properties, including QPlogHERG and Percent Human Oral Availability scores (-5.056 and 75.299, respectively). The ligand interaction diagrams for each compound reveal specific interactions between the ligand’s position in hDHFR’s cavity, shown in Figure 8. Profluoracil was selected for synthesis due to its exceptional docking performance (based on docking score), straightforward synthesis procedure, relative heart toxicity (due to HERG K+ channel blockade), and percent oral absorption compared to other candidates.
A lower docking score is optimal, and profluoracil significantly outperformed the known inhibitors. Additionally, regarding toxicity, profluoracil outperformed UCP1162; however, it falls slightly below the margin of concern, as values below -5 are considered troublesome. In terms of absorption, values above 80 are considered high, which is optimal as more of the drug reaches circulation throughout the body; thus, 75% profluoracil is predicted to be acceptable.
Table 2: Computational results of discovered and known candidates; Green = exceptional results, yellow = cautionable results, red = poor results compared to various nonclassicals. QPlogHERG > -5 is ideal, > 80% absorption is high, while < 25% is poor; Profluoracil was the selected compound. Created by student researcher using Google Docs, 2025.
Figure 8: Ligand interaction diagrams of trimethoprim & UCP1162 (known) and profluoracil, probromobenzene, promethylacetephen, & probromoacetephen (discovered) compounds. Created by student researcher using Schrödinger’s Maestro Suite, 2025.
3.2 TLC Data from Synthesis
Thin-layer chromatography (TLC) was performed on profluoracil at different time intervals throughout the experiment. The mobile phase was 75% hexane/25% EtOAc. The TLC confirmed loss of initial reactants and formation of a new product, indicating successful synthesis of profluoracil.
3.3 DHFR Activity Assay Data
The percentage of relative inhibition was calculated using: % relative inhibition = (slope of enzyme - slope of sample)/slope of enzyme * 100. Inhibition is the percentage decrease in enzyme activity in the presence of an inhibitor relative to enzyme activity in its absence. The percentages of inhibition at 10 μM, 5 μM, 1 μM, 0.1 μM, 0.01 μM, and 0.005 μM were 85%, 86%, 96%, 80%, 93%, and 85%, respectively. Profluoracil exhibits nanomolarrange inhibition up to 0.005 μM, achieving a peak inhibition of 80%, as shown in Figure 9. Although peak inhibition was measured in the nanomolar range, lower inhibitor concentrations are required to test profluoracil’s true efficacy.
9: Percentage inhibition of Profluoracil at different concentrations. Image created by student researcher using Excel, 2025.
3.4
Cytoxicity Assay Data
Results from antimicrobial testing indicate that profluoracil exhibits lower cytotoxicity— nanomolar to micromolar concentrations—than methotrexate. OD600 values for different concentrations of both methotrexate and profluoracil are shown in Figure 10. The reference absorbance at 600.3 nm was 0.759. If the inhibitor were non-toxic to the bacteria, a higher absorbance value would be expected, as increased turbidity reflects more bacterial growth. At 100 μM profluoracil, the OD600 value was 0.868, approximately 0.109 absorbance units
Figure
higher than the reference, which indicated increased light scattering and greater bacterial growth. Across all tested concentrations, profluoracil did not inhibit bacterial growth at 600.3 nm, suggesting minimal cytotoxicity and supporting its potential as a less toxic therapeutic agent.
Figure 10: A graph of the absorbance (OD600) vs concentration dosed with methotrexate control (red square line) and profluoracil (blue circle line). Image created by student researcher using Excel, 2025.
4. Discussion
Profluoracil was successfully synthesized in a onestep process using commercially available reagents and Sonogashira cross-coupling, offering high yield and reliability. The fluorinated scaffold is widely available for industrial and research use, making it readily accessible for drug discovery. Profluoracil showed low nanomolar inhibition, indicating potency comparable to, or potentially exceeding, that of the current drugs of choice. Preliminary testing indicated that profluoracil may outperform methotrexate and pemetrexed, which have median IC 50 values of approximately 78 nM and 155 nM, respectively (Norris et al., 2010). Profluoracil’s observed inhibition value at 0.005 microM (5 nM) indicates substantially higher apparent potency than that of clinically used antifolates, approximately 15,600fold higher than reported in the literature. However, these values warrant further testing for selectivity and toxicity. Additionally, initial antimicrobial testing indicated that proflouracil exhibited lower toxicity than methotrexate. When profluoracil was tested at low micromolar to high nanomolar concentrations against a growing E. coli culture, no growth inhibition was observed, indicating minimal toxicity. OD600 measurements, which reflected the density of microbial cells in a liquid culture, showed an increased absorbance following treatment.
Around 10 additional propargyl-linked uracil-based scaffolds were evaluated in Schrödinger and are predicted to have affinities and toxicities comparable to those of profluoracil. These compounds, a select few shown in Table
2 and Figure 8, were computationally screened against hDHFR in the same manner as profluoracil. However, they could not be synthesized—probromobenzene, promethylacetephen, probromoacetephen—due to resource constraints. However, if synthesized, each could exhibit potency and toxicity similar to that of profluoracil, suggesting the potential for additional high-performing fluorinated-uracil DHFR inhibitors.
5 Limitations and Future Directions
Out of the twelve compounds that were successfully identified as promising candidates, only one could be synthesized with the available reagents. The synthesis of additional uracil-based compounds offers the potential to develop less toxic and more effective antifolate candidates. Computational testing revealed at least 10 other nonclassical inhibitors similar to profluoracil that, if synthesized, could offer potent inhibition while being less toxic. Characterization of profluoracil by Carbon NMR or Fourier Transform Infrared Spectroscopy would have provided another and more concrete method of the compound’s characterization. Additionally, further purification of profluoracil by rotary evaporation and chromatography would be beneficial for purifying the drug candidate rather than relying on the crude product.
In terms of testing, access to more hDHFR enzyme would have enabled further testing of profluoracil’s effectiveness against DHFR, allowing evaluation at lower concentrations and the generation of an IC50 curve. Further testing is needed to determine the IC50 of profluoracil with greater precision, enabling a quantifiable comparison with existing treatment options. In vivo testing in psoriasis-infected mammalian models would have demonstrated the drug’s toxicity and its effects on disease progression. However, these procedures were not possible in the current research setting due to ethical and lab space constraints.
6. Conclusion
This project lays the foundation for the discovery of potent, less toxic, nonclassical small-molecule DHFR inhibitors designed for psoriasis treatment and other hyperproliferative conditions. Profluoracil was assessed for DHFR inhibition and antimicrobial properties, with cytotoxicity data indicating reduced toxicity against microbial strains and DHFR activity data demonstrating significant inhibitory potency against human DHFR. Preliminary results indicate that profluoracil is a potent, less toxic inhibitor. The compound’s smaller, nonclassical structure enabled a straightforward synthesis while bypassing the resistance mechanisms commonly associated with classical inhibitors, potentially reducing
the likelihood of cells developing resistance. Together, these findings demonstrated that profluoracil is a promising scaffold for the future of DHFR inhibition. Given DHFR’s central role in cellular proliferation, profluoracil could hold promise not only for psoriasis treatment but also for the treatment of autoimmune and cancer diseases.
7. Acknowledgements
This project would not have been possible without the dedication and mentorship of Dr. Timothy Anglin and Dr. Michael Bruno, the supplies and guidance of Mr. Antonio Lopez, the support and motivation of my Research in Chemistry Peers and Luke Malta, the financial support for my project from the NCSSM Foundation, the support and excitement from the NCSSM Science Department, and Dr. Heather Mallory for the biology related questions.
8. Data Availability
The author confirms that the data from this study are not currently publicly available. All computational data were independently created and tested by the author; no data used were publicly available.
9. References
Algul, O., Paulsen, J. L., & Anderson, A. C. (2011). 2, 4-Diamino-5-(2′-arylpropargyl) pyrimidine derivatives as new nonclassical antifolates for human dihydrofolate reductase inhibition. Journal of Molecular Graphics and Modelling, 29(5), 608-613. DOI: https://doi.org/10.1016/j. jmgm.2010.11.004
Friedman, B., & Cronstein, B. (2019). Methotrexate mechanism in treatment of rheumatoid arthritis. Joint Bone Spine, 86(3), 301-307. DOI: https://doi.org/10.1016/j. jbspin.2018.07.004
Gao, T., Zhang, C., Shi, X., Guo, R., Zhang, K., Gu, J., ... & Wang, L. (2019). Targeting dihydrofolate reductase: Design, synthesis and biological evaluation of novel 6-substituted pyrrolo [2, 3-d] pyrimidines as nonclassical antifolates and as potential antitumor agents. European Journal of Medicinal Chemistry, 178, 329-340. DOI: https:// doi.org/10.1016/j.ejmech.2019.06.013
Garg, S., Dixit, M., Malhotra, I., Singh, M., & Singh, V. (2024). From Manifestations to Innovations: A Deep Dive into Psoriasis, its Clinical Diversity, Conventional Treatments, and Emerging Therapeutic Paradigms. International Immunopharmacology, 143, 113508. DOI: https://doi.org/10.1016/j.intimp.2024.113508
Kalhor, S., Shapouri, A. M., & Fattahi, A. (2025). Combinatorial QM and MD in silico design of natural product-based DHFR inhibitors. Scientific Reports, 15(1), 37462. DOI: https://doi.org/10.1038/s41598-025-21262-5
Katturajan, R., Vijayalakshmi, S., Rasool, M., & Prince, S. E. (2021). Molecular toxicity of methotrexate in rheumatoid arthritis treatment: A novel perspective and therapeutic implications. Toxicology, 461, 152909. DOI: https://doi. org/10.1016/j.tox.2021.152909
Kim, G. K., & Del Rosso, J. Q. (2010). Drug-provoked psoriasis: is it drug induced or drug aggravated? Understanding pathophysiology and clinical relevance. The Journal of clinical and aesthetic dermatology, 3(1), 32. Available from: https://pmc.ncbi.nlm.nih.gov/articles/ PMC2921739/.
Mino, T., Suzuki, S., Hirai, K., Sakamoto, M., & Fujita, T. (2011). Hydrazone-Promoted Sonogashira coupling reaction with aryl bromides at low palladium loadings. Synlett, 2011(09), 1277-1280. DOI: https://doi. org/10.1055/s-0030-1260535
Norris, R. E., & Adamson, P. C. (2010). Clinical potency of methotrexate, aminopterin, talotrexin and pemetrexed in childhood leukemias. Cancer chemotherapy and pharmacology, 65(6), 1125-1130. DOI: https://doi. org/10.1007/s00280-009-1120-8
Ortiz-Lopez, L. I., Choudhary, V., & Bollag, W. B. (2022). Updated perspectives on keratinocytes and psoriasis: keratinocytes are more than innocent bystanders. Psoriasis: Targets and Therapy, 73-87. DOI: https://doi. org/10.2147/PTT.S327310
Raimondi, M. V., Randazzo, O., La Franca, M., Barone, G., Vignoni, E., Rossi, D., & Collina, S. (2019). DHFR inhibitors: reading the past for discovering novel anticancer agents. Molecules, 24(6), 1140. DOI: https://doi.org/10.3390/ molecules24061140
Rana, R. M., Rampogu, S., et al. (2020). In silico study identified methotrexate analog as potential inhibitor of drug resistant human dihydrofolate reductase for cancer therapeutics. Molecules, 25(15), 3510. DOI: https://doi. org/10.3390/molecules25153510
Reeve, S. M., Scocchera, E., Ferreira, J. J., G-Dayanandan, N., Keshipeddy, S., Wright, D. L., & Anderson, A. C. (2016). Charged propargyl-linked antifolates reveal mechanisms of antifolate resistance and inhibit trimethoprim-resistant MRSA strains possessing clinically relevant mutations. Journal of medicinal chemistry, 59(13), 6493-6500. DOI: https://doi.org/10.1021/acs.jmedchem.6b00688
Scocchera, E., Reeve, S. M., et al. (2016). Charged nonclassical antifolates with activity against grampositive and gram-negative pathogens. ACS Medicinal Chemistry Letters, 7(7), 692-696. DOI: 10.1021/ acsmedchemlett.6b00120
Schrödinger, LLC. QikProp 4.4 User Manual. Schrödinger, LLC. New York, NY, 2015.
Serra, M., Reverter-Branchat, G., et al. (2004). Analysis of dihydrofolate reductase and reduced folate carrier gene status in relation to methotrexate resistance in osteosarcoma cells. Annals of Oncology, 15(1), 151-160. DOI: https://doi.org/10.1093/annonc/mdh004
Tezgin, D. O., Kurkcu, S., et al. (2024). Evaluation of UCP1162, a potent propargyl-linked inhibitor of dihydrofolate reductase with potential application to cancer and autoimmune disease. Biochemical Pharmacology, 230, 116617. DOI: https://doi.org/10.1016/j. bcp.2024.116617
File:Psoriasis on back.jpg. (2025, December 11). Wikimedia Commons. Retrieved November 6, 2025, from https://commons.wikimedia.org/w/index. php?title=File:Psoriasis_on_back.jpg&oldi d=1129251945.
Yap, S. M.; Bonsall, A. (2025) Psoriasis. Medicine, 53 (7) 441–447 DOI: https://doi.org/10.1016/j.mpmed.2025.04.019
DESIGN, SYNTHESIS AND TESTING OF A NOVEL 3,5-DIMETHOXYCINNAMIC ACID-BASED CATHEPSIN C INHIBITOR FOR THE TREATMENT OF INFLAMMATORY BOWEL DISEASE
Fillip Fuňák
Abstract
Inflammatory bowel disease (IBD), which encompasses Crohn’s disease and ulcerative colitis, affects about 5 million people worldwide and is caused by the inflammation of the gastrointestinal tract. Current treatments including surgery, anti-inflammatory medications, and cytokine inhibitors often fall short because of their limited efficacy, side effects, or narrow cytokine targeting. To address this need, this project focused on developing a novel small-molecule inhibitor for Cathepsin C (CTSC), a cysteine protease that activates serine proteases. Serine proteases are responsible for activating multiple pro-inflammatory cytokines, which induce inflammation and further elevate IBD. 3,5-dimethoxycinnamic acid was chosen as the starting scaffold, and through computational modeling in Schrödinger Maestro, over 200 different variants of 3,5-dimethoxycinnamic acid were docked to the CTSC protein. Following screening for docking scores and ADME (Absorption, Distribution, Metabolism, and Excretion) pharmacokinetic properties, structure 228 (S228) was selected as the ideal candidate and synthesized. S228 was then evaluated in vivo using the SMURF (gut leakage) assay in Drosophila melanogaster subjected to DSS (dextran sodium sulfate)-induced IBD. S228 demonstrated measurable improvements in gut integrity and survival. These results suggest that upstream inhibition of CTSC may offer a new therapeutic strategy for IBD by significantly reducing cytokine driven inflammation.
1. Inflammatory Bowel Disease
1.1 Background
Inflammatory Bowel Disease (IBD) affects about 5 million people worldwide, with cases rising each year. Today, more than 1% of adults living in the U.S. are diagnosed with IBD at some point in their lives (CDC, 2024). IBD is characterized by the inflammation of the gastrointestinal tract (GI tract) due to the overproduction and release of inflammatory cytokines that bind to receptors in the intestines, inducing inflammation. There are two main types of IBD: Crohn’s disease (CD), which can affect any part of the GI tract from the mouth to the anus and every layer of the wall lining; and ulcerative colitis (UC), which causes inflamed sores (ulcers) and is limited to the colon and rectum, affecting only the innermost colon lining (NYU Langone Health, 2025). Both conditions cause severe abdominal pain, diarrhea, rectal bleeding, nausea, weight loss and constipation, significantly reducing a patient’s quality of life. IBD is influenced by numerous environmental and genetic factors. For example, individuals with certain gene variants have weakened epithelial barriers, allowing bacteria from the colon to enter the underlying tissue, triggering an aggressive inflammatory response (Abegunde et al., 2016). The immune response in IBD is heavily driven by activated neutrophils, macrophages, and
T-cells, all of which release pro-inflammatory cytokines including Interleukin-1 beta (IL-1β ), Interleukin-6 (IL-6), Tumor Necrosis Factor-alpha (TNF-α ), Interleukin-12 (IL-12), and Interferon-gamma (IFN-γ ) (CDC, 2024). These chemical mediators cause a cycle of epithelial barrier damage and recruit more immune cells, leading to an uncontrolled and chronic immune response. There are currently no cures for IBD, with treatments aiming to reduce inflammation and produce remission (Mayo Clinic, 2017).
1.2 Current Treatments and Previous Research Conducted
Current treatments include anti-inflammatory medications, surgery to remove a part or the entirety of the colon or rectum, biologics to neutralize inflammationcausing proteins, immunomodulators and corticosteroids to suppress the immune response and the release of antiinflammatory chemicals, and small molecule inhibitors that target cytokines and inflammatory mediators (Mayo Clinic, 2017). Although these approaches can alleviate symptoms and inflammation, they are limited by inconsistent efficacy, systemic side effects, and resistance development. Recent therapies have shifted towards small-molecule inhibitors that target signaling pathways more precisely. Among these recent therapies, Janus kinase (JAK) inhibitors can target enzymes in the
immune system involved in inflammation and have shown clinical promise. Tofacitinib, commonly known as Xeljanz, is among these promising JAK inhibitors and has been approved for IBD treatment (Yang et al., 2022). However, the U.S. Food and Drug Administration (FDA) recently started warning about using tofacitinib, reporting that studies show the drug can lead to an increased risk of heart-related conditions and cancer (Mayo Clinic, 2017). Another limitation of many current inhibitors is the narrow targeting of single cytokine pathways. Many popular treatments fall under this category, such as risankizumab-rzaa (Skyrizi) which targets IL-23; mirikizumab-mrkz (Omvoh) which also targets IL-23; infliximab (Remicade) which targets TNF-α ; and tocilizumab (Actemra) which targets IL-6. However, research shows that targeting a single cytokine pathway has not achieved a widespread reduction in inflammation, making it an ineffective approach. IBD involves a complex system of inflammatory signals, meaning that only stopping one pathway leaves other inflammatory pathways that can take its place. As a result, many patients experience relapses or only have partial responses (Strober & Fuss, 2011). Because patients display diverse cytokine profiles and varying immune responses to IBD, and because IBD has a heterogeneous etiology, the key cytokine driving gut inflammation can vary from patient to patient. Without integrating patientspecific features, single cytokine therapies may cause inconsistent results (Abraham et al., 2017; Zhao et al., 2012). Therefore, by targeting upstream pathways that regulate multiple cytokines, the likelihood of suppressing the key inflammatory driver in a given patient increases.
1.3 Small Molecule Pharmaceuticals
Small molecule inhibitors are characterized by their small size/molecular weight, which increases oral bioavailability, allowing for efficient systemic delivery. Unlike large biologics such as monoclonal antibodies, small molecules can be administered orally rather than by injection, improving patient satisfaction and significantly reducing treatment costs (Makurvet, 2020). Their small size also enables them to cross cell membranes, penetrate tissues more easily and target intracellular pathways more effectively (Zhao et al., 2012). Furthermore, small molecule inhibitors are generally less expensive to produce and easier to formulate into different dosage forms (Zhao et al., 2012; Makurvet, 2020). These advantages make small molecule pharmaceuticals an attractive therapeutic target for chronic diseases such as IBD where convenient, cost effective, and long lasting treatments are desired.
1.4 Cathepsin C
Emerging research suggests that Cathepsin C (CTSC), also known as dipeptidyl peptidase I, plays a central role in regulating neutrophil activity and inflammatory signaling, making it an ideal therapeutic target for IBD. CTSC is a lysosomal cysteine protease expressed in immune cells including neutrophils, mast cells, and cytotoxic lymphocytes (Turk et al., 2001; Adkison et al., 2002; Aghdassi et al., 2024). Unlike many proteases that act independently, CTSC forms a tetramer, meaning it is built from four identical subunits that expose active sites used for protein processing (Adkison et al., 2002; Aghdassi et al., 2024). The main job of CTSC is to act as a main activator for a broad range of serine proteases. CTSC works by removing a dipeptide from the N-terminus of inactive serine protease zymogens, with the main ones being granzymes A and B, proteinase 3 (PR3), cathepsin G (CatG), neutrophil elastase (NE), NSP-4, tryptase, and mast cell chymase prompting their conversion into active forms (Aghdassi et al., 2024). Once activated, these proteases drive immune defense, tissue remodeling, and importantly, cytokine release. In IBD, CTSC becomes a key driver of mucosal damage. Activated neutrophil serine proteases (NSP’s) accumulate in the intestinal mucosa and subsequently break down the epithelial barrier (Aghdassi et al., 2024). In particular, CTSCregulated proteases trigger the release of multiple proinflammatory cytokines—including IL-1β , IL-6, TNF-α , CCL3, CXCL2, GM-CSF, and more—both directly, by stimulating immune cells, and indirectly through the chemokine-mediated recruitment of additional neutrophils, cytotoxic T-cells, mast cells, natural killer T-cells, and monocytes (Adkison et al., 2002; Aghdassi et al., 2024). This then leads to a cascade of inflammation and the recruitment of more immune cells, further increasing cytokine production and continuing tissue damage, as shown in Figure 1. This can even lead to NETosis, where neutrophils release webs of DNA and enzymes to trap pathogens, damaging tissues in the process, further inducing IBD (Adkison et al., 2002).
While this system is essential and beneficial for normal immunity, its overactivation in the gut can cause significant epithelial injury, barrier breakdown, and chronic inflammation. It is important to note that CTSC levels are elevated in IBD patients (Chitsamankhun et al., 2024). Gene knockout testing and inhibition studies have confirmed that inhibiting CTSC is safe (Chen et al., 2024). The goal of CTSC inhibition is to stop the downstream activation of serine proteases and subsequent cytokine release by CTSC-regulated proteases to reduce IBD inflammation, which would also allow the intestines to heal. Since CTSC sits at such an important intersection in the IBD inflammatory cascade,
it is a compelling target for therapies that aim to reduce cytokine mediated gut inflammation.
Figure 1: Diagram of the CTSC activation pathway that leads to IBD | Figure made by author using Biorender.
1.5 3,5-dimethoxycinnamic Acid as a Scaffold for Inhibitor Design
3,5-dimethoxycinnamic acid is a cinnamic acid derivative with two methoxy groups at the 3 and 5 positions on a benzene ring and an α , β -unsaturated carboxylic acid chain, as shown in Figure 2. 3,5-dimethoxycinnamic acid was selected as the base scaffold because the carboxylic acid group provides a functional place for further modifications and has a flexible shape, helping the structure better fit into the binding pocket of CTSC. Its structure is already known for antioxidant and anti-inflammatory properties that are sought after in IBD treatment, where oxidative stress and inflammation work together to cause intestinal tissue damage (Pagliari et al., 2023; Yeshi et al., 2024). Studies have also shown that methoxylated cinnamic acids can neutralize unstable free radicals and reduce lipid peroxidation, which could disrupt cell function and further inflammation. However, these advantages have never been applied to a CTSC inhibitor (Kikuzaki et al., 2002). Additionally, 3,5-dimethoxycinnamic acid is significantly more cost-effective compared to other starting scaffolds for CTSC inhibitors, aligning with the goal of developing an economically viable therapeutic option for IBD treatment.
Figure 2: Structure of 3,5-dimethoxycinnamic acid that was used as the starting compound for S228 | Figure made by author using MarvinSketch.
2. Scientific Aim
The goal of this project was to design, synthesize and test a novel derivative of 3,5-dimethoxycinnamic acid as a potential inhibitor of CTSC aimed to treat IBD. Using scaffold-based ligand design, computational docking, and ADME (Absorption, Distribution, Metabolism, and Excretion) property predictions, a candidate was identified and optimized. A synthesis was developed for feasibility, and the small molecule inhibitor was then synthesized and tested in Drosophila melanogaster to test the inhibitor’s performance in vivo
3. Methodology
3.1 Computational Design
3.1.1
Protein Preparation
Computational design was done in the Schrödinger Maestro Suite. The Cathepsin C protein complex (PDB 4CDE) was prepared using Protein Preparation Workflow. To prepare the protein, extra waters were removed, side chains were filled in, and a structural minimization was performed. 4CDE was selected due to its good ligand structure quality compared to other CTSC proteins in the Protein Data Bank. The CTSC binding pocket was located using the Glide Grid feature and with the help of the cognate ligand present in the PDB file.
3.1.2 Ligand Preparation
Ligands were prepared using the LigPrep feature in the Schrödinger Maestro Suite. To prepare the ligands, missing hydrogens were added, geometries were optimized, and different protonation states and stereoisomers were tested. A preparation pH of 6.5±1.0 was used for all ligands to approximate the physiological environment of the duodenum, the first portion of the small intestines where IBD most commonly occurs. This pH range was selected to ensure the designed ligand would remain active and effective by the time it reached
the therapeutic region. In addition, the condition aligns with future plans toward targeted biodelivery strategies, providing a framework for subsequent optimization.
3.1.3 Docking Score
The docking score was one of the metrics used to determine a drug candidate. It provides a computational estimate of the strength of the interaction between the CTSC binding pocket and the ligand, with a more negative number showing a higher likelihood of binding to the target binding site within the binding pocket. Before docking, the LigPrep tool was used to expand possible ionization states, enumerate stereoisomers, and generate low energy 3D structures for the ligands that would be docked to the CTSC protein. The glide feature was then used to dock all ligands to the CTSC protein. Figure 3 shows CatC inhibitor 10, a previously reported CTSC inhibitor, docked within the CTSC binding pocket (Chen et al., 2024). This docking score was saved as a baseline measurement for subsequent docking.
3: CatC inhibitor 10 (white) in the binding pocket of the CTSC protein | Figure made by author using Schrödinger Maestro.
3.1.4
Scaffold Based Ligand Design
Previous docking studies have identified CYS-234, ASP-1, ASN-380, and HIE-381 as important activation residues for CTSC inhibition, with CYS-234 being the critical and decisive determinant of inhibitory potential (Chitsamankhun et al., 2024; Chen et al., 2024). Initially, a library of structural variants were docked and analyzed. 3,5-dimethoxycinnamic acid, shown in Figure 2, was ultimately chosen as the baseline scaffold due to its improved synthetic accessibility and more
practical suitability for the intended modifications. The chosen baseline scaffold preserved the essential structural features necessary for activation while enabling a more convenient and cost effective route for further ligand development. A total of 200 ligands were designed by hand using the baseline scaffold, and the best docking ligands were selected for the next phase of pharmacokinetic selection.
3.1.5 ADME Pharmacokinetic Properties
Compounds that had the highest docking scores were selected for pharmacokinetic properties, cytotoxicity, and a Lipinski rule (serve as early indicators of potential issues with absorption, solubility, or permeability) violation screening. Ligands with two or more Lipinski violations were discarded. Additional ADME properties included QPlogHERG (predicted inhibition of HERG K+ channels), an important cardiotoxicity risk; QPlogS (predicted aqueous solubility), important for oral bioavailability; QPlogKhsa (predicted binding affinity to human serum albumin) which affects the amount of free drug available in the bloodstream; and CNS, estimated blood-brain barrier penetration of the drug. Acceptable ranges for ADME properties were selected based on the QikProp manual: a QPlogHERG score above -6 (with the CatC inhibitor 10 having a score of -6.512), a QPlogS score above -2, a QPlogKhsa score within the -1.5 and 1.5 range, a CNS score of -2, and fewer than two Lipinski rule violations (Schrödinger, 2015).
3.2 Synthesis of Ligand S228
3.2.1
Synthesis Step 1
Synthesis of S228 followed a three-step process. The first step involved the nitration of the dimethoxybenzene ring, as shown in Figure 4. 2.004 g, 9.6 mmol, of the baseline scaffold 3,5-dimethoxycinnamic acid (Sigma Aldrich) was diluted in as little acetonitrile (Sigma Aldrich) as possible in a separate beaker. Into a 50 mL round-bottom flask set over an ice bath and stir bar, 0.533 mL of conc. H 2 SO 4 (Fisher Scientific) and 0.608 mL of conc. HNO 3 (Fisher Scientific) were added. While stirring, the diluted 3,5-dimethoxycinnamic acid was added dropwise over 2 minutes into the round bottom flask. This was allowed to stir for 5 minutes, constantly over the ice bath. This mixture was then added to a 100 mL beaker filled with 50 mL of ice cold deionized H 2 O and stirred for 4 minutes to allow the nitrated solvent to precipitate out. After letting this sit for 3 minutes, the solids were vacuum filtered through a filter paper that weighed 0.255 g, and then washed with deionized H 2O. The nitrated precipitate was then diluted in a 25 mL beaker filled with 5 mL of hot
Figure
ethanol (Fisher Scientific) and immediately put into an ice bath to recrystallize for 20 minutes. The recrystallized solids were then vacuum filtered once again through a 0.231 g filter paper. The filter paper and solids were then transferred to a glass weight plate and placed in the oven to dry at 60 oC for 15 minutes. After drying, 4-nitro-3,5dimethoxycinnamic acid (compound 1) was collected and transferred to a glass vial, producing a 31.4% yield (Calvo et al., 2019). Fourier Transform Infrared (FTIR) spectroscopy, using a Shimadzu IRSpirit, was conducted to characterize the formed compound, and 0.610 g of compound 1 remained after testing.
Figure 4: Compound 1 synthesis scheme. Nitration of dimethoxybenzene ring | Figure made by author using MarvinSketch.
3.2.2 Synthesis Step 2
The second step involved the conversion of a carboxylic acid to an amide via N,N’-Dicyclohexylcarbodiimide (DCC) coupling, as shown in Figure 5. To prevent unwanted side reactions, a large excess of 1,3-diamino-2-propanol (1:10 ratio with compound 1) was used. This ensured that compound 1 molecules would predominantly react with the diamine rather than with each other, minimizing dimer formation. 0.307 g, 1.21 mmol, of compound 1 was added into a 30 mL beaker with 2.52 g, 12.2 mmol, of DCC (Sigma Aldrich) and dissolved with as little tetrahydrofuran (THF) as possible. 1.0 g, 11.09 mmol, of 1,3-diamino-2-propanol (Thermo Scientific) was added to a 25 mL round-bottom flask and dissolved with as little THF as possible. The 25 mL round-bottom flask was placed over an ice bath with a stir bar and the compound 1/DCC mixture was added dropwise to the round-bottom flask while stirring over the ice bath until all was added. The mixture was stirred at room temperature for 3 days. Reaction progress was checked half way through the reaction using thin layer chromatography (TLC) to ensure the reaction was occurring. After two days of mixing, the reaction was filtered through a vacuum filter, taken up with ethyl acetate (Fisher Scientific), and washed with sodium bicarbonate (Fisher Scientific) to produce unpurified compound 2. Subsequent TLC testing was conducted using methanol (Fisher Scientific) as the mobile phase, showing that 3,5-dimethoxycinnamic acid and (E)-N-(2-amino-3-hydroxypropyl)-3-(4-nitro-
3,5-dimethoxyphenyl) prop-2-enamide (compound 2) traveled to the solvent front while 1,3-diamino-2propanol remained at the base line. To further purify the product, column chromatography was performed, with the expectation that 1,3-diamino-2-propanol would stay in the column while the desired compound 2 would exit the column. The crude product was diluted in methanol (Fisher Scientific) and loaded onto the column to drip for 3 days. TLC was conducted once again with methanol as the mobile phase. A drop from each of the 5 vials containing dripped product from column chromatography was tested, as shown in figure 6. The contents of vials 1-3, where majority of the compound 2 was found, were added to a 25 mL round-bottom flask and methanol was roto evaporated (rotovap). After rotovap, 0.804 g of compound 2 was collected and placed in a 50 mL beaker, for a crude yield of 262%, due to the impurities and viscous state present in the compound 2 product (Herrera-Guzmán et al., 2024). FTIR spectroscopy was conducted to characterize the formed compound, and 0.610 g of compound 1 remained after testing.
Figure 5: Compound 2 synthesis scheme. Carboxylic acid to amide | Figure made by author using MarvinSketch.
Figure 6: TLC plate with samples from 5 column chromatography vials. Vials 1, 2, and 3 had the most visible compound 2 (purple) | Photo taken by author.
3.2.3 Synthesis Step 3
The third step involved the reduction of an aromatic nitro group into an amine, as shown in Figure 7. 0.50 g, 1.67 mmol, of compound 2, 0.71 mL of acetic acid (Thermo Scientific), 2.86 mL of ethanol (Fisher Scientific), and 0.286 g of fine Fe powder (Fisher Scientific) were added to a 25 mL round bottom flask. While stirring over an ice bath, 4 drops of conc. HCl were added to the round bottom flask to catalyze the reaction and stirred for 3 minutes. This addition was exothermic. After mixing, the mixture was heated to reflux for 45 minutes. A TLC was taken at time 0 and every 15 minutes after. The mixture was then removed from reflux and allowed to cool to room temperature. The mixture was then filtered by vacuum filter and rotovapped to get a concentrated thick oil. This oil was separated using a separatory funnel with 3.57 mL of ethyl acetate (Sigma Aldrich) and 1.43 mL of deionized H 2O. The product was then basified to a pH of 11 using 6 M NaOH (Fisher Scientific). This basified organic layer was then separated and washed once again with 0.71 ml x 2 sat. aq. NaHCO3 (Fisher Scientific) solution, 0.71 mL x 2 deionized H 2O, 0.71 mL NaCl, and dried with Na 2 SO 4 (Sigma Aldrich). This resulting product was then concentrated using rotovap, to give 0.038 g of S228 as a
product, for a step 3 yield of 7.6% and an overall yield of 1.52% (Nasipuri et al., 1977). An FTIR spectroscopy and an 1H-NMR spectroscopy, using the Nanalysis NMReady 60 Pro, were conducted to verify S228’s formation.
Figure 7: Compound 3 synthesis scheme. Reduction of a nitro group to an amine on the benzene ring | Figure made by author using MarvinSketch.
3.3 Biological Testing
3.3.1
Model Organism
Drosophila melanogaster was identified as the optimal model organism for preliminary in vivo screening of the anti-inflammatory efficacy of S228 due to its physiological and genetic similarities with mammalian intestines and semi-permeable intestinal anatomy. While Drosophila melanogaster lacks a direct CTSC ortholog, this model provides a valuable base for initial drug evaluation prior to more resource intensive mammalian studies. The D. melanogaster gastrointestinal tract shows conserved responses to inflammatory damage including an increased intestinal permeability and barrier disruption, which are key pathological features of IBD (Capo et al., 2019). This model also enables the compound’s bioavailability, toxicity, anti-inflammatory activity, and dose-response to be easily accessed. Additionally, due to the translucent nature of the D. melanogaster abdomen, direct visualization and characterization of intestinal tissue is possible. These preliminary data are essential for determining whether it is logical to further investigate the compound in mammalian models, where CTSCspecific inhibition can be verified.
3.3.2 Drug Dosage Methodology
Following 1H-NMR verification, S228 remained dissolved in DMSO-d 6 at a known concentration. The stock solution concentration was calculated based on the mass of S228 and the volume of DMSO-d 6 used. To prepare working treatment concentrations, dilutions were performed to achieve final concentrations: 0.1 µM, 0.5 µM, 2.5 µM, and 5.0 µM of S228. The required volume of S228/DMSO-d6 solution was calculated for each target concentration and added directly to the fly medium prior to the addition of the D. melanogaster. The final DMSO concentration in all treatment groups was calculated to not exceed 0.5% v/v to avoid toxicity using a DMSO concentration calculation.
3.3.3 Experimental Design Overview
D. melanogaster testing was split into two groups: one group received the treatment, S228, before receiving DSS (dextran sodium sulfate), a chemical that causes epithelial cell damage in the colon, to mimic IBD conditions to test S228’s potential as a preventative treatment, while the other group received the treatment, S228, after DSSinduced IBD had developed to test S228’s potential as a therapeutic treatment (Okayasu et al., 1990).
3.3.4
SMURF Assay
Figure 8 shows the SMURF assay process used to assess intestinal barrier integrity. Flies are fed food containing blue dye, which normally remains confined to the digestive tract in healthy individuals. Following exposure, flies are dissected and examined under a microscope. Intestinal barrier dysfunction, as occurs in DSS-induced IBD, results in dye leakage from the gut into the body cavity. The extent of blue coloration outside the digestive tract serves as a quantifiable measure of gut permeability and inflammation severity. The preventative group of D. melanogaster were maintained in fly medium with different treatment concentrations mixed into their food for 6 days. The D. melanogaster were then transferred to empty vials containing 2% agar for 24 hours to starve. Next, the D. melanogaster were transferred to vials containing either a 250 µL of 5% sucrose or a 5% sucrose (Carolina Biological) with 4% DSS (Spectrum Chemicals) solution soaked in a filter paper, to induce IBD for 48 hours. After the 48 hour period, the D. melanogaster were transferred to vials containing food with 2.5% w/v Brilliant Blue FCF (Sigma Aldrich) dye to feed for 24 hours (Martins et al., 2018).
The therapeutic group of D. melanogaster was also maintained in vials containing either a 250 µL of 5% sucrose or 250 µL of 5% sucrose with 4% DSS solution soaked in a filter paper, to induce IBD for 4 days. The D. melanogaster were then transferred to vials containing fly medium with different treatment concentrations mixed into their food to feed for 3 days. After the 3 day period, the D. melanogaster were transferred to vials containing food with 2.5% w/v Brilliant Blue FCF dye to feed for 24 hours (Martins et al., 2018). The flies were dissected in hemolymph ringer solution (171. 9 mM KCl, 3.0 mM MgCl2, 1.0 mM CaCl2, 25.0 mM NaCl, 10.0 mM HEPES, and 22.5 mM D-glucose adjusted to a pH level of 6.5) and examined under a dissecting microscope (Martins et al., 2018). The average blue intestinal intensity was calculated in FIJI ImageJ. The intestinal images were color deconvoluted under the Brilliant Blue setting, inverted, and a 64x64 pixel box was used as the area of measurement for all trials.
Figure 8: Diagram of SMURF assay process | Figure made by author using Google Slides. Adapted from (Livingston et al., 2020).
3.3.5 Survival Assay
Newly hatched D. melanogaster were fed and maintained according to the SMURF assay procedure. Both treatment group types were assessed for 11 days. Time-to-death recordings were recorded for each treatment group once a day. Behavioral change was also assessed twice a day by flipping the glass tubes they were in, and assessing how fast the D. melanogaster climbed back to the top. How fast this occurred was indicative of their health. Flies that took a long time would likely die within 48 hours. All deaths and significant changes were recorded (Dan et al., 2019).
3.3.6 Maintenance
Wild-type Drosophila melanogaster (Carolina Biological) were maintained at 19.1 oC in a 1:1.3 ratio of fly medium (Carolina Biological) to deionized H2O, with 4-5 grains of yeast per vial. Newly enclosed flies were iced and sorted by sex. The males were aged in groups of 6-7 flies per vial. The food in the vials was changed once the food looked fully consumed and dead D. melanogaster were removed from vials to maintain food quality.
4. Results and Discussion
4.1 Computational Modeling and Ligand Selection
The objective of the computational phase was to design a novel CTSC inhibitor using 3,5-dimethoxycinnamic acid as a scaffold, with an improved docking score and ADME pharmacokinetic properties relative to CatC inhibitor 10 (Chen et al., 2024). After the initial docking score screening, 26 compounds were selected for further pharmacokinetics, cytotoxicity, and Lipinski rule violation screening. As shown in Figure 9, S228 achieved a docking score of -7.226, a 20.4% improvement over CatC inhibitor 10. S228 also achieved a QPlogHERG score of -5.734, one Lipinski rule violation, a QPlogS
score of -1.346, a QPlogKhsa score of -0.696, and a CNS score of -2. All of these scores were within the optimal ranges outlined in Figure 10 for computational modeling and suggested that S228 would have a strong binding affinity to the Cathepsin C protein, while maintaining its favorable pharmacokinetic properties.
As shown in Figure 10, S228 formed multiple stabilizing interactions within the CTSC binding site. Specifically, S228 formed 1 salt bridge and 2 hydrogen interactions with the critical CYS-234 residue, and 1 hydrogen bond with the ASN-380, ASP-1, NAG-1119, and THR-379 residues. Together, these interactions explain S228’s high predicted docking score and its inhibitory potential. The combination of a high binding affinity, ideal pharmacokinetic properties, low synthesis cost (calculated to be ~$23.50/g), and synthetic feasibility, supported S228’s selection for synthesis and in vivo testing.
Figure 9: Computational results for top candidates. Dark green scores indicate optimal values, light green scores indicate acceptable values, and red scores indicate values outside of the threshold, and were eliminated from contention. Structure 228 (S228) was selected for synthesis due to its synthesis feasibility, high docking score and optimal ADME pharmacokinetic properties | Figure made by author using Google Sheets.
Figure 10: Ligand-protein interaction diagram of Structure 228 (S228) within the CTSC binding pocket. Pink arrows represent hydrogen bonds formed between S228 and key CTSC binding site residues, while red/blue arrows represent salt bridge interactions | Figure made by author using Schrödinger Maestro.
4.2 Synthesis and Structural Verification
4.2.1 Step 1 Synthesis Verification: FTIR
A three step synthesis was developed to synthesize S228. The purpose of the step 1 reaction was to nitrate the dimethoxybenzene ring on position 4, which would allow nitro reduction to achieve the desired amine in a following step. Following the nitration reaction, an FTIR spectrum of compound 1 showed the appearance of two new distinct absorption peaks at about 1530 cm-1 and 1340 cm-1, as shown in Figure 11, that were absent in the overlaid FTIR spectrum of the starting molecule. The new peaks corresponded to the symmetric and asymmetric N=O bonds, key indicators of successful electrophilic aromatic nitration (Chemistry LibreTexts, 2021; Smith, 2020, LibreTexts Chemistry, 2014).
Figure 11: (Top) FTIR of starting molecule compared to compound 1, and (Bottom) Zoom on FTIR showing the appearance of N=O absorption peaks, at 1530 cm-1 and 1340 cm-1 | Figure made by author using Excel.
4.2.2 Step 2 Synthesis Verification: FTIR
The purpose of the step 2 reaction was to link 1,3-diamino-2-propanol with 4-nitro-3,5dimethoxycinnamic acid by turning the carboxylic acid into an amide. Following the conversion of the carboxylic acid to an amide, the FTIR spectrum of compound 2 showed clear changes consistent with successful amide conversion, when overlaid with an FTIR of compound 1. The strong C=O peak at about 1710 cm-1, as shown in Figure 12, disappeared in the products spectrum. In its place, a sharp amide C=O (amide 1) band appeared at about 1620-1640 cm-1 and a C-N (amide 2) stretch appeared at about 1445 cm-1. Lastly, a broad band at about 3300 cm-1 appeared, corresponding to the overlapping N-H and O-H stretching bands from the amide and hydroxyl substituents (Smith, 2020; LibreTexts Chemistry, 2014).
Figure 12: (Top) FTIR of compound 1 compared to compound 2, and (Bottom) Zoom on FTIR showing the appearance of C=O and C-N absorption peaks, at 1620 cm-1 and 1445 cm-1 respectively | Figure made by author using Excel
4.2.3 Step 3 Synthesis Verification: FTIR
The purpose of the step 3 reaction was to reduce the nitro group added in step 1 into an amine. Following the nitro reduction, the FTIR spectrum of S228 showed the disappearance of the asymmetric and symmetric N=O absorption peaks at about 1530 cm-1 and 1340 cm-1, as shown if Figure 13, when overlaid with an FTIR of compound 2, indicating the reduction of the nitro functional group. Also, N-H stretching bands appeared at about 1620 cm-1 and 3300 cm-1, confirming formation of the desired aromatic amine and S228 (Chemistry LibreTexts, 2021; Smith, 2020; LibreTexts Chemistry, 2014).
Figure 13: (Top) FTIR of compound 3 compared to S228, and (Bottom) Zoom on FTIR showing the disappearance of the N=O absorption peaks at 1530 cm-1 and 1340 cm-1 | Figure made by author using Excel.
4.2.4 Overall Synthesis Verification: 1H-NMR
The purpose of conducting a 1H-NMR spectroscopy on S228 was to further confirm successful synthesis of the final compound and verify its structure. S228’s experimental 1H-NMR spectra was compared to S228’s predicted 1H-NMR spectra in NMRium. The experimental spectrum showed two sharp singlets at 3.7-3.9 ppm, representing the two methoxy groups attached at the 3 and 5 positions of the benzene ring of S228. There were also multiplets present in the 1.0-3.5 ppm range, corresponding to the aliphatic CH and CH2 protons of the 1,3-diamino-2-propanol substituent. In the aromatic region, peaks appeared between 6.8-7.6 ppm, consistent with the expected aromatic protons of the benzene ring in S228. There were also multiplets present in the 4.55.0 ppm range, corresponding to the hydroxyl and amine group protons. The predicted and experimental spectra showed strong alignment in both the chemical shifts and relative intensities of the peaks, confirming that the synthesized compound structure matched with S228’s structure. Overall, the 1H-NMR data worked with the FTIR data, verifying the successful synthesis of S228.
4.3 Preventative Efficacy of S228: SMURF Assay
A characteristic structural change that occurs in IBD patients is a high gastrointestinal tract permeability, which can cause poor digestion, nutrient malabsorption, and a wide range of symptoms, as mentioned earlier. The objective of the SMURF assay was to visualize the integrity of the intestinal barrier in D. melanogaster when treated with various doses of S228. As shown in Figure 14, the SMURF assay was used to test whether S228 could prevent intestinal barrier damage when given before DSSinduced IBD. After dissection and quantification of the average blue intestinal intensity using FIJI ImageJ, doses of 0.1 µM, 0.5 µM, and 2.5 µM of S228 yielded average blue intensities of 95.68%, 97.61%, and 98.40% respectively. These values indicate strong intestinal barrier integrity, with higher percentages representing healthier guts where the blue dye remained confined within the intestinal tract rather than leaking into surrounding tissues. The 0.1 µM and 2.5 µM doses of S228 reached p-values<0.05, while the 0.5 µM dose of S228 reached a p-value<0.01 when compared to the negative control with no treatment (negative control w/ IBD group), which yielded an average blue intensity of 51.22%, indicating severe gut barrier damage and inflammation, as shown in Figures 14 and 15. These statistical results suggest that S228 was very effective in preventing damage to the gut barrier and lowering intestinal permeability when given as a preventative treatment at all of the concentrations tested, even having higher average blue intensities than healthy D. melanogaster. But more specifically, these findings suggest that moderate concentrations of S228 are optimal for preventing intestinal barrier damage, while higher concentrations may cause mild stress responses in D. melanogaster.
Figure 14: SMURF assay intestines results. Flies were dissected and observed under a microscope. The blue dye intensity was quantified and the average percentage was calculated for each treatment group. A higher average blue intensity percentage indicates a healthier gut with less inflammation. Only 1 trial of the 2.5 µM Preventative dose was conducted | Figure made by author using Google Slides.
Figure 15: Average blue intensity for preventative treatment comparison graph. Flies were pre-treated with various dosages of S228 prior to DSS-induced IBD, to test S228 efficacy as a preventative treatment. Bars represent mean ± SD of blue intensity for each treatment group, with higher values indicating healthier, less inflamed intestines. A One-way ANOVA with Tukey’s post-hoc test was conducted. Asterisks (*) denote significant differences relative to the negative control w/IBD group; *p<0.05, **p<0.01, and ns = not significant. Statistical analysis was conducted using RStudio software | Figure made by author using RStudio.
4.4 Therapeutic Efficacy of S228: SMURF Assay
As shown in Figure 16, the SMURF assay was also used to test whether S228 could limit intestinal barrier damage when given after DSS-induced IBD had already developed. Healthy flies on a control diet retained on average 93.18% blue intensity, while flies on a control diet with DSSinduced IBD retained on average 51.22% blue intensity, as shown in Figure 14. Healthy flies that were treated with S228 after being exposed to DSS once again retained noticeable higher blue intensity on average. When given a dose of 0.5 µM of S228, a moderate recovery towards healthy levels was observed, retaining on average 77.67% blue intensity. Looking at Figure 14, gut morphology appeared visually more intact under the microscope with the 0.5 µM dose, compared to the negative control w/ IBD group. These results suggest the potential for S228 to restore the gut barrier integrity, even after inflammatory damage, having higher average blue intensities than D. melanogaster with IBD and no treatment. However, since statistical testing provided p-values>0.05, these findings suggest that S228 functions more efficiently as a preventative treatment than as a therapeutic treatment, although further experimentation is needed.
Figure 16: Average blue intensity for therapeutic treatment comparison graph. Flies were treated with various dosages of S228 after DSS-induced IBD, to test S228’s efficacy as a therapeutic treatment. Bars represent mean ± SD of blue intensity for each treatment group, with higher values indicating healthier, less inflamed intestines. A One-way ANOVA with Tukey’s post-hoc test was conducted. Asterisks (*) denote significant differences relative to the negative control w/IBD group; *p<0.05, **p<0.01, and ns = not significant. Statistical analysis was conducted using RStudio software | Figure made by author using RStudio.
4.5 Toxicity Evaluation of S228: Survival Assay
The survival assay was used to test the lifespan of D. melanogaster with DSS-induced IBD in the presence of S228, and to determine S228’s toxicity and protective effects when given as a preventative and therapeutic treatment. Survival was recorded daily and analyzed using the Kaplan-Meier method with a log-rank (MantelCox) test, which showed significant difference among treatment groups, with an overall p-value<0.0001, as shown in Figure 17. In the preventative treatment groups, flies that received low to medium concentrations of S228, from 0.1 µM to 2.5 µM, had survival rates comparable to healthy control flies, suggesting these doses of S228 were not toxic and may have provided some protective benefit. However, at the highest concentration of S228, 5.0 µM, flies exhibited a rapid decline in survival, indicating dosedependent toxicity.
In the therapeutic treatment groups, flies that received the lowest dose of S228, 0.1 µM, exhibited a rapid decline in survival, suggesting that a very low dose of S228 may not improve lifespan after DSS-induced IBD has developed, as shown in Figure 17. Flies that received a medium-low dose of S228, 0.5 µM, had similar survival to DSS-induced IBD control flies, suggesting S228 did not significantly extend lifespan after DSS-induced IBD had developed. However, these flies did not show significant additional mortality, suggesting that S228 was well tolerated at a medium-low dose, even after IBD had developed. It is worth noting that some mortality may have been caused from flies sticking to the glass culture tubes in which they
were maintained rather than from physiological toxicity. Overall, these findings suggest that S228 is non-toxic at low to moderate doses and may even provide protective benefits when administered preventatively. When given therapeutically, a medium low dose may extend survival, but will only moderately recover the gut barrier’s integrity.
Figure 17: Survival curves for D. melanogaster treated with S228 under preventative and therapeutic treatments. Flies were treated with various dosages of S228 either none (negative control), before (preventative) or after (therapeutic) DSS-induced IBD, to evaluate S228’s efficacy and potential toxicity. Survival probability (%) was calculated and analyzed using the Kaplan-Meier method with a log-rank (Mantel-Cox) test. The overall comparison across all treatment groups was statistically significant (p<0.0001). Statistical analysis was conducted using RStudio software | Figure made by author using RStudio
5. Limitations
As always, there are some limitations to this research. Because D. melanogaster lacks a direct CTSC ortholog, these results cannot definitively confirm that S228 inhibits CTSC. The observed anti-inflammatory effects may be caused by alternate pathways and mechanisms. Due to the limited budget for this project, S228 couldn’t be tested directly in a CTSC protein assay. Also, due to time and resource constraints on this project, experiments were conducted with small sample sizes, limiting the statistical power of the findings. A larger number (n≥30) of D. melanogaster are needed to further validate and reproduce these conclusions. Other sources of variability may include fly handling during dissection, environmental factors that occurred during fly maintenance, and differences in lighting during image analysis. Therefore, all of these findings should be considered preliminary. Despite these limitations, the results provide promising early evidence that S228 is a low-toxicity inhibitor that has preventative and therapeutic benefits for IBD treatment.
6. Conclusion
This is the first known study that successfully designed, synthesized, and tested a 3,5-dimethoxycinnamic acid based small molecule inhibitor, S228, for Cathepsin C to treat IBD. Computational modeling identified S228 as a strong drug candidate due to its high docking score, favorable pharmacokinetic properties, and low synthesis cost. FTIR and 1H-NMR spectroscopy confirmed S228’s three step synthesis, expressing all of the expected peaks on the FTIR, and a purified product was achieved. In vivo results in Drosophila melanogaster demonstrated that S228 effectively preserved the intestinal barrier’s integrity when under DSS-induced inflammatory conditions, and was well tolerated at low to moderate concentrations, showing S228’s efficacy and safety in a biological organism.
These findings are significant because they show that modifying the 3,5-dimethoxycinnamic acid scaffold can yield a compound that has anti-inflammatory activity and good predicted CTSC binding activity for IBD treatment. This approach could provide a more effective and direct, cost-effective, and orally deliverable method for treating IBD compared to traditional cytokine inhibitors. By combining computational design, chemical synthesis, and biological testing, this project created a framework for small-molecule drug discovery that is accessible, scalable and worthy of further development.
7. Future Directions
Future research will focus on conducting an in vitro cellular assay using purified human CTSC protein to validate S228’s inhibitory activity. The optimization of the dose-dependent response of S228 will also be explored to find the most suitable dose for subsequent studies. To improve targeted biodelivery, the use of cellulose acetate phthalate (CAP) will be further developed as a pH sensitive coating for S228. CAP dissolves at a pH of around 6.0, matching the environment of the duodenum, a primary location for inflammation in IBD. The goal of this coating would be to protect S228, shielding the drug from damage or degradation before it reaches the desired therapeutic region. Finally, S228 will be tested in mammalian models that directly possess a CTSC homolog comparable to a human’s, to further validate S228’s efficacy and toxicity in vivo
8. Acknowledgments
I would like to thank my mentor Dr. Timothy Anglin and Dr. Michael Bruno for their constant support throughout this project, Dr. Heather Mallory, Mr. Antonio Lopez, and Dr. Darrell Spells for their help with synthesis
and biological testing, the NCSSM Summer Research and Innovation Program, the NCSSM Science Department, the NCSSM Foundation for providing funding for this research, and my Research in Chemistry classmates, for helping make this research possible.
All computational data in this study were generated by the author, except for the CTSC protein structure (PDB ID: 4CDE), which was retrieved from the Protein Data Bank.
9. References
Abraham, C., Dulai, P. S., Vermeire, S., & Sandborn, W. J. (2017). Lessons learned from trials targeting cytokine pathways in patients with inflammatory bowel diseases. Gastroenterology, 152(2), 374-388.e4. https://doi. org/10.1053/j.gastro.2016.10.018
Abegunde, A. T., Muhammad, B. H., Bhatti, O., & Ali, T. (2016). Environmental risk factors for inflammatory bowel diseases: Evidence based literature review. World Journal of Gastroenterology, 22(27), 6296. https://doi. org/10.3748/wjg.v22.i27.6296
Adkison, A. M., Raptis, S. Z., Kelley, D. G., & Pham, C. (2002). Dipeptidyl peptidase I activates neutrophilderived serine proteases and regulates the development of acute experimental arthritis. Journal of Clinical Investigation, 109(3), 363–371. https://doi.org/10.1172/ jci13462
Aghdassi, A. A., Pham, C., Zierke, L., Mariaule, V., Korkmaz, B., & Rhimi, M. (2024). Cathepsin C role in inflammatory gastroenterological, renal, rheumatic, and pulmonary disorders. Biochimie, 216, 175–180. https:// doi.org/10.1016/j.biochi.2023.09.018
Calvo, R., Zhang, K., Passera, A., & Katayev, D. (2019). Facile access to nitroarenes and nitroheteroarenes using N-nitrosaccharin. Nature Communications, 10. https:// doi.org/10.1038/s41467-019-11419-y
Capo, F., Wilson, A., & Di Cara, F. (2019). The intestine of Drosophila melanogaster: an emerging versatile model system to study intestinal epithelial homeostasis and host-microbial interactions in humans. Microorganisms, 7(9), 336. https://doi.org/10.3390/ microorganisms7090336
CDC. (2024, July 22). IBD facts and stats. Inflammatory Bowel Disease (IBD). http://www.cdc.gov/inflammatorybowel-disease/php/facts-stats/index.html
Chen, X., Lou, Y., Zhou, F., Shi, D., Liu, X., & Tao, F. (2024). Identification of novel indolinone derivatives as CTSC inhibitors to treat inflammatory bowel disease by modulating inflammatory factors. European Journal of Medicinal Chemistry, 280, 116914. https://doi. org/10.1016/j.ejmech.2024.116914
Chemistry LibreTexts. (2021, December 15). 6.3: IR Spectrum and Characteristic Absorption Bands. http:// chem.libretexts.org/Bookshelves/Organic_Chemistry/ Organic_Chemistry_I_%28Liu%29/06%3A_Structural_ Identification_of_Organic_Compounds-_IR_and_ NMR_Spectroscopy/6.03%3A_IR_Spectrum_and_ Characteristic_Absorption_Bands
Chitsamankhun, C., Siritongtaworn, N., Fournier, B. P. J., Sriwattanapong, K., Theerapanon, T., Samaranayake, L., & Porntaveetus, T. (2024). Cathepsin C in health and disease: from structural insights to therapeutic prospects. Journal of Translational Medicine, 22(1). https://doi. org/10.1186/s12967-024-05589-7
D. Nasipuri, Dalala, I. D., & Ghosh, S. K. (1977). Heterocyclic Systems; II. An One-step Synthesis of Benzo[b]naphtho [2,1-d]thiophene Derivatives 1. Synthesis, 1977(01), 59–61. https://doi.org/10.1055/s-1977-24279
Dan, P., Sundararajan, V., Harsana Ganeshkumar, Barathan Gnanabarathi, Subramanian, A., G. Devanand Venkatasubu, Sahoko Ichihara, Gaku Ichihara, & Sahabudeen Sheik Mohideen. (2019). Evaluation of hydroxyapatite nanoparticles - induced in vivo toxicity in Drosophila melanogaster. Applied Surface Science, 484, 568–577. https://doi.org/10.1016/j.apsusc.2019.04.120
Herrera-Guzmán, K., Jaime-Vasconcelos, M. Á., Torales, E., Itzel Chacón, Rubén Gaviño, Eréndira García-Ríos, Cárdenas, J., & Morales-Serna, J. A. (2024). A practical method for the synthesis of small peptides using DCC and HOBt as activators in H2O–THF while avoiding the use of protecting groups. RSC Advances, 14(54), 39968–39976. https://doi.org/10.1039/d4ra07847k
Kikuzaki, H., Hisamoto, M., Hirose, K., Akiyama, K., & Taniguchi, H. (2002). Antioxidant properties of ferulic acid and its related compounds. Journal of Agricultural and Food Chemistry, 50(7), 2161–2168. https://doi. org/10.1021/jf011348w
Livingston, D. B. H., Patel, H., Donini, A., & MacMillan, H. A. (2020). Active transport of brilliant blue FCF across the Drosophila midgut and Malpighian tubule epithelia. Comparative Biochemistry and Physiology Part A: Molecular & Integrative Physiology, 239, 110588. https:// doi.org/10.1016/j.cbpa.2019.110588
Makurvet, F. D. (2020). Biologics versus small molecules: Drug costs and patient access. Medicine in Drug Discovery, 9(9), 100075. https://doi.org/10.1016/j. medidd.2020.100075
Martins, R. R., McCracken, A. W., Simons, M. J. P., Henriques, C. M., & Rera, M. (2018). How to catch a smurf? – ageing and beyond… in vivo assessment of intestinal permeability in multiple model organisms. Bio-Protocol, 8(3). https://doi.org/10.21769/BioProtoc.2722
Mayo Clinic. (2025). Inflammatory bowel disease (IBD) - Diagnosis and treatment. Mayoclinic.org. http://www. mayoclinic.org/diseases-conditions/inflammatorybowel-disease/diagnosis-treatment/drc-20353320
NYU Langone. (2025). Types of inflammatory bowel disease. Nyulangone.org. http://nyulangone.org/ conditions/inflammatory-bowel-disease/types
Okayasu, I., et al. A novel method in the induction of reliable experimental acute and chronic ulcerative colitis in mice. Gastroenterology, vol. 98, no. 3, 1 Mar. 1990, pp. 694–702, pubmed.ncbi.nlm.nih.gov/1688816/, https:// doi.org/10.1016/0016-5085(90)90290-h
Pagliari, S., Forcella, M., Lonati, E., Sacco, G., Romaniello, F., Rovellini, P., Fusi, P., Palestini, P., Campone, L., Labra, M., Bulbarelli, A., & Bruni, I. (2023). antioxidant and antiinflammatory effect of cinnamon (Cinnamomum verum J Presl) bark extract after in vitro digestion simulation Foods, 12(3), 452. https://doi.org/10.3390/foods12030452
Schrödinger, LLC. (2015). QikProp 4.4 user manual.
Smith, B. C. (2020). Organic Nitrogen Compounds, VII: Amides—The Rest of the Story. Spectroscopyonline.com; Spectroscopy Online. http://www.spectroscopyonline. com/view/organic-nitrogen-compounds-vii-amidesrest-story
Strober, W., & Fuss, I. J. (2011). Proinflammatory cytokines in the pathogenesis of inflammatory bowel diseases. Gastroenterology, 140(6), 1756–1767. https:// doi.org/10.1053/j.gastro.2011.02.016
Turk, D., Janjić, V., Štern, I., Podobnik, M., Lamba, D., Weis Dahl, S., Lauritzen, C., Pedersen, J., Turk, V., & Turk, B. (2001). Structure of human dipeptidyl peptidase I (cathepsin C): exclusion domain added to an endopeptidase framework creates the machine for activation of granular serine proteases. The EMBO Journal, 20(23), 6570–6582. https://doi.org/10.1093/ emboj/20.23.6570
Yang, T., Cui, X., Tang, M., Qi, W., Zhu, Z., Shi, M., Yang, L., Pei, H., Zhang, W., Xie, L., Xu, Y., Yang, Z., & Chen, L. (2022). Identification of a novel 2,8-diazaspiro[4.5] decan-1-one derivative as a potent and selective dual tyk2/jak1 inhibitor for the treatment of inflammatory bowel disease. Journal of Medicinal Chemistry, 65(4), 3151–3172. https://doi.org/10.1021/acs.jmedchem.1c01137
Yeshi, K., Tenzin Jamtsho, & Phurpa Wangchuk. (2024). Current treatments, emerging therapeutics, and natural remedies for inflammatory bowel disease Molecules, 29(16), 3954–3954. https://doi.org/10.3390/ molecules29163954
Zhao, L., Ren, T., & Wang, D. D. (2012). Clinical pharmacology considerations in biologics development. Acta Pharmacologica Sinica, 33(11), 1339–1347. https:// doi.org/10.1038/aps.2012.51
TANNIC ACID LOADED pHEMA-QUATERNARY CHITOSAN
HYDROGELS FOR USE AS ANTIMICROBIAL CONTACT LENSES
Rebekah Switzer
Abstract
Contact lenses are a popular tool for vision correction, with an estimated 140 million users globally. Contact lens usage drastically increases the risk of developing bacterial keratitis, an infection in the cornea caused by common bacteria when lenses are mishandled. Bacterial keratitis is typically treated with antibiotic-loaded eye drops, but this treatment is suboptimal due to the potential development of antibiotic resistant bacteria. This project developed a hydrogel using hydroxyethyl methacrylate (HEMA), crosslinking with poly(ethylene glycol) dimethacrylate, and incorporating quaternized chitosan through crosslinking and tannic acid through hydrogen bonding. This combination was decided on for improved antimicrobial activity while maintaining ideal mechanical properties and hydrophilicity. Data on water content, water contact angle, transmittance, tensile strength, and bacterial inhibition were collected. Water content for all hydrogels fell within the lower limit of HEMA contact lenses, near the natural water content of HEMA. Water contact angles showed that the gels were extremely hydrophilic. Transmittance showed some blocking of light that increased as tannic acid concentration increased and potential UVA blocking properties. Tensile testing showed reasonable although slightly high Young’s modulus scores. Bacterial testing showed significant inhibition with higher concentrations of tannic acid. Further biocompatibility testing is a necessary next step towards use as a contact lens material to prevent bacterial keratitis and reduce unnecessary antibiotic usage.
1. Introduction
1.1
Contact Lens-Associated Bacterial Keratitis
With an estimated 140 million global contact lens users, contact lenses are an extremely popular tool for vision correction (Ezinne, 2022). Wearing contact lenses drastically increases the risk of developing bacterial keratitis, an infection in the cornea–the clear dome on the surface of the eye. Contact lens-associated keratitis occurs in 2-4 out of 10,000 contact lens wearers, with 90% of the cases attributed to bacteria (Maier, 2022). One million US health care visits for keratitis or other contact lens complications occur annually (Cope, 2015). The infection is typically caused by Pseudomonas aeruginosa or Staphylococcus aureus, both highly common bacteria that can easily come in contact with the eye if contact lenses are not cleaned and handled properly during and after each use. The most common symptoms of bacterial keratitis are pain and redness in the eye, but if left untreated can result in vision loss or even blindness (Cope, 2015).
1.2 Previous Solutions to Bacterial Keratitis
Typically, bacterial keratitis is treated with antibioticloaded eye drops. To help prevent the initial development of bacterial keratitis, improvements can be made directly to contact lenses to prevent bacteria from adhering to the lens and growing on the cornea. Multiple contact lens solutions with antimicrobial capabilities have been developed, decreasing bacterial adhesion or killing surface-level bacteria to prevent potentially harmful infections. These solutions include metal nanoparticles and direct release of antibiotics into the eye through drugloaded contact lenses (Ahmad Khan, 2020). While both of these methods have proved effective, they also present significant risks. Metal nanoparticles can be toxic to the eye if they penetrate the epithelial barrier, causing stress and apoptotic damage (Cao, 2022). Excess antibiotic usage can lead to the development of antibiotic-resistant bacteria and cause exaggerated inflammatory responses during treatment. Therefore, altering the contact hydrogel itself could provide a biocompatible option with lower risk to human health.
1.3 Contact Lens Materials and Properties
Hydroxyethyl methacrylate (HEMA) is an oxygenpermeable monomer with a naturally high water content due to polar properties originating from the negatively charged hydroxyl group (see Figure 1). These characteristics allow for wetting of the surface of the hydrogel, improving comfort on the surface of the eye (Musgrave, 2019). HEMA is known as a biocompatible and hydrophilic monomer with ideal mechanical properties for contact lens production (Deng, 2024).
Figure 1. Chemical structure of 2-hydroxyethyl methacrylate. Figure reprinted from Sigma-Aldrich, (Product No. 477028), Merck KGaA.
Polyacrylamide (PAM) is another monomer that has been used for contact lenses, but it is not ideal due to risks associated with unreacted acrylamide monomers during synthesis, lower oxygen permeability, and lower hydrophilicity compared to HEMA (Jiao, 2022). Lenses need to be hydrophilic to remain wetted and comfortable in the eye and oxygen permeable to ensure the cornea receives needed oxygen to remain healthy with prolonged contact lens usage.
1.4 Quaternized Chitosan Properties
Chitosan is derived from chitin, which is naturally found in the cell walls of crustaceans, fungi, insects, and microorganisms (Pellis, 2022). It is a popular choice for medical applications due to its biocompatibility, biodegradability, and antimicrobial properties. For contact lens applications, chitosan’s moisture retention would help to keep the lens hydrated and comfortable. Chitosan’s antimicrobial activity is derived from its interactions with negatively charged microbial cell membranes, causing structural damage and leakage of intracellular components (Pellis, 2022). Introducing quaternary ammonium structures onto the chitosan macromolecule, as shown in Figure 2, improves solubility, effectiveness over a wide pH range, and biocompatibility (Pellis, 2022). The new structure is referred to as quaternary chitosan and is a better candidate for incorporation into a contact lens hydrogel because of these changes to its chemical properties.
Figure 2. Chemical structure of quaternary chitosan ammonium salt. Figure reprinted from SigmaAldrich, (Product No. 933899), Merck KGaA.
1.5 Tannic Acid Properties
Tannic acid is a natural polyphenol with promising antimicrobial and antioxidant properties. Antioxidant properties come from numerous hydroxyl groups in the chemical structure that donate electrons to neutralize free radicals (Figure 3). Antimicrobial activity is carried out when the molecule interacts with and disrupts cell membranes of bacteria, fungi, and viruses, leading to cell lysis and death. These two properties inhibit bacterial growth without causing damage to the eye when tannic acid is released, preventing bacterial infection and eliminating the need of antibiotics for treatment (Jiao, 2022).
Figure 3. Chemical structure of tannic acid. Figure reprinted from “Tannic acid,” ACS Molecule of the Week, January 16, 2018, American Chemical Society.
1.6 Past Research Conducted
One method that has been developed to improve the hydrogel structure is incorporating quaternized chitosan salt, also known as hydroxypropyltrimethyl ammonium chloride chitosan (HACC), as a macromolecular crosslinker. Quaternized chitosan is used for enhanced antimicrobial properties, increased tear protein deposition resistance, and improvements in mechanical properties of the hydrogel. HACC was used rather than regular chitosan for increased water solubility through added quaternary ammonium structures (Lin, 2022). Natural polyphenols, such as tannic acid or epigallocatechin gallate, have also been incorporated into contact lens hydrogels in previous research to improve antimicrobial properties (Jiao, 2022) (Lin, 2025). There are multiple potential monomers that can be used to form contact lens hydrogels and could be combined with tannic acid and HACC, such as polyacrylamide (PAM) and 2-hydroxyethyl methacrylate (HEMA). HEMA is generally considered a better monomer for contact lenses than PAM due to its oxygen permeability, mechanical properties, and drug-releasing capabilities, but has not previously been used in conjunction with tannic acid in contact lens applications.
1.7 Hypothesis
This study aimed to crosslink HEMA with quaternized chitosan and incorporate tannic acid in a hydrogel that could function as a contact lens material. This formulation is expected to improve antimicrobial activity from added functional groups while maintaining ideal hydrophilicity and mechanical properties for comfort.
2. Materials and Methods
2.1 Materials
2,2’-azobis (2-methylpropionitrile) (AIBN), 2-hydroxyethyl methacrylate (HEMA), and poly(ethylene glycol) dimethacrylate (PEGDMA) were obtained from Sigma Aldrich. Quaternary chitosan ammonium salt was obtained from Mark Nature through Amazon. Tannic acid was obtained from Alfa Aesar. K-12 E. coli was obtained from Carolina Biological.
2.2
Synthesis of pHEMA-QCS Hydrogels
pHEMA-QCS hydrogels were synthesized by first dissolving 10 mg quaternary chitosan ammonium salt in 1240 μL deionized water. Next, 6 mL HEMA, 120 μL methacrylic anhydride, and 140 μL PEGDMA were added and vortexed to mix for 3-5 minutes. After thoroughly
combining, 7.3 mg of the thermal initiator, AIBN, were dissolved in methanol and vortexed into the solution. The hydrogels were then placed in the oven on a teflon sheet within a glass dish at 65°C for 24 hours. After synthesis, the hydrogels were soaked in deionized water for a minimum of 12 hours, allowing for swelling until equilibrium.
2.3 Incorporation of Tannic Acid
Tannic acid was introduced after initial synthesis to prevent disruption of initial crosslinking. After successful synthesis and initial hydration, hydrogels were dried in an oven at 65°C for 24 hours and placed in solutions of varying concentrations of tannic acid (0, 5, 10, 15 g/L) to incorporate the compound into the hydrogel matrix through hydrogen bonding.
2.4 Equilibrium Water Content
Equilibrium water content was determined gravimetrically, with a sample size of 5 gel pieces. Wet hydrogels were massed after removing surface water with a paper towel, and placed in an oven at 65°C. Hydrogels were massed again until constant mass was achieved, and equilibrium percent water content was calculated using the below formula:
2.5 Water Contact Angle Test
A 50 μL drop of water was micropipetted onto a flat disk of hydrogel. Images were taken on a Moto G Power 5G smartphone, aligned parallel to the flat hydrogel surface to ensure consistent measurement of droplet angles. ImageJ was used to quantify the angle between the gel and the water droplet formed.
2.6 Transmittance
Transmittance was measured using a Vernier spectrophotometer (Spectro-Vis). The instrument was calibrated without a cuvette, and a strip of hydrogel between 1-2 mm thickness was suspended over the light source during data collection.
2.7 Tensile Testing
Hydrogels were initially cut into a dogbone shape, as shown in Figure 4, to ensure the thin center section of the sample was consistently the weakest point. Dimensions
(length, width, and thickness) were measured using a caliper. Force and displacement data were collected using a Vernier Structures & Materials Tester. These data were converted into a stress strain curve, using the equations below, and Young’s modulus was calculated using the slope of the linear portion of the stress-strain graph.
Figure 4. Dog-bone shaped design. Figure reprinted from (Guo, 2024).
2.8 Antimicrobial Activity
Bacterial solution from E. coli suspended in Lysogeny Broth was determined to have an absorbance at 600 nanometers less than 1.00 for adequate colony growth. Bacterial solution samples of 200 μL each were then micropipetted into six dilution tubes. Hydrogel samples of nearly equal masses were submerged in each solution, including a positive control with only bacterial solution, and then incubated in a shaker overnight at 37°C. After incubation, the samples were serially diluted to a concentration of 1:106 and spread on agar plates (n=5) to incubate for 15 hours at 35°C. Plates were imaged after incubation and colonies were counted using ImageJ software.
3. Results and Discussion
3.1 Evaluation of Equilibrium Water Content
The recorded equilibrium water content for all hydrogels tested–including HEMA hydrogels crosslinked with only PEGDMA and no quaternary chitosan (QCS), those crosslinked with QCS in addition to PEGDMA, and
gels with various concentrations of tannic acid of both versions–fell near the water content of pure HEMA of 38%. This value is typical for HEMA-based hydrogels (see Figure 5).
Figure 5. Hydrogels were massed (N=5) before and after drying at 65°C to determine initial percent water content after soaking in DI water until equilibrium. Graph created by student researcher using Excel, 2025.
Both crosslinking quaternary chitosan and incorporating tannic acid had no apparent impact on water content. These hydrogels would be classified as low water contact lenses, indicating less water drawn from the eye to hydrate the hydrogels (Feel Good Contacts, 2026).
3.2 Water Contact Angle Evaluation
Water contact angles of a droplet of water on gel were measured to determine hydrophilicity. Angles were quantified using ImageJ. All water contact angles recorded fell between 20-40 degrees (Figure 6). Angles smaller than 90 degrees indicated that all hydrogels were highly hydrophilic. Crosslinking quaternary chitosan showed an increase in water contact angle, from an angle around 25 degrees for the gel with no quaternary chitosan to 35 degrees with chitosan incorporated, indicating decreased hydrophilicity. Increasing tannic acid concentration had no evident impact on water contact angle–there was no clear increase or decrease in angles as more concentrated tannic acid solutions were used. The gel with QCS and no tannic acid resulted in an angle of 35 degrees, similar to the gel with QCS and 10 g/L tannic acid.
Figure 6. A) Water contact angle visuals resulting from a drop of water deposited on a flat gel sample. Angles were determined using ImageJ. Images taken by student researcher, 2025. B) Average water contact angles (N=3) for all gels. Graph created by student researcher using Excel, 2025.
3.3 Tensile Testing of Hydrogels
In addition to data on equilibrium water content and water contact angles, the flexibility of the hydrogels was tested. Young’s modulus of elasticity is a measure of the rigidity of a material, with a higher modulus indicating a stiffer material and a lower modulus indicating a more flexible material. The modulus of a contact lens ideally falls within the range of 0.2 to 1.5 MPa, indicating a low likelihood of breaking while moving in the eye without feeling too rigid. Nearly all tested hydrogels fell within the ideal range, with the average modulus of the control containing no quaternary chitosan or tannic acid falling slightly outside of this ideal range at 1.52 MPa (Figure 7). Incorporating tannic acid had the largest impact on the modulus, showing decreased values for all concentrations when compared to pHEMA-QCS hydrogels, indicating more flexibility for all concentrations.
Figure 7. Young’s modulus values calculated using the slope of the best-fit line of the linear portion of stress vs strain curves (N=3). Graph created by student researcher using Excel, 2025.
3.4 Analyzing Transmittance of Hydrogels
Transmittance was tested to determine visibility when using contact lenses. Nearly all hydrogels had an absorbance peak near 380 nanometers, with overall transmittance decreasing as tannic acid concentration increased (Figure 8). Transmittance values are likely lower than those of contact lenses made from the same material. This is due to the inability to standardize the synthesis process. Gel pieces were significantly thicker (1-2 mm) than commercially available contact lenses (0.2 mm). Increased thickness caused increased absorbance in samples tested when compared to a theoretical contact lens made from the material. There also appears to be absorbance of UVA radiation based on the absorbance at the lowest recorded wavelengths, which could be beneficial in a contact lens to prevent this radiation from damaging the eyes. Further testing would need to be completed on absorbance over UV wavelengths to quantify.
Figure 8. Percent transmittance of all gels (N=3) was determined through spectroscopy. Graph created by student researcher using Excel, 2025.
3.5 Bacterial Analysis
Tannic acid was added to the hydrogels after initial synthesis to improve bacterial keratitis prevention as a substitute for antibiotics. Antimicrobial activity of all hydrogels was assessed by incubating gel samples in a bacterial solution overnight. After performing 1:106 serial dilutions, the solutions were spread on agar plates and incubated for 15 hours (Figure 9).
Figure 9. Images analyzed of bacterial colony growth. All plates labeled with tannic acid concentrations also contain quaternary chitosan. Images taken by student researcher, 2025.
Gels soaked in tannic acid solutions of 10 g/L and 15 g/L showed substantial inhibition of bacteria, with an average of 269 and 227 colonies, respectively, compared to a control of 538 colonies (Figure 10). These gels also showed less deviation from the mean over multiple trials, showing statistical significance compared to control with a student T test. All other gels tested had relatively similar numbers of colonies grown, and no statistical significance (p > 0.05) when compared to the control. QCS on its own did not appear to improve antimicrobial activity, whereas tannic acid had a much larger impact.
Figure 10. Colony counts (N=5) of bacterial solution incubated overnight with gel samples, determined using ImageJ software. * indicates p < 0.05 when compared to control of only bacteria. Graph created by student researcher using Excel, 2025.
4. Conclusions
The pHEMA-QCS hydrogels were successfully synthesized, incorporating tannic acid after initial synthesis. The addition of quaternary chitosan (QCS) to hydrogels had no clear impact on water content and caused a slight increase in water contact angle. Additionally, tannic acid had no clear impact on water contact angle or equilibrium water content. All data values remained near the typical water content of HEMA of 38% and all water contact angles showed strong hydrophilicity, ideal for comfortable contact lenses, demonstrating that the addition of tannic acid does not affect the hydrophilicity of the pHEMA-QCS. Stress vs. strain data yielded Young’s modulus values within the reasonable range for contact lenses, from 0.2 to 1.5 MPa, with QCS and tannic acid both resulting in lower modulus values. Transmittance data indicated a substantial amount of light absorbed, increasing as tannic acid concentration increased, with highest absorbance at the lowest wavelengths of visible light. This is not ideal to provide contact lenses with high visibility, but could be attributed to the increased thickness of the gel samples tested compared to contact lens thickness; gels tested ranged from 1-2 mm thickness, while contact lenses typically fall around a thickness of 0.2 mm. On the other hand, higher absorbance at lower wavelengths could also indicate a protective effect from UVA radiation. Bacterial data collected after incubating with gel samples indicated tannic acid is an effective solution for preventing bacterial growth of E. coli at high enough concentrations. Altogether, the data collected indicate the hydrogels synthesized are a promising contact lens material due to: interactions with water observed through water content and water contact angle, tensile strength, and successful bacterial inhibition.
5. Future Directions and Limitations
With improved lab equipment, synthesis of hydrogels could be better standardized to improve consistency in the thickness of samples and achieve thinner samples more similar to contact lenses. Lenses would also be freeze dried before incorporating tannic acid if a freeze dryer was available. Freeze drying creates a porous structure in the hydrogel, allowing better incorporation of tannic acid when soaking the lenses in tannic acid solutions. Future testing would include a bacterial assay with positively charged S. aureus to ensure inhibition over positively and negatively charged bacteria. Biocompatibility and cytotoxicity assays using cells would also be performed to ensure that the hydrogels are safe for biological applications, but cell testing was not possible in this setting due to lack of access to a sterile room for controlled growth.
6. Acknowledgments
Thank you to Dr. Michael Bruno and Dr. Tim Anglin for their guidance and mentorship throughout this project, to Dr. Mallory for her assistance with bacterial analysis, to all of my Research in Chemistry peers for their consistent support and encouragement, and to the NCSSM Science Department and the NCSSM Foundation for funding this research.
7. Data Availability
The data found in this paper are not available to the public. The data collected were generated by the author.
8. References
Ahmad Khan, S., & Lee, C. (2020). “Recent progress and strategies to develop antimicrobial contact lenses and lens cases for different types of microbial keratitis.” Acta Biomaterialia, 113, 101–118. https://doi.org/10.1016/j. actbio.2020.06.039.
Cao, Y., Yang, J., Lu, A., Gong, J., Yang, Y., Lin, X., Li, M., & Xu, H. (2022). “Nanoparticles in ocular applications and their potential toxicity.” Frontiers in Molecular Biosciences, 9, 931759. https://doi.org/10.3389/fmolb.2022.931759.
Cope, J., Collier, S., Rao, M., Chalmers, R., Mitchell, G., Richdale, K., Wagner, H., Kinoshita, B., Lam, D., Sorbara, L., Zimmerman, A., Yoder, J., & Beach, M. (2015). “Contact lens wearer demographics and risk behaviors for contact lens-related eye infections — United States, 2014.” MMWR. Morbidity and Mortality Weekly Report, 64(32), 865–870. https://doi.org/10.15585/mmwr.mm6432a2.
Demian, P., Nagaya, D., Refaei, R., Iwai, K., Hasegawa, D., Baba, M., Messersmith, P. B., & Lamrani, M. (2024). “Enhancing performance of silicone hydrogel contact lenses with hydrophilic polyphenolic coatings.” Journal of Functional Biomaterials, 15(11), 321. https://doi. org/10.3390/jfb15110321.
Deng, H., Zhang, X., Su, S., Liu, Y., Cui, L., Zhao, J., & Rong, J. (2024). “Poly(2-hydroxyethyl methacrylate-comethacrylated hyaluronan-β-cyclodextrin) hydrogel: A potential contact lens material with high hydrophilicity, good mechanical properties and sustained drug delivery.” International Journal of Biological Macromolecules. https:// doi.org/10.1016/j.ijbiomac.2024.137579.
Ezinne, N., Bhattarai, D., Ekemiri, K., Harbajan, G. Crooks, A., Mashige, K., Ilechie, A., Zeried, F., & Osuagwu, U. (2022). “Demographic profiles of contact lens wearers and their association with lens wear characteristics in Trinidad and Tobago: A retrospective study.” PLOS ONE, 17(7). https://doi.org/10.1371/journal.pone.0264659.
Feel Good Contacts. (2026). “What does the water content of a contact lens mean?” https://www.feelgoodcontacts. com/eye-care-hub/contact-lenses/what-does-thewater-content-of-a-contact-lens-mean.
Feng, J., & Zhang, Y. (2023). “The potential benefits of polyphenols for corneal diseases.” Biomedicine & Pharmacotherapy, 169, 115862. https://doi.org/10.1016/j. biopha.2023.115862.
Guo, J. (2024). “Synthesizing Dog-bone Tensile Specimens of Shape Memory Polymers.”
Jiao, Z., Huo, Q., Lin, X., Chu, X., Deng, Z., Guo, H., Peng, Y., Lu, S., Zhou, X., Wang, X., & Wang, B. (2022). “Drugfree contact lens based on quaternized chitosan and tannic acid for bacterial keratitis therapy and corneal repair.” Carbohydrate Polymers, 286, 119314. https://doi. org/10.1016/j.carbpol.2022.119314.
Lin, S., Zheng, Y., Xue, P., Wang, L., Yuanyuan, C., He, X., Zhang, C., & Yuan, C. (2025). “Hydrogel contact lenses modified by quaternary chitosan and epigallocatechin gallate with enhancement of antimicrobial for bacterial keratitis.” International Journal of Biological Macromolecules, 306, 141787. https://doi.org/10.1016/j. ijbiomac.2025.141787.
Lin, X., Liu, J., Zhou, F., Ou, Y., Rong, J., & Zhao, J. (2022). (“Poly(2-hydroxyethyl methacrylate-co-quaternary ammonium salt chitosan) hydrogel: A potential contact lens material with tear protein deposition resistance and antimicrobial activity.” Biomaterials Advances, 136, 212787. https://doi.org/10.1016/j.bioadv.2022.212787.
DESIGN, CONTROL, AND EXPERIMENTAL VALIDATION OF A PRECISION LINEAR ACTUATORSTING SYSTEM FOR SUPERSONIC WIND TUNNEL TESTING
Sanika Agarkar
Abstract
Rotating detonation engines (RDEs) produce highly unsteady, shock-dominated supersonic exhaust flows that challenge conventional turbine designs and experimental testing approaches. Bladeless turbines offer a promising pathway for energy extraction in these environments, but require experimental platforms capable of controlled testing. This study presents the design, fabrication, and validation of a precision linear actuator-sting system for supersonic wind tunnel experiments. The system enables controlled, repeatable positioning of test articles within the wind tunnel flow while isolating key aerodynamic features relevant to RDE exhaust. The test articles are sections of bladeless turbine prototypes engraved with surface patterns for aerodynamic investigation. Controlled translation allows systematic exposure of these patterned geometries to different local flow conditions while minimizing support-induced disturbances. The actuator uses a dual stepper-motor driven ball-screw mechanism, with displacement independently measured using a digital caliper to quantify positional accuracy and repeatability. Experimental results demonstrate stable linear motion with sub-millimeter positional deviation within a specific operating range. This actuation platform establishes a way to advance future bladeless turbine research by enabling dynamic investigation of shock-surface interactions and pressure-induced surface loading on patterned turbine sections in supersonic flow. More broadly, it provides a versatile tool for high-speed aerodynamic studies requiring precise model motion under extreme flow conditions.
1. Introduction
1.1 Motivation
Rotating detonation engines (RDEs) generate supersonic exhaust flows. These flows are characterized by rapid pressure fluctuations and strong shock structures that differ fundamentally from flows encountered in conventional turbine propulsion systems (Wolański 2013; Kailasanath, 2017; Qin et al., 2025). These extreme flow conditions present challenges for traditional bladed turbine designs, which are optimized for steadier subsonic or mildly transonic operation. Under intense shock loading, as with RDEs, bladed turbines suffer from high structural loads, fatigue, and performance degradation (Paniagua, 2024). To address these challenges, researchers have developed bladeless turbine concepts in which work is extracted through interactions between surface geometries and the flow rather than through discrete rotating blades. Bladeless turbines suited for axial supersonic inflows have been shown to extract power from harsh high-speed environments with simplified mechanical requirements compared to conventional bladed machines (Braun et al., 2020). However, direct experimental characterization of these interactions at the local level is currently limited due to measurement challenges in supersonic flow (Settles, 2001; Hamada et al., 2024).
1.2 Background Information
In bladeless turbine systems, mechanical energy extraction relies on pressure forces acting on patterned surface features, rather than impulse transfer on discrete blades. As supersonic flow encounters geometric variations on a surface, it produces localized compression and expansion waves that generate spatial pressure gradients. These pressure gradients can produce tangential forces on surfaces that, when integrated around a cylindrical circumference, contribute to net torque on a rotating shaft (Braun et al., 2020). For a full cylindrical bladeless turbine shaft, the net torque is the cumulative sum of these tangential pressure forces distributed around the surface. However, these forces are not uniform, as shock interactions and resulting pressure gradients depend strongly on local flow conditions experienced by each surface segment. In supersonic flows, local Mach number, pressure, and flow direction can vary due to shock formation, boundary-layer effects, and changes in surface orientation relative to the incoming flow (Anderson, 2002; Hamada et al., 2024). As a result, different regions of a patterned turbine shaft may experience substantially different pressure loading even when exposed to the same nominal freestream conditions (Anderson, 2002; Hamada et al., 2024; Settles, 2001).
Investigating these effects in individual surface segments provides a controlled and practical means of isolating how local flow variations influence surface-induced
loading before proceeding to the fabrication of the full cylindrical shaft (Settles, 2001).
1.3 Need for Controlled Motion and Precise Positioning
Real RDE exhaust environments are not practical for early experimental studies due to their extreme temperatures, pressures, and current developmental state (Qin et al., 2025). Instead, supersonic wind tunnel testing provides controlled, repeatable high-speed flow conditions that approximate key features of RDE exhaust while avoiding the thermal and safety challenges of direct engine operation (Settles, 2001).
To study how a given surface pattern responds across varying local flow conditions, a test configuration that enables controlled translation of the geometry through supersonic flow is essential. The ability to translate the geometry allows the same surface pattern to experience spatially varying flow conditions, capturing variations in shock formation, pressure gradients, and resultant forces that static positioning cannot reveal (Hamada et al., 2024).
Figure 1: Resin-printed rectangular test article incorporating a sinusoidal surface pattern, representing a localized segment of a bladeless turbine shaft, fabricated in the BEFAST Lab.
The experimental test article in this work is a rectangular block with a sinusoidal surface pattern representing a localized segment of a bladeless turbine shaft, seen in Figure 1. Translation of the test article systematically probes how the geometry responds under different local flow conditions, which reflects how different regions of a full cylindrical shaft engraved with the same pattern would experience varying pressure loading in supersonic exhaust. In an open-jet configuration, axial translation allows the surface to traverse regions influenced by jet boundary interactions, enabling a systematic study of shock reflections and pressure gradients arising from interactions between the patterned surface and the jet shear layer, while the core flow Mach number remains approximately uniform
within the jet, making controlled motion essential.
Observations from these tests help identify surface geometries that produce desirable pressure distributions for energy extraction and inform future turbine design decisions. Beyond this application, the developed actuation platform provides an experimental capability for high-speed aerodynamic studies requiring precise model motion to investigate shock-surface interactions and flow sensitivity and can be readily augmented with intrusive or optical probes to quantify local flow uniformity and boundary effects during translation (Anderson, 2002).
The primary contribution of this work is the development and experimental validation of a motion platform capable of precise, repeatable translation under mechanical load in a configuration suitable for supersonic wind tunnel testing. While aerodynamic measurements are the focus of future work, establishing the operating envelope, limitations, and best-use practices of the actuation system is a necessary prerequisite for reliable shock-surface interaction experiments.
2. Materials and Methods
2.1 Test Articles
The experimental investigation focused on bladeless turbine geometries designed to interact with supersonic flow through surface shaping. Each test article featured grooves, wavy surfaces, or helicoidal patterns to induce pressure differences when exposed to high-speed flow. These geometries rely on surface-induced pressure differences rather than discrete rotating blades. The performance of each design depends strongly on the alignment and position of the geometry relative to the supersonic jet.
Multiple test articles were fabricated with identical external dimensions and mounting features, while the surface pattern was varied systematically in amplitude and wavelength relative to the representative geometry shown in Figure 1. This approach isolates the effects of surface patterning on shock formation and pressure loading while holding the overall geometry constant. In addition to the sinusoidal pattern illustrated in Figure 1, the test article framework is designed to accommodate alternative surface patterns for future investigations.
2.2 Open-Jet Supersonic Wind Tunnel
The design is tailored to perform experiments in BEFAST (Braun’s Engineering Factory for Advanced Supersonic Technologies) Lab’s open-jet supersonic wind tunnel capable of generating Mach 3 flow (shown in Figure 2). The tunnel’s nozzle produces a high-speed, highly energetic jet that is designed to be nominally
uniform in velocity and pressure at the nozzle exit, while strong flow nonuniformities arise downstream due to shock reflections from the jet boundary. As the jet expands into the test section, reflections from the shear layer interact with the test article, producing localized variations in shock structure and pressure loading. By adjusting the vertical position of the test article, the location where these reflected shocks impinge on the surface can be systematically controlled, resulting in differences in flow separation and shock formation despite similar core flow conditions. The tunnel setup provides optical access and accommodates diagnostic instrumentation for future observation of flow behavior and force measurements on the test articles.
Figure 2: BEFAST Lab open-jet supersonic wind tunnel. Views from (a) side, (b) front, and (c)closeup of the Mach 1.6 nozzle, which constitutes the test section, illustrate the area where test articles are exposed to the supersonic flow.
2.3 Linear Actuator System Design
A precision linear actuation system was developed to translate test articles with high positional accuracy while supporting future integration into a supersonic wind tunnel environment. The system uses two commercially available linear stages (Befenybay, 100 mm travel) incorporating square linear rails and SFU1605 ball screws, each driven by a NEMA 17 stepper motor. The actuators are mounted to a rigid frame constructed from 1 by 1 inch aluminum T-slot rails, providing structural stiffness and modular adjustability.
Custom aluminum brackets were designed and machined to interface the linear stages with the T-slot frame and to support the test article sting. A sting is a structural support that positions the test article within the flow while minimizing aerodynamic interference. The brackets ensure alignment between the actuator motion axis and the test article translation direction, minimizing parasitic (or small unintentional) motion during operation. Prior to fabrication, the overall assembly was designed in CAD, as shown in Figure 3, to verify clearances, alignment, and integration of instrumentation. The CAD in Figure 3 is mirrored to create the complete assembly. Figure 3 (e) shows how the L-brackets match up with the 1-inch hole spacing table. The table provides a rigid support platform that
minimizes movement and maintains alignment during operation in front of the open-jet supersonic wind tunnel.
Figure 3: CAD model of one half of the linear actuation system designed in Onshape. Views include (a) isometric, (b) right, (c) front, (d) left, and (e) top. The model is mirrored to form the full assembly. Panel (e) highlights the interface between the custom L-brackets and the 1-inch hole spacing table on which the system is secured. Component color legend: actuator (blue), rails (purple), brackets (teal), caliper (dark grey), and L-brackets (light purple).
The use of a ball-screw-based linear stage allows precise and repeatable motion under load, making the system suitable for controlled translation of test articles during aerodynamic testing. No modifications were made to the internal mechanics of the actuators; all customization was achieved through external mounting and integration.
2.4 Fabrication and Mechanical Integration
All structural components were fabricated in-house using aluminum stock. The custom brackets were machined to match the mounting hole patterns of the linear stages and the T-slot rail geometry, allowing secure attachment while maintaining adjustability for alignment. The test article sting was mounted directly to the actuator carriage through an interface bracket, ensuring rigid coupling between actuator motion and test article translation.
To enable independent measurement of actuator displacement, a custom holder (shown in Figure 3 in green) was designed and fabricated to mount a digital caliper parallel to the direction of motion. The caliper holder was aligned such that its probe tracked the displacement of the movingsting relative to the fixed frame. This configuration is shown in Figure 4 (b).
Figure 4: Assembled linear actuator sting system with dual actuators. Views include (a) front, (b) back showing the caliper-based displacement measurement setup, and (c) close-up of the back of the sting mount and caliper holder.
The sting was mounted to a mount positioned between the two actuators on the linear stage. The mount was supported by a rod connected to a metal block located between the two brackets, as shown in Figure 4. The combination of rigid framing, custom-machined interfaces, and direct displacement measurement ensured that actuator motion could be characterized accurately under load conditions representative of those expected during testing.
2.5 Electrical Wiring and Instrumentation
Both linear actuators were driven using a single ZKSMC02 stepper motor driver controller capable of pulse, direction, and speed control via serial communication. The two NEMA 17 stepper motors were wired in parallel, as shown in Figure 5. Parallel wiring ensures synchronized motion of both actuators, preventing differential displacement that could introduce misalignment or binding during translation. This configuration was selected to maintain consistent displacement of the sting and test article across both linear stages while simplifying control logic.
Figure 5: Wiring configuration for two NEMA 17 stepper motors connected in parallel to a single ZKSMC02 stepper motor driver, powered by a 24V DC supply.
Preliminary characterization of the actuation system was conducted to evaluate positioning accuracy and repeatability under load. Actuator motion was commanded through the motor driver, and the resulting displacement was measured independently using the mounted digital caliper. Tests were performed with the full sting assembly attached, introducing a mechanical load representative of the conditions expected in future supersonic wind tunnel experiments.
3. Results
3.1 Theoretical Displacement per Commanded Pulse
The expected linear displacement (Δx) of the actuator system was determined from the stepper motor, microstepping configuration, and lead screw geometry. Each linear stage is driven by a NEMA 17 stepper motor with a step angle of 1.8°, corresponding to 200 full steps per revolution. The motor driver was configured for 8x microstepping, yielding
Each actuator employs an SFU1605 ball screw with a lead of 5 mm per revolution. Therefore, the ideal linear travel per pulse is
From this relationship, the number of pulses required for a desired displacement is
As examples, a 1 mm translation requires 320 pulses, and a 5 mm translation requires 1600 pulses. These relationships formed the basis for all commanded motions reported in this section.
3.2 No Load Actuator Validation
Prior to testing under load, the actuator system was evaluated without the sting assembly attached to isolate controller accuracy and intrinsic actuator performance. In this configuration, the measured displacement matched the theoretical values exactly within the resolution of the digital caliper.
Repeated trials for motions of 5 mm (1600 pulses), 10 mm (3200 pulses), and smaller increments (e.g., 0.3 mm in 96 pulses) produced displacements matching the theoretical values within the resolution of the digital caliper. Any deviations at no load were negligible compared with those observed under mechanical loading.
These results verify that the stepper motor controller configuration, microstepping settings, and pulse-todisplacement conversion are accurate. Consequently, any deviations observed during subsequent tests can be attributed to load-dependent mechanical effects introduced by the dual-actuator sting assembly, including elastic compliance, friction, and load-sharing behavior, rather than limitations of the control electronics or pulse generation.
3.3 Actuator Command-Displacement Calibration Under Load
Following no-load validation, the full sting assembly was mounted, introducing mechanical load representative of wind tunnel operation. All tests in this section were conducted using the stepper motor driver’s Mode P04 (step-and-stop loop mode), in which the actuator executes a prescribed number of discrete step pulses followed by a brief dwell before repeating. Motion parameters, including step count per move and dwell duration, were held fixed, while motor speed was set via the driver control knob. Unidirectional counterclockwise (CCW) motion was used exclusively to produce controlled upward translation of the sting assembly, ensuring consistent loading conditions during calibration.
Initial tests, with 10 trials per pulse value, were performed using unidirectional CCW motion to minimize the effects of mechanical losses and loading, such as backlash and preload effects. Backlash is the motion lost due to mechanical clearances that must be re-engaged when reversing direction, while preload effects occur when applied loads alter contact forces within the ball screw, bearings, and mounting interfaces, influencing effective stiffness and displacement. Results are summarized in Table 1.
Table 1: Measured displacement of the sting mount under load for unidirectional CCW motion
Across all unidirectional trials, the actuator system exhibited good repeatability, with mean errors below 2%. The observed shortfall in measured displacement relative to the commanded (theoretical) displacement is consistent with elastic compliance and friction in the loaded mechanical chain, including the ball screwnut interface, linear bearings, mounting brackets, and the dual-actuator configuration supporting the rigid sting assembly. Under load, a fraction of commanded
motor rotation is absorbed by elastic deformation and frictional losses before producing net translation. Slight mismatches in friction or preload between the two actuators further increase effective compliance, the total flexibility of the system, producing a systematic bias toward under-travel rather than random error.
Importantly, when successive CCW displacements were executed without reversing direction, the displacement error remained consistent and did not accumulate, indicating stable performance under monotonic motion.
3.4 Effects of Direction Reversal
Additional 10 trials per pulse value were conducted in which the actuator was first moved in the clockwise (CW) direction before executing a CCW displacement of identical pulse count. Direction reversal was specifically used to reveal the effects of backlash and mechanical compliance. When the actuator changes direction, small clearances in the ball-screw nut, linear bearings, and mounting interfaces must be re-engaged before the assembly begins transmitting motion effectively to the test article. Any elastic deformation or load redistribution in the dual-actuator system further reduces net displacement immediately after reversal, making the resulting travel errors more pronounced compared with continuous unidirectional motion. Results are summarized in Table 2.
Table 2: Displacement following direction reversal (CW to CCW)
Direction reversal introduced substantially larger errors, especially for smaller commanded motions. For 5 mm commands, measured travel was reduced by more than 20% on average. The data indicate that the system exhibits a roughly consistent absolute backlash of about 1 mm, which explains why smaller displacements show disproportionately high percentage errors while larger motions partially mask the effect. This behavior is consistent with load redistribution and mechanical clearances in ball-screw-driven systems, particularly when two actuators operate in parallel (Nise, 1992). Reversing direction requires the ball-screw nut, linear bearings, and mounting interfaces to reengage before effective translation occurs, temporarily reducing net motion. These observations also suggest a mitigation strategy: a small pre-compensation “bump”
of approximately 1 mm at each reversal could offset the backlash and improve accuracy for small motions.
3.5 Dependence on Actuator Position Along Travel
An additional trend observed during testing was a dependence of displacement accuracy on the vertical position of the sting within the usable range of the actuator. The lower bound of this usable range was intentionally selected such that the test article, at its lowest position, aligned closely with the wind tunnel nozzle centerline. As a result, all position-dependent measurements reported here are referenced to a defined usable travel range of 127.6 mm rather than the full 200 mm actuator stroke. Of this usable range, experimental data were collected over a 114.8 mm span corresponding to the regions of interest for wind tunnel operation.
Within this range, the lowest portion of the stroke, corresponding to approximately 72-97.6 mm above the base (lower 20% of the usable range), exhibited the smallest deviations for unidirectional CCW motion. Positions within the mid 50% (97.6-161.6 mm) and upper 20% (161.6-187.2 mm) showed slightly increased error. Trials that included direction reversal (CW to CCW) displayed larger under-travel across all positions due to backlash and load redistribution within the mechanical chain.
Manual leveling checks revealed minor misalignments developing between the two actuators as the system moved vertically, occasionally requiring adjustment to restore parallelism. These observations suggest that uneven load sharing, friction, and backlash contribute to position-dependent behavior. Table 3 summarizes the results, highlighting the variation in displacement accuracy with actuator position, while Figure 6 illustrates the corresponding error trends. The lower 20% of the usable range (72-97.6 mm), which coincides with the nominal nozzle height, provides the most precise translation for unidirectional CCW motion and is therefore recommended for high-precision testing.
Table 3: Mean displacement error and standard deviation along the actuator travel forunidirectional CCW motion and direction-reversal (CW to CCW) trials. The actuator travel was divided into lower 20%, mid 50%, and upper 20% of the usable range to highlight position-dependent performance. The usable lower 20% corresponds to the height aligned with the wind tunnel nozzle, where displacement repeatability is highest.
Figure 6: Mean displacement error along the actuator travel range for unidirectional CCW motion and direction-reversal (CW to CCW). The graph highlights that the lower 20% of the usable travel exhibits the most accurate and repeatable motion, while direction reversal increases under-travel across all positions.
3.6 Implications for Supersonic Wind Tunnel Applications
Taken together, these results establish a well-defined operating regime for the actuator system. While noload tests confirm exact agreement with theoretical displacement, loading introduces predictable and repeatable deviations that depend on direction history and vertical position.
Based on actuator characterization under load, subsequent displacement commands were executed using CCW-only motion to minimize backlash and hysteresis effects, with incremental displacements referenced from prior positions rather than returning to a fixed reference position via direction reversal. Calibration results further indicate that actuator performance is most repeatable within the lower range of travel, and this operating regime is therefore adopted as the recommended configuration for future supersonic wind tunnel experiments. This calibrated approach provides sufficient positional accuracy for controlled investigation of shock formation and pressure loading on bladeless turbine geometries while clearly defining the mechanical limitations of the current system.
4. Future Steps
Future work includes integration of higher-resolution displacement sensors, such as linear optical encoders to further reduce uncertainty and enable automated feedback control, extension to multi-axis motion for full cylindrical turbine testing, incorporation of force or pressure measurement at the test article surface, and evaluation under varying Mach numbers or nozzle configurations to better understand local flow effects.
Overall, the system establishes a robust experimental platform for precise translation of test articles under representative aerodynamic loading, forming the foundation for iterative turbine surface design and optimization.
5. Conclusion
This study presents the design, fabrication, and experimental validation of a dual-actuator linear stage system capable of precise translation of test articles representing sections of bladeless turbine surfaces under mechanical load. Experimental results demonstrate submillimeter accuracy and good repeatability, with the most precise motion occurring within the lower 20% of the usable actuator travel, corresponding to the nominal height of the wind tunnel nozzle.
Unidirectional CCW motion minimizes backlash and uneven load-sharing effects, while direction reversal introduces systematic under-travel due to mechanical compliance and clearance re-engagement. Displacement accuracy also varies with vertical position, emphasizing the importance of selecting an appropriate operating range and maintaining actuator parallelism during operation.
The validated platform enables controlled, repeatable translation of test articles, supporting systematic evaluation of surface-induced forces and shock interactions in high-speed flow. These capabilities provide a foundation for future supersonic experiments, including multi-axis motion, integrated force sensing, and extension to higher-fidelity flow conditions. By establishing a reliable actuation system, this work lays the groundwork for iterative design and optimization of bladeless turbine geometries in extreme aerodynamic environments.
6. Acknowledgments
I would like to thank Eduardo Leite de Moraes for his mentorship and technical guidance throughout this project, as well as Dr. Braun and the members of the BEFAST Lab for their support and access to experimental facilities. I am also grateful to NCSSM for providing the academic environment and resources that made this research possible. The data supporting the findings of this study are available from the author upon request.
7. References
Anderson, J. D., Jr. (2002). Modern compressible flow: with historical perspective. McGraw-Hill Education.
Braun, J., Paniagua, G., Falempin, F., & Naour, B. L. (2020). Design and experimental assessment of bladeless turbines for axial inlet supersonic flows. Journal of Engineering for Gas Turbines and Power, 142(4).
Hamada, G. Y., Lui, H., Wolf, W., & Junqueira, C. (2024). Characterization of boundary layers on isothermal and adiabatic curved surfaces of a supersonic turbine cascade. arXiv.
Kailasanath, K. (2017). Recent developments in the research on rotating-detonation-wave engines. 55th AIAA Aerospace Sciences Meeting.
Nise, N. S. (1992). Control Systems Engineering. BenjaminCummings Publishing Company.
Paniagua, G. (2024). Advancing supersonic turbomachinery for sustainable aviation and clean power generation https:// www.thermopedia.com/content/10442/.
Qin, X., Yan, Q., Wang, H., Xu, X., & Haidn, O. (2025). Research progress in rotating detonation propulsion technology. Acta Astronautica, 236, 522–546.
Settles, G. S. (2001). Schlieren and Shadowgraph techniques Springer.
Wolański, P. (2013). Detonative propulsion. Proceedings of the Combustion Institute, 34(1), 125–158
IMPACT OF MICRONEEDLE FORMULATION AND DESIGN ON DRUG RELEASE KINETICS
Hilary Chen
Abstract
Topical treatment is commonly used to treat skin disorders, such as psoriasis, but problems such as forgetfulness and the treatment being washed away are rising concerns. To solve these issues, this research focuses on developing microneedles (MNs) that require minimal wear time, but afford sustained release of cargos in the skin. To conduct this research, CLIP (continuous liquid interface production) 3D printing was used to manufacture previously designed hollow-tipped microneedle array patches (HMAPs) from two different materials, polyethylene glycol dimethacrylate (PEG, non dissolving) and degradable biocompatible material. Hollow cavities of HMAPs were filled with hydrogel formulations composed of varied amounts of cleavable crosslinker and Rhodamine B (RhB) as drug surrogate. RhB release kinetics and skin delivery efficiency were evaluated as a function of loading formulation (crosslinker content). RhB release kinetics were evaluated by incubating the RhB filled HMAPs in 1X PBS buffer. For skin release kinetics, filled HMAPs were applied into ex-vivo pig skin for 5 minutes before removal and observation. Through the skin delivery applications, PEG HMAPs demonstrate clear skin puncture. However, formulations with higher cleavable crosslinker content were not able to fully transfer the drug into the skin within the 5 minute patch application time. Future work will focus on repeating skin application with the dissolving HMAPS. Later studies will include investigating a broader range of surrogate drug cargos, including hydrophobic materials.
1. Introduction
1.1 Transdermal Drug Delivery
With the growing advancement of science and technology, the availability and diversity of many therapeutics have also advanced. These therapeutics are used to treat and prevent diseases, resulting in a healthier population of humans. There are several methods for how therapeutics are delivered into someone’s body, such as oral, parenteral (hydrophobic drugs), and transdermal methods. These methods, however, pose issues. Oral drug delivery is an old route of drug administration, but can have side effects that impact vital organs such as the liver and kidneys. Parenteral route inserts hydrophobic drugs into the intramuscular, subcutaneous, and intravenous pathways of the human bodies. This method provides rapid drug delivery, but can be painful (Aldawood et al., 2021; Waghule et al., 2019). Topical creams are another common method of drug delivery specifically aimed to treat skin disorders, such as psoriasis or eczema, and are painless. However, since topical treatments are only applied on the surface level of the skin without any force to puncture through the protective layer (stratum corneum), not a lot of the cream is able to go through (Aldawood et al., 2021; Peng et al., 2025). Patients can also forget to apply topical treatment, and because these creams can be easily wiped away, they require frequent
applications. Microneedles (MNs) puncture through the stratum corneum of the skin to access the epidermal and dermal layers of the skin without reaching nerves, enabling a painless and self-administered intradermal administration of the therapeutic (Caudill et al., 2021). Additionally, this puncture through the stratum corneum allows the MNs to deliver more therapeutics into the skin than topical creams (Pünnel et al., 2024).
Microneedle methods include solid, coated, dissolvable, hollow, and hydrogel MNs, as shown in Figure 1. Solid MNs uses a two-step process where the MNs are first applied to the skin before the therapeutic application. Solid MNs are also sharper than hollow MNs, and easy to manufacture. This method, however, takes a longer drug application time from the two-step process and cannot provide controlled drug delivery. Coated MNs are MNs coated with the drugs, providing rapid delivery into the skin. However, coated MNs carry less drugs due to the design. Hollow MNs have spaces inside the needles where the drug can be placed into and injected once the MNs puncture through the stratum corneum. This also ensures sufficient therapeutics get delivered into the epidermis and dermis layers, but there are difficulties such as leakage and clogging during the injection process (Hong et al., 2014). For dissolvable MNs, the whole MNs are made from the therapeutic material and all dissolve once applied into the skin.
Figure 1. Cartoon depicting skin delivery using topical creams and microneedles. (A) Beginning of topical treatment and MNs (5 methods) drug delivery through the skin. (B) Ending of topical treatment and MNs (5 methods) drug delivery through the skin. Image created by student researcher using BioRender, 2025.
This reduces the concern of leaving needles or materials in the skin, thus, reducing MNs waste and provides maximum therapeutic release into the epidermis and dermis. Even so, dissolvable MNs require long application time, which prevents people from freely moving the area where the MNs were applied. Additionally, dissolvable MNs are costly to create (Aldawood et al., 2021). Lastly, hydrogel MNs have unique properties including the ability to control how much the hydrogel MNs swell after penetrating through the stratum corneum. The swelling allows the drug in the MNs to diffuse into the body, providing a controlled and sustained drug release. Researchers can easily manipulate the materials used to develop the hydrogel MNs to control the rate of drug release (Lin & Metters, 2006; Waghule et al., 2019).
2.2 CLIP 3D Printing
This research utilizes a 3D printing technique known as CLIP (continuous liquid interface production) (Tumbleston et al., 2015; Caudill et al., 2018) to manufacture MNs. CLIP uses a photopolymer (lightsensitive resin) and has a high resolution. This technique is commonly used to produce MNs of varied designs and formulations (Rajesh et. al, 2024). CLIP uses vat photopolymerization, which is a 3D printing method of building objects layer-by-layer using photopolymer resins hardened by ultraviolet light. Additionally, CLIP has an oxygen-permeable zone where the printing window is started as shown in Figure 2. This zone reduces peeling steps, which is the automated motion in 3D printers where the build platform lifts after each layer cures to separate the new resin from the previously cured layer below, within the 3D printing process to enhance printing speed (Bahnick et al., 2024).
Figure 2. Schematic of CLIP 3D printing and computer aided microneedle designs. (A) Schematic of high resolution CLIP printing, illustrating components of the printer and the CLIP process. (B) Zoomed image of needle designs manufactured by CLIP 3D printing. Figures were taken and adapted from (Rajesh et al., 2024) Figure 2.
UNC Chapel Hill houses a CLIP 3D printer, the Carbon prototype S1 printer, that has a print resolution of 25 μm. This print resolution allows for the production of micron sized parts and various complex designs, some of which cannot be achieved using traditional molding techniques.
2.3 Questions & Objectives
This research focuses on the question: how can a microneedle be capable of efficient drug delivery with minimal wear time? To answer this question, our objective is to first determine the impact of cargo formulation on drug release rate. Then our next objective is to determine the required wear times for efficient drug release into skin for non-dissolvable and dissolvable microneedles loaded with hydrogel formulations.
Our goal for this research is to develop MNs that can provide a sustained release of cargo in the skin while requiring minimal application time. Developing this MN will address issues such as having topical treatment washing away, having to reapply topical treatments multiple times a day, and painful drug administration.
In this research, benefits of different MN methods will be combined to reach our goal and answer our research question. This research uses previously designed hollowtipped microneedle array patches (HMAPs) made with either non-dissolvable or dissolvable material. Dissolvable HMAPs are investigated to determine if they can provide a shorter application time compared to non-dissolvable HMAPs. During skin insertion, the dissolvable HMAPs will dissolve and leave behind the coating (the hydrogel formulation). The coating will continue to dissolve within the skin. This combination of hollow and dissolvable MNs covered with hydrogel is predicted to provide a shorter application time and sustained drug administration.
3. Methods
3.1 3D Production of HMAPs
CLIP 3D printing was used to manufacture previously designed hollow-tipped microneedle array patches (HMAPs). HMAPs consist of polyethylene glycol dimethacrylate (PEG, non-dissolving) or of a degradable biocompatible material (dissolving). Each 40 MN patch was designed to hold around 1 μL of cargo. Key Splint Hard (KSH), a photopolymer, was used to create coating masks (CM) for the HMAPs and was manufactured using CLIP 3D printing. After production of both HMAPs and CM, they were washed using isopropanol alcohol (IPA) and cured using UV before usage in experiments.
3.2 Development of Hydrogen Formulations
This study developed and characterized cargo release from photopolymerizable hydrogels composed of a dissolving linear polymer in combination with a cleavable crosslinker. It was demonstrated that through controlling crosslinker content, cargo release kinetics can be tailored (Bahnick et al., 2024). The hydrogel formulations contained Rhodamine B (RhB) as a drug surrogate, and varied amounts of cleavable cross linkers (0%, 5%, 10%, 15%, 20%, and 100%).
3.3 Evaluating RhB Release from HMAPs Loaded with Hydrogel Formulations
First, the six different hydrogel formulations (0%, 5%, 10%, 15%, 20%, and 100% crosslinker) were pipetted into the CM before dipping the PEG HMAPs for 10 seconds to load the hollowed tips of the MNs (see Fig. 3). Then the loaded PEG HMAPs were crosslinked in the UV oven to solidify the hydrogel. A separate batch of HMAPs were loaded with hydrogel and not crosslinked in the UV oven. The crosslinked batch was incubated in 1 mL 1X Phosphate-buffered saline (PBS) at 37°C. Over a course of 0.0167, 0.083, 0.25, 2, and 4, and 24 hours, 200 μL of the sample was collected and replaced with 200 μL of 1X PBS to keep the amount of liquid in the wells the same (at 1000μL) throughout the experiment. This was repeated for all samples (sample size of 5 per formulation). To determine the total loading (and release), non-UV cured hydrogel filled HMAPs were incubated in 1 mL of 1X PBS for 30 minutes. Finally, 100 μL of each sample were taken and placed into a 96 well plate to measure the absorbance through the SpectraMax spectrophotometer.
Figure 3. Loaded HMAPs are incubated in 1X PBS and samples will be taken over a time course (0.0167, 0.083, 0.25, 2, 4, 24 hours). A spectrophotometer is used to measure drug release over time. Image created by student researcher using BioRender, 2025.
3.4 Evaluating Skin Delivery
CLIP 3D printing was used to produce PEG HMAPs and dissolvable HMAPs and their coating masks. The same hydrogel formulations were used, and the coating process was similar to previous steps (see Fig. 3). Loaded HMAPs (n=5, or sample size of 5, per hydrogel formulation and HMAP material) were applied to thawed excised porcine skin using a commercial spring-loaded applicator followed by thumb-pressure for 5 minutes (see Fig. 4). The HMAPs were then removed from the porcine skin, and remaining cargo absorbance was assessed by releasing the remaining cargo in 1X PBS. The release media, containing RhB remaining in the HMAPs, was again analyzed using the SpectraMax spectrophotometer to indirectly quantify the delivery efficiency of each formulation.
Figure 4. Skin delivery using HMAPs and evaluated using spectrophotometer. Image created by student researcher using BioRender, (2025).
4. Results
4.1
3D Production of HMAPs
Designed HMAPs were manufactured using CLIP 3D printing. HMAPs had a rectangular base with MNs in a 5 by 8 array with the MNs in a square pyramidal shape (see Fig. 5). This design was used as previous research done has shown to be more durable to breakage and penetrate deeper into the skin compared to obelisk and conical bases (Pünnel et. al, 2024). In addition, previous studies showed that square-based MNs had higher surface areas and volumes compared to triangle, pentagon, hexagon, and circle bases (Rajesh et. al, 2024). This shape allowed the MNs to hold more drugs than other shapes. The MNs had a width of approximately 800 μm and height of approximately 1200 μm, with hollow tips able to contain 1 μL of cargo. The HMAPs were strong enough to puncture through the stratum corneum and deliver the cargo into the skin. Additionally, the coating mask is designed with raised edges to only allow for the tips of the microneedles to access the coating formulation, allowing the hydrogel formulation to fill the hollow-tips through capillary action. The CM assisted with preventing cargo waste, as the coated tips were the only section of the MNs that went into the skin.
Figure 5. Depiction of microneedle loading using a 3D printed coating mask. (A) Model of loading HMAPs using CM, (taken from Caudill et al., 2018, Figure 2). (B) Magnified image of PEG HMAPs, manufactured using CLIP 3D printing. (C) Base of MNs (blue), MNs (green), hollow space (red), CM (yellow). Images taken by student researcher, 2025.
4.2 Development of Hydrogel Formulations
Figure 6A shows the hydrogel formulations with 0% cleavable crosslinker, and following the incubation in 1X PBS for 24 hours, Figure 6B shows that the hydrogel is completely dissolved leaving only stains of the RhB dye on the HMAPs. There was a similar trend for HMAPs filled with hydrogels containing 5%, 10%, and 15% of cleavable crosslinkers; however, HMAPs filled with 20% and 100% of cleavable crosslinkers did not fully dissolve after 24 hours.
Figure 6. Microscopy images of HMAPs following loading and release. (A) Magnified image of filled PEG HMAPs. (B) Magnified image of PEG HMAPs with 0% cleavable crosslinker after 24 hours. Images taken by student researcher, 2025.
4.3 Hydrogel Formulation Release Rates
To make this graph, the values from the spectrophotometer were converted to release rates in μg. A standard curve, with known concentrations (μg/mL) of RhB, was created and run through the spectrophotometer to produce known absorbance values per each concentration. Then these values were plotted on a graph with linear regression calculated (see Fig. 7). The linear regression equation was solved for the x-axis (the concentration). This new equation was used to convert the absorbance value calculated from the spectrophotometer of each hydrogel formulation sample into concentrations. This was done for every hydrogel formulation to determine the concentration at each time point. Lastly, these calculated masses were plotted together on a graph to see the concentration of each formulation over time to determine the formulations’ release rate.
Figure 7. Standard curve of RhB absorbance. The standard curve was calculated to assist with determining the amount of RhB was released during the time stamp experiment. Graph created by student researcher on Excel, 2025.
Figure 8 displays that increasing the amount of the cleavable crosslinker within the hydrogel formulation results in slower the release rates of RhB. Additionally, hydrogel formulations containing 10% and less cleavable crosslinker resulted in full formulation release from the MNs when viewed after 24 hours. Looking at Figure 8, the full release amount for loaded PEG HMAPs was defined to be approximately 6 μg, as the fully released formulations’ average total release plateaued after. In contrast, hydrogel formulations containing 15% and more cleavable crosslinkers did not fully release within 24 hours. The hydrogel formulation with 5%, 10%, and 15% cleavable crosslinker can produce sustained delivery of RhB after 4 hours, whereas formulations with 20% cleavable crosslinker and greater did not provide a sustained release at all. Hydrogel formulation with 0% crosslinker did not provide a sustained release over time but provided a full release within the first hour. Looking at all of the hydrogel formulations, they all released the most within 1-2 hours.
Figure 8. Release of hydrogel formulation through a time course. The average total cumulative release (μg) at specific time (hrs) was calculated (n=5). Error bars were included, calculated by finding the standard deviation of each data set. Graph created by student researcher using Microsoft Excel, 2025.
4.4 Skin Delivery Applications
Figure 9 shows the result of skin insertion of HMAPs coated with different hydrogel formulations. From observation, the loaded PEG HMAPs with 0% and 5% cleavable crosslinker seem to result in the highest concentration of RhB released (magenta in color) compared to other formulations. This conclusion is based on inspection of the image data, however, and needs further study to accurately determine which hydrogel formulation provides the greatest skin delivery. Furthermore, there was no breakage of the MNs observed following the HMAP removal, indicating that these loaded HMAPs are capable of puncturing the skin and delivering cargos without deformation or fracture. Additionally, the HMAPs loaded with hydrogels containing 10%, 15%, and 20% cleavable crosslinker still contained these formulations following removal from the skin, indicating that the 5 minute application time was not sufficient to deliver the RhB cargo. This result was expected based on the in vitro RhB release profiles for these hydrogels.
Figure 9. Ex vivo pig skin following a 5 minute PEG HMAP application. (A) Loaded PEG HMAPs skin insertion with 0% and 5% crosslinker. (B) Loaded PEG HMAPs skin insertion with no coating, and 15% crosslinker.(C) Loaded PEG HMAPs skin insertion with 10% crosslinker. (D) Loaded PEG HMAPs skin insertion with 20% crosslinker. Images taken by student researcher, 2025.
5. Conclusion
MNs provide a painless and effective method to deliver therapeutics through the skin. Using CLIP 3D printing, PEG HMAPs were able to be manufactured and successfully deliver drugs into the skin, puncturing through the protective layer and leaving no excess materials in the porcine skin. Additionally, CLIP 3D printing was able to manufacture CMs that are able to evenly fill the hollow portions of the MNs, limiting cargo loading to only the portion of the needles that
punctures the skin. The different hydrogel formulations were able to evenly fill the MNs and dissolve and release RhB when incubated in 1X PBS. From the release studies, we determined how having 0%, 5%, 10%, 15%, 20%, and 100% cleavable crosslinker in our hydrogel formulations can affect the average release rate, or dissolving time, of the formulations. Hydrogel formulations with sustained release rate (5%, 10%, and 15%) assist with our goal of providing sustained drug administration. Through the skin application study, PEG HMAPs demonstrate clear skin puncture, however the slower releasing formulations were not able to transfer into the skin following the 5 minute patch application time. As this is an ongoing research, the skin application study was not fully completed, as described in the methods section.
6. Future Directions
Since this is an ongoing research, future work will focus on completing more skin application study with the nondissolving and dissolving HMAPs. We anticipate that following a 20 minute skin application, the dissolving microneedles will be able to 1) puncture the skin and 2) dissolve, to leave behind their hydrogel-based cargo. Later studies will include investigating a broader range of surrogate drug cargos, including hydrophobic materials.
7. Acknowledgements
This research was supported by UNC Chapel Hill and UNC Chapel Hill Eshelman School of Pharmacy, Dr. Jillian Perry, Burroughs Wellcome Fund, and NCSSM Foundations. Thank you to the NCSSM Mentorship Program, Dr. Shoemaker, Dr. Mike Limberg, and Mr. Bobby Warren for giving me the opportunity of research experience and assistance during this experience. Lastly, biggest thanks to my mentor, Dr. Jillian Perry, who chose me to be part of her team and assisted me along the long journey through my project, teaching me the important lab skills whether hard or soft skills.
8. References
Aldawood, F. K., Andar, A., & Desai, S. (2021). A Comprehensive Review of Microneedles: Types, Materials, Processes, Characterizations and Applications. Polymers, 13(16), 2815. https://doi.org/10.3390/polym13162815
Bahnick, A. J., Dziewior, C. S., Li, Y., Chou, A., Segal, M., Augustine, E. K., Ji, R., & Becker, M. L. (2024). Controlled Transdermal Delivery of Dexamethasone for Pain Management via Photochemically 3D‐Printed Bioresorbable Microneedle Arrays. Advanced Healthcare Materials, 13(31). https://doi.org/10.1002/ adhm.202402113
Caudill, C. L., Perry, J. L., Tian, S., Luft, J. C., & DeSimone, J. M. (2018). Spatially controlled coating of continuous liquid interface production microneedles for transdermal protein delivery. Journal of Controlled Release, 284, 122–132. https://doi.org/10.1016/j.jconrel.2018.05.042
Caudill, C., Perry, J. L., Iliadis, K., Tessema, A. T., Lee, B. J., Mecham, B. S., Tian, S., & DeSimone, J. M. (2021). Transdermal vaccination via 3D-printed microneedles induces potent humoral and cellular immunity. Proceedings of the National Academy of Sciences, 118(39), e2102595118. https://doi.org/10.1073/pnas.2102595118
Hong, X., Wu, Z., Chen, L., Wu, F., Wei, L., & Yuan, W. (2014). Hydrogel Microneedle Arrays for Transdermal Drug Delivery. Nano-Micro Letters, 6(3), 191–199. https:// doi.org/10.1007/bf03353783
Lin, C.-C., & Metters, A. T. (2006). Hydrogels in controlled release formulations: Network design and mathematical modeling. Advanced Drug Delivery Reviews, 58(12-13), 1379–1408. https://doi.org/10.1016/j.addr.2006.09.004
Peng, Y., Yue, L., & Cong, Y. (2025). Enhancing Dermal Absorption of Cosmeceuticals: Innovations and Techniques for Targeted Skin Delivery. Journal of Cosmetic Dermatology, 24(10). https://doi.org/10.1111/ jocd.70514
Pünnel, L. C., Palmtag, M., Lunter, D. J., & Perry, J. L. (2024). Development of 3D printed microneedles of varied needle geometries and lengths, designed to improve the dermal delivery of topically applied psoriasis treatments. European Journal of Pharmaceutics and Biopharmaceutics, 204, 114523. https://doi.org/10.1016/j. ejpb.2024.114523
Rajesh, N. U., (Luna) Hwang, J., Xu, Y., Saccone, M. A., Hung, A. H., Hernandez, R. A. S., Coates, I. A., Driskill, M. M., Dulay, M. T., Jacobson, G. B., Tian, S., Perry, J. L., & DeSimone, J. M. (2024). 3D‐Printed Latticed Microneedle Array Patches for Tunable and Versatile Intradermal Delivery. Advanced Materials, 36(44). https://doi. org/10.1002/adma.202404606
Tumbleston, J. R., Shirvanyants, D., Ermoshkin, N., Janusziewicz, R., Johnson, A. R., Kelly, D., Chen, K., Pinschmidt, R., Rolland, J. P., Ermoshkin, A., Samulski, E. T., & DeSimone, J. M. (2015). Continuous liquid interface production of 3D objects. Science, 347(6228), 1349–1352. https://doi.org/10.1126/science.aaa2397
Waghule, T., Singhvi, G., Dubey, S. K., Pandey, M. M., Gupta, G., Singh, M., & Dua, K. (2019). Microneedles: a Smart Approach and Increasing Potential for Transdermal Drug Delivery System. Biomedicine & Pharmacotherapy, 109, 1249–1258. https://doi.org/10.1016/j.biopha.2018.10.078
AN ELEMENTARY DERIVATION OF THE EXPLICIT FORMULA FOR NEGATIVELY INDEXED ELEMENTS OF THE NARAYANA’S COWS SEQUENCE
Nathaniel D’Annunzio
Abstract
The Narayana’s Cows sequence is a fibonacci-like sequence defined as with , , . It is known (Green, 1968) that the positive indices of the Narayana’s Cows sequence can be represented as a sum of binomial coefficients summing along the diagonals of Pascal’s Triangle.
The negative indices of the Narayana’s Cows sequence can also be represented as a sum of binomial coefficients (OEIS Foundation Inc., 2026), but almost all derivations of this formula take the form of a generating function argument. In this paper, we derive an explicit formula for negative indices of the Narayana’s Cows sequence as a sum over Pascal’s Triangle. Additionally, we show that every negatively-indexed term can be expressed as an integer linear combination of any three consecutive positively-indexed terms. Elementary proofs of these deep concepts preserve intuition and create new problem-solving techniques. As for real-world applications, negative indices of recurrence relations are common in cryptographic codes, such as the NegaFibonacci encoding (Kirthi, 2015). Additionally, the Narayana’s Cows sequence in particular has been found to have properties that are beneficial for key generation applications (OEIS Foundation Inc., 2025).
1. Introduction
The Narayana’s Cows sequence, , is a Fibonacci-like sequence with and , , . If we decrement our indices by 3, we get a much more intuitive form for our recurrence:
For example, . The first few terms of the Narayana sequence are given below.
We can also rearrange our recurrence to allow for negative indices. Starting with our original recurrence , we can rearrange to get:
We can now build our sequence backward. For example, . The first new negative indices are given below.
As convention, we will write the general negatively indexed term as , where n is assumed to be a positive integer.
2. Pascal’s Triangle and Binomial Coefficients
Starting with our recursive definition, , we can perform some basic algebra to find that . As we are only concerned with negative indices, we substitute n for −n to comply with our convention, giving us
We can continue to expand our recurrence in this way, resulting in the following tree with each row equal to (1)
Starting from , we can use (1) to expand into and into , giving us
Figure 1.
After distributing the negatives and combining the like terms, we get the following expansion triangle with the coefficients in red.
Figure 2.
The coefficients of our new expansion triangle form Pascal’s triangle with alternating signs along each row. More precisely, if we index the rows and entries of our triangle starting from 0, with the kth entry in the rth row having the coefficient , the kth entry in the rth row is equal to . The term in the previous expression arises because the first entry in each row r has index −n + 3r, and each subsequent entry has its index decreased by 1.
Lemma 3.1
With this knowledge, we can express as the following sum for all integers r 0.
Then, we will separate the sums and distribute the negative to get the following.
We factor the indices to introduce an r + 1 term.
Next, we take out the term at k 0 from the left sum and the term at k r from the right sum. We re-index accordingly.
Notice that this form is equivalent to taking a row sum of any row r in our expansion triangle.
Proof
We will use a proof by induction. We will start with the base case of r 0.
In our sum from k 0 to r − 1, we substitute k for k − 1 so we can re-index the sum from k 1 to r
Next, we will perform the inductive step. First, we apply (1).
We can then combine both sums.
Next, we apply Pascal’s Identity.
We induce tautologies on our outlying terms.
Figure 3.
Summing the final row of our triangle, we get . However, we wish to express only in terms of , , and and must find a way to get rid of the term. Consider the expansion triangle up to row r 2.
Finally, we combine all our terms into one sum and index accordingly.
The inductive step is complete.
Lemma 3.2
Any negatively-indexed term can be represented as a sum of non-negatively-indexed terms.
Proof
The lowest index of any term in our row sum from Lemma 3.1 is −n + 3r − r at k r. Solving for −n + 3r − r 0, we find that r must be greater than for all n 0. Thus, if we choose r , all terms will have an index greater than zero, proving Lemma 3.2.
4. An Introduction to Transfers
If we choose to represent terms of the sequence with very large negative indices, we run into a few issues. For example, if we choose to express as a sum of positive indices, we would need to set r 100, and would be left with a sum with 101 terms.
Figure 4.
The unwanted term comes from expanding out using our recurrence relation . To fix this, we keep the term unexpanded, choosing only to expand the and terms. The −2 coefficient of in row r 2 is unchanged and is transferred down to the term in row r 3. We can now simply sum the underlined terms in the following diagram, giving us
Figure 5.
We will decrease the number of terms in our sum using a technique called a transfer. To illustrate a transfer, we will express in terms of the three consecutive terms , , and . First, consider the expansion triangle for .
In fact, we will later prove that we can represent any as a sum of any three consecutive terms with integer coefficients, greatly reducing the number of elements in our sum and allowing us to create an explicit form. However, we must first define transfers algebraically. To do so, we have to generalize our approach.
5. Generalizing Our Approach
In order to algebraically define transfers and create our explicit form, it is useful to expand our triangle infinitely to the left and right using our formula from Lemma 3.1, creating the triangle shown below.
We extend Lemma 3.1 to now include all elements from k to k in any row r for all integers r 0.
Proof.
We can rewrite the LHS as follows.
To prove Lemma 5.2, it is sufficient to show the following. This will be a useful result, which we will refer to as Lemma 5.3.
Proof.
We can split our sum into three separate sums.
Binomial coefficients with k 0 or k r are equal to 0, and our middle sum is equal to by Lemma 3.1, and so our expression is simply equal to .
Transfers can be defined for our infinite triangle, too. An example of a row sum of row r 2 with a transfer is shown below. Terms underlined are those being summed.
Building on our formula from Lemma 5.1, we say that we apply a transfer to row r at index m to get the following expression.
To prove this statement, we will use a sequence of manipulations similar to the ones we used to prove Lemma 3.1.
First, we apply (1).
Then, we separate the sums and distribute the negative to get the following sum.
Figure 6.
Lemma 5.1
Figure 7.
Lemma 5.2
We factor the indices to introduce an r + 1 term.
Next, we take out the term at k m from the left sum and re-index accordingly.
Algebraically, for all integers n, j 0 and some integers q, r, and s,
In the right sum, we substitute k for k − 1 and re-index the sum from k m + 1 to
Proof.
First, we will start by applying Lemma 5.1 at row r 0. Starting at row r 0 will make later algebra significantly easier.
We then split this sum into three separate sums for some integer m −n + 1.
We then combine both sums.
Notice that with m −n + 1 and n 0, m − 3 −n − 2
0. Thus, every binomial coefficient in the left-most sum will have a negative second argument and will evaluate to 0. It follows that
Finally, we apply Pascal’s Identity.
Now that we have defined transfers algebraically, we can go about reducing the number of terms in our row sum from Lemma 5.1 much like we did in Section 3.
Lemma 5.4
Any negatively-indexed term can be represented as a sum of three consecutive nonnegatively-indexed terms with integer coefficients.
Substituting the sum for 0 gives us the following expression.
Next, we will apply a transfer at k m by Lemma 5.3, giving us. We denote the first two terms as S 0
We separate our final sum on the RHS into one sum from k m + 1 to m + 2 and another sum from k m +3 to infinity.
We then apply a transfer at k m + 3 to our final sum on the RHS by Lemma 5.3.
We can again separate our final sum on the RHS into one sum from k m + 4 to k m + 5 and one sum from k m + 6 to infinity.
Notice how, upon simplifying, the index of our term is no longer dependent on i. Similarly, upon evaluating our sum at k m + 3i − 2 and k m + 3i − 1 and simplifying, we get the following equation.
You may notice we could apply a transfer at k m + 6 by Lemma 5.3 and couple our finite terms into an S 3 term. In fact, we can continue transferring at k m + 3i for every integer i 0, coupling finite terms as Si. Doing so creates the following infinite sum.
Or, as a dot product,
By following the process above, it follows that, for integers i 0,
Finally, we can express our sum as the following dot product.
Simplifying,
Taking the exponents of our (−1) term modulo 2 gives us
We now have a sum of three consecutive terms, and substituting m −n − j + 1 with j 0 gives us
We can move the sums into the inside to get
Substituting −n + 1 in for −n gives us
Our sum is now only in terms of , , and , and Lemma 5.4 is satisfied.
Theorem 5.1
Proof.
From our proof to Lemma 5.4, we know that we can represent any in terms of any three consecutive terms , , and .
Applying the identity gives us
We can set a lower bound of i and an upper bound of i to get rid of the binomial coefficients that go to zero, giving us the equation
A particularly appealing trio of terms is 0, 1, and 0. Substituting j 0 yields
6. Further Work
Similar explanations could be created for other recurrence relations, providing a unique way to view these sequences that might be useful in solving other problems.
7. Acknowledgements
I am very grateful to Dr. Tharp, Dr. Sakaguchi, and Luca Jiang for their help in the mentorship and revision process. Luca Jiang was my partner in the Research in Mathematics class where these ideas were born, and the intuition gained during that experience was invaluable.
8. References
Green, T. M. (1968). Recurrent Sequences and Pascal’s Triangle. Mathematics Magazine, 41(1), 13–21. https://doi. org/10.2307/2687953
Kirthi, K. (2015). Narayana Sequences for Cryptographic Applications. ArXiv. https://arxiv.org/abs/1509.05745
Evaluating , , and ,
OEIS Foundation Inc. (2026), Expansion of 1 / (1 + x2 - x3) in powers of x., Entry A077961 in The On-Line Encyclopedia of Integer Sequences, https://oeis.org/A077961.
OEIS Foundation Inc. (2025), Narayana’s Cows Sequence, Entry A000930 in The On-Line Encyclopedia of Integer Sequences, https://oeis.org/A000930.
TEACHING TWO AMERICAS: A MACHINE LEARNINGBASED COMPARATIVE ANALYSIS OF POLITICAL FRAMING IN CALIFORNIA AND FLORIDA TEXTBOOKS
Sneha Khetan
Abstract
Curricula shape how society transmits knowledge, values, and collective memory. In the United States, textbook adoption occurs at the state level, producing clear regional variation in what students learn about history, civics, and the world. This study presents a computational comparative analysis of 16 state-adopted middle school social studies textbooks from California and Florida (2017–2023), two of the largest and most ideologically divergent states in contemporary U.S. politics. A 2.2-million-word dataset was constructed from matched textbook pairs by the same publishers and subjects to control for pedagogical variation and isolate differences in language. From a natural language processing perspective, comparing such textbooks poses a nontrivial challenge: publisher-matched state editions are near-duplicate long-form texts that share extremely high lexical overlap while differing through sparse, targeted edits. Through text alignment analysis, the study first establishes that 96% of content in matched editions is identical, reflecting publishers’ reliance on a shared base text. The remaining 4%, comprising 603 pairs of divergent passages, contains systematic ideological differences and stylistic variations. Applying a transformer-based machine learning classifier (RoBERTa-POLITICS) trained on 3.7 million U.S. political news articles (2018–2021), combined with manual classification into ten exhaustive and exclusive subject-matter categories, the analysis identifies consistent ideological polarization across states. Empirical results show that the majority of California passages leaned progressive and Florida passages leaned conservative or centrist in framing. Three types of divergence are observed: additions or redactions (51%), rephrasings (35%), and non-substantive stylistic edits (14%). Divergences are most pronounced in Civics Education, followed by U.S. History, with subtler but still consequential contrasts in World History. Thematically, over half of the differences center on structural racism, civil rights and activism, gender and sexuality, and Indigenous histories, with additions and redactions disproportionately being used to alter these politically sensitive domains. Taken together, the results show that although most textbook text remains identical, small targeted edits systematically shift ideological framing. This study provides the first machine learning-based comparative analysis of ideological leaning in state-approved textbooks across ideologically opposed states, demonstrating how computational methods can enable the detection of political influence on written curricula and the civic narratives students encounter.
1. Introduction
Society’s collective understanding of history and civic identity is profoundly shaped by the narratives we encounter in school (Michalopoulos and Xue, 2021; Riley, 2022; Michalopoulos and Rauh, 2024). Textbooks, in particular, are central vehicles through which states transmit knowledge, values, and cultural memory to children. These cultural products determine who and what is remembered, which events are emphasized, and how these stories are told. In doing so, textbooks help construct visions of citizenship and morality, influencing how children come to see themselves and their place in the world (Cantoni et al., 2017; Wade, 1993).
In the United States, the regulation of curricular standards is determined at the state level, potentially producing regional differences in what children are taught about the nation’s past and its values. States with the largest student populations wield disproportionate influence because textbook publishers often adapt to their requirements, thereby shaping what is available in the broader textbook market (Lucy et al., 2020). California and Florida provide especially striking cases. Both states serve millions of students and represent ideological poles in contemporary U.S. politics. California has emphasized inclusive history and the representation of marginalized groups through initiatives such as the FAIR Education Act, while Florida has in recent years enacted policies restricting the teaching of topics related to race, gender, and sexuality (Friedman and Tager,
2022). These different political climates potentially impact how curricular content is being written, approved, and delivered to students across these two states. The question for research is: how do state-level politics shape what children actually encounter in their textbooks?
From a computational standpoint, however, systematically comparing textbooks across states presents a nontrivial natural language processing (NLP) challenge. Textbook publishers commonly produce multiple state-specific editions of the same textbook series that are designed to be nearly interchangeable.
These editions typically share the vast majority of their wording, differing only through small, targeted edits introduced to satisfy state adoption standards. As a result, textbook comparison constitutes a near-duplicate long-form text setting, in which two documents may exhibit extremely high lexical overlap while differing meaningfully in framing through sparse edits. In such settings, conventional document-level analyses (such as topic modeling, aggregate sentiment measures, or chapter-level similarity) are ill-suited to detect the small subset of spans where ideologically salient differences occur.
There is limited published research on how California and Florida textbooks differ in practice. Prior studies highlight persistent underrepresentation and stereotyping in educational materials like gender roles in picture books (Allen et al., 1993; Clark, 2007; Koss and Paciga, 2020) and portrayals of race and ethnicity in U.S. history texts (Bickford and Knoechel, 2017; Lucy et al., 2020). Recent advances in computational social science have allowed researchers to scale these analyses across time and media, showing how biases are embedded in text (Adukia et al., 2022b,a, 2023; Charlesworth et al., 2022) and (in other settings) imagery (Szasz et al., 2022; Crawfurd et al., 2024). Yet little work has compared textbooks across politically polarized states to trace how ideology may shape curricular content.
This study analyzes state-adopted middle school social studies textbooks from California and Florida (2017–2023) using natural language processing techniques. Social studies was chosen because of its central role in teaching history, civics, and cultural identity—subjects especially susceptible to ideological contestation. Specifically, a transformer-based language model, BERT (Liu et al., 2022), was employed to detect nuanced contextual framing. This approach captures not just what is said in textbooks, but how it is said, including tone, associations, and ideological framing embedded in descriptions of historical events, groups, and values.
1.1 Problem Formulation
California–Florida edition comparison was formalized as a sentence and passage-level divergence detection and framing classification task. Let DCA and D FL be publisher-matched textbook editions covering the same subject and grade level.
1. Alignment: Segment each document into sentences (or short spans) and compute a mapping that aligns semantically corresponding units across DCA and DFL, allowing for minor edits and local reorderings.
2. Divergence Extraction: Identify aligned pairs that differ, including (i) edition-exclusive content (addition/redaction cases), (ii) rephrasings where both editions contain a span but the aligned content differs in emphasis, agency attribution, or evaluative tone, and (iii) stylistic variations.
3. Framing Classification: For each divergent unit, estimate an ideological framing label y {Left,Center, Right} and associated probabilities p(y|s) using a transformer-based classifier.
4. Aggregate Analysis: Compare framing distributions by state and subject, and relate divergences to edit type (additions/redactions vs. rephrasings vs. stylistic edits) and to validated thematic categories.
This formulation treats state-edition differences as a sparse, low-signal NLP task in which most content is identical and the goal is to model the small fraction of edited spans.
1.2 Contributions
This paper makes three primary contributions. First, it introduces a 2.2-million-word dataset of 16 publishermatched California and Florida middle school social studies textbooks (2017–2023), enabling controlled comparison under extreme lexical overlap. Second, it presents a near-duplicate comparison pipeline that combines sentence-level alignment with transformerbased framing classification tailored to low-signal settings. Third, it provides empirical evidence that while approximately 96% of textbook content is identical across matched editions, the remaining ~4% contains systematic and state-consistent differences in modelpredicted ideological framing, with the strongest divergence observed in civics education.
2. Data Sources
This study draws upon a dataset of 16 state-adopted middle school social studies textbooks adopted by both California and Florida published between 2017 and 2023.
These two states maintain centralized textbook adoption processes that chose versions of the same textbooks while currently occupying opposing poles in the American political landscape. By collecting matched editionsversions of the same publisher series customized to appeal to the Florida and California markets—this dataset allows a systematic comparison of how political considerations shape the content presented to millions of students. The resulting collection spans three domains central to civic education: U.S. history, world history, and civics/government. Altogether, the dataset comprises 11,470 pages (approximately 2.2 million words), with 5,735 pages from California and 5,735 from Florida.
2.1 Florida Textbooks
Florida constitutes one of the most consequential textbook markets in the United States. The state serves over 2.8 million K–12 public school students and operates a centralized adoption system: the Department of Education maintains an official list of approved textbooks for each subject and grade, from which districts must purchase unless they receive special waivers. This centralized structure ensures that publishers adapt their products directly to Florida’s curricular frameworks and political priorities, making the Florida market a powerful driver of national textbook content.
Since 2017, Florida has undergone a series of highprofile political interventions in education policy. The state’s Civics Literacy Initiative mandated greater emphasis on patriotism and “founding principles” in civics curricula, while subsequent legislative measures— including the Stop WOKE Act (2022) and restrictions on the discussion of sexuality and gender identity—further narrowed the scope of permissible topics in public education (Friedman and Tager, 2022). Now, Florida follows its B.E.S.T. Standards (Benchmarks for Excellent Student Thinking, adopted in 2020), replacing Common Core–style standards. Textbooks approved under these standards are expected to downplay or omit references to structural racism, gender inequality, and LGBTQIA+ histories, reflecting a conservative orientation in both selection and framing.
2.2 California Textbooks
California provides a counterpoint of comparable scale and equal national influence. The state educates more than 6 million K-12 public school students and, like Florida, centrally manages textbook adoptions through the State Board of Education. California has historically used this power to push publishers toward inclusionary standards. The FAIR Education Act of 2011, for example, required the integration of LGBTQIA+ figures, ethnic
minorities, and people with disabilities into social studies instruction. Textbooks adopted after this legislation are explicitly evaluated for compliance with diversity and inclusion criteria, with state panels rejecting volumes that omit or inadequately address marginalized groups. Within the 2017–2023 period under study, California’s adoption lists consistently emphasized multicultural perspectives, civil rights struggles, and historical episodes of inequality as essential to students’ civic education. Publishers seeking California adoption often expanded content to highlight indigenous histories, immigrant communities, and contemporary social movements (Adukia and Harrison, 2025). This progressive orientation makes California a useful benchmark for examining how state-level inclusionary policies shape textbook content relative to Florida’s conservative approach.
2.3
Textbooks Collected
Eight publisher-matched pairs of textbooks—one Florida edition and one California edition for each pair— were collected across U.S. history, world history, and civics/government (Table 1). This design holds constant publisher, subject, and intended grade level, allowing ideological differences to be isolated from variations in writing style or pedagogical approach.
Table 1: Publisher-Matched Textbooks (California and Florida, 2017–2023)
3. Methods
3.1 Initial Comparison Strategy
Automated comparisons of matched textbook chapters produced very high similarity scores (Figure 1), confirming that publishers construct California and Florida editions from a common base text with targeted modifications. It is only through sentence-by-sentence analysis that meaningful differences can be flagged and analyzed. Using a string-alignment method at the sentence level, the analysis found that approximately 96% of sentences were identical across state editions.
3.2 Sentence Alignment and Divergence Detection
Textbooks were segmented into sentences using a rule-based sentence tokenizer adapted for textbook prose, with custom handling for abbreviations, bullet points, captions, and section headers. For each publishermatched California–Florida textbook pair, sentence alignment was performed using a string-based alignment approach implemented with Python’s difflib sequence matching utilities.
Sentence pairs were compared using normalized string similarity, and alignments were established by selecting the highest-similarity match under local reordering constraints. Any aligned sentence pair with non-identical strings was flagged as divergent, regardless of the magnitude of the edit. This conservative criterion was intentionally adopted to avoid bias toward longer or more content-rich edits and to ensure that even minimal wording differences were retained for analysis.
This study identified 603 pairs of passages comprising the 4% subset of identified sentence-level divergences. These passages were categorized into three types: content (i) present in one edition but absent in the other; (ii) rephrased in ways that altered emphasis, agency attribution, or evaluative tone between the two editions; and (iii) showed minor stylistic and non-substantive variations. These 603 passage pairs formed the evaluation
set for downstream classification. Figure 2 illustrates one such passage-pair.
Figure 1: Chapter-level comparison of political leaning scores for matched California and Florida editions of U.S. History: American Stories, Beginnings to 1877 (National Geographic, 2024). The two lines track almost identically across all 25 chapters, demonstrating that at the whole-text level the editions are nearly indistinguishable.
3.3 Classification Models Tested
Two approaches were evaluated in sequence.
3.4 Valence–Arousal–Dominance (VAD)
To characterize the sentiment of words related to and the actions taken by agents of different identities,three attributes of words were measured: their valence (V), arousal (A), and dominance (D).
• Valence measures range from happiness to unhappiness, or positive to negative.
• Arousal measures indicate a level of “affective activation,” or active to passive.
• Dominance measures reflect the level of control of the emotional state, or dominant/powerful tosubmissive/ weak.
Using the NRC VAD Lexicon (Mohammad, 2018), which includes more than 20,000 English words with associated VAD scores. Scores range from 0 to 1. For example, the words “teamwork” and “leader” have {V, A, D} scores of {0.92, 0.49, 0.77} and {0.83, 0.58, 0.93}, respectively. Both exhibit relatively positive valence, but “leader” carries higher arousal and dominance values, signaling more intensity and control.
The VAD method is useful descriptively, providing a coarse-grained sense of affect and agency across passages. However, this approach fails to capture ideological differences in framing. For example, celebratory treatments of Columbus and Martin Luther King Jr. both produce high valence and dominance scores despite their divergent ideological implications (see Table 2). For this reason, VAD was retained as a descriptive supplement rather than the primary classification tool.
Table 2: Example VAD scores for ideologically divergent but affectively similar praise
3.4 The POLITICS Model (SELECTED)
The classifier used in this study is based on POLITICS (Liu et al., 2022), a RoBERTa-based encoder pretrained specifically for U.S. political text. POLITICS was introduced in a peer-reviewed paper at Findings of the Association for Computational Linguistics: NAACL 2022, ensuring credibility through external scholarly
review and presentation at a major natural language processing conference. This peer-review context establishes POLITICS as a vetted, reliable model within computational political text analysis.
How the Model Works. POLITICS was designed to capture ideological framing rather than just sentiment. Unlike standard encoders, which rely solely on masked language modeling, POLITICS integrates a same-story comparison objective. During pretraining, it aligns multiple news articles covering the same event from different outlets and pushes their representations apart if they express divergent ideologies, while pulling them closer if they share framing. This triplet-style objective permits the model to attend to differences in emphasis, attribution of agency, and evaluative tone—the same kinds of subtle cues found in textbooks.
Model Architecture. This model is built on RoBERTa (Robustly Optimized BERT Pretraining Approach). Like BERT, POLITICS is built on a transformer encoder with bidirectional self-attention, enabling it to learn contextual word representations from both left and right context simultaneously. The architecture is adapted with an enhanced pretraining regime: First, the model is trained to pull ideologically similar texts closer together in its internal representation while pushing ideologically different texts farther apart, helping it distinguish left- and right-leaning framings. Second, it is trained to focus on framing rather than outlet-specific writing style, reducing the risk that it simply learns to identify a publication instead of ideological language. Third, its masked language modeling objective is adjusted to emphasize names and evaluative terms, since ideological differences often depend on who is mentioned and how they are described.
Training Strategy. The model was trained on BIGNEWS, a corpus of 3.7 million U.S. political news articles across 11 outlets. A balanced subset (BIGNEWSBLN) ensured no single outlet dominated, and an aligned subset (BIGNEWSALIGN) grouped articles on the same events to power the same-story training objective. The training emphasized both breadth (multiple sources and ideologies) and alignment (direct contrasts of framing). During continued pretraining from RoBERTa-base, the ideology and story objectives were jointly optimized with masked language modeling, producing an encoder that retains broad language capabilities while specializing in political discourse. Importantly, the datasets underlying this model are recent publications spanning 2018–2021. The temporal alignment between model training data (2018–2021) and the corpus of analyzed textbooks (2017–2023) ensures that the classifier reflects contemporary U.S. political discourse, making it particularly well-suited to detect ideological framing in modern curricular materials.
Credibility and Validation. The NAACL Findings paper validated POLITICS across 11 political ideology and stance detection datasets, including news, tweets, YouTube comments, and speeches. It consistently outperformed RoBERTa and BERT baselines, particularly for long, formal texts and in few-shot scenarios. This paper provides peer-reviewed, quantitative evidence that POLITICS is both methodologically sound and empirically validated.
Independent benchmarking by Volf and Šimko (2025) strengthens this credibility. In their large-scale comparison of 12 leaning models across 14 datasets, POLITICS emerged as the most effective base encoder for out-of-distribution generalization, outperforming other BERT- and RoBERTa-family models. Their results confirm that POLITICS is not only strong in-domain but also robust when applied to novel corpora such as textbooks—a domain not present in its training data.
Why POLITICS Fits Textbooks. Textbook prose is typically formal, lengthy, and writtenTextbook prose is typically formal, lengthy, and written in a neutral tone. Any ideological framing emerges through subtle choices: what is foregrounded versus backgrounded, how agency is attributed, whether structural causes are named. Standard sentiment lexicons or generic encoders fail to capture these distinctions (Volf and Šimko, 2025). By contrast, this domain-specific classifier learns U.S.specific cues (lexical, syntactic, and topical) that correlate with framing choices—for example, heroic discovery versus settler colonialism; individual exceptionalism versus structural causation; civic identity centered on patriotism versus pluralism. POLITICS advantages on long, formal text and its validated out-of-distribution robustness make it highly suited to textbook analysis.
For this study, POLITICS was applied in a zero-shot setting—that is, without any additional fine-tuning on textbook data—and was used within a two-stage pipeline:
1. A politicalness gate, which filters out non-political passages. The politicalness detector(benchmarked in Volf and Šimko, 2025) reports F1 scores (which are the harmonic mean between precision and recall) above 0.90, ensuring high precision in identifying relevant material.
2. A leaning classifier, which assigns each political passage probabilities of Left, Center, or Right. These labels are U.S.-contextualized: Left aligns with Democratic/progressive framing, Right with Republican/conservative framing, and Center with neutral or cross-partisan framing.
By combining peer-reviewed credibility, demonstrated performance across multiple datasets, and independent
benchmarking validation, POLITICS provides both the methodological rigor and empirical justification necessary for analyzing ideological content in stateadopted textbooks.
Confidence Thresholding. To reduce noise from uncertain predictions, only passages with a maximum class probability of at least 0.75 were assigned a leaning label. Passages below this threshold were excluded from aggregate framing distributions. As a result, lowconfidence outputs (e.g., p = 0.51) were not treated equivalently to high-confidence predictions (e.g., p ≥ 0.95). This thresholding strategy emphasizes precision over coverage and ensures that reported ideological patterns are driven by confidently classified passages.
3.5 Worked Example
Examplepassage:“ChristopherColumbusishonored for his courage and discovery, opening a new era of explorationfortheworld.”
The analysis of 603 pairs of divergent passages reveals consistent and systematic differences in how history, world events, and civic values are communicated to middle school students. These differences were identified in U.S. History, World History, and Civics Education. To move beyond anecdotal impressions, each divergent passage was classified using the POLITICS model, which outputs probabilities over Left, Center, and Right ideological framings. It is important to note that the classifier produces probabilistic ideology labels but does not generate natural-language rationales. Accordingly, when we describe why a passage was labeled Left/Center/ Right, we are offering an interpretive explanation based on observable framing cues (e.g., agency, attribution, evaluative language), not a justification produced by the model. In addition to the broad ideological leaning, we also coded whether the divergence took the form of a redaction (omission of a word) or a rephrasing (altering evaluative tone while retaining coverage).
What emerges is a consistent pattern (Fig. 3): California textbooks overwhelmingly lean toward liberal or progressive framings, while Florida textbooks lean toward centrist or conservative framings, particularly when dealing with politically sensitive content. These divergences vary in intensity across subjects, with Civics
Table 3: Comparison of Models on Columbus Passage
Education showing the sharpest polarization, U.S. History exhibiting moderate but notable differences, and World History revealing more subtle contrasts. Yet beyond broad ideological orientation, the manner in which these differences materialize—through redaction or rephrasing—provides additional insight into the editorial logics at work in each state.
Figure 3: State Leaning Distribution by Subject. Each bar represents the proportion of divergent passages classified as Left, Center, or Right in Civics, U.S. History, and World History for Florida and California editions.
4.1 US History
U.S. History textbooks provide some of the clearest illustrations of divergent framing. California editions repeatedly emphasized the lived experiences of marginalized groups, foregrounding Indigenous, African American, and immigrant perspectives. Florida editions, in contrast, often redacted references or rephrased events in institutional or procedural terms.
Consider the treatment of Indigenous removal in the early nineteenth century. A California passage described the Trail of Tears as:
“The forced removal of the Cherokee Nation was a tragic example of how the U.S. government disregarded Indigenous rights. Thousands perished on the march, and the consequences of displacement continue to reverberate today.”
Source: TCI, History Alive! The U.S. Through Industrialism, California ed. (2017), p. 77.
The Florida edition of the same chapter omitted this sentence entirely, replacing it with a neutral description:
“The Indian Removal Act of 1830 authorized the relocation of several Native tribes to new land swest of the Mississippi, a policy that reduced conflict with settlers and opened land for agriculture.”
Source: TCI, History Alive! The U.S. Through Industrialism, Florida ed. (2023), p. 77.
The POLITICS classifier marked the California passage as Left (0.83) due to its emphasis on structural injustice, while the Florida version was classified as Right (0.72) for its institutional justification of the policy.
Similar patterns appear in the coverage of slavery and Reconstruction. California texts included explicit mentions of slave resistance, describing how enslaved individuals resisted bondage through cultural survival, literacy, and rebellion (Left, 0.89). Florida editions, by contrast, often replaced these accounts with legislative milestones such as the Compromise of 1850 or the Kansas-Nebraska Act (Center, 0.64).
Overall, California U.S. History passages were classified as Left in 58% of cases, Center in 34%, and Right in only 8%. Florida passages leaned Center (59%) but had a substantial proportion tagged Right (22%), suggesting a more conservative orientation overall (Table 4).
4.2 World History
World History textbooks displayed subtler but still consequential divergences. Both states’ editions covered the same topics, such as the Renaissance, the Scientific Revolution, and the Enlightenment. Yet California books consistently widened the frame to highlight contributions from non-Western societies, while Florida texts emphasized Western exceptionalism.
For example, in a section on the Renaissance, California students encountered the following:
“While the Italian Renaissance is often celebrated for its art and philosophy, it is important to remember that scholars in the Islamic world were making simultaneous advances in astronomy, mathematics, and medicine. These ideas traveled across cultural boundaries and influenced Europe in profound ways.”
Source: National Geographic, World History: Ancient Civilizations, California ed. (2024), p. 652.
The classifier labeled this as Left (0.77), given its emphasis on pluralism and cross-cultural exchange. By contrast, Florida textbooks framed the Renaissance as:
“The Renaissance was a European achievement, marking the rebirth of classical knowledge and setting the stage for Western dominance in science, politics, and art.”
Source: National Geographic, World History: Ancient Civilizations, Florida ed. (2024), p. 652.
Table 4: Classifier outputs for U.S. History passages
This passage was tagged Right (0.68), reflecting its nationalist orientation.
Another recurring theme was creation stories in National Geographic’s World History: Ancient Civilizations (2024) on pg. 121. California editions juxtaposed Biblical, scientific, and Indigenous narratives, offering multiple perspectives (Left, 0.82). Florida editions shortened the comparison, pairing Genesis with the Big Bang but omitting Indigenous cosmologies (Center, 0.59).
Quantitatively, California’s divergent World History passages leaned Left in 62% of cases, while Florida’s leaned Left in only 28%. Florida texts were more likely to be classified as Center (55%), with a smaller share leaning Right (17%).
4.3 Civics Education
The Civics domain produced the sharpest ideological contrasts. Consider a passage from a California civics chapter:
“Harvey Milk, one of the first openly gay elected officials in the United States, championed equality and inspired generations of LGBTQ+ Americans to participate in civic life.”
Source: McGraw Hill, U.S. Government & Civics, California ed. (2024), p. 261.
Source: McGraw Hill, U.S. Government & Civics, California ed. (2024), p. 261.
The classifier labeled this as Left (0.87). In the Florida edition, the parallel discussion omitted Milk entirely, instead offering a general statement:
“Community leaders in the 1970s worked to expand rights for different groups of citizens.”
Source: McGraw Hill, U.S. Government & Civics, Florida ed. (2024), p. 261.
This sentence was classified as Center (0.53). In other places, Florida editions retained discussion of same-sex marriage but reframed it in terms of religious liberty, such as:
“The Supreme Court’s 2015 decision to redefine marriage raised concerns about whether religious schools and businesses could uphold their beliefs in public life.”
Source: McGraw Hill, U.S. Government & Civics, Florida ed. (2024), p. 323.
This was labeled Right (0.71).
Aggregated results confirm the polarization: 70% of California civics passages were classified Left, while 44% of Florida civics passages were classified Right (Table 6).
Table 6: Classifier outputs for Civics Education passages
4.4
Additions, Redactions, Rephrasings, and Stylistic Variations
When disaggregating by form of divergence, three categories emerged (Figure 4). Approximately 51% of the differences involved additions or redactions—cases in which a sentence or paragraph appeared in one state’s edition but not in the other. Because the publisher’s underlying base text was not available, it was not possible to determine whether a given discrepancy represented an addition in one edition or a removal in the other. Another 35% were rephrasings, in which shared content was retained but presented with altered emphasis, evaluative tone, or ideological framing. The remaining 14% constituted stylistic variations, involving grammatical shifts (e.g., punctuation, prepositions, or other syncategorematic words) that did not materially change meaning.
Figure 4: Stacked bars show the percentage of divergent textbook passages classified as additions/ redactions, rephrasings, or stylistic variations within U.S. History, World History, and Civics Education. Additions and redactions were most common overall.
Additions and Redactions. These were most prevalent in politically or socially sensitive domains such as slavery, Indigenous dispossession, civil rights, gender and sexuality, and contemporary social movements. For example, in a chapter on Reconstruction: California: “The Ku Klux Klan used violence and intimidation to suppress Black political participation,
Table 5: Classifier outputs for World History passages
shaping the region’s politics for decades.”
Source: McGraw Hill, IMPACT: CA, Grade 8, U.S. History & Geography: Growth & Conflict (2019), p. 413.
Florida: [Sentence not present]
Source: McGraw Hill, United States History: Voices & Perspectives, Early Years, Florida ed. (2024), p. 413.
Here, the Florida edition did not include explicit reference to white supremacist violence. Without access to the publisher’s base text, it is unclear whether this represents a Florida redaction or a California addition. However, the classifier flagged this omission as significant as the California passage was tagged Left (0.86), while the Florida text defaulted to a Center-neutral framing.
Similarly, California editions frequently included passages acknowledging the federal government’s lack of recognizing nonbinary gender identities and female leaders within Indigenous societies, while Florida editions contained no discussion of gender roles or identities in these contexts. For instance, a California text stated and was labeled this as Left (0.93) by the classifier:
“The Dawes Act recognized male heads of families, disrupting some traditional societies in which females held leading roles. The policies also refused to recognize the authority of ’two-spirit’ individuals—what today we might consider lesbian, gay, bisexual, or transgender Native Americans—who held special roles in some groups.”
Source: McGraw Hill, IMPACT: CA, Grade 8, U.S. History & Geography: Growth & Conflict (2019), p. 442.
The corresponding Florida version read only and was labeled this as Right (0.78) by the classifier:
“Some Native American groups had grown attached to their reservations and hated to see them divided into homesteads.”
Source: McGraw Hill, United States History: Voices & Perspectives, Early Years, Florida ed. (2024), p. 442.
These divergences illustrate how omissions or additions—whether intentional or incidental—can shift the moral and political framing of historical narratives. Additions and redactions were disproportionately concentrated in U.S. History and Civics Education chapters, which often contained discussions of slavery, racial violence, citizenship, and social justice.
Rephrasings. Rephrasings preserved the underlying events but altered evaluative framing or moral emphasis. For example, in coverage of postwar suburbanization: California: “Movement of some white Americans from cities to suburbs was driven by a desire to get away from more culturally diverse neighborhoods.”
(Classified Left, 0.81)
Source: McGraw Hill, IMPACT: CA, Grade 8, U.S. History & Geography: Growth & Conflict (2019), p. 542.
Florida: “Reasons for suburban growth varied. Some people wished to escape the crime and congestion of the city.”
(Classified Right, 0.74)
Source: McGraw Hill, United States History: Voices & Perspectives, Early Years, Florida ed. (2024), p. 542.
Both passages describe the same phenomenon, but the explanation shifts from white backlash to black advancement after the Civil War, from Reconstruction to housing discrimination in the 20th century. Whereas California attributes it to racialized avoidance, Florida frames it as a neutral response to urban discomfort. Similarly, according to a California textbook, Southern whites resisted Reconstruction because they “did not want African-Americans to have more rights.” But the Florida edition offers an alternate reason: Reforms cost money, and that meant higher taxes.
Likewise, both states emphasize the role of big business from the Gilded Age to the present in National Geographic’s U.S. History: American Stories, Beginnings–1877 (2024) on pg. 479. However, California is critical of wealth inequality and the impact of companies like Standard Oil on the environment, writing that “The yawning gap between the haves and have-nots and what is to be done about it is one of the great questions of this time” (Classified Left, 0.93) while Florida used the same space to celebrate free enterprise and “entrepreneurs such as Andrew Carnegie, whose innovations and generosity helped build the modern economy” (Classified Right, 0.87).
Similarly, in Civics chapters of National Geographic’s Civics & Citizenship (2024) on pg. 193, California framed the First Amendment as enabling protest and inclusivity (Classified Center, 0.85), while Florida emphasized religious liberty and limits on government intervention (Classified Right, 0.86). Rephrasings thus operated as a subtler ideological filter—retaining shared content but adjusting its evaluative stance.
Stylistic Variations. A smaller proportion of divergences (about 14%) were purely stylistic, involving grammatical adjustments, punctuation, or shifts in function words that did not change meaning. These differences reflected copyediting conventions rather than ideological intent. For example, in a section describing the U.S. Constitution:
California: “The Constitution is a living document, one that continues to guide the nation.” (Classified Center, 0.83)
Source: McGraw Hill, U.S. Government & Civics, California ed. (2024), p. 261.
Florida: “The Constitution remains a living document that continues guiding the nation.” (Classified Center, 0.83)
Source: McGraw Hill, U.S. Government & Civics, Florida ed. (2024), p. 261.
While semantically identical, the Florida sentence eliminates the comma and compresses the verb phrase (“continues guiding” instead of “continues to guide”), producing a slightly more formal cadence. Other examples included replacing “however” with “but,” adjusting articles (“a” vs. “the”), or substituting “because” for “as.” These minor editorial variations were especially concentrated in World History chapters, which showed 28% of their divergences in this category—far more than U.S. History or Civics Education. These changes carried no ideological weight but demonstrate the micro-level editorial variation introduced during state approval and production.
Overall, additions and redactions tended to involve politically contested material, while rephrasings modified the framing of shared events to align with each state’s ideological climate. Stylistic variations, though more frequent in World History, were nonsubstantive. Together, these findings indicate distinct editorial strategies: additions and redactions functioned as mechanisms of content selection, rephrasings as tools of ideological framing, and stylistic variations as neutral artifacts of the production process.
4.5 Thematic Coding of Divergences
This study developed a content classification method and validated it using a test–retest procedure. To understand the substantive nature of content differences beyond their linguistic form, each of the 603 divergent passage pairs was manually coded for thematic content. Coding identified the central topics of ideological disagreement across editions and quantified which domains of knowledge and representation were most affected. This qualitative layer complements the computational analysis by revealing the substantive issues driving divergence between state editions.
4.6 Coding Procedure
Passages were read in their full page context and assigned to one of ten thematic categories based on their dominant topical focus. Categories were developed inductively during early rounds of annotation, then refined to maximize conceptual clarity and mutual exclusivity. A test-retest was conducted to ensure reliability. A second annotator independently coded a 15% validation subset; intercoder agreement reached Cohen’s ĸ = 0.93, indicating strong consistency in category assignment.
4.7 Thematic Domains
The ten thematic categories capture the major domains in which ideological divergences appeared:
• Indigenous Histories & Colonization: Discussions of Native sovereignty, land dispossession, assimilation, and resistance.
• Economic Inequality & Labor: Depictions of class, capitalism, labor rights, and wealth distribution.
• Religion & Morality: Framing of religious freedom, moral instruction, and Christianity’s civic role.
• Immigration & Multiculturalism: Narratives highlighting immigrant experiences and cultural pluralism.
• National Identity & Patriotism: Expressions of American exceptionalism, nationalism, and civic loyalty.
• Environmental Issues: References to climate change, conservation, and industrialization.
• Other: Residual category.
4.8 Distribution of Divergences
Across the 603 divergent passages, the majority centered on a small number of politically and socially salient themes (Fig. 5, Table 7). Over half of all divergences concerned structural racism, civil rights and activism, or gender and sexuality, underscoring how contemporary debates around race, inequality, and identity shape curricular framing. Issues tied to Indigenous histories, religion and morality, and economic
inequality also appeared frequently, together accounting for nearly a third of the corpus. In contrast, topics such as environmental issues and national identity represented a smaller but symbolically significant share, often reflecting each state’s broader ideological orientation toward civic pride or environmental regulation. Additions and redactions dominated in explicitly political or identityrelated material, while rephrasings were more common in domains like religion, economics, and environmental topics, where editors retained shared content but altered evaluative tone. Stylistic variations—though present across categories—were concentrated in less politically charged subjects, suggesting that editorial energy was directed toward reworking meaning rather than grammar.
Overall, the combined quantitative and qualitative analysis underscores that ideological divergence in textbooks operates through both content selection and discursive framing—that is, through decisions about what to include and how to say it.
Figure 5: Visual distribution of divergent passages by thematic domain. Bars show each theme’s proportion of total divergences.
Table 7: Distribution of Divergent Passages by Theme and Form (N = 603). Each row shows within-theme proportions; the last row shows corpus totals.
4.9 Aggregate Patterns
Taken together, the POLITICS classifier outputs confirm systematic ideological divergence (Fig. 6). California-
exclusive passages leaned Left in 61% of cases, Center in 31%, and Right in only 8%. Florida-exclusive passages leaned Left in just 18% of cases, Center in 49%, and Right in 33%. Figure 7 visualizes the distributions by state.
Figure 6: Aggregate ideological leaning by state. Bars show the percentage of divergent textbook passages classified as Left, Center, or Right in California and Florida editions. California passages predominantly leaned Left, while Florida passages leaned Center or Right, reflecting systematic differences in ideological framing across states.
4.10 Statistical Evaluation of Framing Distributions
To assess whether the observed differences in ideological framing distributions between California and Florida exceed what would be expected by chance, the association between state edition (California vs. Florida) and classifier-assigned ideological label (Left, Center, Right) is evaluated using tests of independence. Contingency tables of divergent passage counts by state and framing label are constructed both aggregated across all subjects and stratified by subject area (U.S. History, World History, and Civics Education).
Aggregating over all 603 divergent aligned passage pairs, a chi-square test of independence is applied to the state × framing-label contingency table. The test strongly rejects the null hypothesis that ideological label assignments are independent of state edition X2(2) = 232.73, p < 0.0001. This result indicates a very strong association between state and predicted framing labels, confirming that the distributional differences summarized in Figure 6 are extremely unlikely to arise from random variation in classifier outputs.
Independence is further evaluated within each subject area:
• World History: X2(2) = 50. 89, p < 0.0001
• U.S. History: X2 (2) = 69.25, p < 0.0001
• Civics Education: X2(2) = 121.57, p < 0.0001
All subject-level tests reject the null hypothesis of independence, indicating that state-level differences in framing are statistically significant within each domain. Consistent with earlier distributional analyses, the largest chi-square statistic occurs in Civics Education, reflecting the strongest divergence between California and Florida editions in that subject. Together, these statistical analyses provide a principled evaluation showing that the magnitude of the observed state-level framing differences is extremely unlikely to arise by chance under the null of no association.
5. Conclusion
This study presents a computational analysis of publisher-matched middle school social studies textbooks adopted in California and Florida, focusing on localized linguistic variation in near-duplicate texts. Although approximately 96% of textbook content is identical across state editions, the remaining divergent passages exhibit systematic differences in framing that correlate with state adoption.
Empirical analysis shows that these differences are unevenly distributed across subjects, with civics education exhibiting the greatest divergence, followed by U.S. history and world history. Divergences take multiple forms: additions or redactions alter content inclusion, rephrasings modify evaluative emphasis while preserving topical coverage, and stylistic edits reflect non-substantive editorial variation. Thematic analysis further indicates that divergences are concentrated in a limited set of socially and politically salient domains. Beyond the substantive findings, this project contributes to three bodies of research. First, it extends the literature on the ideological content of curricula by offering a comparative, state-level analysis (Cantoni et al., 2017; Wade, 1993). Second, it demonstrates the value of computational approaches for analyzing education and culture (Caliskan et al., 2017; Garg et al., 2018; Charlesworth et al., 2022). Whereas earlier textbook studies often relied on small-scale coding of gender or race representation, this project utilizes large-scale computational methods to detect ideological differences across a matched set of state-adopted textbooks. Third, it provides new policy-relevant evidence about the specific ways partisan politics in the United States are shaping children’s educational experiences, with implications for civic identity, historical understanding, and democratic participation.
At a time when educational gag orders and partisan interventions in curriculum standards are proliferating, these findings highlight the importance of transparency and scrutiny in textbook approval processes. State decisions about what stories are told—and how—have
profound implications for how future citizens understand democracy, history, and belonging. The divergences observed between California and Florida are not isolated anomalies but indicators of a broader struggle over civic education in the United States. Analyzing and making visible these differences is therefore not only an academic exercise but a democratic imperative.
6. Acknowledgement
I would like to thank Dr. Daniel Egger of Duke University’s Pratt School of Engineering for his guidance, mentorship, and insightful feedback throughout the research process.
7. References
Adukia, A., P. Chiril, C. Christ, A. Das, A. Eble, E. Harrison, and H. B. Runesha, 2022a: Tales and tropes: Gender roles from word embeddings in a century of children’s books. In Proceedings of the 29th International Conference on Computational Linguistics, pp. 3086–3097.
Adukia, A., C. Christ, A. Das, and A. Raj, 2022b: Portrayals of race and gender: Sentiment in 100 years of children’s literature. In Proceedings of the 5th ACM SIGCAS/SIGCHI Conference on Computing and Sustainable Societies, ACM, pp. 20–28.
Adukia, A., A. Eble, E. Harrison, H. B. Runesha, and T. Szasz, 2023: What we teach about race and gender: Representation in images and text of children’s books. The Quarterly Journal of Economics, 138(4), 2225–2285. Adukia, A. and E. Harrison, 2025: Separation of church and state curricula? Examining public and religious private school textbooks. https://www.nber.org/papers/ w33791
Allen, A. M., D. N. Allen, and G. Sigler, 1993: Changes in sex-role stereotyping in Caldecott Medal award picture books 1938–1988. Journal of Research in Childhood Education, 7(2), 67–73.
Bickford, J. H. and L. A. Knoechel, 2017: The historical representation of Native Americans within primary- and intermediate-level trade books. The Councilor: A Journal of the Social Studies, 78(2), 4.
California State Legislature, 2011: Fair Education Act. Cal. Educ. Code § 51204.5 (2011), also known as the Fair, Accurate, Inclusive, and Respectful Education Act.
Caliskan, A., J. J. Bryson, and A. Narayanan, 2017: Semantics derived automatically from language corpora contain human-like biases. Science, 356(6334), 183–186.
Cantoni, D., Y. Chen, D. Y. Yang, N. Yuchtman, and Y. J. Zhang, 2017: Curriculum and ideology. Journal of Political Economy, 125(2), 338–392.
Charlesworth, T. E. S., A. Caliskan, and M. R. Banaji, 2022: Historical representations of social groups across 200 years of word embeddings from Google Books. Proceedings of the National Academy of Sciences, 119(28), e2121798119.
Clark, R., 2007: From margin to margin? Females and minorities in Newbery and Caldecott Medal-winning and honor books for children. International Journal of Sociology of the Family, 33(1), 263–283.
Crawfurd, L., C. Saintis-Miller, and R. Todd, 2024: Sexist textbooks: Automated analysis of gender bias in 1,255 books from 34 countries. PLOS ONE, 19(10), e0310366.
Devlin, J., M.-W. Chang, K. Lee, and K. Toutanova, 2019: BERT: Pre-training of deep bidirectional transformers for language understanding. In Proceedings of NAACLHLT 2019, Association for Computational Linguistics, Minneapolis, Minnesota, pp. 4171–4186.
Florida Department of Education, 2020: Benchmarks for Excellent Student Thinking (B.E.S.T.) Standards. Florida Department of Education Rule 6A-1.09401, F.A.C. (2020), replaced Common Core standards and implemented new English Language Arts and Mathematics benchmarks. Florida Department of Education [Civics Literacy Initiative], 2021: Civics Literacy Initiative. Fla. Stat. § 1003.44 (2021), mandates civics instruction emphasizing patriotism and founding principles.
Florida Legislature, 2022: Individual Freedom Act (Stop WOKE Act). Fla. Stat. § 760.10(8)(a) (2022), legislation restricting instruction and training related to race, color, sex, or national origin.
Friedman, J. and J. Tager, 2022: Educational gag orders: Legislative restrictions on the freedom to read, learn, and teach. PEN America Report.
Garg, N., L. Schiebinger, D. Jurafsky, and J. Zou, 2018: Word embeddings quantify 100 years of gender and ethnic stereotypes. Proceedings of the National Academy of Sciences, 115(16), E3635–E3644.
Koss, M. D. and K. A. Paciga, 2020: Diversity in Newbery Medal-winning titles: A content analysis. Journal of Language and Literacy Education, 16(2), 1–20.
Lewis, M., Y. Liu, N. Goyal, M. Ghazvininejad, A. Mohamed, O. Levy, V. Stoyanov, and L. Zettlemoyer, 2020: BART: Denoising sequence-to-sequence pre-training for natural language generation, translation, and comprehension. In Proceedings of the 58th Annual Meeting of the Association for Computational Linguistics, Association for Computational Linguistics, Online, pp. 7871–7880.
Liu, C., D. Card, and J. Boyd-Graber, 2022: Politics: Pretraining with same-story article comparison for ideology prediction. In Findings of the Association for Computational Linguistics: NAACL 2022, Association for Computational Linguistics, Seattle, United States, pp. 1367–1380.
Liu, Y., M. Ott, N. Goyal, J. Du, M. Joshi, D. Chen, O. Levy, M. Lewis, L. Zettlemoyer, and V. Stoyanov, 2019: RoBERTa: A robustly optimized BERT pretraining approach. arXiv preprint arXiv:1907.11692.
Lucy, L., D. Demszky, P. Bromley, and D. Jurafsky, 2020: Content analysis of textbooks via natural language processing: Findings on gender, race, and ethnicity in Texas U.S. history textbooks. AERA Open, 6(3).
Michalopoulos, S. and C. Rauh, 2024: Movies. The Quarterly Journal of Economics.
Michalopoulos, S. and M. M. Xue, 2021: Folklore. The Quarterly Journal of Economics, 136(4), 1993–2046.
Mohammad, S. M., 2018: Obtaining reliable human ratings of valence, arousal, and dominance for 20,000 English words. In Proceedings of the 56th Annual Meeting of the Association for Computational Linguistics (Volume 1: Long Papers), Association for Computational Linguistics, Melbourne, Australia, pp. 174–184. NRC VAD Lexicon.
Riley, E., 2022: Role models in movies: The impact of Queen of Katwe on students’ educational attainment. The Review of Economics and Statistics, 1–48.
Szasz, T., E. Harrison, P.-J. Liu, P.-C. Lin, H. B. Runesha, and A. Adukia, 2022: Measuring representation of race, gender, and age in children’s books: Face detection and feature classification in illustrated images. In Proceedings of the IEEE/CVF Winter Conference on Applications of Computer Vision, IEEE, pp. 2465–2474.
Volf, M. and J. Šimko, 2025: Political leaning and politicalness classification of texts. Model: matous-volf/ political-leaning-politics (RoBERTa-based). arXiv, 18 July 2025. https://doi.org/10.48550/arXiv.2507.13913.
Wade, R. C., 1993: Content analysis of social studies textbooks: A review of ten years of research. Theory & Research in Social Education, 21(3), 232–256.
Williams, A., N. Nangia, and S. R. Bowman, 2018: A broadcoverage challenge corpus for sentence understanding through inference. In Proceedings of the 2018 Conference of the North American Chapter of the Association for Computational Linguistics: Human Language Technologies, Association for Computational Linguistics, New Orleans, Louisiana, pp. 1112–1122. Multi-Genre Natural Language Inference (MNLI).
DESIGN OF A HYBRID ML-DFT BASED WORKFLOW FOR MATERIALS SEARCH
Anjani Ganesh Attada
Abstract
This paper develops a framework for a valid, rapid screening search for materials testing using a machine-learning/DFT (density functional theory, a electronic structure calculation method for many body systems) based hybrid workflow. Using the graph neural network, MEGNet, we predict properties correlated with metallic behavior using pretrained models for non experimentally tested materials within the Materials Project database. We obtain values for band-gap and bulk/shear moduli. Using these predictions, we score the materials by normalizing and combining their scores. Then, with a scoring model, we obtain a list of the top 10 highest performing materials; with the best fit material being the compound CeNdAl2 O6. Once we finish initial screening using machine learning (ML), we move onto DFT testing where Quantum Espresso (QE) jobs were run for self-consistent-fields (SCF) calculations to validate our top 3 results: CeNdAl 2 O6, YU2 O6, and YUO4. After results were processed, plots were constructed to visualize data, validate our workflow design, and estimate potential superconductors within our sample to determine the efficiency of our dualphase validation system. The work conducted provides an accelerated path for scaling of materials discovery using rapid ML and accurate DFT validation which combine to provide a streamlined and reliable workflow for future works such as discovery of high temperature superconductors.
1. Introduction
Superconductor materials are a category of conductors that allow electricity to transfer with zero electrical resistance through a material. When a superconducting material is cooled to a certain temperature known as its critical temperature (Tc), it suddenly exhibits the property of having zero electrical resistivity. Having zero electrical resistivity essentially allows electrons to traverse through the material with no resistance, allowing for it to flow without any energy loss. Because of the ordering of their crystal structure, phonons, which are tiny packets of energy such as sound or vibration, are able to flow through the crystal in a way so that they do not interfere with the crystal lattice avoiding energy transfers and resulting in no electrical resistance within the material. To further define this, electrons traveling through a superconducting material form what is known as a cooperpair (Fig. 1), a pair of electrons or other fermions attracted to each other as they travel through a crystal lattice, attracting surrounding protons which enable a temporary positive charge within its path. There is no scattering of electrons, which is why they flow as a coherent unit and avoid interference with the lattice. The reason there exists a critical temperature for superconductors is because the pairing between the electrons is often quite weak—at 10−3 eV. Electrons can break easily with enough thermal and acoustic (phonons) interactions, explaining why most superconductors have low Tc, often around the millikelvin range for most materials. Superconductors are classified as either type-I or type-II superconductors, with key differences being that
type-I superconductors are mostly pure elemental metals (Pb, Hg, Al, etc.) which exhibit abrupt superconducting transition. Type-I superconductors only work at very low temperatures, and show the full Meissner effect; a property of superconductors (specifically type-I), where the expulsion of the magnetic field is observed from the superconducting object. On the other hand, typeII superconductors are typically complex compounds, exhibit two critical fields, allow a vortex state/mixed state, and often operate at higher temperatures than type-I superconductors. Often, materials discovery focuses on type-II superconductors due to their enhanced properties compared to those of type-I superconductors.
Figure 1: Schematic illustration of electron pairing (Cooper pairs) in a crystal lattice. Reproduced from Wikimedia Commons, image by Tem5psu, licensed under CC BY-SA 4.0.
Machine learning is a useful tool for the discovery of new materials as it excels in the prediction of quantum states and interactions at the quantumlevel. MEGNet (Chen et al., 2019), or the MatErials Graph Network, is a graph neural network (GNN) machine learning model which is used in materials discovery and material science to predict property of materials directly using its atomic structures. MEGNet treats molecular or crystalline structures as graphs where atoms are nodes, bonds/ interactions are edges, and global state variables describe overall conditions. Instead of hand-engineering features, MEGNet learns representations directly from the structure, using physics based graph message passing. MEGNet is defined as G = (V,E,U), where V is the set of nodes (atomic sets), E is the set of edges (bond/neighbor sets), and U is the global state (system level descriptors). V, atoms, are represented by a feature vector which includes an atomic number, element embedding (learned property), valence related properties, and a position (essentially all of these properties are a characteristic of the feature vector); the node typically learns atomic embeddings rather than using fixed chemical descriptors, allowing an increase in flexibility. The edge/neighbor features, E, represent neighbor relationships and traits, and not strict bonds. Some common edge features are: Interatomic distance, expanded distance via radial basis functions, and periodic boundary offsets, which allow the model to encode geometry, be invariant to translation and rotation, and respect periodicity; essentially edge features control relationships with surrounding nodes and the overall stability of the lattice. MEGNet constructs edges using a cutoff radius system for finding neighbors, which sets the distance that surrounding nodes are considered for property predictions. The global state U is MEGNet’s most powerful feature which depicts the material’s temperature, pressure, volume, number of atoms, charge, and magnetic field (in principle). MEGNet uses multiple stacked graph blocks, with each layer increasing the effective interaction range and allowing multibody interactions and complex interactions, which is similar to the iterative self-consistency in DFT. While there exist pretrained models for a few different properties, it is possible to train MEGNet on other properties such as T c values for superconductors, making useful for advanced materials screening applications.
Quantum Espresso (QE) (Giannozzi et al., 2009) is a suite of highly bundled ab initio codes that implement Density Functional Theory (DFT) and other related methods using plane-wave basis sets, pseudopotentials, and periodic boundary conditions. QE (Giannozzi et al., 2017) is optimized for crystals and periodic materials, phonons and lattice dynamics, electron-phonon coupling, and large scale parallel computing. QE is specially useful in this case for superconductivity discovery as it allows
for computation of electron phonon coupling which determines the key properties for approximation of the T c All QE calculations require a Self-Consistent Field (SCF) calculation, which checks convergence for an electron density. After SCF convergence, additional calculations such as phonons and electron–phonon coupling can be performed. One particularly important aspect of a QE input file is the choice of the right pseudopotential. The pseudopotential essentially replaces a true nuclear and core electron potential with a smooth and effective potential such that allows valence electrons to behave correctly outside a cutoff radius and that core electrons are removed from the calculation. This essentially attempts to shorten the calculation mathematically while maintaining the desired accuracy. Many pseudopotential sets exist, including PSLibrary, SSSP, and many others, that affect how this mathematical cut in calculation is handled. Choosing the right pseudopotential is also a significant factor as it affects how the object under study is treated during calculation; a poorly chosen pseudopotential could result in a inaccurate calculation result within QE.
There is a massive tradeoff between the accuracy and time per material, since using ML models such as MEGNet may be fast but not always accurate; on the other hand, running QE jobs can take several hours even for the initial SCF calculation. To counter this, a key approach could be developed to decrease computational costs among material discovery routes by the development of a hybrid workflow, which utilizes both ML and DFT tools to optimize time and thoroughly validate results. Most modern material scientists and chemists often try eliminate off insignificant computations; pseudopotentials and basis sets optimize calculation by focusing on the important aspects of the calculation, such as the valence electrons over the core. The same idea can be used to implement a framework where the computational cost is addressed by utilizing various methods that focus on low-accuracy, fast-compute techniques while also incorporating an aspect of accuracy validation for a rigid understanding. Another limitation of high-cost computations is that it is possible for a long running job to fail resulting in the loss of much needed time. And it is important to remember that running high level DFT calculations demand extensive setups and convergence test requirements, depleting valuable time from the researcher.
The aim of this study was to develop an accurate and cost-effective framework for the discovery of possible superconductive materials. By using the graph neural network MEGNet, utilization and development of ML models allows for the testing of various properties of crystalline structures in a rapid screening phase. Once the rapid screening is finished, the screened materials
are used to pick the top candidates for further testing within other software tools such as Quantum Espresso, where SCF, Phonons, and EPW calculations are run to further solidify the understanding on the material. The development and testing of a framework focusing on the discovery of superconducting materials with screening from MEGNet and validation using Quantum Espresso’s SCF calculations are used to provide with top picks for potential superconducting candidates which are not experimentally observed. All data was pulled from the Materials Project (Jain et al., 2013) and Materials Cloud (Talirz et al., 2020) databases to support in the developing of the models and obtaining the pseudopotentials required for the QE calculations.
2. Computational Approach/Method
Prospective materials were obtained using the Materials Project (MP) database, in which a filter was used to narrow down the entire 150,000 MP database to just 479 candidate materials for DFT validation. The filters applied onto the materials were: FORMATION ENERGY = −2.1 OR LESS, IS STABLE = YES, EXPERIMENTALLY OBSERVED = NO, BAND GAP = 0 TO 3, and IS METAL = YES. These properties were assigned as a rough prerequisite for a superconductivity search in which cutoffs were set for formation energy and band gaps, so that no materials with high values for each would get checked. For typical superconductors, low formation energies and band gaps close to 0 reflect the stability of the crystal lattice and prove that the material is a metal (no band gap). The IS STABLE = YES and IS METAL = YES properties were used to further constrain possible candidates within the data. The formation energy and band gap values are strict cutoffs for regulating data within 500 candidates (a limit for the amount of data exported by MP, but not a strict limit). Lastly an option was set for EXPERIMENTALLY
OBSERVED = NO; this filter sets all of our data to be untested. After exporting the .csv file containing our data, the mp-api (The Materials Project, 2024) Python package is used to make a script to extract the material properties such as crystal structures, compositions, energy, and metadata. The extracted data was processed into .cif files using the pymatgen (Ong et al., 2013) package, and then saved to analyze using the MEGNet models.
The conda environments in which each notebook was made for this study were setup using carefully picked versions for various packages to ensure no conflicts. For the data extraction and CIF (Crystallographic Information File) writing step, an environment was made with Python 3.10, pymatgen 2024.8.9, emmet-core 0.84.5, and mp_api 0.39.2, which were all picked to offer minimal compatibility issues. A second environment was created as the MEGNet environment which utilized Python 3.9
and included core dependencies such as: numpy 1.23.5, tensorflow-cpu 2.10.1(Abadi et al., 2015), scipy 1.7.3, monty 2022.4.26, pymatgen 2022.3.7, emmet-core 0.64.0, matminer 0.8.0, matbench 0.6, and megnet 1.3.0. These separate environments were used to modulate tasks between the data acquisition, writing (into CIF), and ML predicting, which were all done separately to ensure there was no conflict in one environment’s package dependencies.
Within the MEGNet environment, three models were loaded: Bandgap_MP_2019 (band gap), logG_MP_2019 (bulk modulus, G), and logK_MP_2019 (shear modulus, K). Using these three models, predictions were made using the previously extracted CIF files and ranked with a scoring system of choice, which in this study was a normalization system for each of the candidates within the data present. Scoring was based on normalized values which allows for data consistency needed to fairly evaluate each result. The z-score equation shown (Eq. 1) below shows the z normalization function for the three properties where z x is the z-score for the given property, σ x is the standard deviation of the sample of the given property, and μx is the mean of the sample of the given property. The next equation (Eq. 2) shows the composite score (S) for each property which adds weights (w), that total to 3, to the computed z-score and sums up each of the three property to result in an overall score per material. The score for band gap, wEgzEg, is subtracted to aid in the search for lower band gaps since within the search, a lower band gap is preferred as it indicates the material’s metallic property which is often prevalent within superconducting materials. Weights are typically added to each property depending on their influence to the resulting material type (i.e. band gap would have a higher weight if we were trying to search for pure metals since this property is heavily observed in metals). Weights used in the current setup were all set to one to observe raw results of the z-score function. Missing values were replaced with the median of the corresponding property prior to normalization to allow consistent ranking across the dataset.
Once the data was processed and scoring was performed for each material, the top three candidates were identified and saved for validation within Quantum Espresso’s Self Consistent-Fields (SCF) calculation. The CIF structures extracted from the Python script provided for the atomic positions and cell parameters input within QE. Pseudopotentials used for the calculations were from the Standard solidstate (SSSP) version 1.3.0 Precision
package (Prandini et al., 2018), which were obtained from the MaterialsCloud database. Although this SSSP library contained pseudopotentials from various libraries as shown in figure (Fig. 2), there were no changes made to the QE inputs for these pseudopotentials, as the obtained set was a curated list of systematically verified and validated meta-library. The specific pseudopotentials for each element within this package is optimized and tested previously to provide for optimal output within these calculations. Standardized sets guarantee precision and reproducibility. Some of the pseudopotentials included were from various versions of the the pslibrary, GBRV, and SG15 precision sets. It is assumed that there exist multiple pseudopotentials within this set since a single, universal pseudopotential generation method does not yield optimal results for all 100+ elements across the periodic table due to complex variations in electronic structure, such as the behavior of semi-core states in transition metals or relativistic effects in heavy elements. All calculations were performed using standardized parametersconsistent with Materials Project workflows; while explicit cutoff and k-point convergence tests were not performed, the present study focuses on relative electronic trends rather than absolute energetic precision.
Figure 2: A key containing all the pseudopotentials within the SSSP Precision set version 1.3.0. Screenshot from Materials Cloud (SSSP Precision), accessed 1203-25. https://legacy.materialscloud.org/discover/ sssp/table/precision
With the preparation of the QE input files, SCF calculations were run within Quantum Espresso for all n number of candidates and results were extracted once a successful convergence has been achieved. Results from the calculation were then used to further identify or rank superconductivity. This paper analyzed the results of the SCF calculation and built plots to identify and match potential superconductivity within materials, compared the accuracy of ML vs QE in select properties, and also focused on the interpretation for the select sample of potential superconducting materials to determine possible superconductors within the sample. Fig. 3 is a flowchart of the entire workflow, which starts with the filtered data from the materials project database, which is then sent to data filtering and CIF conversion within the Python environment. This filtered set of CIF files was held till a MEGNet model was trained or loaded from pretrained models, which was used to predict for structures within the dataset. The predicted results were then scored using z-score normalization which then
picked the top n candidates to move onto the Quantum Espresso input selection using pseudopotentials within the Materials Cloud SSSP 1.3.0 Precision set library. Once the QE jobs were setup, they were run for each candidate. Results were sent through postprocessing and final analysis within Wolfram Mathematica (Wolfram Research, Inc., 2025), which produced plots for analysis and final predictions for superconductivity. Steps may be added to further solidify or enhance the discovery of other properties such as T c mapping for each material or the calculations of Phonons and Electron-Phonon-Coupling within Quantum Espresso.
Figure 3: Workflow used in this study, including Materials Project data acquisition, CIF generation, MEGNet-based property prediction, and DFT validation steps. Created by author using LucidChart.
Simplified, data was first obtained through set applied filters within the materials project database as explained within the methods section above. Restricted band gaps and formation energies were set to provide with a sample size < 500 for the purposes of study, along with filters for metals and non experimentally observed materials. Once the sample of 479 potential materials was set, the MEGNet environment was prepared and loaded in with the three models: band gap, bulk modulus and shear modulus. Obtained .csv files for the sample data were processed into .cif files for MEGNet input through a small Python script and fed into MEGNet for predictions. Once MEGNet had run its predictions, scoring was done on the data using the z-score normalization composite scoring system which produced an ordered table with the top ranking candidate materials for further validation. Weights for the scoring function were set to 1 to determine the significance of the z-score normalization scoring system, where true weights can be added for later work.
3. Results and Discussion
Table 1 shows the top 10 materials, with their scores and raw properties. The top scoring material, mp-1226589 (CeNdAl2 O6), is a rare-earth aluminum oxide containing
mixed trivalent lanthanides (cerium and neodymium) coordinated within an oxide frame work. The material in second place, mp-1215946 (YU2 O6), is a yttrium–uranium mixed oxide, belonging to a broader class of actinide— rare-earth oxides. The third highest scoring compound mp-27496 (YUO4) is another yttrium–uranium oxide, but with a different stoichiometry and coordination environment compared to YU2 O 6
Table 1: Top-scoring candidate materials from the composite ML ranking framework.
3.1 ML Analysis
Multiple plots were constructed using the scored data which contained the 479 total materials. Plots from the data shown below include a histogram for a total distribution of composite ML scores (Fig. 4), a plot comparing band gap (eV) vs ML score (Fig. 5), a plot comparing Shear Modulus G (GPa) vs ML score (Fig. 6), and a density plot showing the tradeoff between electronic and mechanical properties with score (Fig. 7). The histogram (Fig. 4) shows the overall statistical distribution of ML composite scores across the full set of 479 materials. The shape is roughly centered, resembling a weakly gaussian profile. Most materials cluster between scores of approximately −2 and +2, indicating that the majority exhibit neither extreme electronic softness nor exceptional mechanical stiffness. Materials with high positive scores lie in the upper tail and represent systems that simultaneously achieve low band gaps and high elastic moduli, which are traits resulting from the scoring function. Similarly, highly negative scores correspond to wide-gap, mechanically soft insulators that fall outside the desired region for metallically and stiffness. The weak bell-shaped distribution also suggests that the scoring system does not artificially bias results toward either extreme. Instead, most candidates fall near the mean, while only a small subset reaches exceptionally high or
low values. This justifies interpreting the top-scoring region as genuinely distinct rather than a product of score compression or skew. This distribution confirms that the scoring system generates a balanced spread with only a minority of materials emerging as high-priority candidates.
Figure 4: A histogram built to show the distribution of composite ML scores of all 479 materials. A bell curve is observed within the histogram constructed. Created by the author using Wolfram, MMA.
A relationship between the machine learning score and the band gap of each material within a plot is shown (Fig. 5). A clear negative correlation emerges where the materials with the lower band gaps tend to receive higher overall scores, while the materials with wide-gap insulator like properties tend to naturally fall towards the bottom of the rankings. This trend reflects the structure of the scoring function in which the band gap contributes negatively (lower band gap is more preferable for electronic conduction). A dense clustering on the left side of the plot can be observed which represents the characteristic of typical crystalline databases (such as the Materials Project), where most compounds possess band gaps below 2 eV within the datasets. The resulting clustering demonstrates that the model is responding consistently to the physical tradeoff between metallically and insulating behavior. More specifically, there are many materials of low band gap, however, not all of them receive a high score as bulk and shear moduli within each material varies.
Figure 5: A plot constructed showing the relationship between the ML score which the material received and its bandgap (eV). Created by the author using Wolfram, MMA.
The scatterplot constructed within (Fig. 6) for the shear modulus G versus the machine learning score shows a clear positive trend where the materials with higher shear modulus generally receive higher scores. This indicates that with increasing rigidity within materials, the scoring system increasingly promotes and ranks the material higher. Most candidates cluster between 40 and 60 GPa, forming a dense central band, while a smaller number of materials lie in the outer regions that correlate strongly with the composite ML score. There is also one obvious outlier within this dataset which contains a high G value, but obtains a low score within the scoring system. The outlier indicates a case where properties such as bulk and shear may be lacking despite a high shear moduli value.
Overall, this pattern implies the scoring model is implicitly selecting materials that are both mechanically and electronically stable/suitable. Since mechanical rigidity supports lattice stability under pressure or strain—a factor relevant to superconducting behavior— this trend supports the filtering of suitable candidates for subsequent QE calculations for SCF.
Figure 6: A plot constructed showing the proportional relationship between the ML score that the material received and its Shear Modulus (G) measured in GPa. Created by the author using Wolfram, MMA.
The band gap-shear density plot in (Fig. 7) shows a distinct gradient where the desirable region (low band gap and high shear modulus) appears in warm green tones while the opposite (high band gap and low shear modulus) appears in darker blue tones. This reflects the key characteristic of our scoring model which ranks the highly rigid and low band gap candidates highly as it reflects a correlation to superconducting materials that the search is being conducted for. In the context of superconductivity, this pattern is notable due to how low band gap or metallic like materials are needed to support Cooper pairing; while higher shear modulus is associated with stronger, and more coherent phonon modes. Thus the upper left region of the plot represents materials that simultaneously meet the electronic and mechanical criteria favorable for superconductivity. The density indicates that such candidates exist but are in lower abundance, highlighting the need for targeted screening.
Figure 7: A density plot constructed to show the relation of the ML scoring system in relation to the band gaps (eV) and shear modulus G (GPa). Lighter, vibrant colors show higher scores and darker duller colors represent lower scores. Created by the author using Wolfram, MMA.
The evaluation of plots constructed support that the predictions made via the machine learning models are eligible for further validation using DFT. The clustering of metallic and mechanically rigid candidates and the visible tradeoffs between electronic accessibility and structural stability indicate that the model is prioritizing materials with known and favorable trends for superconductivity. This provides justification for selecting only the extremely high scoring region of the dataset for any further DFT validation. The machine learning steps reduce the original 479 material search sample to only the 10 most promising candidates while still preserving physically meaningful trends which align with superconducting design principles. It is also notable that the ML score highlights the materials occupying favorable regions of electronic metallicity and lattice stiffness, which is an important prerequisite for further phonon based superconductivity testing.
3.2 QE Results
Within the top 10 scoring materials, the top three candidates were taken to the next step for QE validation where SCF jobs were run for each material. SCF (Self Consistent Feilds) calculations were run to obtain an overall view of the material’s metallic properties and consistency to determine the accuracy of the ML phase.
Properties such as fermi level helped predict metallicity, where fermi levels within electronic bands often support metallic behavior. Furthermore, convergence properties such as iterations and convergence energy are observed to determine stability of material. Checking for metallic and stability hint towards a potential candidate for a type-I superconductor, however it is important to note that much more rigorous testing would need to be done to prove this.
Quantum Espresso input files were generated for the three materials, mp-1226589, mp-1215946, and mp-27496. Pseudopotentials used for mp-27496 and mp-1215946 come from the GBRV-1.2 (US), Actinides MalteSachs (PAW), and pslibrary.0.3.1 PAW (high acc.) pseudopotential sets within the SSSP 1.3.0 precision package. Pseudopotentials used for mp-1226589 were the RE Wentzcovitch (PAW), pslibrary.1.0.0 PAW (high acc.), and pslibrary.0.3.1 PAW (high acc.) sets within the SSSP 1.3.0 precision package. Although cutoff and k-point convergence tests were not explicitly performed, convergence was achieved within the SCF calculation as this study focuses on relative electronic trends rather than absolute precision. Within the following sections discussions will include: SCF convergence behavior, electronic structure indicators, and structural stability indicators from SCF. The snippet in (sec. 5) shows the input settings which were used for the QE input files for all three materials.
3.2.1 CeNdAl 2 O 6
Observing the SCF convergence behavior within the SCF cycle for CeNdAl2 O6, it is evident that the compound has converged smoothly as it achieves an accuracy threshold below 10−9 Ry after 37 iterations, a stable minimum energy at 10−9 Ry was approached. Despite the fact that this number of iterations is relatively high, the behavior is expected for rare earth oxides containing partially filled 4f orbitals which introduce strong correlation and slow charge density mixing. The total energy stabilized at −1349.83 Ry, with the final residual oscillations shrinking with a steady rate across the following iterations. The absence of significant negative charge density and the stable behavior of the total energy confirm that the ground state was reached reliably despite the electronic complexity of the system.
The final Fermi energy of 13.996 eV and the presence of fractional occupation numbers across multiple bands indicate a metallic or near metallic behavior within this material. The occupation blocks show a typical pattern where all low energy bands are fully occupied (1.0), followed by a broad region of partly occupied states. This is consistent with Ce+3 and Nd+3 where both contribute f-electron character near the Fermi level, resulting in
dense band manifolds and small energetic separations. Fractional fillings such as these are expected for systems with strong hybridization between rare earth f-states and oxygen p-states, and more importantly, the absence of a clear band gap or insulating plateau suggests that this material satisfies the electronic prerequisite for superconductivity; specifically a finite density of states at the Fermi level.
SCF results show a stable ground state of the material suggesting that the applied pseudopotential and cutoff conditions. Within the context of superconductivity, this presence of mixed rare earth cations and rigid Al-O octahedral frameworks often support robust phonon modes and strong electron-phonon coupling pathways. Although SCF doesn’t measure lattice dynamics explicitly, the stable ground state solution and metallic occupation characteristics hint towards the justification that the advancement of this material to future phonon or EPW calculations is plausible.
3.2.2 YU 2 O 6
Based on the SCF cycle for YU2 O6, it is noted that this material converged rapidly relative to its complexity, where it achieves an accuracy of 3 × 10⁻¹⁰ Ry after only 15 iterations. This convergence is faster compared to the Ce-Nd oxide as it reflects the more delocalized nature of uranium 5f electrons and the relatively simpler cationic arrangement. The total energy, −2395.98 Ry, remained stable to the ninth decimal place which indicates a strong robustness within the SCF calculation. A minor presence of negative charge density (around 4.5 × 10⁻²) is expected for actinide containing systems and does not compromise the convergence. Ultimately the observed SCF behavior here demonstrates that the electronic configuration has reached a highly stable ground state.
Next, the Fermi energy is moderately high at 14.86 eV, and the band occupation profile shows fully occupied states at low energies followed by a long sequence of fractional occupations. The highest fractional occupations (0.7-0.2) and the smooth decay toward 0 near the conduction region hints that a metallic or weakly semi metallic band structure is present. Furthermore, the uranium 5f states which are more spatially extended than lanthanide 4f states, promote hybridization with oxygen 2p orbitals, leading to a broad band dispersion and enhanced density of states at the Fermi level as more electron modes are available due to the sharing of electrons. No insulating gap is present, which is consistent with the expectation that mixed uranium-oxides exhibit strong electron correlation and variable oxidation states. From a superconductivity view, the presence of partially filled f-orbitals and a dense manifold of near Fermi states shows a strongly favorable electronic signature.
Despite the electronic complexity of the uranium oxide, the SCF results indicate excellent internal stability, where energy drift rapidly diminishes and the charge density remains well behaved, as the final iteration accuracy reaches the numerical floor of the solver. The material’s stiffer lattice, taken from its high predicted shear modulus from our previous ML runs, aligns with the stability seen in the SCF cycle. Furthermore, rigid oxide frameworks enhance phonon coherence which is often beneficial in electron-phonon mediated superconductivity. And although SCF cannot directly provide for vibrational properties, the strong and clean convergence gives confidence that YU2 O 6 exhibits a stable and electronically rich ground state which is suitable for further evaluation.
3.2.3 YUO 4
SCF calculation for YUO 4 converged efficiently, where it had reached an accuracy of approximately 10−9 Ry after just 13 iterations. This being the fastest convergence among the three materials examined, it reflects the simpler stoichiometry and reduced f electron contribution compared to YU2 O 6 . The total energy stabilized at −1283.66 Ry, with a nearly stable improvement in the charge density and energy accuracy. A small amount of negative charge density (around 4.45 × 10⁻²) appears, which is typical for uranium containing pseudopotentials using smearing, however, it does not affect the numerical stability of the SCF cycle. The clean and rapid convergence seen here indicates that YUO 4 contains a relatively well behaved electronic landscape under the chosen pseudopotentials and cutoff settings.
The Fermi energy is seen to converge at 14.07 eV, where the band occupation pattern shows fully occupied states followed by a very tiny number of partially filled bands with occupations around .46 and .04, and near zero fractional values. The observed distribution is notably more discrete and less heavily fractional than those observed win the other two materials. Furthermore, the reduced number of partially filled states suggests for a narrower set of bands near the Fermi level, and a much more sharply defined metallic or semi metallic character. Uranium’s 5f states remain influential but the simpler oxygen coordination environment in the lattice reduces hybridization complexity. The lack of presence for an insulating gap and the presence of partially filled bands confirm that YUO 4 maintains a non-zero density of electronic states at the Fermi level: a key pre-requisite for the material to be superconducting.
Looking from a stability standpoint, YUO4 shows a very consistent behavior where the total energy converges smoothly, the charge density remains stable, and the
accuracy threshold is reached quickly. The energetic contributions display no signs of oscillation, indicating that the underlying lattice configuration is compatible with a robust electronic ground state. The convergence observed compared to YU2 O 6 suggests that this material is structurally less complicated lattice with fewer competing electronic configurations. Within the context of superconductors, this is significant, where stable oxide frameworks with actinide centers can support well defined phonon modes and the presence of uranium 5f states near the Fermi level may enhance EPW strength. And although superconductivity cannot be evaluated with SCF alone, the metallic character and strong SCF stability of this material justifies itself as a valid candidate for future testing.
4. Conclusion and Limitations
This study combined a machine learning and DFTbased workflow which was used to screen and rank potential superconducting materials from an initial sample of 479 candidate materials obtained from the Materials Project. The ML phase utilized three pretrained MEGNet models: Band gap, bulk modulus, and shear modulus, which were integrated with a zscore normalization model to score and filter the data once the predictions were run. The top three highest scoring materials, CeNdAl2 O6, YU2 O6, and YUO4, were picked for SCF calculations within Quantum Espresso where data was extracted and identified for superconductivity related properties. Multiple plots were constructed, such as scatterplots, histograms, and density plots, to highlight features indicative of possible superconductivity. This paper strictly focused on attempting to develop a valid workflow for the detection of superconductivity in materials rather than providing fine-tuned evidence for superconductivity; steps can be built onto the work done within this paper to fine-tune to process and possibly focus a specific aspect of materials discovery such as the search for a high T c superconductor. Overall, the ML-DFT workflow developed provides a practical method to filter and narrow down on candidate materials for screening and validation in the search of materials and properties, which in this study was the identification of possible superconductors.
4.1 Limitations
The current work was conducted within a timeconstrained environment and required simplifications throughout to produce a robust result. Simplifications made show strong results on the objective of the study; to develop a workflow for the discovery of materials, however further tuning needs to be done to obtain well
defined results on the discovery of superconductors in specific.
5. Acknowledgments
Experiments of this work were setup on the the Bridges2 system at the Pittsburgh Supercomputing Center (PSC) through allocation CHE160020P from the Advanced Cyberinfrastructure Coordination Ecosystem, however no computations were run on the system: Services & Support (ACCESS) program, supported by National Science Foundation grants #2138259, #2138286, #2138307, and #2137603. Formatting of parts of the paper were assisted with the help of OpenAI ChatGPT. Appreciation is also expressed to the NCSSM Department of Science, Mr. Gotwals, Computational Chemistry Teacher, Dr. Amy Sheck, Dean.
6. References
Abadi, M., Agarwal, A., et al. (2015). TensorFlow: Largescale machine learning on heterogeneous systems [Computer software]. https://www.tensorflow.org/
Chen, C., Ye, W., Zuo, Y., Zheng, C., & Ong, S. P. (2019). Graph networks as a universal machine learning framework for molecules and crystals. Chemistry of Materials, 31(9), 3564–3572. https://doi.org/10.1021/acs. chemmater.9b01294
Giannozzi, P., Baroni, S., et al. (2009). QUANTUM ESPRESSO: A modular and open-source software project for quantum simulations of materials. Journal of Physics: Condensed Matter, 21(39), 395502. https://doi. org/10.1088/0953-8984/21/39/395502
Giannozzi, P., Andreussi, O., et al. (2017). Advanced capabilities for materials modelling with Quantum ESPRESSO. Journal of Physics: Condensed Matter, 29(46), 465901. https://doi.org/10.1088/1361-648X/aa8f79
Jain, A., Ong, S. P., Hautier, G., Chen, W., Richards, W. D., Dacek, S., Cholia, S., Gunter, D., Skinner, D., Ceder, G., & Persson, K. A. (2013). Commentary: The Materials Project: A materials genome approach to accelerating materials innovation. APL Materials, 1(1), 011002. https:// doi.org/10.1063/1.4812323
Ong, S. P., Richards, W. D., Jain, A., Hautier, G., Kocher, M., Cholia, S., Gunter, D., Chevrier, V. L., Persson, K. A., & Ceder, G. (2013). Python Materials Genomics (pymatgen): A robust, open-source Python library for materials analysis. Computational Materials Science, 68, 314–319. https://doi.org/10.1016/j.commatsci.2012.10.028
Prandini, G., Marrazzo, A., Castelli, I. E., Mounet, N., & Marzari, N. (2018). Precision and efficiency in solidstate pseudopotential calculations. npj Computational Materials, 4, 72. https://doi.org/10.1038/s41524-018-01272
Talirz, L., Kumbhar, S., et al. (2020). Materials Cloud, a platform for open computational science. Scientific Data, 7, 299. https://doi.org/10.1038/s41597-020-00637-5
The Materials Project. (2024). mp-api: Materials Project API client [Computer software]. https://github.com/ materialsproject/api
EFFECTS OF FREQUENCY AND MICROSTRUCTURE ORIENTATION
PATTERNS ON MICROACOUSTOFLUIDICS
Cynthia Balin
Abstract
Acoustofluidics is the field of physics that examines interactions between fluid and sound. It studies how sound waves generate fluid motion through acoustic streaming. This study investigates the effects of internal fluid/channel structures and their orientation on fluid mixing, flow, and optimal acoustic frequencies. The project focuses on investigating physics useful to Alzheimer’s disease treatments, specifically those that stimulate the glymphatic system. Two minimum model systems (in the form of microfluidic devices) were constructed to explore local acoustic streaming amplification for increased effects at lower acoustic frequencies and to compare the effects of microstructure orientation on this amplification. The results suggest that frequencies regarded as biologically safe at low amplitude can be manipulated, via the process of Rayleigh streaming, to produce enhanced local velocities sufficient to stimulate glymphatic flow. The results also indicate that precise microstructure orientation does not seem to have a significant enough effect on the results to warrant pursuit within treatments.
1. Introduction
1.a Alzheimer’s Disease
The neurological disorder known as Alzheimer’s disease is a major source of mortality throughout the world. Approximately 6.9 million people suffer from this condition in the United States alone (2024). Alzheimer’s disease destroys memory and executive functioning skills, while also causing depression, anxiety, behavioral changes, and often death. There is currently no cure, and medications used to manage the symptoms lose effectiveness over time. In particular, the most commonly administered Alzheimer’s disease medications are cholinesterase inhibitors such as donepezil, rivastigmine, and galantamine (DiBello et al. 2023). Cholinesterase inhibitors prevent the breakdown of acetylcholine, a neurotransmitter crucial for memory, learning, attention, and more. Normally, acetylcholine is broken down shortly after its release and it is recycled by neurons to create more acetylcholine. However, Alzheimer’s disease destroys the cells responsible for creating acetylcholine, so cholinesterase inhibitors attempt to prevent the brain from breaking down the acetylcholine it has already created to avoid a critical shortage. However, these drugs are only successful for so long: eventually the loss of neurons and reduced acetylcholine production mean that there is too little neurotransmitter left for the drugs to be effective. Additionally, cholinesterase inhibitors lower patients’ heart rate and blood pressure making them unsafe for patients with certain medical conditions.
Generally, these drugs work against the body and manage symptoms rather than stopping the underlying neurodegenerative process. Therefore, a novel therapy able to address the root cause would be more useful than simply improving older medications (Ellis et al. 2024; Singh et al. 2023; “Acetylcholine (ACh)” 2022). Studies have shown that this “root cause” of Alzheimer’s disease is likely an abnormal build up of amyloid beta protein clumps in the brain, which is caused by mechanical dysfunction of the brain’s major fluidic system, the glymphatic system (Buccellato et al. 2022).
1.b Glymphatic System
The glymphatic system is a brain-wide fluid transport network that clears out metabolic waste, including amyloid beta (Jessen et al. 2015). Amyloid beta forms when amyloid precursor protein (APP), a normal transmembrane protein involved in neuronal growth and cell signaling, is cleaved by beta-secretase and then y-secretase instead of a-secretase and then y-secretase. This processing creates specific chains of amino acids, mainly producing amyloid beta 40, but also amyloid beta 42. Amyloid beta 42 proteins stick together and form plaques between neurons. In a healthy brain, the small amount of amyloid beta plaques that have been formed are transported by interstitial fluid toward the glymphatic system where they are cleared. With aging, glymphatic clearance becomes less successful, causing amyloid beta plaques to accumulate in the glymphatic system and surrounding brain tissue. Over time this
contributes to the development of Alzheimer’s disease (Chen et al. 2017). Healthy glymphatic clearance occurs when cerebrospinal fluid flows through the glymphatic system in perivascular spaces located between blood vessels and the surrounding glial layer. The crucial knowledge that the perivascular space is a closed channel formed by the blood vessel walls and glial layer led the researchers to construct a closed PDMS channel to serve as the minimum model system (Jessen et al. 2015).
This study explores acoustic stimulation as a method to enhance glymphatic fluid flow relevant to Alzheimer’s disease treatment. The walls of perivascular spaces are created by astrocyte endfeet. Astrocyte endfeet are nonuniform and vary in thickness. Furthermore, these endfeet often overlap or contain gaps between each other (Jessen et al. 2015; Murdock et al. 2024). These microsurface irregularities provide an intrinsic network of “structures”. Through exploring the effects of structures on the potential application of glymphatic fluid flow, this study hopes to provide some of the intermediate findings necessary for the eventual design of a cure for Alzheimer’s disease based on acoustic stimulation. Ultimately, this study examines how the geometry of these structures in a minimal model amplifies acoustic streaming and mixing at low frequencies to identify resonance ranges suitable for biomedical use.
1.c Acoustic Streaming
Typically when a sound wave moves through a fluid, the fluid particles experience small oscillations around their equilibrium position because of the pressure fluctuations in the wave. The displacement of the fluid particles is extremely small and oscillations are predictable and even, not resulting in any net flow, steady vortices, or acoustic streaming. These waves transport energy and momentum, not fluid motion. However, in very specific and exceptional instances, an acoustic wave traveling through fluid can result in fluid motion via acoustic streaming. Acoustic streaming is nonlinear and generally occurs in situations where the acoustic wave has a very large amplitude, causing viscous dissipation effects to become much more important. These effects set the stage for acoustic streaming to take place (Zhang et al. 2020). Acoustic streaming can be subdivided into Eckart streaming and Rayleigh streaming and both rely on the increased importance of viscous dissipation in different ways. Eckart streaming results in bulk fluid flow because traveling acoustic waves lose energy unpredictably as they travel through a fluid due to fluid viscosity. As shown in Figure 1, this unpredictable energy loss, due to its non-linearity which prevents it from being canceled out by other motion, results in biased flow in one direction (net flow) in traveling waves specifically (Lei et al. 2017).
Viscosity is the internal friction that resists motion within fluids. As shown in Figure 2, traveling waves lose energy as they propagate, resulting in velocity gradients throughout the fluid. Velocity gradients are how fluid velocity changes over a given distance, causing shear stress as layers of fluid slide past each other at different speeds, generating friction. Faster moving layers transfer momentum to slower moving layers which spreads motion throughout the fluid, and results in overall fluid flow in one direction. As distance decreases for a given change in velocity, or velocity increases for a given distance, the velocity gradient increases. Shear stress also increases because stress is proportional to force (velocity) divided by area (distance) (Sahin et al. 2023; Zhong et al. 2023; Yang et al. 2023).
Figure 1: Diagram showing how pressure gradients form across the channel over time and how they lead to net flow within Eckart streaming [Made by author using BioRender]
Figure 2: Diagram showing how velocity gradients form across the channel over time and how they generate net flow within Eckart streaming. [Made by author using BioRender]
Rayleigh streaming is created by standing waves and viscous interactions. The effects of viscosity are often experienced unequally by fluid particles throughout an oscillation cycle, especially near boundaries (Wu, 2018; Sahin et al. 2023; Zhang et al. 2020). Although fluid viscosity itself is not greater at solid boundaries (since it is a material property), it produces greater velocity gradients and shear stress. These occur because the fluid within the viscous boundary layer (the region of fluid
near a solid surface that experiences friction between the surface and the fluid viscosity) is stationary due to no-slip boundary conditions. Conversely, the fluid a very short distance away (just outside the viscous boundary layer), is moving creating friction that strongly resists motion, an occurrence known as viscous dissipation. As shown in figure 3, due to viscous dissipation, when each fluid particle oscillates away from the nearest solid boundary it will move further than when it is moving towards the boundary. Unequal effects of viscosity and viscous dissipation produce weak counter-rotating vortices (regions of fluid moving in a circular motion like whirlpools). The circular motion of these vortices mixes the fluid, a phenomenon known as acoustic mixing. However, Rayleigh streaming cannot produce net directional flow (without the use of asymmetric structures) because counter-rotating vortices and localized motions cancel out. Overall, viscous dissipation is crucial in generating acoustic mixing through the production of vortices as well as generating acoustic streaming, especially at a small scale (as is relevant to this project) as viscous effects become more pronounced (Wu, 2018; Zhang et al. 2020; Lei et al. 2017; Yang et al. 2023; Nyborg et al. 2024; Daru et al. 2017).
Figure 3: Diagram showing how standing waves and the viscous boundary layer affects fluid particle motion creating Rayleigh streaming and localized motion. [Created by author using BioRender]
In addition to overall fluid movement, stimulation by acoustic waves can also be used to mix different fluids within microchannels. Due to the structure of microfluidic devices (small characteristic length and slow fluid velocity) fluid flow within these channels usually has a small Reynolds number. Reynolds number is a dimensionless quantity used to predict fluid flow with the ratio of inertial forces to viscous forces. Re can be found using Equation 1 (Saldana et al., 2024):
A reasonable prediction for the Reynolds number of the minimum model system used in this research, without the presence of complex geometries, could be calculated as follows: 998.2 kg/m3 (fluid density of water) x 7.35*10-3 m/s (flow velocity) x 1.7*10-3 m (diameter of the channel) / 1.0016*10-3 Pa*s (fluid dynamic velocity). Within this prediction the flow velocity value was taken from (Ozcelik & Aslan, 2021). Their study contains many similarities to this one making their finding a reasonable choice for an approximation. After completing the necessary unit conversions and plugging these values into the equation 12.45 was found to be the estimated Reynolds number of the system in a simple channel. A small Reynolds number (below 2000 in a fluid channel) means that the flow is in the laminar regime. Therefore, based on the calculations above, the flow in this system without complex geometries will be laminar. Laminar flow occurs when fluid moves smoothly in parallel layers, allowing two fluids to flow side by side without mixing. Although some mixing will result from diffusion, this mixing is significantly slower and less powerful than turbulent mixing (Huang et al. 2013). Alternatively, turbulent mixing relies on the movement of large regions of fluid swirling, stretching and folding, rather than individual fluid particles. These moving fluid regions come into contact with other non-moving (or barely moving) fluid particles causing them to move, spreading mixing through the fluid, something that doesn’t occur in diffusive mixing. This greatly disturbs the fluid, making turbulent mixing much faster and more effective than diffusive mixing (Neikov, 2019; Abarzhi et al. 2013).
= Reynolds number
ρ = fluid density
= flow velocity
= characteristic length (some significant dimension of the geometry such as the pipe diameter)
μ = fluid dynamic viscosity
Rayleigh streaming relies on standing waves to produce weak counter-rotating vortices and fluid mixing without net flow. Therefore, standing waves create acoustic mixing but not overall fluid flow. A standing wave forms when an incident wave is reflected by a boundary, and produces a reflected wave. The incident and reflected waves superimpose, producing a specific wave pattern with pressure antinodes (areas of maximum pressure fluctuation) every half wavelength. Standing waves appear to stay in one place rather than moving through the medium and can only be produced at certain resonance frequencies. In a fluid channel where both ends are closed, the system has pressure antinodes at each of the sides. In order to satisfy the standing wave conditions, the channel width must fit an integer number of halfwavelengths, in order to have the pressure antinodes in the correct locations. Therefore, the channel width (W) must be equal to the harmonic number (n) multiplied by half the wavelength (λ /2). The harmonic number is how many half wavelengths/pressure antinodes are present. In this system, the fundamental mode (n=1) is the strongest because the energy of the wave is divided between fewer pressure antinodes, increasing the pressure amplitude at each. The first harmonic produces two large counter
rotating vortices (one at each of the antinodes) which are better at producing fluid mixing than the many smaller weaker vortices created at higher modes (Zhang, 2020; Elert, 2019; Martin, 2019; Zhang, 2021).
This means that optimal Rayleigh streaming is generated when the wavelength is twice the width of the microfluidic channel. The relationship between frequency, wavelength, and sound speed is given by the following formula:
(Zhang, 2020; Zhang, 2019)
Sound speed, or the “c” value, is how quickly a wave travels through a given medium. This value is necessary in order to perform wave calculations in any medium and changes depending on the medium rather than the wave source. For example, sound always travels through water at 1430 m/s no matter the source of the sound, but it travels through air at a different speed. When Equation 2 is solved for frequency using channel width values in the micrometer range, and a “c” value of 1430 m/s (the speed of sound in water), this relationship produces frequency values in the order of MHz. A situation where optimal Rayleigh streaming is generated by waves with frequencies in the MHz range is problematic, because these are very high frequencies. While it is possible to design therapies using very high frequency acoustic waves, the applications of these therapies will be significantly limited (Zhang et al. 2020; Czarnota et al. 2010; Nagle et al. 2013). This is mainly due to the fact that high-frequency acoustic waves attenuate very rapidly because they decrease the thickness of the viscous boundary (the distance from the solid surface to where the fluid velocity reaches 99% of the free streaming velocity) which increases the velocity gradients (Wassgren, 2021). Larger velocity gradients increase friction between fluid layers, generating heat and causing the wave to lose energy quicker. Higher frequencies also increase the rate of viscous interactions: by increasing the overall speed of fluid particle oscillations, energy is lost more quickly, creating faster attenuation (Garrett, 2020).
Increased attenuation limits how far high-frequency acoustic waves can penetrate a medium, which can restrict their effectiveness in biomedical applications. This is relevant to Alzheimer’s disease treatment as the glymphatic system and amyloid-beta plaques are located deep within brain tissue. Moreover, using high-frequency waves requires specialized high-voltage piezoelectric transducers and power supplies, making the approach less accessible (Zhang et al. 2020; Zhang et al. 2019).
These many obstacles have previously limited the utility of acoustic stimulation in neurologic disorders. However, the rapidly developing field of molecular
engineering has led to new developments that make these treatments more viable (Gardner et al. 2020; Rivnay et al. 2017). One example of these developments is ongoing biomedical research on the harvesting and isolation of naturally occurring cell membrane proteins from various sources (bacteria, roundworms, etc) that are sensitive to mechanical stimuli (Ibsen et al. 2015; Doerner et al. 2012; Huang et al. 2023). New developments have allowed these proteins to be inserted into neuron cells, and research suggests the specific proteins could be developed that would fuse to the wall of the glymphatic system once inside the brain forming “microstructures” similar to the ones studied here (Ibsen et al. 2015; Campos et al. 2023). Furthermore, additional cell membrane proteins sensitive to acoustic stimulation could be added to decrease the needed input frequency and further increase the effectiveness of the treatment.
1.d Effects of Structures
This research addresses the issues associated with the use of high frequency acoustic waves (mainly fast attenuation) by amplifying local streaming. To this end, the use of structures within a microfluidic channel is studied. Previous experiments have demonstrated microstructures enhancing fluid flow, especially at lower acoustic frequencies (Zhang et al. 2020; Huang et al. 2013; Zhang et al. 2019; Huang et al. 2014; Nama et al. 2016). Moreover, the use of such structures presents the remarkable opportunity to produce both net fluid flow and fluid mixing simultaneously, via Rayleigh streaming (see below). For discussion purposes, the term “structures” (or microstructures) refers to triangular pieces of material located on the sides of the channel walls facing into the fluid, as illustrated in Figure [4]. Structures increase acoustic streaming effects by adding additional viscous boundary layers increasing viscous dissipation. This decreases the acoustic frequency necessary to generate substantial mixing (lowering it to around a few kHz), because the increased effects of viscous dissipation more efficiently convert the oscillations into counter rotating vortices. Greater viscous dissipation effects make up for the slower fluid particle oscillations created by the lower frequency waves. Additionally, lower frequency acoustic waves increase the thickness of the viscous boundary layer, further strengthening the effects of viscous dissipation especially when more viscous boundary layers are present. Overall, lower frequency waves with the help of the structures create counter rotating vortices that mix the fluid just as effectively as high frequency waves without structures.
When structures are present, and facing directly into the channel, they enhance localized flow production and create strong counter-rotating vortices near their
tips. These strong vortices occur because, on either side of a structure, the effect of viscosity near the solid boundary impacts oscillations in different directions (because the structure is on two different sides relative to the fluid particles). While the fluid on one side of the microstructure is moving toward the structure and facing resistance due to steeper velocity gradients, the fluid on the other side is moving away from the structure, and its particles are able to oscillate further. Over time, this will cause the local flow on the two sides to move in opposite directions, as illustrated in Figure [4]. Due to the size of these microstructures, these opposite flows are separated by a very small column of fluid between the two sides, directly above the tip of the structure. Fluid is close to (and generally treated as) incompressible. Therefore, when the opposite oscillatory motions act on this fluid, effectively pushing the fluid in two different directions, the fluid cannot be compressed. Instead, the fluid in motion is forced to move up and away from this incompressible fluid in a circular pattern which generates a set of alternating vortices at the tip of the microstructure as shown in Figure [4]. These vortices disturb laminar flow even further and greatly enhance fluid mixing (Huang et al. 2014).
Figure 4: Diagram of fluid particle oscillations around a symmetrical sharp-tip structure, demonstrating how counter-rotating vortices are generated. [Made by author using BioRender]
1.e Asymmetric Structures
However, net flow is not generated because both the different local motions are equal in strength and cancel each other out. It is generally not possible to use acoustic excitation to create both bulk fluid flow (created by Eckart streaming) and fluid mixing (created by Rayleigh streaming) because Eckart streaming is generated by traveling waves whereas Rayleigh streaming is generated by standing waves. However, prior research has demonstrated that by utilizing asymmetrical structures, Rayleigh streaming can produce both fluid flow and fluid mixing concurrently (Zhong et al. 2023; Lei et al. 2021).
Expanding on this concept, research indicates that the direction of net fluid flow can be controlled by orienting structures toward the desired direction. This design capitalizes on the fact that fluid particles on one side of an asymmetric structure experience greater velocity gradients and shear stress than those on the other side (Huang et al. 2014). Specifically, in a structure angled to the right, as in Figure [5], the fluid on the left will experience a smaller velocity gradient, reducing resistance to motion since the velocity changes over a longer distance. Therefore, the fluid particles on the left are able to oscillate more freely. When there are unequal velocity gradients on either side of the structure, the counter rotating vortices formed are not of equal strength or size (defined here by core radius). Fluid particles on the side of the structure with smaller velocity gradients and resistance to motion will form a larger, weaker vortex. Over many oscillations, the difference in the vortices on each side of the structure will produce a net flow across the entire fluid channel. The net flow moves toward the side with lower resistance, which also aligns with the structure’s tilt. Therefore, a structure oriented to the right, will produce an overall net flow to the right as shown in Figure [5].
In addition to exploring the effects of structures and their geometries on local flow and mixing amplification, this study also aims to identify resonance frequencies within these systems and understand how resonance is impacted by the pattern and orientation of microstructures. Resonance frequency is the natural frequency of an object or system at which it has the greatest amplitude of oscillations when disturbed by an external force. While prior research has shown that resonance frequencies play a key role in acoustofluidics, it has not determined which frequencies best increase flow near channel wall irregularities. This research seeks to fill this gap.
Figure 5: Tilted sharp-edge structure with vortices and overall acoustic streaming (Huang, 2014)
This research is intended to help advance the usefulness of acoustic therapies in biologic applications by optimizing the use of Rayleigh streaming effects to lower the needed therapeutic input frequency. This could help overcome the limitations of high-frequency acoustic therapies caused by rapid dissipation and heat generation. This study validated the hypothesis that microstructures could be used to reduce input frequency, and identifies a resonance frequency range where therapy could potentially be targeted.
2. Materials and Methods
2.1 Microfluidic Devices
In order to conduct this experiment, 20 microfluidic devices were manufactured from polydimethylsiloxane (PDMS). Two molds were designed in the CAD program Onshape, and molds were 3D printed out of resin. One microfluidic mold produced microstructures at 90 degrees relative to the channel wall (Device A) and the second design produced microstructures at approximately 64 degrees relative to the channel wall (Device B). The resin molds were post-treated under a long-wavelength UV light for an hour, to ensure complete bonding at the PDMS resin interface. After post-treating the molds, approximately 35 grams of liquid PDMS were poured into a clean glass dish before 5.3 grams of the curing agent were added (10:1.5 ratio). The mixture was then stirred thoroughly with a metal stirring rod for 5 minutes. Immediately after stirring, the dish was placed in a desiccator from BacoFlo for 30 minutes to remove any air bubbles. During this time, a clean glass dish was prepared for the resin molds. The PDMS mixture was removed from the desiccator before the resin molds were removed from the UV light and placed on the glass dish. The PDMS mixture was then poured over the resin molds and this dish was placed in the desiccator for around 15 minutes to remove any air bubbles caused by pouring. At the end of the 15 minutes, the dish was removed from the desiccator and placed in an oven at 55 degrees Celsius for 24 hours in order to cure the PDMS. Once removed from the oven, the dish was cooled to room temperature. The molds/structures were then cut using an exacto knife. The cured PDMS was gently peeled away from the molds, and channels from the same mold were cut apart. Next, each PDMS device was placed on top of a clean glass slide within a clean, covered plastic petri dish (channel side up). The dishes were labeled and sealed with Parafilm to keep the structures clean and dust-free.
Figure 6: Photo of PDMS microfluidic device containing microstructures at 90 degrees relative to the channel wall
The structures were then transported to a physics laboratory at the University of North Carolina at Chapel Hill to bond the PDMS structures to glass using their Oxygen Plasma Cleaner and cleanroom facilities. Here, each PDMS structure and its corresponding glass slide were cleaned with isopropyl alcohol and dried with nitrogen gas to ensure bonding success. The pieces were then placed in an oven for 20-30 minutes at low temperature to remove absorbed solvents and moisture. After baking, batches of PDMS structure and glass slide pairs were placed, bonding side up, into an Oxygen Plasma Cleaner. Due to the device, the batch size was limited to 2 PDMS/glass-slide pairs. After loading the first batch into the Oxygen Plasma Cleaner and sealing the chamber, the Plasma Cleaner ran for 30-45 seconds, the device being regularly adjusted to ensure that a bright pink light appeared. The PDMS and glass stayed under the pink light for exactly 30 seconds before the Oxygen Plasma Cleaner was turned off and the chamber was vented. Next, the PDMS structures and glass slides were carefully removed using tweezers. The PDMS and glass pieces were then immediately separated into pairs and the bonding sides of each pair were aligned and pressed together very gently to ensure complete bonding without damage. This process was repeated to create a total of 14 bonded microfluidic devices. After the structures were bonded and returned to the North Carolina School of Science and Mathematics, a biopsy hole punch and tweezers were used to create inlet and outlet holes, into which elbow connectors were placed. Long lengths of tubing were rendered impractical and wasteful due to the scale of this project so the tip of the micropipettes were inserted directly in the elbow connectors during the fluid introduction process.
2.2 Experimental Setup
Once the microfluidic devices were fabricated, experiment setup commenced. The piezoelectric transducer was connected to a power supply and Scotch tape was used to attach the transducer to the bottom of the glass slide, so that only the glass separated the
transducer from the liquid in the channel. The transducer was mounted in front of the channel (before the y-shaped inlet area) for imaging purposes. Another glass slide was taped onto the other side of the PDMS channel so the device could be flipped over, allowing imaging of the channel through the glass slide. A 200:1 dilution of 2 micron red microbeads from Sigma-Aldrich was utilized. The experimental setup was positioned directly underneath the facility’s Fluorescence Microscope, which was connected to the laboratory computer in order to take snap shots and videos using ImageView software. Both fluorescence microscopy using a Texas Red filter set as well as Bright Field microscopy were used. Before beginning the official data collection many videos were captured in order to get a feel for the equipment, find an adequate concentration of fluorescent particles for imaging, determine the lowest frequency that yielded results, and locate the best physical set up for accurate imaging. Once several clear videos had been captured, actual data collection commenced. None of the videos taken prior to this point were used in data analysis. The official data set used consisted of 30 videos, as well as an initial control video prior to transducer application. All of these videos were taken in order once official data collection began, and only these 30 videos were recorded in order to prevent possible data skewing that could result from choosing 30 videos from a larger selection. Of these 30 experimental videos, half were captured from Device A with the other half coming from Device B (15 videos each). From these 15 videos, 5 represented movement around a structure on one side of the channel, 5 represented movement around a structure on the opposite side of the channel, and the remaining 5 showed movement near a portion of the channel wall without any structures. Each of the 5 videos tested a different frequency: 1000 Hz, 3000 Hz, 5000 Hz, 8000 Hz, and 9999 Hz, respectively. These frequencies were chosen because 1000 Hz was the lowest frequency that appeared to generate motion, and 9999 Hz was the maximum frequency that could be produced by the function generator used. Frequencies in between were selected at (somewhat) regular intervals while remaining multiples of a thousand for ease of data collection.
3. Data Analysis
After the images were collected, Image J software was used to format the data. Each video was individually uploaded into Image J and was automatically converted into a stack of images. The stack was sliced to remove the frames before and after soundwave application and vortex generation. After this process, these edited AVI files were converted into MP4 files using a free program called CloudConvert. Next, artificial intelligence in the form of ChatGPT was utilized to generate MATLAB code
and assist with editing the code. These scripts were run in MATLAB from MathWorks in order to open the MP4 video files and to determine the average absolute velocity over each movie. Specifically, the code determines the mean pixel velocity within every 5x5 pixel area in each frame. The averages (from every frame) for a given 5x5 area are added up and this sum is divided by the number of video frames. This value is plotted on a heat map, and is displayed in the location of the given 5x5 pixel area. MATLAB repeats this process until all pixels have been accounted for. The script was edited to mandate a fixed, quantified color scale bar for the heat maps, ranging from 600 μm/min (red) to 0 μm/min (dark blue). The script then determines the mean of all of these output averages, except for average velocities below 1 μm/min, which are excluded. This filter was implemented as a way to account for the presence of the structure (made from solid PDMS and exhibiting no fluid motion) within the frame of the video. These means of the output averages from each video were graphed to facilitate trend visualization. Google Docs was used to create scatter plots of movieaveraged velocity magnitude vs. frequency. Separate graphs were generated for Devices A and B, and different shapes and colors were used for the different structures and for the flat channel wall. Additionally, graphs were created specifically to compare the two channels, one of which contains all data.
4. Results
Two fabricated microfluidic devices, one with straight microstructures (Device A), and one with angled microstructures (Device B), were analyzed with 5 different frequencies, as above. Within each device the flat wall (between structures) was imaged and analyzed to serve as an in-device control. Two structures were chosen from each device for video analysis, one from the end closest to the transducer input (Structures 1 and 3) and one from the end farthest from the transducer input (Structures 2 and 4).
The data demonstrates clear vortex formation around structures, especially at larger frequency values, and validates a lack of such formation at flat channel walls, and while the piezoelectric transducer is turned off. Figure 7 (a heat map of average absolute particle velocity at an asymmetrical structure at a 9999 Hz acoustic frequency) shows circular patterns and includes areas with particles moving up to around 600 um/min (shown in red/orange). Figure 8 is also a heat map of average absolute particle velocity at a structure at a 9999 Hz acoustic frequency (although this structure is symmetrical), however, it doesn’t generate vortices to the same extent because 9999 Hz is a less powerful resonance frequency for this system. Alternatively, Figure 9 (a heat map of average
absolute particle velocity at a flat channel wall at a 9999 Hz acoustic frequency) was entirely blue and made it clear that no significant vortices were present. Similarly, Figure 10 (also a heat map of average absolute particle velocity at a flat channel wall at 9999 Hz acoustic frequency) demonstrates the same results, an entirely blue heat map and no significant vortex formation and/or acoustic mixing. Additionally, Figure 11 (a heat map of average absolute particle velocity before the piezo was turned on) shows no significant particle movement or vortex generation. The differences between these figures suggest that vortices result from the application of acoustic waves in conjunction with a channel structure. At a frequency value of 8000 Hz, the video taken at Structure 1 in Device A had a velocity magnitude that was around 171% larger than the absolute velocity at its flat channel wall. At this same frequency, the video taken at Structure 1 in Device B had a velocity magnitude around 273% larger than the velocity magnitude at its flat channel wall.
Figure 7: Heat map of average absolute velocity across the video showing Device B structure 4, at a frequency of 9999 Hz. [Made by author using MATLAB]
Figure 8: Heat map of average absolute velocity across the video showing Device A structure 2, at a frequency of 9999 Hz. [Made by author using MATLAB]
9: Heat map of average absolute velocity across the video showing a flat wall of Device A at a frequency of 9999 Hz. [Made by author using MATLAB]
Figure 10: Heat map of average absolute velocity across the video showing a flat wall from Device B at a frequency of 9999 Hz. [Made by author using MATLAB]
Figure 11: Heat map of average absolute velocity across the first 20 frames of one of the videos of Device B, before the piezoelectric transducer was turned on. [Made by author using MATLAB]
Figure
As shown in Table 1, there are clearly distinguishable resonance frequencies where average velocity values increase significantly. In particular Structure 1 (Device A), and Structure 3 (Device B) both experienced resonance peaks at 8000 Hz. Structure 2 (Device A) and Structure 4 (Device B) appeared to reach their resonance frequencies at 9999 Hz. The velocity magnitude at Structure 4 increased by 53.1% when the acoustic frequency was raised from 8000 Hz (the frequency with the next largest velocity value) to 9999 Hz. The velocity magnitude at Structure 2 had a similar increase of 312% (from its next largest value at 8000 Hz). However, the actual value of the velocity magnitude at Structure 4 was 22.2% greater than the magnitude of its counterpart in Device A.
Table 1: Graph of Movie-Averaged Absolute Velocity Values vs. Frequency including data from both Device A and Device B (Structures 1-4), flat walls in each channel, and an average value for situations with the piezoelectric transducer off.
Furthermore, all channels, structures, and flat walls showed a velocity decrease at 5000 Hz, which may be consistent with antiresonance behavior. Aside from this trend, resonance frequencies were overall very individual. Table 1 shows a general positive correlation between movie-averaged velocity magnitude and frequency. At 1000 Hz, all data points were below 25 μm/min, while at 9999 Hz, all points exceeded 25 μm/min, excluding data from the flat channel wall and with the piezo off. Generally, trends were best demonstrated at higher frequencies, which revealed lower velocity values for flat channel walls, and greatest velocity values within Device B. As hypothesized, asymmetric structures appeared to better promote chaotic flow, mixing, and larger flow velocity, especially at frequencies of 8000 and 9000 Hz, as shown in Table 1. The data point for Structure 2 at 9999 Hz is interesting and disrupts what otherwise would have been a more convincing advantage for the angled microstructures. This data point may be an outlier or suggest that the angled structures do not have an advantage significant enough to be reproducible.
No significant correlation was found between velocity values obtained at the structure closest to the transducer input versus the structure farther away. Confining assessment to the higher frequencies (where the greater effects were seen), neither device demonstrated a reproducible trend with regards to the position of the structure within the channel.
5. Discussion
These findings are consistent with the hypothesis that strong counter-rotating vortices would form at fluid-structure boundaries via the processes described above. Although “regular” Rayleigh streaming (the kind that does not produce net flow or predictably patterned vortices but instead only produces small localized motions that cancel out over time and across the channel) would still occur in the researcher’s system without the use of microstructures (explaining results indicating some limited motion near channel walls), the presence of structures amplifies Rayleigh streaming and promotes flow and mixing, yielding the greater average absolute velocities in videos taken near these structures, in particular 8000 and 9999 Hz.
This was the maximum frequency tested, due to equipment and monetary constraints, so a continuous increase with frequency is possible. For further testing, a 8000 Hz starting frequency is recommended, as positive correlation with frequency likely continues and there is room to increase frequencies before dissipation intensifies to the point of limiting clinical utility. This starting point would also allow for determination of a possible better resonant frequency between the 8000 and 9999 Hz values.
Another limitation of this experiment was in the manufacturing of the microfluidic devices. Under microscopic review, the microstructures turned out to be less sharp, and more globular, than originally intended. This may also have affected the differences that could reliably be determined between devices A and B. However, the fact that the microstructures still produced the desired effects of Rayleigh streaming broadens the usefulness of the data.
Vortex generation still happened at any irregularity despite imperfect fabrication. Originally the design of this study envisioned that a bioengineered cell targeted to incorporate into neuronal cell membranes could potentially be used as a platform to provide surface microstructures within the glymphatic system for clinical application (Soloperto et al. 2018; Rivnay et al. 2017; Ibsen et al. 2015; Krawczyk et al. 2020). Given the significant amplification achieved with more globular structures, however, the glymphatic system itself may be able to be harnessed, or at least possibly contribute, to the
amplification of flow velocity. As previously discussed, the glymphatic system naturally contains similar softedged microscale surface irregularities which, this research suggests, could be harnessed by acoustic waves to contribute to glymphatic clearance for therapeutic applications (Jessen et al. 2015; Murdock et al. 2024). This added intrinsic amplification may make therapy more feasible.
Similar to the piezoelectric transducer utilized in this experiment, which converts an electrical current into an oscillating motion generating an acoustic wave, bioengineered cells could also be designed to act as piezoelectric transducers, applying sound wave directly into the glymphatic system and minimizing the attenuation of sound wave energy, harmful heat generation, and other limitations. The piezoelectric transducer used in this experiment was very close to the fluid, moving through just a layer of thin glass, and was very firmly attached. This marks a significant difference from application through the skull. However, this research would become more applicable if application of sound waves could occur closer to the target region, as research suggests can be facilitated in bioengineered cells. The details of possible therapeutic adaptations of these findings are beyond the scope of this physics based project, but these findings do lend credence to possible treatment adaptations. Further research on Rayleigh streaming effects to fine tune optimization of structure design and resonance frequencies is warranted.
6. Conclusion
Despite decades of research, the current treatment of neurologic disorders such as Alzheimer’s disease, makes little impact on patient outcomes, and novel approaches to therapy are clearly needed. While the biologic application of acoustic therapy has been inherently limited in the past, the rapid advancement of nanotechnology and bioengineered cells brings new hope to the field. Acoustofluidics, and specifically the phenomenon of Rayleigh streaming, in combination with these advances in biotechnology can provide opportunities for a new approach to therapy. This research suggests that significant local velocity can be achieved with low frequency acoustic stimulation and provides a basis for justification for continued research into the development of neuronal therapies using the effects of Rayleigh streaming to increase effective flow in the glymphatic system and harness the brain’s own ability to repair itself.
7. Acknowledgements and Data
I would like to thank Dr. Falvo for his invaluable support and guidance throughout my project. I would also like to thank Viviana Londono Calderon for taking the time to help me bond my PDMS structures and for allowing me to use her lab equipment at UNC. Additionally, I would like to thank my Rphys classmates for their encouragement and camaraderie. I acknowledge the NCSSM Foundation and Burroughs Wellcome Fund for making this valuable experience possible with their funding and general support. Finally, I wish to document my usage of ChatGPT from OpenAI, specifically/exclusively for the purpose of generating and editing MATLAB code. I used version GPT-5.2 and entered the following prompt: I am using MATLAB to analyze microscope videos of fluorescent beads suspended in water moving through a fluid channel. Please give me a first draft of code that lets me select one of these videos to open in MATLAB. Then, the code should process the video to provide a heat map of the average velocity across all of the video frames at each pixel. Please output this heat map as well as the overall average velocity for the entire video. After gathering ChatGPT’s output code, I made edits with the help of AI, to calculate the average velocity across a 5x5 pixel area, add a fixed heat map scale, change the units of the velocities, and filter out values under 1 μm/min.
8. References
Abarzhi, S. I., Gauthier, S., & Sreenivasan, K. R. (2013). Turbulent mixing and beyond: non-equilibrium processes from atomistic to astrophysical scales II. Philosophical Transactions of the Royal Society a Mathematical Physical and Engineering Sciences, 371(2003), 20130268–20130268.
2024 Alzheimer’s disease facts and figures. (2024). Alzheimer’s & Dementia: The Journal of the Alzheimer’s Association, 20(5), 3708–3821.
Buccellato, F. R., D’Anca, M., Serpente, M., Arighi, A., & Galimberti, D. (2022). The role of glymphatic system in Alzheimer’s and Parkinson’s disease pathogenesis. Biomedicines, 10(9), 2261.
Campos, L., et al (2023). Advances in AAV technology for delivering genetically encoded cargo to the nonhuman pormate nervous system. Current Reserach in Neurobiology, 4(1), 100086. https://doi.org/10.1016/j. erneur.2023.100086
Chen, G., et al. (2017). Amyloid beta: structure, biology and structure-based therapeutic development. Acta Pharmacologica Sinica, 38(9), 1205–1235.
Cruickshank, C. C., et al. (1997). Estimation of the pore size of the large-conductance mechanosensitive ion channel of Escherichia coli. Biophysical Journal, 73(4), 1925–1931.
Czarnota, G. (2010). Ultrasound detection of cell death. Imaging in Medicine, 2(1).
Darwin Microfluidics. (n.d.). Laminar Flow: Microfluidics Explained. Darwin Microfluidics. Retrieved 2025, from https://blog.darwin-microfluidics.com/glossary/ laminar-flow-microfluidics-explained/
Daru, V., et al. (2017). Acoustic Rayleigh streaming: Comprehensive analysis of source terms and their evolution with acoustic level. The Journal of the Acoustical Society of America, 142, 2608.
DiBello, J. R., Lu, Y., Swartz, J., Bortnichak, E. A., Liaw, K.-L., Zhong, W., & Liu, X. (2023). Patterns of use of symptomatic treatments for Alzheimer’s disease dementia (AD). BMC Neurology, 23(1), 400.
Doerner, J. F., et al. (2012). Controlled delivery of bioactive molecules into live cells using the bacterial mechanosensitive channel MscL. Nature Communications, 3, 990.
Elert, G. (2019). Standing Waves. The Physics Hypertextbook.
Ellis, R., & Langmaid, S. (2024). Cholinesterase Inhibitors for Alzheimer’s Disease. WebMD.
Gardner, T. J., et al. (2020). Targeted cellular micropharmacies: Cells engineered for localized drug delivery. Cancers, 12(8), 2175.
Garrett, S. L. (2020). Understanding Acoustics: An Experimentalist’s View of Sound and Vibration. Springer International Publishing.
Huang, P.-H., et al. (2013). An acoustofluidic micromixer based on oscillating sidewall sharp-edges. Lab on a Chip, 13(19), 3847–3852.
Huang, P.-H., et al. (2014). A reliable and programmable acoustofluidic pump powered by oscillating sharp-edge structures. Lab on a Chip, 14(22), 4319–4323.
Huang, P.-H., et al. (2015). An acoustofluidic sputum liquefier. Lab on a Chip, 15(15), 3125–3131.
Huang, Z., et al. (2023). The functional effects of Piezo channels in mesenchymal stem cells. Stem Cell Research & Therapy, 14(1), 222.
Ibsen, S., et al. (2015). Sonogenetics is a non-invasive approach to activating neurons in Caenorhabditis elegans
Nature Communications, 6, 8264.
Jessen, N. A., Munk, A. S., Lundgaard, I., & Nedergaard, M. (2015). The glymphatic system: A beginner’s guide. Neurochemical Research, 40(12), 2583–2599.
Knight, R. D., Jones, B., & Field, S. (2014). College Physics: A Strategic Approach. Pearson Education.
Krawczyk, K. (2020). Electrogenetic cellular insulin release for real-time glycemic control in type 1 diabetic mice. Science, 368(6494), 993–1001.
Lei, J., et al. (2017). Comparing methods for the modelling of boundary-driven streaming in acoustofluidic devices. Microfluidics and Nanofluidics, 21(2), 23.
Lei, J., et al. (2021). Outer acoustic streaming flow driven by asymmetric acoustic resonances. Micromachines, 13(1), 65.
Li, T., Chen, Y., & Ma, J. (2009). Development of a miniaturized piezoelectric ultrasonic transducer. IEEE Transactions on Ultrasonics, Ferroelectrics, and Frequency Control, 56(3), 649–659.
Lohela, T. J., et al. (2022). The glymphatic system: Implications for drugs for central nervous system diseases. Nature Reviews Drug Discovery, 21(10), 763–779.
Marino, A., et al. (2015). Piezoelectric nanoparticleassisted wireless neuronal stimulation. ACS Nano, 9(7), 7678–7689.
Martin, R. D., Neary, E., Rinaldo, J. R., & Woodman, O. (2019). 14.7: Standing waves. In Introductory Physics: Building Models to Describe Our World. LibreTexts.
Matrix Group International. (2023). Statement on Biological Effects of Therapeutic Ultrasound. AIUM.
Miller, D. L., et al. (2012). Overview of therapeutic ultrasound applications and safety considerations. Journal of Ultrasound in Medicine, 31(4), 623–634.
Murdock, M. H., et al. (2024). Multisensory gamma stimulation promotes glymphatic clearance of amyloid. Nature, 627(8002), 149–156.
Nagle, S. M., et al. (2013). Challenges and regulatory considerations in the acoustic measurement of highfrequency ultrasound. Journal of Ultrasound in Medicine, 32(11), 1897–1911.
Nama, N., et al. (2014). Investigation of acoustic streaming patterns around oscillating sharp edges. Lab on a Chip, 14(15), 2824–2836.
Nama, N., et al. (2016). Investigation of micromixing by acoustically oscillated sharp-edges. Biomicrofluidics, 10(2).
Neĭkov, O. (2019). Chapter 14 - Processing of Powders and Processing Equipment . In Handbook of Non-Ferrous Metal Powders: Technologies and Applications (2nd ed., pp. 403–455). Elsevier.
Ozcelik, A., & Aslan, Z. (2021). A practical microfluidic pump enabled by acoustofluidics and 3D printing. Microfluidics and Nanofluidics, 25(1), 5.
PASCO. (n.d.). Function Generator. PASCO scientific | Science Lab Equipment and Teacher Resources.
Pawlaczyk, M. (2020). Impact of very high-frequency sound and low-frequency ultrasound on people. International Journal of Occupational Medicine and Environmental Health.
Rivnay, J., et al. (2017). Next-generation probes, particles, and proteins for neural interfacing. Science Advances, 3(6), e1601649.
RheoSense. (2015). What are the Differences between Dynamic and Kinematic Viscosities? RheoSense.
Saldana, M., Gallegos, S., Gálvez, E., Castillo, J., SalinasRodríguez, E., Cerecedo-Sáenz, E., Hernández-Ávila, J., Navarra, A., & Toro, N. (2024). The Reynolds number: A journey from its origin to modern applications. Fluids, 9(12), 299.
Sahin, M. A., et al. (2023). Fundamentals of acoustic wave generation and propagation. In A. Ozcelik, R. Becker, & T. J. Huang (Eds.), Acoustic technologies in biology and medicine (pp. 1–24). Wiley.
Singh, R., & Sadiq, N. (2023). Cholinesterase Inhibitors. In StatPearls. National Library Of Medicine: National Center for Biotechnology Information.
Soloperto, A., et al. (2018). Mechano-sensitization of mammalian neuronal networks through expression of the bacterial large-conductance mechanosensitive ion channel. Journal of Cell Science, 131(5), jcs210393. https:// doi.org/10.1242/jcs.210393.
Wassgren, C. (2021). Course Notes. Purdue Engineering. https://engineering.purdue.edu/~wassgren/notes/
Wu, J. (2018). Acoustic streaming and its applications. Fluids, 3(4), 108.
Yang, Y. (2023). Flow field characteristics of Rayleigh streaming in a two-dimensional rectangular channel under the background physical field. International Communications in Heat and Mass Transfer, 142, 106643.
Zhang, C., et al. (2019). Acoustic streaming near a sharp structure and its mixing performance characterization. Microfluidics and Nanofluidics, 23(9).
Zhang, C., et al. (2020). Acoustic streaming generated by sharp edges: The coupled influences of liquid viscosity and acoustic frequency. Micromachines, 11(6), 607.
Zhang, Y., & Chen, X. (2021). Particle separation in microfluidics using different modal ultrasonic standing waves. Ultrasonics Sonochemistry, 75, 105603.
Zhao, H., et al. (2023). Tuning of cellular insulin release by music for real-time diabetes control. The Lancet Diabetes & Endocrinology, 11(9), 637–640.
Zhong, G., et al. (2023). Vibration-induced streaming flow near a sharp edge: Flow structure and instabilities in a large span of forcing amplitude. Physical Review E, 107(2), 025102.
Zhou, Q., et al. (2011). Piezoelectric films for high frequency ultrasonic transducers in biomedical applications. Progress in Materials Science, 56(2), 139–174.
AN INTERVIEW WITH FELICE FRANKEL
From left to right, top to bottom: John Guo, BSS Publication Editor-In-Chief; Joshua Chilukuri, BSS Editor-In-Chief; Ankit Biswas, BSS Editor-In-Chief; Dr. Jonathan Bennett, BSS Faculty Advisor; Felice Frankel, Research Scientist at the Massachusetts Institute of Technology; Kae Saotome, 2026 BSS Essay Contest Winner.
Could you briefly introduce yourself?
I’m Felice Frankel, and I am a research scientist at MIT. I’ve been there for 33 years. For the most part, I help researchers create visuals for journal submissions and presentations—mostly photographic, although lately I’ve been doing quite a lot of graphics to explain what is going on that cannot necessarily be captured with a photograph. The dirty little secret is that I am constantly learning whenever I have an assignment. I welcome anyone who is interested in doing this someday to get in touch with me.
What sparked your interest in scientific photography?
I have a science background, which enables me to have conversations, up to a point, with the researchers. I worked in a laboratory at the Cancer Research Institute at Columbia many years ago, and my whole world was about science. Even as a child, I was always fascinated by why something looks the way it looks and why it happened.
I did not go to graduate school; I went directly into the lab. I’m going to skip over life, but eventually I went into photographing architecture. When my husband was in Vietnam, during the height of the war, he sent me a Nikon
camera. I started off just playing around with making pictures on a very good camera, which translated into the fact that I saw images that I wanted to see, because the camera was so good. So I became an architectural and landscape architectural photographer.
That brought me to Harvard on a fellowship at the Graduate School of Design in the School of Architecture. While my fellow colleagues were taking classes in design and politics, I found myself yearning to go back to science, and I sat in on as many science classes as I could.
One of the faculty lecturing a particular course was very visual in how he represented the science. I was so moved by how he illustrated the work that I had the audacity to walk up to him after the lecture and invite myself to his lab. He said, “Sure, come to the lab.” I came a couple of days later, and he introduced me to his postdoc, Nick Abbott. They showed me work they were just about to publish in Science. I looked at their images and frankly said, “We could do better.”
So we worked together. I asked for a different kind of sample, and the bottom line is that we got the cover of Science. That was the beginning. He said, “Felice, stay with this. You’re doing something that no one else is doing.” It
was the most beautiful serendipity that ever happened in my life. I was at the right place at the right time with the right person. But the key is that I grabbed at it. That’s what I want to suggest to everybody: if you see something that feels right in your guts, go for it. I did, and one thing led to another, and then I wound up at MIT, which is a glorious place to be.
What has been your favorite project?
For the most part, the picture that I made in 1992 for the cover of Science—my first picture—still remains the most interesting to me, because it changed my life. It sounds very dramatic, but it was when I became a science photographer and left all the other stuff behind.
That image, first of all, gave me confidence because I used the science that I understood. I understood what the primary idea of the science was, and they were not doing a good job with it. By asking them to give me a different sample, I was able to explain it visually better than they did. That’s what turned me around: realizing that this is what I wanted to do, and that there was room for this in the research lab. There is room to create an image that is not only aesthetically beautiful, but also communicative. It was my first time, and it is still memorable for me.
Has there ever been something unexpected that you saw and immediately knew you had to photograph?
There is one picture in the book for teens, Phenomenal Moments. It’s not a beautiful picture, but when you make a picture—when you decide to take a picture, to create— you see something more than you would just passing by.
I was walking along a road, and there were two posts that I knew came from a tree, and I saw the tree rings. That was going to be something I would use. Then, when I started composing it, I realized that I not only saw the annual rings, but I also saw the impressions from the saw that was sawing off the end of it. I did not see the saw right away, but when I made the picture, I saw more information. That is what you get when you are forced to make a good picture. You actually might see something further than what you initially saw. So it is an act of discovery. It is great fun.
In Phenomenal Moments, how do you convey that ordinary things we see every day are actually extraordinary?
I actually did not start with an idea for a book. Throughout my life, if I see something that I think is cool, I take out my iPhone. Most of the images were made with my phone. I
snapped the picture, and I had a collection. I noticed, for example, a hydrophobic surface. That is why the water on the leaf is balling up—because of the hydrophobicity. A friend of mine said, “You’ve got a lot of interesting images here. Maybe there’s a book here.” That is how Phenomenal Moments started.
The idea is: look at my picture. You recognize it? Of course you do. You’ve seen this before when you’re walking in the park. I’m explaining the moment—the “phenomenal moment”—when I made it, and the phenomenon, with language that is accessible.
So the next time you are walking through the park and you see that specular lighting that happens on a lake at a certain time of day, you’re going to tell your friend, “You know what that is?” And you’re going to talk about it. Even better, make your own picture. Start collecting your own scientific phenomena. That would be a way of engaging everybody in understanding how fabulous science can be.
What advice do you have for high school students who want to pursue science or STEM careers?
You have to show what you can do. The reason why I have landed where I have landed is because I did not just say to somebody, “I can do better than you”—I showed it. In this kind of field, that is what this is all about: showing. It was not just an aesthetic; it was about the information the researcher was trying to represent.
If anybody is interested in this—or graphics, although AI will take that over, and that is OK—I do graphics as well. I am using AI for graphics. There is no question that it is mind-blowing. I just got a cover of a journal and it was completely non-photographic. It goes back to the notion that you cannot just talk somebody into anything. You have to show them what you do.
How important is science communication in today’s society?
We’re in a lot of trouble, period. People do not respect scientists. They do not trust us. In my opinion, we’re not doing a good job of communicating to the public about what we’re doing in the labs. One of the portals can be the visual. Everybody makes pictures. So it’s a language that is accessible; people aren’t afraid.
For me, it’s not taken seriously enough in the research community, though it’s slowly changing. The younger generation understands the power of a visual. The whole notion of finding ways of representing your work visually is important not only for communicating to others, but
because, in the process, you clarify your own work when you are required to represent it. You have to figure out: where should this go? Should I include this, or is this too much?
Do we speak to the public differently than our colleagues? Yes, of course. But where do you make that difference? All of that, in my opinion, should be part of your training.
You created at MIT the first massive open online course for science and photography. Is that a first step toward a wider initiative for teaching science photography, and where do you see it going?
I think it is a good first step. Once again, you cannot learn this—as you cannot learn anything—from a textbook. You have to do it. If I had more energy in my 80 years, I would absolutely have a hands-on course on how to make images.
What I am trying to do next year, and it has to be approved, is more of a visual literacy course. It would take the students through the history of photography and sketching and any kind of visual explanation, then go through the ethics of manipulation and get into a very important conversation about AI. It will entail having the students create their own images. That will be part of it. In this kind of experience, you must do it. Period.
Do you think scientists should be trained to be better communicators so they can explain their work to the public?
There is no question in my mind that we have made a mistake in not including that in the requirement. Not including that part of communicating to the public as part of your CV. You are not rewarded for it. You do not get tenure for it. There is a token, occasionally, when you get a grant, to have a line item for what they call outreach. It is never taken seriously, and it should not just be a line item; it should be part of your education that you must learn how to speak to the public.
If you have an image of your work, do you have to do something to that image to make it more accessible? Maybe make it more beautiful without messing up the data? This whole notion of not including the public in our education has been the downfall, in my opinion, of why we are going through what we are going through. It is a mess. But I think it should be part of all of our education: how to communicate to the public. My whole thing is with images.
Here’s a fun one—what is your favorite color?
I think color choices are generational, and I think they are also cultural, depending upon where you were brought up. But I have noticed that I like to use orange. Why? I have no idea. But in my photography, when I need a background, I use orange often.
I think it is tied to when you were brought up. For example, many of my students at one time were using fuchsia, which is a very hot pink, and I said, “Uh-uh, that is not for me.” By the way, I would never live in an orange room. My entire place is off-white. The art looks best against white, in my opinion.
What final message would you like to leave for the public and the next generation?
Don’t be frightened of science. It is absolutely beautiful and stunning. It is part of your life. Just grab at it in any way you can.