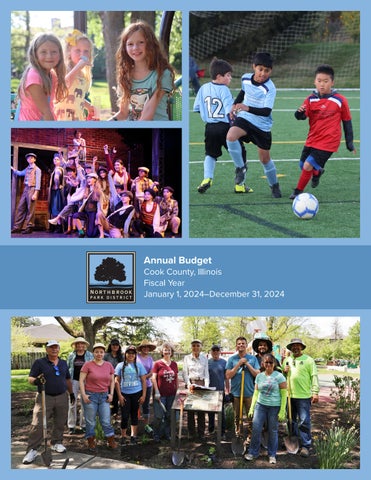
Annual Budget
Cook County, Illinois Fiscal Year January 1, 2024–December 31, 2024
Annual Budget
January 1, 2024 - December 31, 2024
Park Board of Commissioners Lisa Chalem – President Michael Goodman – Vice President Mary Ann Chambers – Commissioner Edward Chao – Commissioner Beverly Kumar – Commissioner Michael Schyman – Commissioner David S. Silverman – Commissioner
Joe Doud Administration Building 545 Academy Drive Northbrook, Illinois 60062 847-291-2960 nbparks.org
Table of Contents
District Profile ........................................................................................................... 1-2 Budget Recognition.......................................................................................................3 Budget Message........................................................................................................ 4-6 Comprehensive Master Plan ..................................................................................... 7-8 Budget Overview..................................................................................................... 9-15 Guidelines and Processes ................................................................................. 9-11 Debt Position .................................................................................................. 12-13 Tax Levy and Rates ......................................................................................... 14-15 Consolidated Budget Analysis ............................................................................... 16-20 Overview ...............................................................................................................16 Major/Non-Major Funds ......................................................................................16 Individual Funds ....................................................................................................17 Divisional Funds ....................................................................................................17 Consolidated Revenue ..........................................................................................18 Consolidated Expenditures ...................................................................................19 2024 Consolidated Income Statement .................................................................20 Budget Analysis ..................................................................................................... 21-51 Administrative Division................................................................................... 21-27 Division of Parks and Properties ..................................................................... 28-31 Division of Golf Operations............................................................................. 32-37 Division of Recreation..................................................................................... 38-51 Appendix A – 2023 Capital Improvement Plan Summary ..........................................52 Appendix B – Historical Tax Rates...............................................................................53 Appendix C – Operating/Non-Operating Surplus by Fund..........................................54 Appendix D – Detail by Fund................................................................................. 55-60 Appendix E – Glossary ........................................................................................... 61-62 Appendix F – Employee Headcount ............................................................................63 Appendix G – Performance Measures ................................................................. 64-71 Appendix H – District-Wide Organization Chart .........................................................73
District Profile Established
On June 29, 1927, the Northbrook Park District was formed with Commissioners Clarence Bartelme, Wallace Clore, J.W. Cooksey, E.D. Landwehr and Herman Meier, President. The first order of business was to appropriate a budget of $1,800 for fiscal year 1927.
Governed
A seven-member, elected Board of Commissioners establishes Park District policy, strategic direction and governing ordinances. Commissioners are elected to serve staggered, four-year terms. The current Board consists of Lisa Chalem, President; Michael Goodman, Vice President; and Commissioners Mary Ann Chambers, Edward Chao, Beverly Kumar, Michael Schyman and David S. Silverman.
Boundaries
The Park District is located in northern Cook County, 26 miles north of downtown Chicago, Illinois. The District lies in Northfield and Wheeling Townships and is bordered by Deerfield and Highland Park on the north, Glenview on the south, Glencoe and Northfield on the east, and Wheeling on the west. In addition, hundreds of acres of Cook County Forest Preserves surround the District. The Park District serves all of Northbrook, as well as small portions of Deerfield and unincorporated Cook County.
Population
According to the 2020 Census, the population of Northbrook is approximately 34,058.
Demographics
The District serves a highly educated, professional community of homeowners with an estimated median household income of $134,516 and a median age of about 50.9 years (2020 Census). Park District programs and facilities provide important services to all residents of the community. Program offerings are regularly evaluated based on demographics and community feedback. In addition to our own programs, the District works with several affiliates to offer recreational opportunities including baseball, softball, hockey, soccer, cycling, synchronized skating and speed skating. To assist families with demonstrated financial need, the Park District offers scholarships for some camps and programs, working with Youth Services of Glenview/Northbrook to determine need. The 2024 budget for scholarships is $40,000. The District also offers extended payment plans for program participation.
Real Estate
The 2022 Equalized Assessed Value (EAV) of real estate was $3,204,280,347.
Tax Rate
The 2022 tax rate was $.415 per $100 of assessed value (5.6% of average real estate tax bill).
Fiscal Year Budget
The fiscal year begins on January 1 and concludes on December 31. The total budget for 2024 is $31.6 million, with an operating budget of $21.8 million, a capital improvement and repair budget of $7.4 million, and a debt service budget of $2.5 million.
Debt Rating
In February 2022 Moody’s Investors Service reviewed and assigned a rating of Aaa to the District’s General Obligation Limited Tax Park Bonds, Series 2022.
Park Resources
The Northbrook Park District services a population of approximately 34,058 residents in a service area of approximately 13 square miles. The District operates and maintains 543 acres of property, 32 of which are maintained through intergovernmental agreements. The District holds title to 29 1
District Profile parcels including community parks, neighborhood parks, play lots and passive parks. Unique and premier facilities include the Ed Rudolph Velodrome (banked bicycle racing track), Heritage Oaks Golf Club, Techny Prairie Activity Center, Leisure Center, Senior Center, Northbrook Theatre and the Northbrook Sports Center which contains two full-size indoor ice rinks. Recreational facilities include two outdoor swimming facilities, 36 holes of golf, practice range, two sled hills, dozens of baseball/softball and soccer fields, multiple courts and playgrounds, numerous picnic areas and trails and two fishing lakes. Programs/Services
The Park District provides a full range of indoor and outdoor activities. Major programs include golf, before school and after school programming, summer camps, ice skating, fitness, performing arts, athletics, preschool and aquatics. Annual special events include Kids’ Fishing Derby, Northbrook-On-Ice, Tuesdays in the Park, free outdoor concerts, Kids’ Duathlon, Liberty Loop 5K, Party on the Green, Brewfest, Grapes on the Green, Touch-A-Truck and Autumnfest. The Park District is affiliated with the Northern Suburban Special Recreation Association (NSSRA) to provide recreational activities and services for residents with special needs.
Staff
The Park District has an appointed Executive Director responsible to the Board of Commissioners for the administration of the District. The 2024 budget includes funding for 80 full-time positions. Throughout the year the District also employs roughly 550 part-time, seasonal and temporary employees and hundreds of volunteers in four budgetary areas: Administrative, Parks and Properties, Golf Operations and Recreation.
Affiliations
The Northbrook Park District is a member of the National Recreation and Park Association (NRPA), the Illinois Park and Recreation Association (IPRA), and the Illinois Association of Park Districts (IAPD).
Contact
Northbrook Park District, 545 Academy Drive, Northbrook, Illinois 60062 Phone: 847-291-2960, Fax: 847-205-1154 Email: info@nbparks.org
Website
nbparks.org
2
Budget Recognition Since 1993, the Northbrook Park District has received a Distinguished Budget Presentation Award from the Government Finance Officers Association of the United States and Canada (GFOA). The award is the highest form of recognition in government budgeting. The budget document is judged as a policy document, operations guide, financial plan and communications device.
3
December 11, 2023 Board of Commissioners Northbrook Park District Cook County, Illinois Honorable Commissioners: The operating budget of the Northbrook Park District for the fiscal year ending December 31, 2024 is presented for your review. This document reflects the District's comprehensive financial plan to provide parks, facilities and programs to residents and participants during the upcoming fiscal year. The Budget is presented in three main sections: introduction, financials and appendices. The introduction includes this transmittal letter and general financial information including bond indebtedness and tax funding. The financial section includes analysis on a consolidated and divisional basis. Finally, the appendices include a detailed list of 2024 capital projects, historical tax rate information, operating/non-operating surplus by fund, individual fund performance and a glossary of budget terms. Budget Highlights Revenue in 2024 is expected to increase $2.9 million to $28.6 million compared to the 2023 budget. The increase in revenue primarily reflects favorable revenue outlooks for Recreation program fees and Golf Operations. The largest increases in revenue are expected in the following areas: • • •
Recreation (+$1.6 million) – Program fees and memberships Golf Operations (+$563,963) – Higher daily fees, program fees Administration (+$743,665) – Property tax and investment income
Recreation total revenue is expected to increase 20.6% or $1,584,001 to $9.3 million. Program Fee revenue is the largest increase expected to grow 24.4% or $1,147,589 to $5.9 million for 2024. Programs fees increases are mostly due to favorable increases compared to prior budget for Before/After School (+$443,159), Summer Camps (+$390,451) and Adult Athletics (+$178,887). Stronger revenue expectations are also projected for membership fees of $1.2million (up $210,600 compared to 2023 budget). Revenue within Golf Operations is expected to increase $563,963 to $4.3 million in 2024 compared to the 2023 budget. Specifically, revenue generated from Golf Daily Fees is expected to exceed $2.7 million (up 13% compared to 2023 budget). Range revenue is expected to contribute $485,000 to the Division. Range revenue is up significantly versus pre-renovation totals that were historically between $220,000-$250,000. Total consolidated Operating expenses are expected to increase $2.5 million or 11% compared to the 2023 budget. The budget includes two new full-time roles for Recreation, one in Administration and one in Golf. Salary and Wages are also higher due to salary market adjustments, changing business conditions due to wage increases and other inflationary wage increases resulting in higher competitive rates of pay. The budget for capital projects in 2024 totals $7.4 million and includes costs needed for Meadowhill Aquatic Center and Williamsburg Square Park Renovations (budgeted at $1.75 million and $1.49 million respectively). Additionally, the budget includes costs related to playground, parking lots, pathway and tennis court improvements. For a complete listing of 2024 capital projects see Appendix A.
4
Operating Revenue Expense Operating Surplus Non-Operating Revenue Capital Expense Debt Expense Net Surplus
$
2024 Budget 2023 YE Projection 25,771,687 $ 24,961,267 $ 21,898,162 18,922,125 3,873,525 6,039,142
2023 Budget 23,040,475 $ 19,410,425 3,630,050
2022 Final 22,416,100 $ 16,032,387 6,383,713
2021 Final 16,627,853 13,397,017 3,230,835
2,809,263 (7,355,400) (2,460,463) (3,133,075)
2,616,863 (6,496,506) (2,407,464) (2,657,057)
10,564,743 (3,048,748) (2,369,710) 11,529,999
3,211,227 (10,044,116) (2,268,999) (5,871,053)
2,941,486 (5,466,384) (2,407,464) 1,106,780
Refer to Appendix C for a reconciliation schedule detailed by Fund for the consolidated table highlighted above. The Reporting Entity and its Services The Park District provides recreational opportunities and services for the residents of Northbrook, located in Cook County, Illinois. These services include organizing recreational programs, maintaining park facilities and amenities and managing capital improvement projects. A Board of seven Commissioners, elected at-large by District residents, governs the Park District. Commissioners serve staggered four-year terms with elections every two years. The Board is responsible for the long-term direction of the District, establishing policies and appointing the Executive Director and Board Officers. The Board meets regularly on the fourth Wednesday of each month. The Northbrook Park District divides its governmental operations into separate funds and account groups based on financial accountability. The accompanying budget document includes only those funds and account groups of the Park District. The District participates in the Illinois Municipal Retirement Fund (IMRF), the Northern Suburban Special Recreation Association (NSSRA) and the Park District Risk Management Association (PDRMA) but does not exercise financial accountability over those agencies; therefore, their annual budgets are not included in this report. Economic Condition and Outlook A strong tax base is critically important for all taxing bodies to deliver essential public services to the residents and businesses of Northbrook. The District’s mature tax base is expected to remain healthy, given a stable commercial/industrial presence and favorable proximity to the City of Chicago and suburban Cook County economic centers. The commercial/industrial sector historically comprises around a third of the tax base and includes major corporate entities, such as West Coast Estates (Northbrook Court), Underwriters Laboratories, Inc. and Jones Lang LaSalle. The remaining tax base is residential, and much of the housing stock is high-value, single-family homes valued in excess of $500,000. Northbrook’s unemployment rate at the end of 2022 was 3.6%, comparing favorably to the State of Illinois rate of 4.6%. The Village uses incentives to attract new businesses and retain existing businesses. The most frequently used incentive program for the Village is a Cook County 6B Property Tax Incentive program, available for manufacturing, warehouse and research facilities that are either expanding or occupying vacant buildings. The program reduces overall property taxes over the course of 12 years but increases to their normal levels in year 13. Development impact fees are used to improve parks or purchase nearby parkland. The District has received roughly $107,000 in impact fees during 2023 and $280,000 in 2022. The fees are included within non-operating revenue in the budget table above. Fees are used to offset a development’s impact on the District’s recreational facilities, programs and services and are especially important when located in an underserved area. Efforts continue in the community to maintain and enhance existing commercial and industrial areas that historically support around one third of the tax base. 5
Acknowledgments The budgets included in this document are prepared as a management tool and are not legally required documents. Management uses this baseline to evaluate activities during the year to provide a balanced program of recreational activities for Park District residents. The Budget and Appropriation Ordinance, the legally required document, will be presented at the Administration and Finance Committee Meeting on January 18, 2024 followed by a Public Hearing held during the Regular Board Meeting on January 23, 2024. The 2024 Budget was assembled with the help of supervisors, managers, directors and support staff. Finance and Administrative leadership are responsible for final annual budget preparation, Budget and Appropriation Ordinance preparation, distribution and filing. The Annual Budget is reviewed continually throughout the year, and its preparation would not be possible without the efforts of the Park District staff and the support of the Board of Commissioners. Respectfully submitted,
Chris Leiner, CPRP Secretary, Executive Director
Michael Tokar Treasurer, Director of Finance and Technology
6
Comprehensive Master Plan Comprehensive Master Plan Overview
The Northbrook Park District adopted a Comprehensive Master Plan, shaped by the community, on February 22, 2017 to guide facility and program decisions for the next ten years. The original plan process began in Fall 2015 with an extensive inventory and analysis of the District’s park and open space assets, indoor facilities and community context along with an analysis of recreation programs and services. Stakeholder input was collected from the Board of Commissioners, staff, stakeholders and the community to identify top priorities for investment. In 2021, the District conducted a Comprehensive Master Plan (CMP) Update. The process for the updated plan began in Spring 2021 with revisions to the inventory and analysis from the original plan. The planning process included five key phases: • Analyze • Connect • Envision • Prioritize • Implement The 2021 Comprehensive Master Plan Update was Board adopted on March 30, 2022. Community Feedback Community input was once again an extremely important part of the process. The District collected extensive input through a statistically-valid community-wide survey, Board of Commissioner Workshops, Staff Workshops, a Community Workshop, stakeholder interviews, an online portal, program assessment, industry trends and the inventory and analysis of current park and open space assets, indoor facilities and community demographics. Top Priorities for Investment The statistically-valid community-wide survey helped identify Priority Investment Ratings for facilities and amenities and recreation programs. Facilities and amenities rated by the community as high priorities for investment included outdoor pools, outdoor walking/biking trails, outdoor golf practice range and outdoor golf course. Eight programs were rated as high priorities for investment including: adult general recreation, lap swimming, adult golf lessons, group fitness classes, golf simulators, pickleball, art classes and senior center programming. These priorities, along with all input received, were used to update and refine the original Plan through the development of new goals and strategies for the District. These priorities also help inform decision making for the District’s Capital Improvement Plan and Annual Budget. Goals and Strategies The 2021 CMP Update builds on the results and strategies of the original Plan, modifying, adding or removing goals and strategies as a result of the accomplished items, changes in community interest, and/or fiscal changes. The process resulted in six goals: Goal 1 Indoor Assets: Address existing indoor space and recreation facility needs Goal 2 Outdoor Assets: Maintain and update existing outdoor recreation assets to provide quality parks, trails and outdoor facilities Goal 3 Acquisition and Development: Address park and open space level of service gaps and distribution deficiencies 7
Comprehensive Master Plan Goal 4 Program Strategies: Evaluate and adjust programs and marketing methods to provide high-quality offerings that meet community needs Goal 5 Community Outreach: Build support, trust, communication and awareness within the community Goal 6 District Responsibility: Conduct operations with fiscal responsibility to maintain quality parks, facilities and services in a sustainable fashion, including continued development and partnership opportunities. Action Plan Individual strategies to support each goal were developed and purposefully scheduled across an updated five-year Action Plan. This Action Plan acts as a guide to assist the Northbrook Park District with implementing the strategies for the next five years. The Action Plan is a guide for the future of the District and will be evaluated and updated on an annual basis.
8
Budget Overview Guidelines and Processes Introduction The narrative and objectives in this document align with the Park District’s Mission to enhance the community by providing outstanding services, parks and facilities through environmental, social and financial stewardship. This detailed document explains the Budget and Appropriation Ordinance which appropriates all funds and is adopted after a Public Hearing, scheduled for January 23, 2024. The District will post the time and location of the hearing following all legal regulations, making copies of the Budget and Appropriation Ordinance available for public inspection at the Joe Doud Administration Building, 545 Academy Drive, Northbrook, Illinois. The Budget and Appropriation Ordinance is adopted before the end of the first quarter of each year and filed with the Cook County Clerk within 30 days of adoption. Along with a certified copy of the Budget and Appropriation Ordinance, the District includes anticipated revenue during the fiscal year covered by the ordinance. The District’s Chief Fiscal Officer is responsible for certifying the revenue estimate. The Ordinance outlines any probable expenditures of grant or development impact fees. State law prohibits further appropriation at any time within the same fiscal year. After the first six months of the fiscal year, the Board of Commissioners has the authority to transfer items in any fund in the Appropriation Ordinance, with a two-thirds majority vote. Transfers cannot exceed 10% of the total amount appropriated for the fund or item that is having funds reallocated. The Board of Commissioners can amend the Budget and Appropriation Ordinance, using the same procedures followed when the Ordinance was adopted. The District uses a detailed line-item budget for accounting, expenditure control and financial reporting with a modified accrual basis of accounting. Revenues are recognized when they become available and measurable; expenditures generally are recognized when liabilities are incurred. The modified accrual basis is identical to the basis of accounting used in the audited fund financial statements. The Park District compares year-end estimates, the prior year’s budget and the proposed budget to ensure that baseline information used for comparison purposes is reasonable. Budget Planning Process Preparation of the current year Capital Improvement Plan (CIP) and preparation of the operating budgets run concurrently during the budget process. Planning for the District’s CIP begins each summer, resulting in a thoroughly researched list of project recommendations presented to the Board of Commissioners on November 15, 2023. Detailed budgeting for program and operational budgets began in September, with several review meetings held with various levels of staff during November. The proposed operating budget is scheduled to be discussed with the Board of Commissioners on December 11, 2023. Board Meeting Agendas are posted at least 48 hours in advance. Board Meetings are open to the public and announced up to four weeks in advance. The schedule for the public meetings pertaining to the discussion and approval of the 2024 budget is as follows:
Date
Meeting
Matter
December 11, 2023 January 18, 2024
Committee-of-the-Whole Meeting Administration and Finance Committee Meeting Public Hearing Regular Board Meeting
Board reviews 2024 Annual Budget Committee discusses Budget and Appropriation Ordinance Board hears comments from the public Board considers Budget and Appropriation Ordinance
January 23, 2024 January 23, 2024
9
Budget Overview Guidelines and Processes Accounting System and Budgetary Control Budgetary control is provided by verification and approval of appropriation amounts prior to expenditures and monthly review of all individual account expenditures compared with budgeted appropriations. Management receives monthly reports detailing actual expenditures versus the budget on a monthly, year-to-date and year-end estimated basis to monitor the budget performance. The Administration and Finance Committee, consisting of three Board members, is responsible for reviewing all expenditures. In addition, the Administration and Finance Committee and Board of Commissioners review quarterly financial performance reports, comparing expense levels to budgeted amounts and other benchmarks. The Board of Commissioners is also responsible for the development and approval of District financial policies. Program fees and taxes are proposed each year to exceed general operating expenses. The resulting operating surplus, along with excess unrestricted reserves and debt management, comprises funding for the Park District’s Capital Improvement Plan. Capital improvements are discretionary spending, while operating expenses are driven by programs required by the community. A combination of user fees, retail sales, interest income and taxes provide funds for services. Property taxes are one of the major sources of revenue for general operations. The property tax levy for operations traditionally has increased each year at roughly the rate of inflation. During the year, idle cash is held in insured or collateralized Certificates of Deposit or U.S. Government Securities. Some funds are invested in a savings deposit account which provides a competitive rate of return while ensuring daily liquidity for the District throughout the year. Financial Policies A series of financial policies and procedures outlines processes for financial planning, treatment of revenue streams and control of expenditures. Each year the District is required to adopt an Annual Budget which is prepared, reviewed and presented to the Board of Commissioners. Facilities and other fixed assets are inventoried and assessed regularly to protect major capital assets. Balanced Budget Park District policy requires the District to adopt a balanced Operating Budget. Under normal conditions, operating expenditures are less than real estate taxes (excluding Debt Service) and fees for services. Any surplus from operations (General and Recreation Funds) is used to fund capital improvement needs. A deficit total budget would result only from discretionary spending approved by the Board for capital improvements. Larger capital initiatives are presented to the community in the form of separate public input meetings and include information on project funding. Long-Range Planning The District completed a Comprehensive Master Plan (CMP) Update adopted by the Board of Commissioners on March 30, 2022. The 2021 CMP Update considers current and future needs for programs, parks, land assets, amenities and facilities based on data analysis including trends, demographics, community preferences and feasibility. The 2021 CMP Update provides staff with a set of objectives, strategies and action steps to address the current and future demands of the community. On February 18, 2023 the Board and staff completed an Envision & Prioritize Workshop. The purpose of the Workshop was to allow staff to provide information to Commissioners to assist with future decision making, helping staff understand and integrate Board priorities into planning and prioritizing projects through meaningful discussion. As a desired outcome, staff received Board direction and improved understanding on how to proceed with projects for the final three years of the 2021 CMP Update, from 2024 through 2026. 10
Budget Overview Guidelines and Processes Asset Inventory The District regularly updates and maintains its records of personal and real property owned. Major capital assets, including recreation facilities, support facilities, open recreation venues and vehicle fleet, are reviewed annually for repair proposals. Older facilities are reviewed to develop long-term plans for renovation. Master Plans for major park sites are conducted upon acquisition and as necessary to ensure space and amenities continue to meet the needs of the residents. Diversity of Revenue The District is funded through real estate taxes and fees for services. The District has little or no control over the diversity of the tax base, except to participate in tax incentives from the Village or County to attract or retain business. Taxes are assessed twice per year – in the late winter and early fall. The Park District subscribes to a policy of varied fees for services. Fees for Services The Park District charges fees for recreation activities. Non-residents may be charged a higher rate for participation. Program and activity fees are reviewed and adjusted as necessary to meet changing operating costs and/or market conditions. Staff may set fees higher than operating costs if there are additional indirect costs, such as operating maintenance, administrative overhead and use of capital assets. Fees for programs that do not cover all costs are reviewed regularly by staff. Infrequent Revenue The Park District occasionally receives revenue that cannot be relied upon for ongoing funding. Examples are grants, sponsorships, contributions to capital projects and development impact fees. The District explores grant opportunities each year in order to help defray costs of eligible capital projects. If grants or contributions are designated for a specific project, they are held for that project in the fund balance. Development impact fees are used to acquire property or upgrade nearby parks to provide services for new residents. Debt Issuance The real estate tax base supports facility improvements while program fees support recreation activities. Therefore, the costs associated with acquiring and improving long-term fixed assets are normally funded with the issuance of debt and/or surplus from operations. The District reviews its existing obligation structure and future liability levels prior to the consideration of any new debt issuance. Fund Balance The District intends to maintain a prudent level of financial resources, when possible, to protect against revenue shortfalls or unpredicted expenses. The District has a fund balance target equal to half a year's expenditure level for the General Fund. In addition, the policy specifies the maximum accumulation within the Debt Service Fund should not exceed the amount of the next principal and interest payment due. Expenditure Accountability The District regularly compares financial results to the budget. During each quarter of the fiscal year, revenue and expenses are reported and discussed with the Board. Program information, year-to-date revenues and expenses and projected year-end results are provided by staff in advance, with explanations of variances and actions that are being taken or will be taken to bring the budget back into balance if necessary. A detailed investment policy emphasizes safety of principal, authorized investments and collateralization of deposits. A Board policy that promotes inclusion of community businesses in purchasing opportunities is also in place. 11
Budget Overview Debt Position Overview Each year, the District invests its capital resources in projects that will help maintain and/or improve our existing infrastructure. The Board of Commissioners adheres to a policy that facility improvements will be provided from the real estate tax base and program fees will support costs of operating the recreation activities. Therefore, costs associated with acquiring and improving long-term fixed assets are met with the issuance of debt and surplus from operations. The Park District reviews its existing obligation structure, current and projected surplus from operations, and future liability levels before making decisions to issue new debt. The Board reviews the statutory debt limit as part of any referendum considerations. Allocated real estate taxes received and debt retirements pass through the Debt Service Fund. General Obligation Bond Indebtedness The table below summarizes the total debt service requirements by year for the District. Fiscal Year 2024 2025 2026 2027 2028 2029 2030 2031 2032 2033 2034 2035 Total
Principal 0.00 0.00 0.00 0.00 0.00 820,000.00 1,105,000.00 1,145,000.00 1,195,000.00 1,245,000.00 1,300,000.00 725,000.00 7,535,000.00
2019 Series
Interest 295,962.50 295,962.50 295,962.50 295,962.50 295,962.50 295,962.50 263,162.50 218,962.50 173,162.50 125,362.50 75,562.50 23,562.50 2,655,550.00
2020 Series
Principal
2022 Series
965,000.00 995,000.00 270,000.00
Interest 66,900.00 66,900.00 66,900.00 66,900.00 37,950.00 8,100.00
Principal 1,940,000.00 965,000.00 1,005,000.00
Interest 156,400.00 78,800.00 40,200.00
2,230,000.00
313,650.00
3,910,000.00
275,400.00
Debt Service 2,459,262.50 1,406,662.50 1,408,062.50 1,327,862.50 1,328,912.50 1,394,062.50 1,368,162.50 1,363,962.50 1,368,162.50 1,370,362.50 1,375,562.50 748,562.50 16,919,600.00
The District currently has three outstanding bond series. The 2019 series totaled $9.4 million, while the 2020 series totaled $5.9 million, and the 2022 series totaled $7.5 million. The proceeds from the 2022 issue were used to partially fund capital projects in the budget for 2023. Funds from the 2019 and 2020 bond issues were used to construct the Techny Prairie Activity Center. The 2019 and 2020 bonds are fixed rate. Debt amortization for the 2019 issue is slow with only 20% of the principal scheduled to be repaid within 10 years. The structure of the 2020 bond issue has a shorter duration and provided flexibility for the District to fund additional projects beginning in 2022. The District’s General Obligation Limited Tax bonds are secured by the District’s pledge of any legally available funds. Commonly used indices for debt measurement are listed below: percent of legal debt limit, outstanding bonded debt per capita, and general obligation debt as a percent of the Equalized Assessed Value. Fiscal Year 2018 2019 2020 2021 2022 2023
$ $ $ $ $ $
G.O. Debt $ 7,535,000 $ 11,615,000 $ 9,765,000 $ 15,490,000 $ 13,675,000 $
Debt Margin¹ 134,129,240 $ 123,860,572 $ 138,433,721 $ 139,376,813 $ 123,217,548 $ 146,539,017 $
Debt Per Capita 227.16 350.17 277.24 439.78 388.25
¹See debt limit calculation below Debt per Capita: According to 2020 census, the population of Northbrook is approximately 34,058.
12
% of Equalized Value 0.00% 0.29% 0.39% 0.33% 0.56% 0.43%
Budget Overview Debt Position Debt Limit The Park District's statutory debt limit is 5% of the Equalized Assessed Valuation (EAV) of all taxable property located within the boundaries of the District. Not all bonds are included in the debt limit calculation. Bonds are not considered in the calculation unless taxes levied to pay for such obligations are extended. Outstanding General Obligation Bonds at the end of fiscal 2023 totaled $13.7 million which is included in the debt margin calculation below.
Valuation - 2022 Debt Limit % Legal Debt Limit
Non-Referendum $3,204,280,347 0.575% $18,424,612
Total Debt Limit $3,204,280,347 5% $160,214,017
13,675,000 $4,749,612
13,675,000 $146,539,017
Less: Existing Non-Referendum Debt Series 2019 7,535,000 Series 2020 2,230,000 Series 2022 3,910,000 Legal Debt Margin
Based on the debt limit calculation above, as of December 31, 2023, the District’s overall debt limit is $146.5 million, while the amount of non-referendum debt is limited to $4,749,612. The District’s financial position continues to remain healthy today as evidenced by its strong bond rating and the various debt measurements listed above.
13
Budget Overview Tax Levy & Rates The chart in Appendix B provides a 10-year history of the District’s Equalized Assessed Valuation (EAV), Tax Levy and tax rates. Rate information for the 2023 tax year is estimated, as final tax rates are not yet available from Cook County. The District’s property tax collection rate has averaged just over 96% over the past 10 years (source – December 31, 2022 Annual Comprehensive Financial Report {ACFR}). The 2023 Tax Levy Ordinance, which details the property tax request by fund, is scheduled to be presented for approval by the Board of Commissioners at the Regular Board Meeting on December 13, 2023. Levy amounts for each tax rate are extended against the Equalized Assessed Valuation to determine the tax liability. The District is subject to two sets of tax limits: rate limits on the maximum rates that can be levied for a particular purpose, and tax caps which limit the total dollar increase in the levy to the lesser of 5% or the Consumer Price Index (CPI) as published by the Illinois Department of Revenue, excluding new construction/annexation. If the levy exceeds the rate limitation, the extension is reduced to the statutory limit. New construction is not subject to the limitations imposed by tax caps. It has been the practice of the District to increase its levy extension slightly above the CPI limits in order to capture any new valuation growth. As the chart below reveals, rates have fluctuated rather dramatically over the 10-year period. The rate dropped in levy year 2016 reflecting the retirement of the District’s referendum debt. The debt retirement reduced the District’s overall levy by approximately $1.6 million.
With the exception of the retirement of referendum debt in 2016, much of the reason for the movement in rates comes from the relationship between the rate of growth or contraction in property values and the annual change in the rate of inflation as measured by CPI. Because the District’s annual aggregate tax extension is capped (excluding Special Recreation & Debt Service extension), if property values contract (or if the growth rate is less than CPI) and CPI is positive for the given tax year, the tax rate for the District likely will increase. The opposite scenario (higher growth rate than the change in CPI) will yield a decrease in tax rates. The District’s tax rate represents approximately 5.6% of a resident’s tax bill and could vary slightly depending on the resident’s school district.
14
Budget Overview Tax Levy & Rates The allocation by taxing body of the 2022 Northbrook tax bill is presented below.
How the District’s rate compares to other park districts nearby is another useful measurement for residents. The chart below compares the District’s final 2022 tax rate to a handful of surrounding park districts.
This comparison reveals rates ranging from as high as 0.744/$100 assessed value at Wheeling Park District, to as low as 0.299/$100 assessed value at Wilmette Park District.
15
2024 Consolidated Budget Overview The District’s consolidated budget is presented in three different formats. The goal is to provide relevant information to the individual reader, since users of budget documents can reflect a broad spectrum of types and interests. Major/Non-Major Funds The table below summarizes the 2024 budget based on the District’s Major and Non-Major funds. This report format is used to present the results in the District’s audited financial statements or Annual Comprehensive Financial Report (ACFR). The funds identified as Major include the General, Recreation and Debt Service funds. In this presentation, the General Fund also includes the activity of the following individual funds: Museum, Paving and Lighting, Social Security, Illinois Municipal Retirement Fund (IMRF), Liability and the Audit fund. The District’s only Non-Major fund is its Special Recreation Fund. It should be noted that the District’s fund structure includes only governmental funds. Major
FY 2024 Revenue Taxes Daily Fees Program Fees Memberships Facility Rentals Retail Sales Investments Other Total
General $
Non-Major
Recreation
Debt Service
Special Rec
Total
8,374,530 $ 325,000 409,247 9,108,777
2,982,300 $ 3,510,139 6,452,390 1,262,019 1,862,136 301,700 242,226 16,612,910
2,459,263 $ 2,459,263
400,000 $ 14,216,093 3,510,139 6,452,390 1,262,019 1,862,136 301,700 325,000 651,473 400,000 28,580,950
Expenditures Salaries & Wages Benefits Contractual Repairs Supplies Debt Service Capital Other Total
3,594,656 1,822,435 2,310,061 90,500 528,909 7,255,400 83,600 15,685,561
7,509,788 920,745 2,813,820 119,550 1,395,150 209,147 12,968,200
1,200 2,459,263 2,460,463
499,801 100,000 599,801
11,104,444 2,743,180 5,624,882 210,050 1,924,059 2,459,263 7,355,400 292,747 31,714,025
Excess Revenue Bond Issue Operating Transfer Total Net Surplus (Deficit)
(6,576,784) 3,644,710 3,644,710 (2,932,074)
3,644,710 (3,644,710) (3,644,710) -
(1,200) (1,200)
(199,801) (199,801)
(3,133,075) (3,133,075)
16
2024 Consolidated Budget Individual Funds The consolidated budget is also presented for each individual fund. While the General Fund in the preceding table combined its results with other funds (i.e., Museum, Paving, Social Security, IMRF, Liability and Audit), the next table deconstructs those results and presents the 2024 budget for all individual funds, as well as its estimated beginning and ending fund balances. Note: The 2024 budgeted surplus/(deficit) generated from the Recreation and Capital funds will be transferred to the General Fund at the close of the fiscal year. The District’s unrestricted reserves are an important funding source for capital improvements. Unrestricted reserves (General/Recreation/Capital) are projected to be approximately $20.9 million at the end of 2024 as highlighted below. Funds General Recreation Capital Projects Museum Special Recreation Paving & Lighting Social Security IMRF Liability Audit Debt Service Total
Balance 1/1/2024 23,544,430 44,750 639,321 239,809 14,514 301,588 361,530 7,788 6,014 25,159,744
Revenue 7,532,777 16,612,910 200,000 400,000 150,000 850,000 150,000 200,000 26,000 2,459,263 28,580,950
Expenditures 7,015,457 12,968,200 7,055,400 599,801 200,000 848,929 216,315 323,660 25,800 2,460,463 31,714,025
Surplus/(Deficit) 517,320 3,644,710 (6,855,400) (199,801) (50,000) 1,071 (66,315) (123,660) 200 (1,200) (3,133,075)
Balance 12/31/2024 24,061,750 3,644,710 (6,855,400) 44,750 439,520 189,809 15,585 235,273 237,870 7,988 4,814 22,026,669
The District issued bonds in the first quarter of 2022 and the available Bond proceeds will be used to support a portion of the District’s 2023 capital improvements. Refer to Appendix D for additional financial information detailed by Fund. Divisional Funds Finally, the consolidated budget also is presented by function or Division of the District. Detailed analyses of the individual Divisional budgets and prior year results are included in the next section of this document.
Division Administration Recreation Parks & Properties Golf Operations Total
$
Revenue 14,648,041 $ 9,285,443 302,299 4,345,167 28,580,950
Expenses Surplus/(Deficit) 6,896,124 $ 7,751,917 12,474,268 (3,188,825) 7,991,498 (7,689,199) 4,352,135 (6,968) 31,714,025 (3,133,075)
Refer to the Divisional Budget Analysis on pages 21-51 for additional information.
17
2024 Consolidated Budget Consolidated Revenue
Revenue $ Taxes Daily Fees Program Fees Memberships Rentals Retail Sales Other Total Revenue
% 2024 Budget 14,216,093 49.7% $ 3,510,139 12.3% 6,452,390 22.6% 1,262,019 4.4% 1,862,136 6.5% 301,700 1.1% 976,473 3.4% 28,580,950 100.0%
2023 Budget % 13,699,579 53.4% $ 3,023,804 11.8% 5,170,300 20.2% 1,054,061 4.1% 1,762,235 6.9% 270,650 1.1% 676,709 2.6% 25,657,338 100.0%
2024 v 2023 516,514 $ 486,335 1,282,090 207,958 99,901 31,050 299,764 2,923,612
2022 Final 13,222,091 $ 2,735,990 4,482,908 1,052,247 1,674,566 260,125 1,663,517 25,091,443
2024 v 2022 994,002 774,149 1,969,482 209,772 187,570 41,575 (687,044) 3,489,507
Note: For comparison purposes, $7.5 million in bond proceeds for FY 2022 budget have been excluded from above chart.
Total revenue is expected to increase $2.9 million to $25.7 million in 2024 compared to the 2023 budget. Golf is expected to generate approximately $4.3 million in total revenue, up about 15% compared to prior year budget. In addition, Recreation revenue is expected to grow to $1.6 million, up about 20% compared to prior year budget mostly due to expected increases in program fees. Taxes total $13.7 million and are expected to be up $681,630 compared to the 2023 budget. In addition to property taxes, the District is expected to receive $492,000 in replacement taxes, down $165,116 from 2023. These estimates are provided each year by the Illinois Department of Revenue. Next to taxes, program fees provide the second largest source of revenue to the District with expected revenue of $6.5 million for 2024. Program fees Revenue is up $1.3 million compared to the 2023 budget, with the largest increases expected in Adventure Campus (Before/After-School program), Summer Camps and Adult Athletics. Daily fees are also expected to improve with strong revenue increases expected for Golf Operations. Total District daily fees are expected to be $3.5 million, up about $486,335 or 16% compared to 2023 budget. Golf represents the majority of this increase with daily fees up about $311,450 compared to prior budget. Daily fees budget revenue is also expected to increase for Recreation, up $174,885 in 2024 compared to 2023 budget.
18
2024 Consolidated Budget Consolidated Expenditures
Expenses Salaries $ Benefits Contractual R&M Supplies Debt Service Miscellaneous Operating Epenses Capital Projects Total Expenses
2024 Budget % 11,104,444 35.0% $ 2,743,180 8.6% 5,624,882 17.7% 210,050 0.7% 1,924,059 6.1% 2,459,263 7.8% 292,747 0.9% 24,358,625 76.8% 7,355,400 23.2% 31,714,025 100.0%
2023 Budget % 9,731,131 34.4% $ 2,360,545 8.3% 5,169,758 18.3% 210,600 0.7% 1,728,709 6.1% 2,406,864 8.5% 210,282 0.7% 21,817,889 77.1% 6,496,506 22.9% 28,314,395 100.0%
2024 v 2023 1,373,313 $ 382,635 455,124 (550) 195,350 52,399 82,465 2,540,736 858,894 3,399,630
2022 Final 7,805,512 $ 2,149,515 4,284,061 179,322 1,568,180 2,299,774 112,980 18,399,345 3,051,500 21,450,845
2024 v 2022 3,298,932 593,665 1,340,821 30,728 355,879 159,489 179,767 5,959,280 4,303,901 10,263,180
The 2024 consolidated budget captures all budgeted expenditures of the District, including capital projects. The District allocated approximately $7.4 million or 23% of total expenditures to fund capital projects in 2024. The capital budget includes funding for Meadowhill Aquatic Center and Williamsburg Square Park renovations. For additional project detail, refer to the District’s 2024 Capital Improvement Plan located in Appendix A. Employee wages are projected to increase $1.4 million compared to the 2023 budget reflecting merit based wage increases and salary market survey result adjustments. Overall headcount has also increased with the addition of two fulltime staff in Recreation, one in Administration and one in Golf. Benefits increased by $382,635 compared to prior year budget as a result of staffing changes and an increase in the employer rate from 2.05% to 2.69% in 2024. Contractual services and supplies are expected to increase $455,124 and $195,350, respectively reflecting the increase in program offerings and inflationary increases. Capital expenditures are budgeted to increase $858,894 to $7.4 million in 2024.
19
2024 Consolidated Budget A
2024 Budget 2023 Estimate
2023 Budget
2022 Final
2021 Final
2020 Final
A-C Budget Comparison
$13,724,093
$13,042,463
$13,042,463
$12,475,832
$12,627,697
$11,802,070
$681,630
5.2%
$681,630
5.2%
Replacement Tax
492,000
750,000
657,116
746,259
368,831
210,098
(165,116)
-25.1%
(258,000)
-34.4%
Investment Income
325,000
925,000
100,000
109,220
66,377
448,144
225,000
225.0%
(600,000)
-64.9%
Daily Fees
3,510,139
3,332,307
3,023,804
2,735,990
1,259,268
522,719
486,335
16.1%
177,832
5.3%
Program Fees
6,452,390
5,597,721
5,170,300
4,482,908
2,571,582
2,426,688
1,282,090
24.8%
854,669
15.3%
Membership Fees
1,262,019
1,190,856
1,054,061
1,052,247
662,993
57,850
207,958
19.7%
71,163
6.0%
Rental Income
1,862,136
1,837,266
1,762,235
1,674,566
1,013,398
721,993
99,901
5.7%
24,870
1.4%
Retail Sales
301,700
327,291
270,650
260,125
114,121
89,939
31,050
11.5%
(25,591)
-7.8%
Miscellaneous Income
651,473
899,849
576,709
1,554,298
1,154,813
2,522,484
74,764
13.0%
(248,376)
-27.6%
Operating Revenue
28,580,950
27,902,753
25,657,338
25,091,443
19,839,079
18,801,986
2,923,612
11.4%
678,197
2.4%
Salaries & Wages
11,104,444
9,612,664
9,731,131
7,805,512
6,408,116
5,609,541
1,373,313
14.1%
1,491,780
15.5%
Employee Benefits
2,743,180
2,216,908
2,360,545
2,149,515
2,070,240
2,019,523
382,635
16.2%
526,272
23.7%
Contractual Services
5,624,882
4,904,004
5,169,758
4,284,061
3,627,051
3,249,129
455,124
8.8%
720,878
14.7%
Repair & Maintenance
210,050
175,419
210,600
179,322
138,902
109,540
(550)
-0.3%
34,631
19.7%
1,924,059
1,812,101
1,728,709
1,568,180
1,073,871
802,555
195,350
11.3%
111,958
6.2%
Miscellaneous
295,694
201,069
211,737
112,980
79,473
94,073
83,957
39.7%
94,625
47.1%
Transfers
(2,947)
560
(1,455)
0
0
0
Debt Service
2,459,263
2,406,864
2,406,864
2,299,774
2,268,363
Operating Expense
24,358,625
21,329,589
21,817,889
18,399,345
Operating Surplus/(Deficit)
4,222,325
6,573,164
3,839,449
Bond Proceeds
0
0
Capital Projects
(7,355,400)
Other Net Surplus/(Deficit)
Property Tax
Supplies
B
C
D
E
F
%
A-B Budget vs Estimate
%
(1,492) 102.5%
(3,507) -626.3%
2,215,317
52,399
2.2%
52,399
2.2%
15,666,016
14,099,678
2,540,736
11.6%
3,029,036
14.2%
6,692,098
4,173,064
4,702,309
382,876
10%
(2,350,839)
-35.8%
0
7,889,400
0
6,249,337
0
0.0%
0
0.0%
(5,466,384)
(6,496,506)
(3,051,500)
(10,044,116)
(20,254,524)
(858,894)
13.2%
(1,889,016)
34.6%
(7,355,400)
(5,466,384)
(6,496,506)
4,837,901
(10,044,116)
(14,005,187)
(858,894)
13.2%
(1,889,016)
34.6%
(3,133,075)
1,106,780
(2,657,057)
11,529,999
(5,871,052)
(9,302,879)
(476,018)
17.9%
(4,239,855) -383.1%
20
Divisional Budget Analysis Administrative Divisions Overview The Administrative Divisions budget includes Administration, Human Resources and Risk Management, Marketing and Communications and Finance and Technology. Administration establishes and maintains a system of strong financial controls, manages and maintains the District’s technology infrastructure, administers Human Resources policies and procedures, and provides multifaceted marketing and communication material for the Northbrook Park District, while providing administrative and operational support to other Park District areas. General Responsibilities The Administrative Divisions are responsible for the management of the District's financial, human resources and risk management, information systems and marketing and communications activities. The budget includes property tax receipts, grants, development impact fees and investment income. The expenditures include administrative operating and support expenses, the capital repair and improvement program (excluding Golf Operations) and expenses associated with special revenue funds. Funding is derived from the General and Recreation Funds. In addition to the General Fund, Administration manages the performance of the special revenue funds, including Recreation, Debt, Social Security, Employee Retirement (IMRF), Liability Insurance, Special Recreation, Paving and Lighting, Audit and Museum Funds.
Administration Division Overview Administration develops, recommends and implements long-range financial plans. The Division acts as primary liaison with the elected Board of Commissioners in setting financial priorities. The Division is responsible for adhering to the Open Meetings Act and Freedom of Information Act requirements. Administration prepares, maintains and files official Park District records, ordinances and resolutions in accordance with applicable statutes.
Finance and Technology Division Overview The Finance and Technology Division is responsible for the management of all areas of the District’s financials. The financial areas of responsibility include financial reporting, analysis, forecasting and budgeting, debt management, payroll, accounts payable, audit programs, compliance requirements and cash management. The Division is also responsible for maintaining all areas of the District’s technology infrastructure. The Technology team areas of responsibility include system and network configurations, employee training and support, hardware and software procurement, database management, cyber security monitoring, server management, hardware maintenance and miscellaneous technology projects. Finance Finance is responsible for accounting processes, including financial reporting to both internal and external parties. Budget Preparation The Division manages the annual operating budget process and works in conjunction with the Parks and Properties Division in preparing the District’s Capital Improvement Plan. Staff tracks all capital project grants and spending from planning stage through project completion. Audit Program Staff implements a program of periodic internal reviews, including petty cash and cash registers counts, payroll and inventory reviews and preparation of preliminary audit schedules for the independent public accounting firm. 21
Divisional Budget Analysis Administrative Divisions Debt Management In conjunction with municipal advisors, staff assists the District with the sale of debt obligations and is responsible for meeting continuing disclosure requirements as defined by the Securities and Exchange Commission (SEC) Rule 15c2-12. Cash Management Staff implements effective control of receipts and disbursements, reviews and monitors debt management procedures, protects cash and assets through sound internal control and invests surplus funds to earn a market rate of return and ensure the preservation of capital. Records Management Finance staff controls the District's records in compliance with the Local Government Records Act. Information Technology Systems The Department manages and maintains all voice, security and network infrastructure, as well as several end-user technologies. The Department coordinates all software and hardware purchases and implementation, as well as maintenance of a secure computer environment with reliable, usable data. The Department also performs in-house analytics and computer training on the District's computer applications.
Human Resources and Risk Management Division Overview The Human Resources and Risk Management Division provides a variety of services to the District in the areas of total employee compensation, employee benefits, risk management programs and training, performance management, personnel policies and procedures, recruitment and retention, maintaining employee files and union labor relations while ensuring the District is in compliance with Federal, State of Illinois and local employment and labor laws and regulations. Total Employee Compensation Administration The Division evaluates total compensation for all exempt and non-exempt personnel, research, develops, and implements wage and salary policies; and researches and implements part-time wage schedules. The staff reviews bi-weekly payroll reports and monitors documented time for compliance with the Fair Labor Standards Act and other satisfactory internal controls. Employee Benefits The Division implements and communicates benefit programs and policies including health and life insurance, workers' compensation, retirement plans, employee assistance, employee recognition, unemployment insurance, holiday, vacation and sick time, as well as employee recreation benefits. Insurance Program The District is a member of the Park District Risk Management Agency (PDRMA) Property/Casualty Program, a joint risk management pool comprised of park and forest preserve districts and special recreation associations. PDRMA provides coverage for property, liability, employment practice liability and workers compensation. Risk Management Risk Management staff coordinates the District’s loss reduction program in coordination with the Park District Risk Management Agency (PDRMA). This includes employee on-the-job safety through education, training, physical 22
Divisional Budget Analysis Administrative Divisions assessment and accident prevention along with the development of physical assessment and accident prevention policies and procedures for Park District patrons and programs. Performance Management The Division works with managers and supervisors to ensure all employees receive an annual performance evaluation and the tools they need to be successful in performing their job duties. Personnel Policies and Procedures Administration The Division is responsible for developing and communicating personnel policies and procedures to all Park District staff while ensuring compliance with Federal, State of Illinois and local employment and labor laws. Recruitment and Retention The Division works with managers and supervisors to determine hiring needs, post new job openings and assist with job interviews and employee onboarding. Maintaining Employee Files The Division maintains personnel files for each employee utilizing the District’s HRIS software system. Union Labor Relations The Division works with the collective bargaining unit to ensure the union contract rules and policies are incorporated to maintain a safe and equitable workplace for the employees.
Marketing and Communications Division Overview The Marketing and Communications Division provides a wide variety of support services to the entire District including marketing and branding, communications, public relations, graphic design and publications, photography and videography, website management, sponsorships and partnerships. Marketing and Branding The Marketing and Communications Division oversees the marketing and branding for District-wide and Division-specific projects. The Division is also responsible for the creation of overall brand strategy and standards for both visual and written collateral. Communications Communications outreach includes the oversight of sixteen social media pages with a combined following of over 12,000 users, a Park District email database of 15,000 subscribers and a GolfNow list of 15,000, crisis communications, on-hold messaging, responses to public inquiries and implementation of the District’s Communications Plan. Staff also provide writing, content marketing and copy-editing services District-wide. Public Relations Work in this area includes writing and disseminating press releases, creating media connections, networking with area businesses and organizations, providing community outreach, conducting surveys, assisting with grant application narratives and writing and submitting award portfolio applications. Staff members also attend special events (both District and other community events), often staffing a marketing and information table to promote District offerings. A new District-wide Public Relations Strategy project is proposed for 2024. 23
Divisional Budget Analysis Administrative Divisions Graphic Design and Publications The Division provides graphic design services for flyers, posters, banners, signage, postcards, social media, digital assets, advertisements and website use. Major print publications include three seasonal program guides mailed to 16,923 homes, a Spring Into Summer supplemental mailer and Momentum, the quarterly senior newsletter. Photography and Videography Staff members attend events to capture photographs and video for historical and promotional purposes. Photos and video footage are shared via the website, social media channels and graphic design projects and are maintained in a comprehensive media library. Website Content Management and Maintenance Marketing and Communications staff oversee and maintain content for the District’s three websites: nbparks.org, nbfitness.org and heritageoaksgc.com. In addition, as part of our cooperative 4th of July events with the Village of Northbrook, staff also manage the northbrook4thofjuly.com site. Sponsorships and Partnerships The Division provides develops sponsorship opportunities to support events and facilities through monetary payments and in-kind donations from area businesses. Advertising is also sold for print, digital and large format marketing opportunities in facilities and parks.
24
Divisional Budget Analysis Administrative Divisions A
2024 Budget 2023 Estimate
2023 Budget
2022 Final
2021 Final
2020 Final
A-C Budget Comparison
$13,724,093
$13,042,463
$13,042,463
$12,475,832
$12,627,697
$11,802,070
$681,630
5.2%
$681,630
5.2%
Replacement Tax
492,000
750,000
657,116
746,259
368,831
210,098
(165,116)
-25.1%
(258,000)
-34.4%
Investment Income
325,000
925,000
100,000
109,220
66,377
448,144
225,000
225.0%
(600,000)
-64.9%
Daily Fees
0
0
0
0
0
0
0
0.0%
0
0.0%
Program Fees
0
0
0
0
0
0
0
0.0%
0
0.0%
Membership Fees
0
0
0
0
0
0
0
0.0%
0
0.0%
Rental Income
0
0
0
0
0
0
0
0.0%
0
0.0%
Retail Sales
0
0
0
0
0
0
0
0.0%
0
0.0%
Miscellaneous Income
106,948
66,279
104,797
504,232
417,713
1,729,775
$2,151
2.1%
40,669
61.4%
Operating Revenue
14,648,041
14,783,742
13,904,376
13,835,542
13,480,616
14,190,087
743,665
5.3%
(135,701)
-0.9%
Salaries & Wages
1,758,965
1,434,971
1,678,516
1,348,328
1,235,601
1,080,149
80,449
4.8%
323,994
22.6%
Employee Benefits
517,544
319,013
447,953
431,696
457,511
454,204
69,591
15.5%
198,531
62.2%
Contractual Services
1,671,694
1,337,157
1,473,272
1,298,803
1,404,509
1,191,907
198,422
13.5%
334,537
25.0%
0
500
500
0
0
0
Supplies
146,443
115,632
118,470
138,467
51,435
36,935
27,973
23.6%
30,811
26.6%
Miscellaneous
92,215
67,459
72,164
34,988
38,318
53,888
20,051
27.8%
24,756
36.7%
0
0
0
0
0
0
0
0.0%
0
0.0%
Debt Service
2,459,263
2,406,864
2,406,864
2,299,774
2,268,363
2,215,317
52,399
2.2%
52,399
2.2%
Operating Expense
6,646,124
5,681,596
6,197,739
5,552,055
5,455,737
5,032,399
448,385
7.2%
964,528
17.0%
Operating Surplus/(Deficit)
8,001,917
9,102,146
7,706,637
8,283,487
8,024,879
9,157,688
295,280
4%
(1,100,229)
-12.1%
Bond Proceeds
0
0
0
7,889,400
0
6,249,337
0
0.0%
0
0.0%
Capital Projects
(250,000)
(213,586)
(340,000)
(124,165)
(124,713)
(588,490)
90,000
-26.5%
(36,414)
17.0%
Other
(250,000)
(213,586)
(340,000)
7,765,235
(124,713)
5,660,847
90,000
-26.5%
(36,414)
17.0%
Net Surplus/(Deficit)
7,751,917
8,888,560
7,366,637
16,048,722
7,900,166
14,818,535
385,280
5.2%
(1,136,643)
-12.8%
Property Tax
Repair & Maintenance
Transfers
B
C
D
E
25
F
%
A-B Budget vs Estimate
%
(500) -100.0%
(500) -100.0%
Divisional Budget Analysis Administrative Divisions Budget Highlights Revenue Total revenue is expected to increase compared to prior year budget by five percent or $743,665 to $14.6 million. Property taxes for the Division are expected to increase $681,630 or 5.2% to $13.7 million. Additionally, replacement taxes are expected to decrease $165,116 to $492,000 compared to the prior year budget based on estimates provided by the Illinois Department of Revenue. Investment income is expected to increase $225,000 to $325,000 in 2024 compared to the 2023 budget reflecting an increase in available cash to invest and a modest uptick in overall interest rates. Finally, miscellaneous revenue is budgeted closely in line with prior year budget primarily due to reclassifying sponsorship revenue out of Administration and into the specific Divisional area. Included in miscellaneous revenue is cell tower income ($30,000), employee health insurance contributions ($44,948), and advertising revenue ($20,000). Salary and Wages Employee wages total $1.8 million in 2024 and are expected to increase 4.8% or $80,449 compared to the 2023 budget and increase $323,994 compared to the year-end estimate. It is important to note, the majority of the Administrative wage increase is driven by staffing changes. The District currently has two vacant positions in Human Resources and expects to fill these roles in 2024. The 2024 budget includes a 5.0% merit increase for all Full-time Non-Bargaining Unit positions. Employee Benefits Benefits within the Administrative Divisions include employee healthcare, unemployment claims, the employer share of social security and pension benefits. The employer rate for IMRF costs increased on January 1, 2024 to 2.69% compared to 2.05% in the 2023 calendar year. Employer pension costs are derived from many factors, including employee salaries, length of service, and investment returns on plan assets. Benefits are expected to be higher by $69,591 to $517,544 compared to the 2023 budget. The higher budget number is mostly due to one additional full-time employee and to updated health insurance estimates based on employee elections at the time of open enrollment. Contractual Services Contractual Services are expected to increase $197,822 or 13.4% to $1.7 million in 2024 compared to the previous year budget. The majority of the increase relates to a higher legal and professional services budget expected in 2024 compared to 2023 budget. Legal Services are expected to be $141,000 in 2024, up $99,000 compared to prior year budget as additional services are projected. Marketing professional services budget is expected to increase by $47,000 due to Comprehensive Master Plan Goal related spend for Public Relations Strategy Plans and District Website enhancements. Computer and Data services total $413,074 and are expected to increase $6,552 compared to the 2023 budget and include annual maintenance, licensing and subscription services to manage the District’s infrastructure and applications in a secured environment. The District continues to make investments in Cyber Security following best industry practices. Software or other costs specific to an individual Division have been allocated to that Division.
26
Divisional Budget Analysis Administrative Divisions Property casualty liability premiums are budgeted at $323,660, up by about $59,487 compared to the $264,000 prior year budget total. Supplies Supply costs are expected to increase by 23.6% percent in 2024 compared to the prior year budget, increasing $27,973 to $146,443. Supply costs include costs to support: • Continued outreach at events by the Marketing & Communications Division • Equipment, office and technology supplies • Safety supplies and CPR Manikins Miscellaneous This category includes Divisional training and expenses associated with the Employee Appreciation and Customer Service teams. Training and education costs total $72,215 and include employee training initiatives and also attendance at educational conferences such as NRPA, IPRA and SHRM (Society for Human Resource Management). Debt Debt expenses reflect the annual principal and interest obligations associated with the District’s outstanding bond issues. Bond principal and interest payments in 2024 total $1.9 million and $452,362, respectively. Bond Proceeds The District does not intend to issue bonds in 2024. Capital Projects Capital projects within the Administration budget reflect technology projects as identified within the CIP. The CIP was reviewed by the Board of Commissioners at the Committee-of-the-Whole Meeting on November 15, 2023.
27
Divisional Budget Analysis Division of Parks and Properties Overview The mission of the Parks and Properties Division is to provide safe, well-maintained recreation areas to meet the needs of Northbrook Park District residents and to provide support to the other District Divisions. Responsibility Areas of responsibility include repair and maintenance of all properties owned or leased by the District. In addition, the Division manages planning and execution of capital projects and related grants. The Division of Parks and Properties is funded from the General Fund and manages the following Departments: Grounds Maintenance Grounds Maintenance includes general maintenance and upkeep of all District grounds including turf, trees, shrubs and landscape areas as well as turf maintenance of various elementary and junior high school sites and various Village properties. Athletic Field Maintenance includes athletic field preparation, renovation and repairs of baseball, softball, soccer and football fields and the maintenance at the Velodrome and skate park. Golf Maintenance The Golf Maintenance team cares for 36 holes of golf spanning 250 acres including the surrounding grounds and natural areas. Trades and Facility Maintenance Trades and Facility Maintenance repairs and monitors operations of buildings and facilities in the areas of electrical, heating, air conditioning, plumbing, custodial and minor building improvements. In addition, the Trades team maintains playgrounds and hard courts and assists with capital project construction. Trades and Facility Maintenance also coordinates the security systems of the District including door locks, keyless entry, alarm systems and camera systems. Fleet and Equipment Maintenance Fleet and Equipment Maintenance includes major and minor repairs and the selection and replacement of District vehicles, equipment and other mechanical inventory along with maintenance of the District’s golf car fleet of over 90 units. Recreation Services and Custodial Maintenance Staff in this department maintain the District’s recreation facilities, support special events and maintain the ice sheets at Northbrook Sports Center. Planning and Project Management Planning and Project Management staff provide technical and managerial work involving master design/planning, property annexation, capital project oversite and working in conjunction with the Finance Division in developing and managing the District’s five year Capital Improvement Plan (CIP). Specialty Maintenance Specialty maintenance includes exotic pest/vegetation control, prairie maintenance, snow removal, outdoor ice rinks and special event support.
28
Divisional Budget Analysis Division of Parks and Properties A
B
C
D
2024 Budget 2023 Estimate 2023 Budget
E
F
2022 Final
2021 Final
2020 Final
A-C Budget Comparison
%
A-B Budget vs Estimate
%
Property Tax
$0
$0
$0
$0
$0
$0
$0
0.0%
$0
0.0%
Replacement Tax
0
0
0
0
0
0
0
0.0%
0
0.0%
Investment Income
0
0
0
0
0
0
0
0.0%
0
0.0%
Daily Fees
0
0
0
0
0
0
0
0.0%
0
0.0%
Program Fees
0
0
0
0
0
0
0
0.0%
0
0.0%
Membership Fees
0
0
0
0
0
0
0
0.0%
0
0.0%
Rental Income
0
0
0
0
0
0
0
0.0%
0
0.0%
Retail Sales
0
0
0
0
0
0
0
0.0%
0
0.0%
Miscellaneous Income
302,299
605,715
270,316
852,795
68,647
67,683
31,983
11.8%
(303,416)
-50.1%
Operating Revenue
302,299
605,715
270,316
852,795
68,647
67,683
31,983
11.8%
(303,416)
-50.1%
Salaries & Wages
1,835,691
1,675,000
1,683,721
1,319,841
1,259,817
1,290,563
151,970
9.0%
160,691
9.6%
Employee Benefits
599,981
556,691
490,931
418,374
449,555
467,849
109,050
22.2%
43,290
7.8%
Contractual Services
932,226
838,083
971,339
661,638
544,171
446,137
(39,113)
-4.0%
94,143
11.2%
Repair & Maintenance
90,500
72,000
97,500
76,836
45,911
56,076
(7,000)
-7.2%
18,500
25.7%
Supplies
382,466
370,402
360,271
270,081
231,297
259,372
22,195
6.2%
12,064
3.3%
Miscellaneous
30,645
27,469
29,434
9,626
2,698
7,752
1,211
4.1%
3,176
11.6%
Transfers
(39,260)
(33,154)
(42,270)
(20,140)
(29,293)
(17,557)
3,010
-7.1%
(6,106)
18.4%
0
0
0
0
0
0
0
0.0%
0
0.0%
Operating Expense
3,832,249
3,506,491
3,590,926
2,736,255
2,504,155
2,510,192
241,323
6.7%
325,758
9.3%
Operating Surplus/(Deficit)
(3,529,950)
(2,900,776)
(3,063,973)
(1,883,460)
(2,435,509)
(2,442,510)
(209,340)
7%
(629,174)
21.7%
Bond Proceeds
0
0
0
0
0
0
0
0.0%
0
0.0%
Capital Projects
(4,159,249)
(3,645,055)
(4,147,557)
(2,479,027)
(1,008,578)
(85,917)
(11,692)
0.3%
(514,194)
14.1%
Other
(4,159,249)
(3,645,055)
(4,147,557)
(2,479,027)
(1,008,578)
(85,917)
(11,692)
0.3%
(514,194)
14.1%
Net Surplus/(Deficit)
(7,689,199)
(6,545,831)
(7,468,167)
(4,362,487)
(3,444,087)
(2,528,427)
(221,032)
3.0%
(1,143,368)
17.5%
Debt Service
29
Divisional Budget Analysis Division of Parks and Properties Budget Highlights
The table below presents the individual functions that comprise the 2024 budget for the Parks and Properties Division. Specifically, it details how resources are allocated across the Division. Parks Division Misc Revenue Total Revenue
Admin 5,593 $ 5,593
Planning 6,282 $ 6,282
Grounds 59,771 $ 59,771
Trades 5,593 $ 5,593
Fleet 25,000 $ 25,000
Salaries & Wages Benefits Services R&M Supplies Misc Expenses Transfer to Rec
136,500 48,831 160,419 9,750 7,150 -
195,300 64,002 186,395 3,300 6,775 -
795,716 216,651 485,506 5,500 151,191 3,920 (39,260)
566,481 198,397 46,310 50,500 99,375 12,800 -
Operating Expenses % of Expenses
362,650
455,772
1,619,224
9%
12%
42%
$
Facilities 60 $ 60
Capital 200,000 $ 200,000
Total 302,299 302,299
71,293 43,673 9,700 34,500 101,750 -
70,401 28,427 43,896 17,100 -
-
1,835,691 599,981 932,226 90,500 382,466 30,645 (39,260)
973,863
260,916
159,824
-
25%
7%
4%
Capital Expenses Surplus/(Deficit)
(357,057)
(449,490)
(1,559,453)
(968,270)
(235,916)
(159,764)
3,832,249 0%
100%
(4,159,249)
(4,159,249)
(3,959,249)
(7,689,199)
Revenue Revenue recognized within this budget primarily reflects reimbursement from athletic affiliates for costs incurred for field preparation (labor/material). Other revenue recognized within the Division includes proceeds from the sale of surplus equipment and employee contributions toward health insurance. The budget includes a $200,000 OSLAD Grant for Oaklane Park. Not included in the 2024 capital revenue budget is the second payment ($300,000) of the Williamsburg Square Park OSLAD Grant, and the State of Illinois line item grant ($250,000) managed by the DCEO. The timing of the receipt of these grant reimbursements is unknown and staff is conservatively projecting payment in Q1 of FY 2025. Salary and Wages Employee wages are budgeted to increase 9% or $151,970 to approximately $1.8 million compared to the 2023 budget, and up $160,691 compared to 2023 year-end estimates. The increased wages primarily reflect labor cost increases for Grounds Maintenance and Trades. The 2024 budget includes 24 full-time Bargaining Unit positions. The existing Collective Bargaining Unit Agreement expires on April 30, 2025. Thirteen full-time Bargaining Unit positions are included in the Parks and Properties Division budget. Three of the full-time Bargaining Unit positions are included in the Golf Operations Division budget and eight full-time Bargaining Unit positions are included in the Recreation Division budget. The budget reflects a merit increase of 2.75% effective May 1, 2024 for all Bargaining Unit employees. Employee Benefits Benefits include healthcare premiums for all benefit-eligible positions, unemployment claims, social security and pension expense for the Division. Relative to healthcare, the 2024 budget reflects employee coverage elections at the time of open enrollment. 30
Divisional Budget Analysis Division of Parks and Properties Benefits are budgeted to increase 7.8% or $43,290 to $599,981 compared to the 2023 estimate. The increase in expense primarily stems from staffing changes and updates to employee benefit plan elections. Healthcare costs comprise the largest individual benefit expense for the Division. Overall costs are higher compared to 2023 estimates due to staffing changes and updated employee elections based on new staffing. Pension costs in 2024 total $37,624 and are expected to increase $5,442 compared to the 2023 budget. The IMRF employer rate increased from 2.05% to 2.69% of eligible wages for 2024. Eligible employees contribute 4.5% of their earnings toward pension benefits. However, the employer’s share will vary from year to year depending on many factors including annual investment returns, member demographics and actuarial assumptions. Contractual Services Contractual services total $932,226 and are down in the 2024 budget $39,113 compared to the 2023 budget. The 2023 budget was higher due to one-time expenses to fund the planning process resulting from the Envision and Prioritize Board Workshop and included funding for the Athletic Field and Court Assessment. Contractual expenses include natural area maintenance ($52,920) and additional funds budgeted for tree pruning and removal ($70,000). The largest contracted expense for the Division is mowing as the District contracts the majority of mowing of non-golf park land. The 2024 budget for contracted mowing totals $280,822, up 6.5% or $17,240 from the previous year total of $263,582. Contracting the majority of mowing services has reduced both equipment and personnel needs of the Division. Repairs and Maintenance Costs are down $7,000 to $90,500 compared to the 2023 budget. The budget is used to address minor building and equipment repairs throughout the District, as well as planned maintenance. The decrease is due to lower equipment maintenance expense expectations as older equipment is being replaced. Supplies Supply costs are up $22,195 or 6.2% to $382,466 compared to the 2023 budget. The increase is directly related to inflationary increases, areas of notable increase include fuel of $13,000 and grounds supplies of $11,296 and offset by small decreases in other areas. Miscellaneous This category includes Divisional training for staff members. The 2024 budget total is $30,645 and is aligned with employee growth and development initiatives. Training within the Division is job-specific and includes electrical, plumbing, landscape maintenance and attendance at the IPRA and NRPA Conferences. Transfers Departmental transfers reflect field preparation costs and other park maintenance services that are charged to the Recreation Division. Capital Projects Capital Projects total $4.2 million in 2024. Refer to Appendix A for a listing of all projects.
31
Divisional Budget Analysis Division of Golf Operations Overview The Golf Operations Division delivers high-quality recreational golf experiences, maintains the golf facilities and promotes the game and benefits of golf to residents and guests while delivering excellent customer service. Responsibility The Division is comprised of Heritage Oaks Golf Club Classic 18 and Legacy 9 Courses, Practice Range, Short Game areas, Golf Shop operations and merchandise sales, Anetsberger Golf Course and food service operations. The Division of Golf Operations primarily relies on user fees for its funding. The Division manages the following: Golf Administration Administration provides leadership and support to the operation, maintenance and enhancements of the three golf courses, the Practice Range, Northbrook Golf Academy, indoor simulators and food service at Acorn Grill + Terrace in the Heritage Oaks Clubhouse. Golf Operations and Golf Shop The Golf Shop delivers customer service through tee time reservations, daily fee collections, golf events, program registrations and pace of play control on the golf courses. The shop also offers a selection of golf accessories, equipment and apparel. During the winter months the Golf Shop transforms to an indoor instruction area. Practice Facility and Northbrook Golf Academy Heritage Oaks Golf Club offers modern practice facilities and PGA credentialed instruction, available in group and private settings, making it a welcoming experience. Anetsberger Golf Course Anetsberger Golf Course located in Techny Prairie Park and Fields, is a facility designed for juniors, beginners and golfers of all ages, offering an outstanding short course, an 8,000-square-foot putting green, an acre of turf for pitching and chipping and two sand bunkers. This operation is closely integrated with the Heritage Oaks Golf Club, offering a seamless progression for players seeking varying levels of golf facilities. Food Service The Division oversees food service to provide quality food and beverage service for patrons at Heritage Oaks Golf Club. The District utilizes outside contractors to coordinate food services and rentals.
32
Divisional Budget Analysis Division of Golf Operations A
B
C
2024 Budget 2023 Estimate
D
E
F
2023 Budget
2022 Final
2021 Final
2020 Final
A-C Budget Comparison
%
A-B Budget vs Estimate
%
Property Tax
$0
$0
$0
$0
$0
$0
$0
0.0%
$0
0.0%
Replacement Tax
0
0
0
0
0
0
0
0.0%
0
0.0%
Investment Income
0
0
0
0
0
0
0
0.0%
0
0.0%
Daily Fees
2,700,550
2,605,218
2,389,100
2,211,628
862,865
180,226
311,450
13.0%
95,332
3.7%
Program Fees
602,331
567,608
467,830
491,751
308,110
215,102
134,501
28.7%
34,723
6.1%
Membership Fees
34,465
35,080
37,107
36,682
43,853
32,313
(2,642)
-7.1%
(615)
-1.8%
Rental Income
631,850
627,983
560,200
532,393
186,380
34,019
71,650
12.8%
3,867
0.6%
Retail Sales
293,000
319,717
263,000
253,598
111,035
46,646
30,000
11.4%
(26,717)
-8.4%
Miscellaneous Income
82,971
85,394
63,967
69,733
38,946
21,688
19,004
29.7%
(2,423)
-2.8%
Operating Revenue
4,345,167
4,241,000
3,781,204
3,595,785
1,551,189
529,994
563,963
14.9%
104,167
2.5%
Salaries & Wages
1,903,668
1,658,784
1,632,367
1,285,319
1,022,206
813,521
271,301
16.6%
244,884
14.8%
Employee Benefits
509,423
420,715
415,357
350,952
339,299
324,455
94,066
22.6%
88,708
21.1%
Contractual Services
622,037
574,232
579,916
526,925
314,162
214,040
42,121
7.3%
47,805
8.3%
Repair & Maintenance
35,100
14,800
30,100
51,905
49,798
18,230
5,000
16.6%
20,300
137.2%
Supplies
700,221
696,615
629,630
612,877
451,448
197,960
70,591
11.2%
3,606
0.5%
Miscellaneous
18,535
10,080
17,990
7,946
1,079
8,875
545
3.0%
8,455
83.9%
Transfers
0
0
0
0
0
0
0
0.0%
0
0.0%
Debt Service
0
0
0
0
0
0
0
0.0%
0
0.0%
Operating Expense
3,788,984
3,375,226
3,305,360
2,835,923
2,177,993
1,577,081
483,624
14.6%
413,758
12.3%
Operating Surplus/(Deficit)
556,183
865,774
475,844
759,861
(626,804)
(1,047,087)
80,339
17%
(309,591)
-35.8%
Bond Proceeds
0
0
0
0
0
0
0
0.0%
0
0.0%
Capital Projects
(563,151)
(1,314,958)
(1,467,944)
(144,064)
(4,915,218)
(7,701,444)
904,793
-61.6%
751,807
-57.2%
Other
(563,151)
(1,314,958)
(1,467,944)
(144,064)
(4,915,218)
(7,701,444)
904,793
-61.6%
751,807
-57.2%
(6,968)
(449,184)
(992,100)
615,798
(5,542,021)
(8,748,531)
985,132
-99.3%
442,216
-98.4%
Net Surplus/(Deficit)
33
Divisional Budget Analysis Division of Golf Operations Budget Highlights
Overview Golf operations at Heritage Oaks Golf Club officially opened on August 16, 2021 after being closed for the 2020 season for course improvements and the construction of a new clubhouse. The year 2022 represented the first full golf season following renovations and facility improvements. The new enhancements have had favorable impacts on Golf Operations revenue in 2023 with continued growth expected in 2024. The table below presents the individual segments of the 2024 budget for the Golf Operations Division, specifically detailing revenue and resources allocated by function. Golf Division Daily Fees Program Fees Memberships Rentals Sales Misc Total Revenue
Heritage Instruction Range Anets Admin Capital $ 2,062,750 $ - $ 485,000 $ 152,800 $ - $ 23,500 578,831 1,500 32,965 618,000 5,000 8,850 280,000 13,000 58,528 9,993 8,300 6,150 3,044,278 593,824 493,300 207,615 6,150
-
Total $ 2,700,550 602,331 34,465 631,850 293,000 82,971 4,345,167
Salaries Benefits Services R&M Supplies Misc Capital Total Expenses
1,255,027 284,815 465,361 32,800 590,878 8,135 2,637,016
271,354 64,430 11,295 21,000 1,400 369,479
50,500 46,400 96,900
139,987 13,142 14,594 2,300 39,443 209,466
237,300 147,036 80,287 2,500 9,000 476,123
563,151 563,151
1,903,668 509,423 622,037 35,100 700,221 18,535 563,151 4,352,135
Surplus/(Deficit)
407,262
224,345
396,400
(1,851)
(469,973)
(563,151)
(6,968)
Revenue Total revenue is budgeted to increase $563,963 to $4.3 million in 2024. Revenue in 2024 will primarily be comprised of daily fees, cart rentals, golf instruction, merchandise sales and seasonal pass sales (Anetsberger Golf Course) as shown in the chart below.
34
Divisional Budget Analysis Division of Golf Operations
Daily fees include green fees at both Heritage Oaks Golf Club and Anetsberger Golf Course along with practice range visits. Daily fees are expected to increase $311,450 to $2.7 million in 2024 compared to the 2023 budget. Green fees by far generate the largest revenue stream for the Division representing 62% of the total projected 2024 revenue. The proposed budget is based on total rounds of 62,000, compared to 56,840 rounds in 2023. Golf instruction and league revenue is recognized within program fees with an expected increase of $134,501 or 28.7% to $602,331 compared to the 2023 budget. Instruction revenue has grown considerably after being impacted by COVID-19 in recent years primarily due to limitations on numbers of participants allowed in group programs. Total Instruction revenue is expected to be $593,824, which is up 31% or $140,638 compared to the 2023 budget. League play is expected to generate $23,500 in program registration revenue in 2024. Indoor lessons are planned to continue at the Chalet facility at Meadowhill Park through March. Instructional programs are available for adults and youth in both private and group settings. The youth programs for ages 3-14 generate the majority of the total instruction revenue, offering a variety of instructional opportunities including summer camps, clinics, travel leagues and individual lessons. Memberships can be purchased for play at Anetsberger Golf Course including junior, student, adult, senior and family options. Membership revenue is expected to be $34,465 in 2024, closely in line with the year-end 2023 estimates. Memberships range in price from $99-$399 and allow members to play up to 18 holes per day, Monday-Friday, and 9 holes on weekends and holidays for the entire golf season. Rental income is expected to increase $71,650 to $631,850 in 2024 compared to the 2023 budget. The rental category includes rental fees for golf cars, simulators, pull carts and golf club equipment rentals. Car rentals are budgeted to total $516,000 for 2024, up $66,000 compared to the 2023 budget. The rental budget for cars reflects increased usage trends. Rental income also includes $75,000 in revenue from the two golf simulators in the clubhouse. The simulators are available for rental in 30-minute increments with a minimum rental of one hour. In addition to individual rentals, a simulator league program contributes to rental revenues. 35
Divisional Budget Analysis Division of Golf Operations Miscellaneous revenue is forecasted to increase $19,004 to $82,871 in 2024 primarily reflecting license fee income from Open Kitchens for operating the Acorn Grill + Terrace at Heritage Oaks Golf Club. Retail sales reflect merchandise and equipment sales. Merchandise sales are expected to generate $293,000 in total revenue in 2024, up by $30,000 compared to the 2023 budget. Salary and Wages Employee wages are expected to climb $271,301 or 16% to $1.9 million in 2024. The following table details allocations of full-time and part-time labor across the different Golf departments in 2024. Payroll Full-Time Part-Time Total
Admin 237,300 237,300
Heritage 116,850 326,986 443,836
Heritage Maint 414,797 396,394 811,191
Anets 49,588 49,588
Anets Maint 21,667 68,732 90,399
Instruction 184,500 86,854 271,354
12%
23%
43%
3%
5%
14%
Total 975,114 928,554 1,903,668
% 51% 49% 100%
The 2024 budget reflects a 5.0% merit increase for all full-time Non-Bargaining Unit positions. Benefits include healthcare premiums for all benefit-eligible positions, unemployment claims, continuing education and the employer share of social security and pension benefits. Relative to healthcare, the 2024 budget reflects employee coverage elections at the time of open enrollment. Total benefits are budgeted to increase 23% or $94,066 to $509,423 compared to the 2023 budget. Healthcare costs are increased compared to last year as additional golf positions became benefit eligible in 2023. Contractual Services Contractual services are up 7.3% or $42,121 to $622,037 compared to the 2023 budget. The increase primarily reflects normal operating costs, higher cost for facility maintenance and increased credit card processing fees resulting from increased sales. The majority of the increase for 2024 is expected in ground and building maintenance services. Ground maintenance services are budgeted at $92,320, up $26,386 compared to prior year budget. Additionally, Building maintenance services are budgeted at $85,470, up $9,302 compared to the 2023 budget. Repairs and Maintenance Costs are budgeted at $35,100 and are up by $5,000 compared to the 2023 budget. The 2024 budget includes $10,000 for necessary asphalt repairs. Supplies Supplies are expected to increase $70,591 to $700,221, which is 11% higher compared to the 2023 budget. The majority of this increase is driven by higher cost of goods sold and program supplies in alignment with increased sales. The budget also includes a $21,892 increase for grounds supplies and an $18,000 increase for equipment supplies. Miscellaneous This category includes Divisional training for all staff members. The 2024 budget totals $18,535 and includes maintenance workshops for supervisor training and attendance at the PGA and Golf Course Superintendent conferences. Debt No debt is expensed within the Golf Operations Division budget. 36
Divisional Budget Analysis Division of Golf Operations Capital Projects The 2024 Capital Budget totals $563,151 and includes various machinery, equipment and building/land improvements.
37
Divisional Budget Analysis Division of Recreation Overview The Recreation Division provides the residents of Northbrook with opportunities to learn new skills, gather information, socialize, exercise and spend their leisure time safely and wisely through quality programs, services and special events. Responsibilities The Recreation Division is responsible for customer relations, facility operations, programs and services at Techny Prairie Activity Center, Northbrook Sports Center, Leisure Center, Senior Center, Ed Rudolph Velodrome, Meadowhill Aquatic Center, Northbrook Sports Center Pool, Northbrook Theatre, Village Green Center, Greenbriar Gymnasium, Northbrook Dog Park and fields and courts throughout the parks. The Recreation Division is comprised of several departments: Ice Skating, Aquatics, Fitness, Athletics, General Interest, Early Childhood and Youth Programs, Seniors and Visual and Performing Arts. The Recreation Division is a liaison to seven affiliate groups that operate in cooperation with the District. Recreation works closely with these groups, fostering effective communication to ensure quality programs and services for our residents. In addition, the Division provides a staff representative to the Northbrook Arts Commission and the 4th of July intergovernmental committee.
Recreation Division/Administration Administration Recreation Administration provides overall support and direction for recreation programs and services for each age, ability and interest represented in our community. Registration and Customer Service Customer service staff process registration for programs, memberships, services and rentals and accept daily admissions for a variety of programs. Staff members generate various registration reports, maintain the ActiveNet database and prepare registration information for each brochure season.
Sports Center Operations The District operates two NHL-sized indoor ice rinks (Rinks A and B) providing comprehensive skating programs for ages 3 through adults. Programs include figure skating (preschool, recreational and competitive), specialized classes, hockey (lessons and open hockey) and a variety of open (public) skating opportunities and special events. The rooms at the Sports Center are used to accommodate affiliate meetings, skater training, summer camps and rentals. Skating School The skating school is based on the US Figure Skating curriculum which includes classes for participants of all ages and abilities. Instructional Hockey/Hockey Training Academy A progressive instructional hockey program is offered through a contractual agreement with the Northbrook Hockey League (NBHL). NBHL also offers all on- and off-ice instruction for the summer Hockey Training Academy.
38
Divisional Budget Analysis Division of Recreation Public Skating In addition to instructional classes, the District offers scheduled open skating sessions throughout the week and over holidays. Programs include open hockey, sticks and pucks and public skating. A Cosmic Skate program is offered on select Saturday evenings from September-March. Freestyle Ice The District provides Freestyle Ice time for figure skaters. District and area instructors provide private lessons or skaters can register for these times to practice solos or skills learned in group classes. Skate and Dance Camp The District offers summer youth camps for recreational figure skating. The popular Skate and Dance Camp includes instruction as well as open swim, crafts, cooking and field trips. The camp offers opportunities for beginners through more advanced levels. Northbrook-On-Ice The annual ice show, Northbrook-On-Ice, is the culmination of the 30-week Learn to Skate program, Freestyle Ice practice and the Icette program. The award-winning production features skating school participants of all ages and abilities as well as competitive skaters. US Figure Skating Competition/Winter Welcome The District has offered a skating competition each December, attracting competitors of various ages and abilities from various rinks in the area. The competition is a US Figure Skating sanctioned event that will be hosted at the Sports Center. Affiliates and Rentals After programming is scheduled, the District rents the majority of ice time to affiliate groups, including the Northbrook Hockey League, Teams Elite Synchronized Skating Club and the Northbrook Speed Skating Club for practices, games and tournaments. Any available ice time typically is rented by local teams, clubs and private parties.
Aquatics Aquatics Operations The District operates two outdoor swimming facilities with the following amenities: Meadowhill Aquatic Center Diving well with 1- and 3-meter boards A body water slide and tube water slide A play area for children under 10 years of age 25-yard, 8-lane lap pool Concession area
Northbrook Sports Center Pool Diving well: 1- and 3-meter boards, drop slide and climbing wall Zero depth with interactive play features Vortex pool 25-yard, 6-lane pool Vending area
Swimming opportunities are available from Memorial Day through Labor Day with extensive public swim hours. 39
Divisional Budget Analysis Division of Recreation Aquatic Programs The District offers a number of water orientation and swimming lessons for all ages and abilities. Private and group swim lessons are offered in a variety of formats to meet the schedules of the community. Water Fitness classes are offered for our adult and senior populations and have been included in the Techny Prairie Activity Center membership offerings. Designated lap swim times are programmed at both aquatic facilities. After-hours pool rentals are also available.
Athletics
Youth Leagues and Programs The District offers house soccer, lacrosse and flag football leagues for youth starting in preschool. New in 2023 is a Junior High Volleyball league held at TPAC. When fields and courts are not in use, they are available for school district programs, affiliate use and community rentals. There is also a youth basketball league, which utilizes Glenbrook North High School, Greenbriar Gym, Techny Prairie Activity Center and Northbrook school districts. Instructional programs for youth sports are held at the District’s indoor and outdoor facilities. Seasonal classes include volleyball, baseball and softball clinics, lacrosse, basketball, football, soccer, pickleball and multisport classes. Adult Leagues and Programs The District offers softball leagues for adults. When fields are not scheduled, they are available for school district programs, affiliate use and community rentals. Open gym sessions (soccer, basketball, pickleball) are held at Techny Prairie Activity Center and Greenbriar Gym. Tennis (Adult and Youth) The District maintains 19 outdoor tennis courts for public use. The courts are located at five park sites: Wood Oaks Green Park (8), Crestwood Park (4), West Park (3), Williamsburg Square Park (3) and Oaklane Park (1). The District courts are scheduled for lessons and available time is rented. The District also contracts with Northbrook Racquet Club and Glenbrook Racquet Club for group lessons, conducted both indoors at their sites and outdoors in our parks. Pickleball In 2019, the District installed six dedicated outdoor pickleball courts at Stonegate Park and will have two at Oaklane Park in 2024. The courts are open for public use, lessons and rentals. Tennis courts at Crestwood Park, Williamsburg Square Park and Wood Oaks Green Park are also lined for pickleball. Pickleball lessons and leagues are available on outdoor District courts from April through October and indoors from September to May at Techny Prairie Activity Center and Greenbriar Gym. Batting Cages Located in Techny Prairie Park and Fields, the batting cages for baseball and softball are open from mid-April through midOctober with additional hours for tournaments and adult leagues. Summer and Holiday Camps (Athletics) The summer athletic camps held at Techny Prairie Activity Center, Greenbriar Gym and/or the school Districts are popular. Shorter sports camps are offered at District facilities during holiday and spring breaks. Skate Park Also, at Techny Prairie Park and Fields is the District’s only skate park, hailed as one of the most popular in the area because of the concrete construction. Youth from Northbrook and many surrounding communities enjoy this amenity. Instructional classes and summer camps for the community are offered. 40
Divisional Budget Analysis Division of Recreation Martial Arts The District works with martial arts contractors to offer fencing and taekwondo classes for residents. Classes take place at Techny Prairie Activity Center. Ed Rudolph Velodrome The Velodrome in Meadowhill Park is one of only 22 banked outdoor quarter-mile bicycle tracks in the country. Thursday night races attract top cyclists from the Midwest. The District offers a youth program with training on Wednesdays and racing on Fridays. Northbrook residents can use the track when it is not reserved for races or training. Staff works with the Northbrook Cycle Committee to host programs at the facility during the summer. Greenbriar Gymnasium The gymnasium at Greenbriar School was a joint venture between the Northbrook Park District and School District 28. The gym provides dedicated indoor space and the opportunity to offer additional programming opportunities. The District can use this facility after school and during weekends, school holidays and vacation breaks. The gym has one regulation high school basketball court with two side courts for volleyball and pickleball as well. Northbrook Dog Park In 2013, the District opened a dog park at Coast Guard Park, after signing an easement agreement with Underwriters Laboratories to allow the use of its driveway as an entrance to the park. The District created a 2-acre area for all dogs and a .5-acre area for small dogs, as well as a 37-spot parking lot. The facility also includes a shelter with tables and benches, a dog wash area and a drinking fountain. The facility is open to members daily until dusk year-round.
Leisure Center Operations The Leisure Center offers a wide variety of programs for preschool-aged children, youth, adults and seniors. Programming is divided into the following categories: Early Childhood and Youth, Visual Arts, School-Age Childcare and Enrichment, General Recreation, Camps, Seniors, Performing Arts, Special Events and Rentals/Parties. Early Childhood and Youth The Leisure Center offers Sunshine Preschool and early childhood enrichment classes such as Wee Chefs, Kiddie Concoctions and Safety Town. Designed for children from 3-5 years of age, Sunshine Preschool is a multi-faceted program based on a philosophy of learning through play in a nurturing and supportive environment. Visual Arts Visual Arts classes are an area of interest for children and adults at the Leisure Center. Instructional classes include ceramics, drawing, sewing, beading, painting, adult/child workshops and other arts and crafts. School-Age Childcare and Enrichment The District, in cooperation with School Districts #27, #30 and #31, offers before- and after-school care (Adventure Campus) at five sites. This program is designed to be self-supporting with user fees covering all direct expenses. General Recreation Several general interest programs are offered year-round for youths, teens and adults such as Chess Wizards, Magic, cooking, nature and various one-time events.
41
Divisional Budget Analysis Division of Recreation Camps (General Recreation) A variety of summer camp experiences are available for children ages 3-13. Each camp offers an recreational experience, while promoting positive self-worth and skill development. Leisure Center Parties/Rentals Residents can enjoy the use of facilities by booking a party or room rental. Staff assists in making birthday celebrations memorable with the following themed parties: Sports, Princess/Superhero, Balloon Animals and Magic. Facility rentals allow outside groups to conduct meetings and special functions, rent the gym for sports activities and take advantage of the kitchen and library. Senior Center The Senior Center serves the leisure and social needs of the adult population, age 65 and older. Membership is open to residents and non-residents for a nominal fee. Members enjoy a variety of free drop-in activities and receive a discount on trips and programs, along with quarterly newsletters. The Senior Center, located in the Leisure Center, provides recreation programs that include crafts, special interest groups, trips and special events. The Senior Center also provides services to meet the needs of this demographic including driver safety programs, vision testing and driver’s license renewal. Lending Closet In 2013, the District took over the operations of the Lending Closet, which allows residents to borrow medical equipment such as walkers, wheelchairs and crutches free of charge.
Performing Arts Performing Arts are popular at the Leisure Center with classes in Music, Dance and Drama, as well as an active theatre program specializing in productions by and for children. When the theatre is not in use, the space is rented to performing groups and used for other programs and events. Northbrook Theatre for Young Audiences An agreement signed with the Actors’ Equity Association brings professional performers to the Northbrook Theatre for Young Audiences (NTYA) stage. NTYA is one of the few professional theatres in the Midwest dedicated specifically to Theatre for Young Audiences and the only professional Equity Theatre for Young Audiences in Illinois within a Park District. NTYA productions were on hold during the pandemic and resumed with performances in Fall 2023. Northbrook Theatre for the Very Young In 2023, Northbrook Theatre began offering Theatre for the Very Young. These performances, designed specifically for children ages 0-5 and their caregivers, is performed by actor/educators, or “teaching artists”. Theatre for the Very Young is participatory, multi-sensory theatre, where the very young audience is invited to be a part of the experience in an immersive performance atmosphere. Performing Arts Classes The Performing Arts Department offers classes in theatre and improv as well as private lessons in voice, piano and dance. The Northbrook School of Dance provides a variety of classes for ages 2 and older in both a recreational and recital-based format, while Drama classes are available for ages 3 and older culminating in a performance for participant families at the end of each session. 42
Divisional Budget Analysis Division of Recreation Northbrook Theatre Youth Company The Northbrook Theatre Youth Company (NTYC) presents three “theatre by youth for youth” productions each year. The program is designed for youth in grades 3-8. Community Theatre Northbrook Theatre's award-winning Community Theatre program performs two multigenerational productions for participants ages 9-adult and one teen production for ages 12-18 annually. This program, open to any participant that fits the age requirements, encourages families in our community to participate together and often features actors who are siblings, parents and their children and grandparents. No previous theatre experience is required to audition. For 2024, planned production titles are Chicago: Teen Edition, Fiddler on the Roof and a holiday production. Performing Arts Summer Programming In the summer, the Performing Arts Department offers professional Performing Arts Workshops. Session attendance averages between 60 and 100 participants enrolled in Theatre Arts for ages 8-14. Each level meets five days to immerse participants in the performing arts, offering daily exposure to music, dance, drama and rehearsals for final performances. Theatre Arts culminates in a public performance of an age-appropriate production. Performing Arts Workshops also offer recreational activities and field trips for a well-rounded experience. Theatre Rentals In addition to District programs, the Performing Arts Department cooperates with local groups such as Bravo Theatre, Star Dance Studios, Congregation Beth Shalom, NSSRA and other local music, dance, and drama groups. These groups rent during times when the theatre does not have a performance scheduled, and Park District staff members provide technical and artistic expertise to enhance the presentations. The theatre is also rented by various organizations as a meeting space. Recreation Special Events The District offers many Special Events during the year, including Breakfast with the Bunny, Tuesdays in the Park, Liberty Loop 5K, Liberty Lap Fun Run, Kids' Duathlon, Cardboard Regatta, Touch-A-Truck, Halloween Family 3K, Autumnfest, Turkey Shoot Free Throw Contest, Brewfest, Party on the Green, Gingerbread House Workshop, and Breakfast and Lunch with Santa. Special Events are unique activities that are held during a short, specific period of time. The District partners with the Village of Northbrook to provide residents with 4th of July festivities including a bike parade, parade and fireworks show. The Village co-sponsors Grapes on the Green, a new wine event added in 2023, and Brewfest events.
Techny Prairie Activity Center The Techny Prairie Activity Center opened to the public on January 1, 2021 and offers a wide variety of programs for preschoolers through adults and seniors. Programming is divided into categories: Fitness Center, Indoor Track, Personal Training, Group Fitness, Rentals/Parties and Childcare. Athletics and Camps held at this facility are noted under the sections above. Fitness Center The Fitness Center offers memberships and daily admission for individuals ages 13 and older for access to the 6,000+ square foot fitness floor and the indoor track.
43
Divisional Budget Analysis Division of Recreation Group Fitness A wide variety of group fitness classes such as Pilates, Yoga, Zumba®, Werq, Cycling, Barre, W.O.W., Les Mills Body Pump™, and others are offered in the two fitness studios. These classes are included with a membership or daily admission fee. In addition, specialized fitness classes are offered for a fee including Yoga for Beginners and Parkinson Wellness Recovery. Low impact classes such as Aqua Fitness, Tai Chi, Move It & Lose It, Chair Yoga and others are offered at the Leisure Center and Sports Center and are included with membership but also have a nonmember registration fee. Indoor Track The indoor track is eight laps to a mile. Use of the indoor track is available with a fitness membership, a track only membership or payment of a daily admission fee. Personal Training Personal training is available for 1-on-1, partner and small group sessions. Individuals can pay as they go or purchase a punch pass for multiple sessions. Rentals/Parties Residents can enjoy the use of facilities by booking a party or room rental. Staff assists in making birthday celebrations memorable with the following themed parties: Sports, Dance, Fitness or Kids’ Corner. Facility rentals allow outside groups to conduct meetings or special functions in the Prairie Room and rent the gym for sports activities. Also, individuals can rent the Prairie Room and its kitchen for self-planned parties and meetings. Childcare Childcare for members and facility users is offered in the Kids’ Corner Room while adults are on the premises. Individuals can pay as they go or purchase a punch pass for multiple sessions.
44
Divisional Budget Analysis Division of Recreation A
B
C
2024 Budget 2023 Estimate
D
E
F
2023 Budget
2022 Final
2021 Final
2020 Final
A-C Budget Comparison
%
A-B Budget vs Estimate
%
Property Tax
$0
$0
$0
$0
$0
$0
$0
0.0%
$0
0.0%
Replacement Tax
0
0
0
0
0
0
0
0.0%
0
0.0%
Investment Income
0
0
0
0
0
0
0
0.0%
0
0.0%
Daily Fees
809,589
727,089
634,704
524,362
396,404
342,493
174,885
27.6%
82,500
11.3%
Program Fees
5,850,059
5,030,113
4,702,470
3,991,157
2,263,473
2,211,586
1,147,589
24.4%
819,946
16.3%
Membership Fees
1,227,554
1,155,776
1,016,954
1,015,565
619,140
25,537
210,600
20.7%
71,778
6.2%
Rental Income
1,230,286
1,209,283
1,202,035
1,142,173
827,017
687,974
28,251
2.4%
21,003
1.7%
8,700
7,574
7,650
6,527
3,087
43,293
1,050
13.7%
1,126
14.9%
Miscellaneous Income
159,255
142,461
137,629
127,537
629,508
703,339
21,626
15.7%
16,794
11.8%
Operating Revenue
9,285,443
8,272,296
7,701,442
6,807,321
4,738,628
4,014,223
1,584,001
20.6%
1,013,147
12.2%
Salaries & Wages
5,606,120
4,843,909
4,736,527
3,852,024
2,890,492
2,425,308
869,593
18.4%
762,211
15.7%
Employee Benefits
1,116,232
920,489
1,006,304
948,494
823,875
773,015
109,928
10.9%
195,743
21.3%
Contractual Services
2,398,925
2,154,532
2,145,231
1,796,696
1,364,209
1,397,045
253,694
11.8%
244,393
11.3%
Repair & Maintenance
84,450
88,119
82,500
50,581
43,193
35,234
1,950
2.4%
(3,669)
-4.2%
Supplies
694,929
629,452
620,338
546,756
339,691
308,288
74,591
12.0%
65,477
10.4%
Miscellaneous
154,299
96,061
92,149
60,420
37,377
23,558
62,150
67.4%
58,238
60.6%
Transfers
36,313
33,714
40,815
20,140
29,293
17,557
(4,502)
-11.0%
2,599
7.7%
0
0
0
0
0
0
0
0.0%
0
0.0%
Operating Expense
10,091,268
8,766,276
8,723,864
7,275,111
5,528,130
4,980,006
1,367,404
15.7%
1,324,992
15.1%
Operating Surplus/(Deficit)
(805,825)
(493,980)
(1,022,422)
(467,790)
(789,503)
(965,783)
216,597
-21%
(311,845)
63.1%
Bond Proceeds
0
0
0
0
0
0
0
0.0%
0
0.0%
Capital Projects
(2,383,000)
(292,785)
(541,005)
(304,244)
(3,995,608)
(11,878,673)
(1,841,995) 340.5% (2,090,215) 713.9%
Other
(2,383,000)
(292,785)
(541,005)
(304,244)
(3,995,608)
(11,878,673)
(1,841,995) 340.5% (2,090,215) 713.9%
Net Surplus/(Deficit)
(3,188,825)
(786,765)
(1,563,427)
(772,034)
(4,785,110)
(12,844,456)
(1,625,398) 104.0% (2,402,060) 305.3%
Retail Sales
Debt Service
45
Divisional Budget Analysis Division of Recreation Budget Highlights
Overview Revenue is expected to improve in 2024, increasing $1,584,001 or 20.6% to $9.3 million compared to the previous year budget, and up $1.0 million compared to the 2023 year-end estimate. The Recreation Division from a financial standpoint was impacted the most by COVID-19 in recent years, as revenue dropped with the corresponding program cancellations and participant limitations. Following these challenges, 2024 Divisional revenue projections have improved significantly compared to the revenue totals for recent years. Revenue Rec Admin Rec Programs Rec Facilities Rec Rentals Total
A 2024 Budget 22,003 6,731,320 1,313,014 1,219,106 9,285,443
B % 2023 Estimate 0.2% 21,354 72.5% 5,802,675 14.1% 1,253,699 13.1% 1,194,568 100% 8,272,296
C % 2023 Budget 18,641 0.3% 70.1% 5,365,232 15.2% 1,127,835 14.4% 1,189,734 100% 7,701,442
% 0.2% 69.7% 14.6% 15.4%
100%
D 2022 Final % 18,938 0.3% 4,613,317 67.8% 1,058,054 15.5% 1,117,012 16.4% 6,807,321 100%
B-C Variance
%
A-C Variance
%
A-B Variance
%
2,713
14.6%
3,362
18.0%
649
3.0%
437,443
8.2%
1,366,088
25.5%
928,645
16.0%
125,864
11.2%
185,179
16.4%
59,315
4.7%
4,834
0.4%
29,372
2.5%
24,538
2.1%
570,854
7.4%
1,584,001
20.6%
1,013,147
12.2%
Revenue generated from programs is by far the most significant revenue stream for the Division. Program revenue is expected to comprise 72.5% of the total 2024 Divisional revenue, followed by facility rentals (14.1%). The 2024 budget reflects an improvement in overall program participation, as camps and before/after school programs are expected to climb $298,038 and $312,278, respectively, compared to the 2023 year-end estimate.
Recreation Division Revenue Daily Fees Daily fees are budgeted to increase $174,885 to $809,589 in 2024 compared to the 2023 budget. The 2024 budget also reflects revenue improvement of $82,500 or an 11% increase compared to the 2023 year-end estimate. The 2024 budget includes an improvement in daily admissions over the 2023 estimates across the majority of areas with the largest dollar increase for Theatre, Freestyle Ice and TPAC Open Gyms. Daily Admissions Freestyle Ice Theatre MAC Pool Sports Center Pool Northbrook On Ice Batting Cages TPAC Childcare Public Skating TPAC Open Gyms TPAC Fitness Center Other Programs Total
A 2024 Budget 243,000 164,305 123,000 57,800 52,524 48,250 6,300 60,300 41,650 9,000 3,460 809,589
% 30% 20% 15% 7% 6% 6% 1% 7% 5% 1% 0% 100%
B 2023 Estimate 236,701 104,656 120,830 56,140 52,494 46,120 6,253 57,630 37,400 8,500 365 727,089
% 33% 14% 17% 8% 7% 6% 1% 8% 5% 1% 0% 100%
C 2023 Budget 218,000 91,864 83,458 40,548 58,880 39,000 4,640 61,200 25,500 10,200 1,414 634,704
%
34% 14% 13% 6% 9% 6% 1% 10% 4% 2% 0% 100%
2022 Final 195,065 45,020 73,144 34,134 41,995 34,333 4,284 52,922 30,215 11,065 2,185 524,362
% 37% 9% 14% 7% 8% 7% 1% 10% 6% 2% 0% 100%
A-C Variance 25,000 72,441 39,542 17,252 (6,356) 9,250 1,660 (900) 16,150 (1,200) 2,046 174,885
% 11% 69% 33% 31% -12% 20% 27% -2% 43% -14% 561% 24%
A-B Variance % 6,299 3% 59,649 65% 2,170 3% 1,660 4% 30 0% 2,130 5% 47 1% 2,670 4% 4,250 17% 500 5% 3,095 219% 82,500 13%
Freestyle Ice sessions represent the largest activity within daily fees as revealed above. Freestyle Ice is budgeted to generate $243,000 in revenue in 2024, up $6,299 or 3% from the 2023 year-end estimate. The Freestyle Ice revenue is also up 11% or $25,000 compared to 2023 budget. Freestyle sessions provide skaters time to work on competitive routines, practice skills or take private lessons.
46
Divisional Budget Analysis Division of Recreation Program Fees Program fees are expected to increase $819,946 to $5.9 million compared to 2023 year-end estimates. It should be noted that the top four program areas highlighted below are expected to generate 78% of the total program revenue for the Division in 2024. The table below details program fees for the 2024 budget, 2023 year-end estimates and results from fiscal 2022. Program Fees Summer Camps Before/After School Youth Athletics Adult Athletics Ice Skating Early Childhood School Days Off Performing Arts General Interest Special Events Aquatics Fitness Senior Programs Hockey Total
A B 2024 Budget 2023 Estimate 1,732,912 1,434,874 1,625,568 1,313,290 735,461 719,896 495,045 473,308 380,972 318,085 179,033 172,807 153,311 116,680 144,632 133,142 130,141 109,279 143,533 113,718 56,441 48,619 34,300 27,625 24,650 35,197 14,060 13,593 5,850,059 5,030,113
C 2023 Budget 1,342,461 1,182,409 657,160 316,158 347,435 196,868 119,974 176,147 89,549 140,475 55,669 19,200 37,275 21,690 4,702,470
2022 Final 1,081,739 938,060 658,332 353,155 308,131 170,206 92,695 138,444 84,705 52,672 51,513 21,379 23,709 16,416 3,991,157
A-C Variance 390,451 443,159 78,301 178,887 33,537 (17,835) 33,337 (31,515) 40,592 3,058 772 15,100 (12,625) (7,630) 1,147,589
% 27% 34% 11% 38% 11% -10% 29% -24% 37% 3% 2% 55% -36% -56% 23%
A-B Variance 298,038 312,278 15,565 21,737 62,887 6,226 36,631 11,490 20,862 29,815 7,822 6,675 (10,547) 467 819,946
% 21% 24% 2% 5% 20% 4% 31% 9% 19% 26% 16% 24% -30% 3% 16%
Summer Camps are expected to generate the highest level of program revenue in 2024. Camp revenue is expected to increase to $1.7 million, up about $298,039 or 21% compared to the 2023 year-end estimate. The summer camp 2024 budget revenue is up significantly compared to 2022 results and considerably higher than pandemic years following COVID-19 restrictions that drastically limited the size of the camps. Adventure Campus program revenue is expected to grow in 2024, up $443,159 to $1.6 million compared to the 2023 budget and up $312,278 compared to the 2023 year-end estimate. Demand for these services continues to remain strong. Staffing for these programs has been a challenge in recent years but the District has evaluated and improved processes in marketing and recruitment efforts throughout 2022 and 2023. Adult Athletics revenue has trended higher in 2023 and is estimated to be $178,887 higher in 2024 compared to the 2023 budget. The majority of this revenue increase is due to favorable totals for Pickleball and Tennis. Additionally, Youth Athletics is up $78,301 or 11% compared to the 2023 budget, mostly driven by higher revenue totals for youth basketball and tennis.
47
Divisional Budget Analysis Division of Recreation Memberships Memberships fees are expected to increase for 2024 totaling $1.2 million up $210,600 compared to the 2023 budget. Membership Fees TPAC MAC Sports Center Pool Northbrook Park Sites Senior Programs Total
A B 2024 Budget 2023 Estimate 896,625 828,198 169,295 164,597 126,774 132,981 22,860 18,000 12,000 12,000 1,227,554 1,155,776
C 2023 Budget 657,520 180,502 147,717 20,340 10,875 1,016,954
2022 Final 665,049 174,339 142,608 22,220 11,349 1,015,565
A-C Variance 239,105 (11,207) (20,943) 2,520 1,125 210,600
% 29% -7% -16% 14% 9% 18%
A-B Variance 68,427 4,698 (6,207) 4,860 71,778
% 8% 3% -5% 27% 0% 6%
Memberships include TPAC fitness center and track memberships, pool passes, senior center memberships and dog park memberships. The 2024 budget increase primarily relates to higher totals for TPAC facility memberships budgeted at $662,200 and up by $139,200 compared to the 2023 budget total of $523,000. Personal training is also budgeted higher at $204,425 compared to $114,520 in the prior year budget. Pool Pass memberships at MAC and SC pool are budgeted at $169,295 and $126,774, respectively, in 2024. Rentals Rental income primarily includes revenue of $837,835 generated from rink rentals and $266,020 for court/field rentals at park sites. Total rentals are budgeted at $1.2 million, higher by about $28,251 or 2% compared to the 2023 budget. Leisure Center rentals are expected to be closely in line with 2023 estimates. The table below details rental income for the Division. Rentals Sports Center (Ice, Rooms, Skates) Park Sites* Techny Park Activity Center Leisure Center Leisure Center Theatre Sports Center Pool MAC Pool Greenbriar Gym Village Green Center Total
A 2024 Budget 837,835 266,020 68,065 8,055 5,250 7,750 14,125 18,700 4,486 1,230,286
B 2023 Estimate 829,180 270,641 73,307 5,059 3,140 6,355 5,817 12,000 3,784 1,209,283
C 2023 Budget 853,021 239,959 42,019 21,474 10,500 10,125 13,750 8,000 3,187 1,202,035
2022 Final 750,199 292,400 42,375 8,915 18,518 6,669 9,470 10,554 3,074 1,142,173
A-C Variance (15,186) 26,061 26,046 (13,419) (5,250) (2,375) 375 10,700 1,299 28,251
% -2% 11% 62% -62% -50% -23% 3% 134% 41%
2%
A-B Variance 8,655 (4,621) (5,242) 2,996 2,110 1,395 8,308 6,700 702 21,003
% 1% -2% -7% 59% 67% 22% 143% 56% 19%
2%
* Courts, fields, shelters, and related affiliates
Miscellaneous Income Miscellaneous revenue totals $159,255 in 2024 and includes $43,105 in employee health insurance reimbursements. Additional miscellaneous revenue includes items such as grants, sponsorships and vending income.
48
Divisional Budget Analysis Division of Recreation Recreation Division Expenses Salary and Wages Employee wages are expected to increase $869,593 or 18% to $5.6 million in 2024, compared to the 2023 budget. The 2024 budget reflects a 5.0% merit increase for all full-time positions and assumes all full-time positions are filled Recreation. The salary budget was also increased to include two additional full-time positions compared to the prior year budget. Additionally, the implementation of the compensation study results and overall staffing changes further contributed to the increased salary expense. Payroll Full-Time Part-Time Total
Admin 385,022 39,208 424,230
Programs 1,017,023 2,004,235 3,021,258
8%
54%
Rec Facilities Rec Maintenance 522,073 595,883 920,885 94,224 1,442,958 690,107 26%
Rentals 27,567 27,567
12%
Total 2,520,001 3,086,119 5,606,120
% 45% 55% 100%
0%
Roughly 55% of the total work force costs in the Recreation Division are provided through part-time positions, while fulltime labor represents 45% of the total expense as revealed in the table above. Below is a summary of the salary and wages across the top ten recreation category areas. A Salary and Wages Recreation Admin Services
B
C
2024 Budget 2023 Estimate 2023 Budget 2,214,860 1,785,288 1,922,699
A-C
A-B
2022 Final 1,552,543
Variance 292,161
% 16%
Variance 429,572
TPAC
851,494
784,794
739,822
655,251
111,672
14%
66,700
8%
Before/After School
552,077
462,726
437,265
301,504
114,812
25%
89,351
19%
Summer Camps
448,949
370,031
299,403
236,181
149,546
40%
78,918
21%
Sports Center
280,546
224,329
249,420
199,471
31,126
14%
56,217
25%
Sports Center Pool
192,313
204,227
193,651
168,341
(1,338)
-1%
(11,914)
-6%
MAC
189,332
286,705
190,201
188,567
(869)
0%
(97,373)
-34%
Leisure Center
177,117
147,220
141,884
134,075
35,233
24%
29,897
20%
Performing Arts
159,576
118,854
133,666
99,591
25,910
22%
40,722
34%
Ice Skating
141,916
121,558
128,357
106,082
13,559
11%
20,358
17%
Remaining Areas
397,940
338,177
300,159
210,418
97,781
29%
59,763
18%
5,606,120
4,843,909
4,736,527
3,852,024
869,593
18%
762,211
16%
Grand Total
% 24%
Employee Benefits Benefits include healthcare premiums for all benefit-eligible positions and unemployment claims for the Division. In addition, the employer share for social security and pension benefits is also included within the Divisional budget. Relative to healthcare, the 2024 budget reflects employee coverage elections at the time of open enrollment. Division of Recreation benefits are forecasted to total $1.1 million, up $109,928 or 10.9% compared to the 2023 budget, and an increase of $195,743 compared to the 2023 year-end estimate. Pension costs are up $31,434 to $84,925 compared to the 2023 budget primarily reflecting additional employee coverage additions and an increase in the employer rate from 2.05% to 2.69% in 2024. Eligible employees contribute 4.5% of their 49
Divisional Budget Analysis Division of Recreation earnings toward pension benefits. However, the employer’s share will vary from year-to-year depending on many factors including annual investment returns, member demographics and actuarial assumptions. A Employee Benefits Recreation Admin Services
B
C
A-C
2024 Budget 2023 Estimate 2023 Budget 611,260 512,102 647,336
A-B
2022 Final 579,846
Variance 36,076
%
Variance 135,234
%
7%
26%
TPAC
95,131
78,653
82,560
82,908
12,571
16%
16,478
21%
Before/After School
95,104
76,069
74,968
63,345
20,136
26%
19,035
25%
Sports Center
93,060
76,858
88,517
89,959
4,543
6%
16,202
21%
Leisure Center
59,520
65,480
52,954
54,047
6,566
10%
(5,960)
-9%
Summer Camps
35,280
28,727
22,910
18,399
12,370
43%
6,553
23%
Sports Center Pool
14,713
15,623
14,815
12,926
(102)
-1%
(910)
-6%
MAC
14,485
21,933
14,551
14,557
(66)
0%
(7,448)
-34%
Special Events
14,173
5,475
2,719
210
11,454
209%
8,698
159%
Performing Arts
12,213
9,093
10,229
7,654
1,984
22%
3,120
34%
14%
4,741
16%
12%
195,743
21%
Remaining Areas Grand Total
35,217
30,476
30,821
24,644
4,396
1,116,232
920,489
1,006,304
948,494
109,928
Contractual Services Contractual services are expected to increase 11.8% or $253,694 to $2.4 million compared to the 2023 budget. As previously discussed, program revenue for 2024 is forecasted to increase compared to both the prior year budget and year-end estimates. Given the increase in demand, program expenses have been growing to support the increase in program offerings. The majority of the contractual services increase compared to prior budget was for independent contractor services of $553,182, up $167,682 versus the 2023 budget which has been adjusted to support the level of program offerings. In addition to the costs mentioned above, other significant expenses include utilities of $410,308 and the Division’s share of PDRMA premiums at $125,628. Below is a summary of the contractual services expenses by category area. A Contractual Services Recreation Admin Services
B
C
A-C
2024 Budget 2023 Estimate 2023 Budget 540,437 520,037 506,380
2022 Final 456,098
Variance 34,057
A-B Variance 20,400
%
7%
%
4%
Sports Center
308,856
276,233
316,599
238,009
(7,743)
-3%
32,623
12%
TPAC
275,795
265,550
259,280
209,094
16,515
6%
10,245
4%
Adult Athletics
192,226
200,642
122,161
151,731
70,065
35%
(8,416)
-4%
Special Events
188,158
149,967
145,870
87,078
42,288
28%
38,191
25%
Youth Athletics
181,086
190,976
130,171
173,132
50,915
27%
(9,890)
-5%
Summer Camps
178,607
125,123
152,171
105,411
26,436
21%
53,484
43%
MAC
109,443
58,833
87,138
64,865
22,305
38%
50,610
86%
Leisure Center
79,207
72,113
97,536
70,731
(18,329)
-25%
7,094
10%
Sports Center Pool
64,870
58,025
56,590
38,614
8,280
14%
6,845
12%
Remaining Areas Grand Total
280,240
237,033
271,335
201,931
8,905
4%
43,207
18%
2,398,925
2,154,532
2,145,231
1,796,696
253,694
12%
244,393
11%
50
Divisional Budget Analysis Division of Recreation Repair and Maintenance Repair costs are budgeted to increase 2.4% or $1,950 to $84,450. This includes funding for building repairs at $53,750 and equipment repairs of $28,700. The increase in costs is primarily related to planned pump equipment repairs to Sports Center Pool. Supplies Supplies are budgeted to increase 12.0% or $74,591 to $694,929 compared to the 2023 budget and increase of $65,477 compared to the 2023 year-end estimate. Program supplies represent the majority of the increase and are expected to increase 19% or $64,916 to support the increased program offerings in 2024. Miscellaneous Expense Miscellaneous expenses are budgeted to increase $62,150 to $154,299 compared to the 2023 budget and increase $58,238 compared to the 2023 year-end estimate. This category includes Divisional training ($68,749), program scholarships ($40,000) and coaching credits for parents who volunteer ($25,500). Scholarships represented the majority of the increase with a $25,000 increase compared to the 2023 budget. Training expense is expected to increase by about $13,525 due to increased staffing levels compared to the previous year budget. Departmental Transfers Departmental transfers reflect field preparation costs and other park maintenance services that are charged to athletic affiliate budgets. Maintenance costs are reviewed by staff on an annual basis. Debt No debt is expensed within the Recreation Division budget. Capital Projects Projects for the Division total $2.4 million for 2024 and include improvements for MAC pool renovations, recreation machinery and equipment, professional services and other projects. For a full listing of all District-wide projects refer to Appendix A.
51
Appendix A 2024 Capital Improvement Plan DIVISION Parks & Properties Administration Parks & Properties Parks & Properties Parks & Properties Parks & Properties Parks & Properties Parks & Properties Parks & Properties Parks & Properties Parks & Properties Parks & Properties Parks & Properties Parks & Properties Parks & Properties Parks & Properties Parks & Properties Parks & Properties Parks & Properties Parks & Properties Parks & Properties Recreation Recreation Recreation Recreation Recreation Golf Golf Golf Golf Golf Golf
Recreation Recreation Recreation Recreation Recreation Recreation Recreation Recreation Parks & Properties Parks & Properties Parks & Properties Parks & Properties Parks & Properties Parks & Properties Parks & Properties Parks & Properties Parks & Properties Golf Golf Golf Golf Administration Parks & Planning Parks & Planning Parks & Planning Parks & Planning Parks & Planning Parks & Planning Parks & Planning Parks & Planning Parks & Planning Parks & Planning Recreation Golf Golf
LOCATION / PROJECT Paving & Lighting Improvements Asphalt / Concrete Repairs & Maintenance Total - Paving & Lighting Computer Equipment Replacements Total - Administration Capital Improvements Parking Lot Replacement Greenfield Playground/Park Renovation ADA Pathway Improvements/Repair LC-Indian Ridge Athletic Field Improvements Site Amenity Replacements Tennis Court Repairs Trail Through Time Masterplan Wescott Park Playground Replacement West Park Renovation Planning Williamsburg Square Renovation Wood Oaks Green Parking Lot Replacement Engineering Replace 1997 Kubota M5400 (5010) Replace 2007 Chevy 1500 (2020) Replace2010 Ford Transit (3010) Replace 2010 GMC 4WD 2500-Utility Body Plow (3090) Replace 2010 Toyota Prius (3190) Replace 2008 Chevy 2500 HD 4WD - Plow Truck (6030) Village Green Roof Replacement Engineering Village Green RTU Replacement Engineering Total - Parks and Properties Capital Improvements Leisure Center Renovation Planning Camp Tent Replacement Meadowhill Aquatic Center Renovation Greenbriar School Gym Floor Refinish Theater Spotlights Total - Recreation Capital Improvements Acorn Grill & Terrace Updates/Replacements 2009 Toro 150" Grounds Master 4700-D (7540) 2007 Toro 3500-D Sidewinder (7730) 1987 Ditch Witch 2310 (8500) 2011 Club Car Carryall (6460) 2007 John Deere TX Turf Gator (6330,6430,6440) Total - Golf Capital Improvements MANAGER'S ACCOUNT (PROJECTS UNDER $30,000) 7x7 Soccor Goal Replacement Lacrosse Goal Replacements Leisure Center Theatre Wireless Microphones Leisure Center Cabinet Heater Removal Pool Deck Furniture Sports Center Pool Water Walk Iceberg Refurbishment Techny Prairie Activity Center Studio A&B Sound System Volleyball Net System Replacement Personal Protective Equipment Tower Rink Wood Light Pole Engineering / Replacement Velodrome Repairs Wood Oaks Green Epoxy Floor Coating Roller Replacement (4470 & 4560) Steel Green Sprayer/Spreader Combo Synthetic Turf Sweeper 2010 Tow master T-10 Tilt Trailer (5160) 2008 Hallmark Enclosed Trailer (5240) Outdoor Dining Tables Irrigation Head Replacement 2005 Club Car Precedent (10099) 2011 No Ramp Trailer (8520) Total - Manager's Account IT Server & Data Storage Upgrades Mechanics lift replacement Replace truck (3050)F350 4x4 w/plow Replace truck (3210) F350 4x4 crew cab Garbage Collection System Greenfield Playground/Park Renovation Design Oaklane Park Renovation Parking Lot Engineering 545 Academy Wescott Playground Replacement Design West Park/Sports Center Fence Replacement Williamsburg Square Park Renovation Design MAC Design/Engineering Replace Triplex (7090) TriFlex Hybrid 3360 Replace Utility Cart (6510) Toro HDX Auto Total - Carry-Over Projects Total - New Projects Total - All Projects FY 2025 CIP
52
2024 Budget $120,000 $85,000 $459,000 $370,000 $272,000 $45,000 $40,000 $221,000 $30,000 $220,000 $55,000 $1,488,000 $82,500 $53,000 $64,000 $68,000 $78,100 $30,000 $81,750 Defer Defer $175,000 $40,000 $1,750,000 $30,000 $40,000 $100,000 $118,000 $51,750 $49,000 $30,000 $46,000
$17,000 $6,000 $25,000 $20,000 $15,000 $17,000 $30,000 $8,000 $5,500 $20,000 $15,000 $8,300 $26,500 $20,500 $13,500 $10,500 $17,000 $16,000 $16,000 $12,500 $18,500 $65,000 $29,000 $62,500 $56,500 $42,000 $14,000 $22,000 $20,000 $7,200 $45,000 $46,899 $210,000 $70,314 $35,087
Totals
$120,000 $85,000
$3,657,350
$2,035,000
$394,750
$337,800
$725,500 $6,629,900 $7,355,400
Appendix B Historical Tax Rates Tax Levy Year Equalized Assessed Value
2023* N/A
Tax Levy Extended
$13,980,163
0.2085 0.0912 0.0000 0.0122 0.0046 0.0260 0.0046 0.0061 0.0008 0.0736
2021 $2,774,150,950
2020 $2,982,836,261
2019 $3,000,974,422
$13,305,050
$12,686,223
$12,719,905
$12,462,696
0.1936 0.0886 0.0000 0.0127 0.0003 0.0255 0.0048 0.0053 0.0008 0.0766 0.0070 0.4152
0.2202 0.0956 0.0000 0.0193 0.0050 0.0129 0.0092 0.0037 0.0009 0.0844 0.0061 0.4573
0.2030 0.0889 0.0000 0.0325 0.0050 0.0085 0.0068 0.0034 0.0008 0.0774
0.1768 0.0884 0.0000 0.0356 0.0045 0.0170 0.0136 0.0034 0.0008 0.0752
0.4264
0.4153
2018 $2,627,911,440
2017 $2,682,584,797
2016 $2,576,866,528
2015 $2,163,897,873
2014 $2,272,968,323
Tax Levy Extended
$11,962,049
$11,215,423
$10,891,151
$12,297,565
$12,182,604
Fund/Tax Rate General Recreation Museum Special Recreation Paving and Lighting Social Security IMRF Liability Audit Debt Service
0.1818 0.1009 0.0000 0.0353 0.0050 0.0217 0.0175 0.0078 0.0009 0.0843
0.1588 0.0989 0.0000 0.0204 0.0049 0.0209 0.0190 0.0152 0.0009 0.0792
0.1394 0.1029 0.0000 0.0208 0.0042 0.0234 0.0277 0.0210 0.0009 0.0823
0.1598 0.1226 0.0000 0.0224 0.0050 0.0278 0.0330 0.0250 0.0011 0.1717
0.1468 0.1167 0.0000 0.0213 0.0050 0.0265 0.0314 0.0238 0.0011 0.1636
0.4552
0.4182
0.4226
0.5684
0.5365
Fund/Tax Rate General Recreation Museum Special Recreation Paving and Lighting Social Security IMRF Liability Audit Debt Service Levy Adjustment PA Total Tax Rate
0.4277
2022 3204280347
*Taxes/rates for 2023 Levy Year are estimated
Tax Levy Year Equalized Assessed Value
Total Tax Rate
53
Appendix C Operating/Non-Operating Surplus by Fund Reconciliation of Financial Table on Page 5 2024 Budget 2023 YE Projection 24,961,267 $ 25,771,687 $ 21,898,162 18,922,125 3,873,525 6,039,142
2023 Budget 23,040,475 $ 19,410,425 3,630,050
2022 Final 22,416,100 $ 16,032,387 6,383,713
2021 Final 16,627,853 A 13,397,017 B 3,230,835 C
2,809,263 (7,355,400) (2,460,463) (3,133,075)
2,616,863 (6,496,506) (2,407,464) (2,657,057)
10,564,743 (3,048,748) (2,369,710) 11,529,999
3,211,227 D (10,044,116) E (2,268,999) F (5,871,053) G
$
2024 Budget 2023 YE Projection 7,532,777 $ 8,146,994 $ 16,612,910 15,273,273 400,000 400,000 850,000 800,000 150,000 150,000 200,000 165,000 26,000 26,000 25,771,687 $ 24,961,267 $
2023 Budget 7,232,229 $ 14,267,246 400,000 800,000 150,000 165,000 26,000 23,040,475 $
2022 Final 8,085,922 $ 13,001,348 538,288 427,151 228,398 110,472 24,521 22,416,100 $
2021 Final 6,702,936 8,381,098 961,976 253,151 202,521 101,261 24,910 16,627,853 A
Total Operating Expense
$
2024 Budget 2023 YE Projection 7,015,457 5,939,979 12,968,200 11,245,145 499,801 480,810 848,929 756,000 216,315 196,526 323,660 278,465 25,800 25,200 21,898,162 $ 18,922,125 $
2023 Budget 6,444,653 11,283,216 491,542 744,521 157,120 264,173 25,200 19,410,425 $
2022 Final 5,039,157 9,427,834 2,751 442,146 584,279 276,128 235,492 24,600 16,032,387 $
2021 Final 4,432,728 7,122,425 786,183 477,843 372,513 181,115 24,211 13,397,017 B
Operating Surplus
$
6,039,142 $
3,630,050 $
6,383,713 $
3,230,836 C
2024 Budget 2023 YE Projection 150,000 $ 10,000 $ 2,459,263 2,406,863 200,000 524,623 2,809,263 $ 2,941,486 $
2023 Budget 10,000 $ 2,406,863 200,000 2,616,863 $
2022 Final 111,207 $ 2,284,163 8,169,373 10,564,743 $
2021 Final 148,061 2,291,861 771,305 3,211,227 D
2024 Budget 2023 YE Projection
2023 Budget
2022 Final
2021 Final 111,133 145,253 9,787,731 10,044,116 E 2,268,999 12,313,114 F (5,871,052) G
Operating Revenue Expense Operating Surplus
$
Non-Operating Revenue Capital Expense Debt Expense Net Surplus Operating Revenue General Fund Recreation Museum Special Recreation Paving & Lighting Social Security IMRF Liability Audit Debt Service Capital Projects Total Operating Revenue
Operating Expense General Fund Recreation Museum Special Recreation¹ Paving & Lighting Social Security IMRF Liability Audit Debt Service Capital Projects
Non-Operating Revenue Paving & Lighting Debt Service Capital Projects Total Non-Operating Revenue
Non-Operating Expense Capital Expense Special Recreation Paving & Lighting Museum Capital Projects
$
$
$
Total Non-Operating Expense
$
100,000 $ 200,000 0 7,055,400 7,355,400 $ 2,460,463 9,815,863 $
Net Surplus
$
(3,133,075) $
Total Capital Expense
Debt Service
$
3,873,525 $
$
¹ Excludes ADA capital projects
2,941,486 (5,466,384) (2,407,464) 1,106,780
-
5,466,384 5,466,384 $ 2,407,464 7,873,848 $
6,496,506 6,496,506 $ 2,407,464 8,903,970 $
22,500 $ 135,357 2,890,891 3,048,748 $ 2,369,710 5,418,458 $
1,106,780 $
(2,657,057) $
11,529,999 $
0
54
$
-
0
$
Appendix D Detail by Fund General Fund Revenue Taxes and Bonds Interest Daily Fees Program Fees Memberships Facility Rentals Retail Sales Other
Total
Proposed Estimate Budget Final Final Final 2024 Budget 2023 2023 2022 2021 2020 $ 6,998,530 $ 7,050,000 $ 6,957,116 $ 6,942,829 $ 6,380,011 $ 5,235,737 325,000 925,000 100,000 109,220 66,377 448,144 209,247 171,994 175,113 1,033,873 256,548 194,919
2024 vs 2023 2024 vs 2023 Budget Estimate $ 41,414 $ (51,470) 225,000 (600,000) 34,134 37,253
7,532,777
8,146,994
7,232,229
8,085,922
6,702,936
5,878,800
300,548
(614,217)
3,594,656 757,191 1,960,601 90,500 528,909
3,109,971 641,318 1,568,382 72,500 486,034
3,362,237 614,180 1,832,167 98,000 478,741
2,656,240 534,364 1,338,695 76,836 408,548
2,472,225 547,907 1,072,229 45,911 282,732
Other
83,600
61,774
59,328
24,475
11,723
2,482,763 572,674 1,063,757 56,076 296,307 (646,224)
232,419 143,011 128,434 (7,500) 50,168 24,272
484,685 115,873 392,219 18,000 42,875 21,826
Total
7,015,457
5,939,979
6,444,653
5,039,157
4,432,728
3,825,352
570,804
1,075,478
517,320
2,207,015
787,576
3,046,766
2,270,209
2,053,448
(270,256)
(1,689,695)
Expenditures Salaries Benefits Contractual R&M Supplies Debt Service Capital
Net Surplus
Recreation Fund Revenue Taxes and Bonds
Proposed Estimate Budget Final Final Final 2024 Budget 2023 2023 2022 2021 2020 $ 2,982,300 $ 2,784,600 $ 2,784,600 $ 2,598,242 $ 2,632,775 $ 2,511,422
2024 vs 2023 2024 vs 2023 Budget Estimate 197,700 $ 197,700
Interest Daily Fees Program Fees Memberships Facility Rentals Retail Sales Other
Total
$ 3,510,139 $ 3,332,307 $ 3,023,804 $ 2,735,990 6,452,390 5,597,721 5,170,300 4,482,908 1,262,019 1,190,856 1,054,061 1,052,247 1,862,136 1,837,266 1,762,235 1,674,566 301,700 327,291 270,650 260,125 242,226 203,232 201,596 197,270
1,259,268 2,571,582 662,993 1,013,398 114,121 126,960
522,719 2,426,688 57,850 721,993 89,940 232,431
486,335 1,282,090 207,958 99,901 31,050 40,630
177,832 854,669 71,163 24,870 (25,591) 38,994
16,612,910
15,273,273
14,267,246
13,001,348
8,381,098
6,563,043
2,345,664
1,339,637
7,509,788 920,745 2,813,820 119,550 1,395,150
6,502,693 623,064 2,550,547 102,919 1,326,067
6,368,894 844,724 2,556,076 112,600 1,249,968
5,149,272 754,745 2,173,192 102,486 1,159,633
3,935,891 671,978 1,562,677 92,990 791,139
Other
209,147
139,855
150,954
88,506
67,750
3,126,779 660,948 1,475,308 53,464 506,248 740,297
1,140,894 76,021 257,744 6,950 145,182 58,193
1,007,095 297,681 263,273 16,631 69,083 69,292
Total
12,968,200
11,245,145
11,283,216
9,427,834
7,122,425
6,563,043
1,684,984
1,723,055
Net Surplus
3,644,710
4,028,128
2,984,030
3,573,514
1,258,673
-
660,680
(383,418)
Expenditures Salaries Benefits Contractual R&M Supplies Debt Service Capital
55
Appendix D Detail by Fund Museum Revenue
Proposed 2024 Budget
Estimate 2023
Budget 2023
$
Taxes and Bonds Interest Daily Fees Program Fees Memberships Facility Rentals Retail Sales Other
Total
-
-
-
Expenditures Salaries Benefits Contractual Supplies Debt Service Capital Other
Final 2022
-
-
$
Final 2021
-
-
$
Final 2020
-
-
2024 vs 2023 2024 vs 2023 Budget Estimate $ $ -
-
-
-
-
-
2,751 -
-
-
-
-
Total
-
-
-
2,751
-
-
-
-
Net Surplus
-
-
-
(2,751)
-
-
-
-
Special Recreation (NSSRA) Revenue Taxes and Bonds Interest Daily Fees Program Fees Memberships Facility Rentals Retail Sales Other
Total
Proposed Estimate Budget 2024 Budget 2023 2023 $ 400,000 $ 400,000 $ 400,000 $ -
Final 2022 495,107 $ 43,181
Final Final 2021 2020 961,976 $ 1,012,291 961,976
400,000
400,000
400,000
538,288
499,801
480,810
491,542
442,146
786,183
100,000
-
-
22,500
111,133
Total
599,801
480,810
491,542
464,646
Net Surplus
(199,801)
(80,810)
(91,542)
73,641
Expenditures Salaries Benefits Contractual
1,012,291
-
-
387,796 578,100 -
18,991 100,000 -
8,259 100,000 -
897,316
965,896
118,991
108,259
64,660
46,395
(118,991)
(108,259)
Supplies Debt Service Capital Other
56
2024 vs 2023 2024 vs 2023 Budget Estimate $ $ -
Appendix D Detail by Fund Paving & Lighting Fund Revenue Taxes and Bonds Interest Daily Fees Program Fees Memberships Facility Rentals Retail Sales Other
Total
Proposed Estimate Budget 2024 Budget 2023 2023 $ 150,000 $ 10,000 $ 10,000 $ 150,000
10,000
Expenditures Salaries Benefits Contractual Supplies Debt Service
10,000
-
Final 2022 111,207 $ -
Final 2021 148,061 $
Final 2020 126,536 -
2024 vs 2023 2024 vs 2023 Budget Estimate $ 140,000 $ 140,000 -
111,207
148,061
126,536
140,000
140,000
135,357
145,253 -
10,326 -
200,000 -
200,000 -
200,000
-
Total
200,000
-
-
135,357
145,253
10,326
200,000
200,000
Net Surplus
(50,000)
10,000
10,000
(24,149)
2,808
116,210
(60,000)
(60,000)
Final 2022 427,151 $ -
Final 2021 253,151 $
Final 2020 482,966 -
253,151
482,966
50,000
50,000
414,971 -
104,408 -
92,929 -
Capital Other
Social Security Fund Revenue Taxes and Bonds Interest Daily Fees Program Fees Memberships Facility Rentals Retail Sales Other
Total
Proposed Estimate Budget 2023 2024 Budget 2023 $ 850,000 $ 800,000 $ 800,000 $ -
2024 vs 2023 2024 vs 2023 Budget Estimate $ 50,000 $ 50,000 -
850,000
800,000
800,000
427,151
Other
848,929 -
756,000 -
744,521 -
584,279 -
Total
848,929
756,000
744,521
584,279
477,843
414,971
104,408
92,929
1,071
44,000
55,479
(157,128)
(224,691)
67,994
(54,408)
(42,929)
Expenditures Salaries Benefits Contractual Supplies Debt Service Capital
Net Surplus
477,843
57
Appendix D Detail by Fund Illinois Municipal Retirement Fund Revenue Taxes and Bonds Interest Daily Fees Program Fees Memberships Facility Rentals Retail Sales Other
Total
Proposed Estimate Budget 2024 Budget 2023 2023 $ 150,000 $ 150,000 $ 150,000 $ -
Final 2022 228,398 $ -
Final 2021 202,521 $
Final 2020 386,373 -
2024 vs 2023 2024 vs 2023 Budget Estimate $ $ -
202,521
386,373
-
-
370,930 -
59,195 -
19,789 -
150,000
150,000
150,000
228,398
Other
216,315 -
196,526 -
157,120 -
276,128 -
Total
216,315
196,526
157,120
276,128
372,513
370,930
59,195
19,789
Net Surplus
(66,315)
(46,526)
(7,120)
(47,729)
(169,991)
15,443
(59,195)
(19,789)
Final 2022 110,472 $ -
Final 2021 101,261 $
Final 2020 96,593 -
Expenditures Salaries Benefits Contractual Supplies Debt Service Capital
Liability Fund Revenue Taxes and Bonds Interest Daily Fees Program Fees Memberships Facility Rentals Retail Sales Other
Total
Estimate Budget Proposed 2024 Budget 2023 2023 $ 200,000 $ 165,000 $ 165,000 $ -
372,513
2024 vs 2023 2024 vs 2023 Budget Estimate $ 35,000 $ 35,000 -
200,000
165,000
165,000
110,472
101,261
96,593
35,000
35,000
Other
323,660 -
278,465 -
264,173 -
235,492 -
181,115 -
212,556 -
59,487 -
45,195 -
Total
323,660
278,465
264,173
235,492
181,115
212,556
59,487
45,195
Net Surplus
(123,660)
(113,465)
(99,173)
(125,020)
(79,855)
(115,963)
(24,487)
(10,195)
Expenditures Salaries Benefits Contractual Supplies Debt Service Capital
58
Appendix D Detail by Fund Audit Fund Revenue Taxes and Bonds Interest Daily Fees Program Fees Memberships Facility Rentals Retail Sales Other
Proposed Estimate Budget 2024 Budget 2023 2023 $ 26,000 $ 26,000 $ 26,000 $ -
Total
Final 2022 24,521 $ -
Final 2021 24,910 $ -
Final 2020 23,182 -
2024 vs 2023 2024 vs 2023 Budget Estimate $ $ -
26,000
26,000
26,000
24,521
24,910
23,182
-
-
Other
25,800 -
25,200 -
25,200 -
24,600 -
24,211 -
24,100 -
600 -
600 -
Total
25,800
25,200
25,200
24,600
24,211
24,100
600
600
200
800
800
(79)
699
(918)
(600)
(600)
Expenditures Salaries Benefits Contractual Supplies Debt Service Capital
Net Surplus
Bond & Interest Revenue Taxes and Bonds Interest Daily Fees Program Fees Memberships Facility Rentals Retail Sales Other
Total
Proposed Estimate Budget Final Final Final 2024 Budget 2023 2023 2022 2021 2020 $ 2,459,263 $ 2,406,863 $ 2,406,863 $ 2,284,163 $ 2,291,861 $ 2,137,069 -
2024 vs 2023 2024 vs 2023 Budget Estimate $ 52,400 $ 52,400 -
2,459,263
2,406,863
2,406,863
2,284,163
2,291,861
2,137,069
52,400
52,400
1,200
600
600
636
636
Other
2,459,263 -
2,406,864 -
2,406,864 -
2,299,774 -
2,268,363 -
2,215,317 -
600 52,399 -
600 52,399 -
Total
2,460,463
2,407,464
2,407,464
2,300,410
2,268,999
2,215,317
52,999
52,999
(1,200)
(601)
(601)
(16,247)
22,862
(78,248)
(599)
(599)
Expenditures Salaries Benefits Contractual Supplies Debt Service Capital
Net Surplus
59
Appendix D Detail by Fund Capital Project Fund Revenue Taxes and Bonds
Proposed Estimate 2024 Budget 2023 $ $ -
Budget 2023 $ -
Final 2022 $ 7,889,400 $
Interest Daily Fees Program Fees Memberships Facility Rentals Retail Sales Other
200,000
Total
200,000
524,623 524,623
200,000
279,973
200,000
8,169,373
Final Final 2021 2020 771,305 $ 6,249,337 2,095,134 771,305
Expenditures Salaries Benefits
69,300
Contractual Supplies Debt Service
2024 vs 2023 2024 vs 2023 Budget Estimate $ $ (324,623)
8,344,471
-
(324,623)
85,613 19,666,099 -
558,894 -
1,589,016 -
7,055,400 -
5,466,384 -
6,496,506 -
2,890,891 -
9,787,731
Other
Total
7,055,400
5,466,384
6,496,506
2,960,191
9,787,731
19,751,711
558,894
1,589,016
Net Surplus
(6,855,400)
(4,941,761)
(6,296,506)
5,209,182
(9,016,426)
(11,407,240)
(558,894)
(1,913,639)
Other
Proposed 2024 Budget 14,216,093 325,000 3,510,139 6,452,390 1,262,019 1,862,136 301,700 651,473
Estimate 2023 13,792,463 925,000 3,332,307 5,597,721 1,190,856 1,837,266 327,291 899,849
Budget 2023 13,699,579 100,000 3,023,804 5,170,300 1,054,061 1,762,235 270,650 576,709
Final 2022 21,111,491 109,220 2,735,990 4,482,908 1,052,247 1,674,566 260,125 1,554,298
Final 2021 13,767,832 66,377 1,259,268 2,571,582 662,993 1,013,398 114,121 383,508
Final 2020 18,261,505 448,144 522,719 2,426,688 57,850 721,993 89,940 2,522,484
Total
28,580,950
27,902,753
25,657,338
32,980,843
19,839,079
25,051,324
2,923,612
678,197
Other
11,104,444 2,743,180 5,624,882 210,050 1,924,059 2,459,263 7,355,400 292,747
9,612,664 2,216,908 4,904,004 175,419 1,812,101 2,406,864 5,466,384 201,629
9,731,131 2,360,545 5,169,758 210,600 1,728,709 2,406,864 6,496,506 210,282
7,805,512 2,149,515 4,284,061 179,322 1,568,180 2,299,774 3,051,500 112,980
6,408,116 2,070,240 3,627,051 138,902 1,073,871 2,268,363 10,044,116 79,473
5,609,541 2,019,523 3,249,129 109,540 802,555 2,215,317 20,254,524 94,073
1,373,313 382,635 455,124 (550) 195,350 52,399 858,894 82,465
1,491,780 526,272 720,878 34,631 111,958 52,399 1,889,016 91,118
Total
31,714,025
26,795,973
28,314,395
21,450,845
25,710,132
34,354,202
3,399,630
4,918,052
Net Surplus
(3,133,075)
1,106,780
(2,657,057)
11,529,999
(5,871,052)
(9,302,879)
(476,018)
(4,239,855)
Capital
Consolidated Revenue Taxes and Bonds Interest Daily Fees Program Fees Memberships Facility Rentals Retail Sales
Expenditures Salaries Benefits Contractual R&M Supplies Debt Service Capital
60
2024 vs 2023 2024 vs 2023 Budget Estimate $ 516,514 $ 423,630 225,000 (600,000) 486,335 177,832 1,282,090 854,669 207,958 71,163 99,901 24,870 31,050 (25,591) 74,764 (248,376)
Appendix E Glossary Annual Budget – A plan proposed by the Park District Board of Commissioners for raising and expending monies for the recreation interests of residents ACFR – Annual Comprehensive Financial Report Appropriations – Amounts expended for the administration, maintenance and management of properties and programs for the Northbrook Park District B & A – Budget and Appropriations Ordinance considered by the Board of Commissioners Board of Commissioners – Elected board of seven, elected at-large by residents of the Northbrook Park District CIP – District-wide Capital Improvement Plan CPRP –Certified Park and Recreation Professional, a designation for professionals with a bachelor’s or higher degree, who meet certain years of experience and successfully pass a NRPA examination Committee-of-the-Whole – Board of Commissioners Committee consisting of all the Board members and chaired by the Board President Deferred Projects – Capital projects that were appropriated and considered important enough for continued work in the next fiscal year. EAV – Equalized Assessed Valuation, property value on which real estate taxes are levied Fund – Fiscal and accounting tool with a self-balancing set of accounts to record revenue and expenditures GFOA – Government Finance Officers Association, a group that promotes the professional management of governments for the public benefit. IAPD – Illinois Association of Park Districts, a statewide organization of park districts that promotes quality of life through education, research and advocacy. IMRF – Illinois Municipal Retirement Fund, a state-established retirement fund for municipal workers IPRA – Illinois Parks and Recreation Association, a statewide organization of park and recreation professionals advocating the benefits of parks, recreation and conservation Major/Non-Major Funds – A fund is considered major if it is the primary operating fund of the District or its assets, liabilities, revenues or expenses are at least 10% of the corresponding total for all funds. Modified Accrual Accounting – An accounting method commonly used by government agencies. Revenues are recognized when they become available and measurable; expenditures generally are recognized when liabilities are incurred. NRPA – National Recreation and Parks Association, an organization of citizen boards and professionals interested in parks and recreation operations in the United States NSSRA – Northern Suburban Special Recreation Association, an association of 13 park districts and villages that pool resources to serve adults and children with special needs 61
Appendix E Glossary PDRMA – Park District Risk Management Agency, an association of more than 150 park and conservation districts that pool resources to maximize safe park conditions while managing the risk of recreation activities Tax Levy – The amount of property tax dollars the park district requests in the subsequent fiscal year Tax Rate – Derived by dividing the tax levy by the total EAV
62
Appendix F Employee Headcount by Type
The Park District has several classifications of employees. The first distinction is if the employee works more than 1,000 hours per year. Those employees contribute to and eventually may be eligible for retirement benefits from the Illinois Municipal Retirement Fund (IMRF). Within the IMRF classification are year-round, full-time; year-round, part-time and seasonal, part-time employees. Full-time employees receive additional benefits, such as vacation and health insurance. Part-time IMRF employees receive paid time off benefits similar to the vacation benefits offered to full-time staff, but at a reduced amount. Non-IMRF employees work less than 1,000 hours per year but may work many hours during the summer season, such as camp counselors or pool lifeguards. In addition, some part-time, non-IMRF employees work throughout the year as program instructors for special projects or programs. The table below illustrates the allocation of full-time and part-time IMRF positions by Division for the previous, current and upcoming budget years. During 2020 the District reduced the number of seasonal workers hired back within the Golf Maintenance Department as full-time maintenance labor was reallocated to leverage capacity experienced within the Recreation Division. The District continued to reduce staffing in 2021 reflecting the impact to program participation caused by the pandemic. The 2024 budget includes two additional full-time positions for Recreation in addition to one additional in Administration and Golf Operations. Total employee headcount totals are more in line with the prepandemic levels as staffing has increased relative to the lower levels in recent years. Admin
Parks
Golf
Recreation
Total
FT - IMRF PT - IMRF Total 2020
14.00 2.00 16.0
22.50 10.00 32.5
5.50 18.00 23.5
34.00 19.00 53.0
76.00 49.00 125.0
FT - IMRF PT - IMRF Total 2021
14.00 2.00 16.0
18.50 12.00 30.5
5.50 14.00 19.5
30.00 15.00 45.0
68.00 43.00 111.0
FT - IMRF PT - IMRF Total 2022
15.00 1.00 16.0
20.00 12.00 32.0
6.00 15.00 21.0
32.00 18.00 50.0
73.00 46.00 119.0
FT - IMRF PT - IMRF Total 2023
15.00 1.00 16.0
20.00 12.00 32.0
9.00 14.00 23.0
32.00 18.00 50.0
76.00 45.00 121.0
FT - IMRF PT - IMRF Total 2024
16.00 1.00 17.0
20.00 12.00 32.0
10.00 14.00 24.0
34.00 18.00 52.0
80.00 45.00 125.0
2020 Budget
2021 Budget
2022 Budget
2023 Budget
2024 Budget
63
Appendix G Performance Measures
The District reviews and evaluates a variety of Performance Measures which serve as a management tool and benchmark progress toward accomplishing the District’s mission, goals and objectives across all Divisions. Our Mission is to enhance our community by providing outstanding services, parks and facilities through environmental, social and financial stewardship. The monitoring and improvement of our performance measures supports our vision to be recognized as a national leader in delivering innovative services based on responsiveness, trust and accountability to our community. Financial – Performance Measures Division goals include: • • • •
Maintain healthy fund balances in accordance with policy. Manage capital project spending based on District approved plans. Improve financial sustainability and the percentage of non-tax revenue. Demonstrate sound financial management and financial stewardship of taxpayer funds.
Notes: Strong fund balances are maintained above policy target of managing to 50% of total operating expenditures in the General Fund.
64
Appendix G Performance Measures
Notes: Capital spending increased significantly in 2020 related to the construction projects at Techny Prairie Activity Center, Heritage Oaks Golf Club and the Northbrook Sports Center.
Percent of Revenue - Non-Tax Sources 60.0% 55.0% 50.0% 45.0%
47.5%
47.3%
47.6%
40.0%
36.1%
35.0%
34.5%
30.0% 25.0% 20.0%
2018
2019
2020
2021
2022
Notes: The District has a goal to continue the Financial Sustainability Plan (FSP) process through collaboration among the Recreation and Finance Divisions to study the FSP information, adapt as necessary and apply findings to program and service offerings and pricing strategies. 65
Appendix G Performance Measures Golf Operations – Performance Measures The Division has a goal to improve the overall quantity and quality of rounds played and revenue statistics in alignment with the Golf Operations Division budget and District financial goals.
Notes: Lower round totals in 2020 and 2021 are due to course closure during clubhouse construction and course renovation. The 2023 round total is one of the highest in recent District history.
66
Appendix G Performance Measures
Notes: Lower round totals in 2020 and 2021 are due to course closure. The 2023 merchandise sales estimated totals are significantly above pre-pandemic results in 2019. Recreation – Performance Measures The Division’s goal is to improve membership and program statistics in alignment with the Recreation Division budget and District financial goals.
Notes: Techny Prairie Activity Center opened in 2021 and total memberships have been steadily increasing since opening.
67
Appendix G Performance Measures Pool Attendance 60,000 50,521
50,000 45,745
40,000
42,550 34,019
30,000 20,000 10,000 0
2019
0 2020
2021
2022
2023
Notes: Both pools were closed in 2020 due to the pandemic. In 2021 Meadowhill Aquatic Center was open and the Sports Center Pool was closed due to the roof replacement project.
Senior Center Memberships 700 600
576
500
400
400 340
300
188
200
233
100 -
2019
2020
2021
2022
2023 YTD Nov
Notes: Senior Center memberships were especially affected during the pandemic. Staff continue to engage with the Senior community to provide programs and activities to this important segment. 68
Appendix G Performance Measures Scholarship Awards Total Granted $35,000
$33,035
$30,000 $25,000 $20,000 $15,000 $10,000
$0
$7,494
$5,500
$5,000
2019
$3,539 $0 2020
2021
2022
2023
Notes: Total Scholarship Awards granted increased significantly in 2023 following increased offerings available to a larger number of participants for before and after school programs.
Activity Registrations by Category 10,000 9,000 8,000 7,000 6,000 5,000 4,000 3,000 2,000 1,000 0
Adult
Adult (55+)
All Ages
2019
2021
2020
Early Childhood 2022
Youth
2023
Notes: Activity registrations improved significantly in 2023 approaching and in some categories surpassing prepandemic levels.
69
Appendix G Performance Measures
Marketing and Communications – Performance Measures The Divisional goal is to increase outreach and engagement with the community to increase awareness to District offerings.
Social Media Followers Facebook and Instagram Only 9,000 8,000
7,815
7,000
7,066
6,000
5,680
5,000 4,000 3,000
5,043
4,315
2,000 1,000 -
2019
2020
2021
2022
2023
Notes: Social media growth is organic in most cases with some paid marketing to target segments.
Email Subscribers Park District Information 12000 10000 8000
9618 8482
6000
9334
9157
7637
4000 2000 0
2019
2020
2021
2022
2023
Notes: The email subscription list is grown through engagement opportunities at community events and through print publications.
70
Appendix G Performance Measures
Notes: In an effort to improve programs, events and amenities, a comprehensive survey process was developed in 2023 to create more accurate benchmarking data.
71
This page left blank intentionally.
72
Northbrook Residents
Organizational Chart Full-time Positions
Park Board of Commissioners
Reviewed November 28, 2023
Administrative Assistant
Director of Parks & Properties
Executive Administrative Assistant
Executive Director
Auditor
Director of Finance & Technology
Director of Golf Operations
Attorney
Director of Marketing & Communications
Superintendent of Grounds &
Golf Maintenance Supervisor
Crew Leader Golf
Trades Manager
Facility Maintenance Supervisor
FMW III Crew Leader Grounds
Superintendent of Athletics and Facilities
Superintendent of Arts and Recreation
Facility & Fleet Manager
Grounds Supervisor
Director of Recreation
Planning & Project Manager
Head Golf Professional Manager
Business Manager
IT Manager
Risk Manager
Marketing & Communications Manager
Recreation Manager
Visual & Performing Arts Manager
Sports Center Manager
Projects & Operations Supervisor
Golf Operations Supervisor
Accountant
Systems Administrator
Human Resources Generalist
Graphic Design & Brand Specialist
Recreation Supervisor Early Childhood
Theatre Technical Specialist
Recreation Supervisor Ice Skating
Recreation Supervisor Athletics
Rental and Membership Coordinator
Outside Services Supervisor
Accounting Specialist
Recreation Supervisor Youth Programs
Recreation Supervisor Performing Arts
Recreation Supervisor Aquatics & Ice
Recreation Supervisor Athletics
Fitness Supervisor
Recreation Specialist AC & Camp
Registration Supervisor
Recreation Supervisor Athletics
Leisure Center Facility Supervisor
Customer Service Coordinator
Customer Service Coordinator
Customer Service Coordinator
FMW III
FMW II
Human Resources Generalist
Athletics Manager
FMW III Equipment Operator/ LMW IV
Custodian Open Position
Golf Instruction Supervisor
Head Custodian FMW III
LMW III
Custodian LMW III Custodian
LMW II
FMW I
FMW I
LMW II
FMW II
Mechanic
Mechanic
FMW I
FMW II
FMW I
TPAC Manager
545 Academy Drive Northbrook, Illinois 60062 847-291-2960 nbparks.org