DAIRY MARKET REPORT VOLUME 29 | ISSUE 10
10/29/2026
EXECUTIVE SUMMARY Milk production grew 2.4% on a liquid basis in August driven largely by a 174,000 head year-over-year increase in the milking herd. Rising supply was met with divergent demand trends as superb demand for dairy proteins is juxtaposed by underwhelming consumption of cheese and butter. Consumer economic conditions have worsened in recent months, particularly for lower-income individuals, as inflation accelerated to 3.7% in September on account of elevated energy prices driving costs higher throughout the economy and tightening consumer budgets. Economic pressure has eaten away at cheese retail sales and QSR foot traffic in particular, resulting in weaker cheddar prices for the last several months until a rally in mid-October. Still, despite the economic challenges, dairy—and dairy protein in particular— remains a consumer staple. NFDM prices have once again surged amidst strong competition for skim solids, and CME dry whey prices set all-time highs as the whey stream is increasingly directed towards protein concentrates. August’s DMC margin fell to $9.34/cwt as a decline in the All-Milk Price coincided with an increase in feed costs. Although CBOT corn and soybean meal futures have eased from September highs, increases in fuel, electricity, labor, and borrowing costs continue to place pressure on producers.
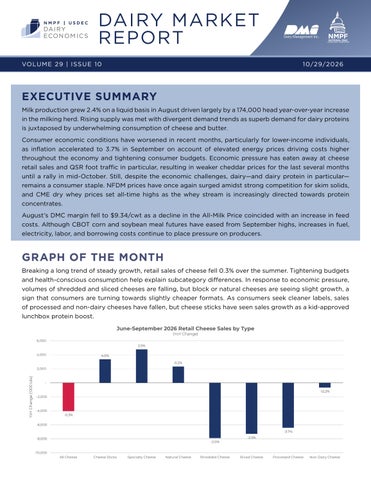
GRAPH OF THE MONTH Breaking a long trend of steady growth, retail sales of cheese fell 0.3% over the summer. Tightening budgets and health-conscious consumption help explain subcategory differences. In response to economic pressure, volumes of shredded and sliced cheeses are falling, but block or natural cheeses are seeing slight growth, a sign that consumers are turning towards slightly cheaper formats. As consumers seek cleaner labels, sales of processed and non-dairy cheeses have fallen, but cheese sticks have seen sales growth as a kid-approved lunchbox protein boost.
PRICES
RETAIL
FMMO
NDSPR
CME block cheddar prices rallied over $0.50/lb in October despite no major change in market fundamentals. NFDM prices retested May 2026 highs but began to ease by late October. CME dry whey prices set an alltime record in October since trading began in 2018 as more of the whey stream goes towards whey protein concentrates. Left out of the price rally across the dairy complex, CME butter prices remained historically low due to ample supply.
2
SEPT 2026
AUG 2026
SEPT 2025
YOY CHANGE
Cheese
$1.56
$1.61
$1.81
-$0.25
Whey
$0.67
$0.66
$0.58
$0.09
Butter
$1.44
$1.50
$2.07
-$0.63
NFDM
$1.79
$1.59
$1.25
$0.54
Base Class I
$17.04
$18.76
$18.70
-$1.66
Base Class I ESL
$17.85
$18.04
$19.23
-$1.38
Class II
$17.60
$18.71
$17.39
$0.21
Class III
$16.04
$16.64
$17.59
-$1.55
Class IV
$18.94
$17.36
$16.17
$2.77
Whole Milk (gal)
$4.11
$4.23
$4.13
-$0.02
Lowfat Milk (gal)
$3.59
$3.72
$3.65
-$0.06
Cheddar Cheese (1 lb)
$6.13
$5.98
$6.05
$0.08
Butter (1 lb)
$3.96
$4.02
$4.79
-$0.83
MARKET COMMENTARY CHEESE CME block cheddar prices jumped 42% between late September and mid-October. However, market fundamentals raise doubts around the durability of the rally. Increasing fuel prices and accelerating inflation tightened budgets for domestic consumers, and cracks are showing within the category. Domestic disappearance decreased in September, with the largest losses seen in American-type cheeses, frequently used by quick service restaurants. Retail sales have also eased slightly (see GOTM), with greater declines seen for national brands rather than private labels. Yet even as domestic sales lag, exports have become ever more important. Total cheese exports grew 9.5% year-over-year in August with rising exports to China, Southeast Asia, and throughout the Western Hemisphere. Exports of Italian-type cheeses have faired particularly well, growing 13% year-over-year, despite a small decline (-2.4%) in exports of American-type cheese.
WHEY The CME dry whey spot contract set all-time price records in October. Despite increasing production and declining domestic use, export demand pulled stocks lower, supporting firmer prices. Dry whey exports set an all-time record in August. Southeast Asia purchased 94% more dry whey than in August 2025 and exports to Canada nearly quadrupled. Last August, 49% of U.S. dry whey production was exported, which jumped to 68% this August as U.S. manufacturers look to cheaper or higher-protein alternatives. Whey protein concentrate prices have eased modestly since July, reestablishing the typical price spread between WPC80 and WPI. Both domestic use and export volumes fell in August, perhaps as end users both at home and abroad balked at higher prices or were sufficiently covered that there was little urgency to buy. Whey protein concentrate remains in demand for its functional properties and taste, but consumer budgets are tightening. Looking forward, consumer willingness to pay for WPC/WPI fortified products may become a key question for dairy markets.
BUTTER High milkfat production continues to send more cream into churns. Butter production grew 6.3% year-overyear, but almost 17% since August 2024, highlighting how strong milk production and milkfat component growth have both accelerated production. Domestically, demand for butter continues to be strong. Circana data shows that consumers have increased purchased 3.6% more butter at retail this year, aided by an 8.4% drop in average retail prices. Similarly, full-service restaurants, which tend to be major users of butter, haven’t seen foot traffic declines as severe as in quick service restaurants. As a result, domestic use of butter has grown 3.4% year-to-date. Butter exports have grown 55% in 2026, but the rate of growth is decelerating. Exports to the EU have halted as the price gap between U.S. and EU butter has narrowed, and Canada, the United States’ largest butter export market, imported 32% less butter in August. The United States’ second largest butter export destination, the Middle East-North Africa, decreased imports by 11% as increased transportation costs and the narrowing price gap to EU butter may have affected U.S. price competitiveness. In aggregate, butter production has outpaced both healthy domestic demand and historically strong exports, resulting in cold storage inventories rising counter-seasonally in August and further explaining the negative price movement in the second half of the year. Note: Data tables are available in the Appendix on Page 9
3
MARKET COMMENTARY, CONT’D NONFAT DRY MILK/SKIM MILK POWDER Continued competition for skim solids led to a second rally of NFDM prices early this Fall as milk is increasingly pulled out of the dryers. Combined NFDM/SMP production eased 1% year-over-year in August, but sits 37% below January 2021’s peak monthly production, a notable decline considering milk production growth and increased demand for skim solids from high protein consumer products. However, elevated prices might be burning off some demand internationally. Exports of NFDM/SMP fell 19% year-over-year in August as U.S. prices rose above other exporters. Even so, domestic utilization of NFDM/SMP was above August 2025 levels, likely on account of food manufacturers using NFDM as an ingredient in various applications where powder is a cost-effective ingredient compared to ultrafiltered milk or condensed skim. Note: Data tables are available in the Appendix on Page 9
FLUID MILK Total sales of fluid milk products remained steady in August, with conventional sales easing slightly (-0.1%) and organic sales growing 2.4%. Higher fat varieties continued their growth streak: whole milk sales rose 4.4% and reduced fat (2%) sales increased by 0.5%. Specialty milks are seeing increased sales as well—USDA indicates that flavored whole milk sales rose 16% in August, and Circana data shows milks with enhanced protein content have seen a 10% growth in sales this year.
4
AUG 2026
SALES (million pounds)
YOY VOLUME CHANGE
YOY PERCENT CHANGE
All Conventional Fluid Milk
3,239
-4
-0.1%
i
Whole Milk
1,320
56
4.4%
h
Reduced Fat Milk (2%)
900
5
0.5%
h
Lowfat Milk (1%)
319
-22
-6.5%
i
Skim Milk
127
-44
-25.7%
i
All Organic Fluid Milk
242
6
2.5%
h
TRENDING
CULTURED AND SOFT PRODUCTS Consumers are still looking towards yogurt and cottage cheese for protein. According to Circana, Greek yogurt sales have grown 15% YTD and Icelandic yogurt, similarly known for its protein content, has seen a 25% jump in sales volumes so far this year. Cottage cheese sales have risen 12%. Multi-serve yogurt sales have grown 15% this year as high protein yogurt becomes a staple for many households and grocery budgets come under pressure. Single-serve yogurts have seen just 0.9% growth.
AUG 2026
PRODUCTION (million pounds)
YOY VOLUME CHANGE
YOY PERCENT CHANGE
Yogurt
468,334
7,466
2%
h
Cottage Cheese
133,922
15,543
13%
h
Ice Cream
101,612
1,767
2%
h
Sour Cream
121,404
-498
0%
i
TRENDING
MILK PRODUCTION Liquid milk production rose 2.4% in August, a slight deceleration from the 2.6% growth in milk production seen thus far in 2026. August’s liquid milk production growth was due to a 174,000 head year-over-year increase in the milking herd. Yields also rebounded, growing 0.6% despite much of the country experiencing summer heat. Milkfat tests and FMMO protein tests both rose 0.04% year-over-year. Milk production in August was 6.0% above 2024 levels on a liquid basis, underscoring the strong growth seen in the past two years.
AUG 2026
YOY CHANGE
YOY PERCENT CHANGE
Milk Production (million pounds)
20,039
479
2.4%
h
# Milking Cows (1000s)
9,717
174
1.8%
h
Milk Lbs/Cow
2,062
12
0.6%
i
Milkfat
4.2%
0.04%
h
Skim Solids
9.1%
0.03%
h
Total Solids
13.3%
0.07%
h
TRENDING
Components
5
ADJACENT MARKETS • CBOT Corn and Soybean Meal Futures fell as increased yield forecasts boosted supply expectations. • The CME Feeder Cattle Index rebounded slightly from September’s year-to-date low as tightness remained in live cattle markets. • WTI Crude Oil prices remained elevated as the U.S. drew down crude oil inventories more than expected, conflict in the Middle East continued, and weather impacted domestic production.
6
DEC. 2026 CBOT CORN FUTURES
DEC. 2026 CBOT SOYBEAN MEAL FUTURES
CME FEEDER CATTLE INDEX
WEST TEXAS INTERMEDIATE CRUDE OIL SPOT PRICE
Sources: CBOT, CME, EIA
DAIRY MARGIN COVERAGE August’s DMC margin fell to $9.34/cwt due to a $0.50/cwt decrease in the All-Milk Price and a $0.09/cwt increase in feed costs. While elevated corn and soybean meal prices are anticipated to keep September and October margins below the $9.50/cwt maximum payment threshold, a forecasted increase in the All-Milk Price and moderating feed costs will raise margins for November and December.
AUG 2026
JULY 2026
AUG 2025
TRENDING
$19.80
$20.30
$20.90
i
Corn (bushel)
$4.45
$4.26
$3.96
h
Soybean Meal (ton)
$320.30
$337.96
$284.36
h
Alfalfa (ton)
$243.00
$242.00
$222.00
h
DMC Feed Costs
$10.46
$10.37
$9.38
h
DMC Margin
$9.34
$9.93
$11.52
i
All Milk Price ($/cwt) Feed Prices
7
CONSUMER DEMAND INDICATORS Inflation accelerated to 3.7% in September as elevated energy prices rippled through the economy. Diesel prices rose 42% ($2.65/gal) year-over-year, exacerbating costs throughout supply chains. Gasoline prices have risen 30% ($1.27/gal), tightening consumer budgets. In response to sticky inflation, the Fed raised interest rates in September and is likely to raise rates at least once more before the end of the year, increasing the cost of borrowing. While dairy product prices have fallen 0.7% since September 2025, low consumer sentiment and stretched budgets are resulting in declining restaurant foot traffic and trading down within the category.
SEPT 2026
AUG 2026
SEPT 2025
TRENDING
GDP Growth (%)
2.2% (Q2)
2.5% (Q1)
4.0% (Q2)
i
Unemployment Rate
4.2%
4.1%
4.4%
i
Federal Funds Effective Rate
3.8%
3.6%
4.2%
i
Index of Consumer Sentiment
48.1
51.7
55.1
i
CPI — All Products
3.7%
3.4%
3.0%
h
CPI — Dairy Products
-0.7%
-0.3%
0.7%
i
Restaurant Performance Index
100.6 (Aug)
100.3 (July)
99.4
h
LOOKING AHEAD Moderating feed costs are anticipated to bring DMC margins above the $9.50/cwt maximum payment threshold in November and December. Even so, elevated fuel costs are anticipated to result in higher operating costs and hauling charges for dairy farmers, compounding increased costs for fuel, labor, electricity, and capital that producers are currently facing. Producers are not alone in experiencing economic pressure – with diesel and gas prices poised to remain elevated, consumers are likely to continue facing tightened budgets in the coming months. As a result, retail cheese sales may continue to experience pressure, and food service foot traffic may be challenged. Even in this economic environment, dairy remains a staple, as demonstrated by resilient demand for products like yogurt and cottage cheese.
Dairy Management Inc.™ and state, regional, and international organizations work together to drive demand for dairy products on behalf of America’s dairy farmers, through the programs of the American Dairy Association®, the National Dairy Council®, and the U.S. Dairy Export Council®. Katriel Marks-Yant, National Milk Producers Federation kmarksyant@nmpf.org www.nmpf.org
8
The National Milk Producers Federation (NMPF) develops and carries out policies that advance dairy producers and the cooperatives they own. NMPF’s member cooperatives produce more than two-thirds of U.S. milk, making NMPF dairy’s voice on Capitol Hill and with government agencies.
APPENDIX See pages 3 and 4 for commentary.
CHEESE — AUGUST 2026 VOLUME (million pounds)
YOY VOLUME CHANGE
YOY PERCENT CHANGE
TRENDING
Beginning Stocks
1438.3
10.3
0.7%
h
Production
1245.4
17.2
1%
h
Imports
32.4
10.1
45%
h
2716.2
37.7
1.4%
h
Domestic Utilization
1143.4
-5.9
-0.5%
i
Exports
130.1
11.3
10%
h
Total Demand
1273.5
5.4
0%
h
1442.7
1.0
0.1%
h
VOLUME (million pounds)
YOY VOLUME CHANGE
YOY PERCENT CHANGE
TRENDING
Beginning Stocks
68.4
18.3
37%
h
Production
75.1
5.6
8%
h
Imports
0
-0.3
-100%
i
Total Supply
Ending Stocks
WHEY — AUGUST 2026
143.6
23.7
20%
h
Domestic Utilization
16
-13.5
-46%
i
Exports
66.3
26.3
66%
h
Total Demand
82.3
12.8
18%
h
61.3
10.9
22%
h
VOLUME (million pounds)
YOY VOLUME CHANGE
YOY PERCENT CHANGE
TRENDING
Beginning Stocks
332.4
0.9
0%
i
Production
187.4
11.1
6%
h
Imports*
18.5
-0.9
-4%
i
Total Supply
Total Supply
Ending Stocks
BUTTER — AUGUST 2026
540
27.6
5%
h
Domestic Utilization
208.8
0.2
0%
h
Exports
15.5
-2.1
-12%
i
Total Demand
224.3
-1.9
-1%
i
315.7
29.6
10%
h
Ending Stocks
*Imports adjusted based on data from global exports to the U.S.
NONFAT DRY MILK/SKIM MILK POWDER — AUGUST 2026
9
VOLUME (million pounds)
YOY VOLUME CHANGE
YOY PERCENT CHANGE
TRENDING
Beginning Stocks
236.5
-12.4
-5%
i
Production
162.2
-2.3
-1%
i
Nonfat Dry Milk
132.2
11.5
10%
h
Skim Milk Powder
28.9
-14.4
-33%
i
Imports
0.3
-0.1
-25%
i
Total Supply
399
-14.7
-4%
i
Domestic Utilization
76.9
16.1
26%
h
Exports
100.8
-24
-19%
i
Total Demand
177.7
-7.9
-4%
i
221.4
-6.7
-3%
i
Ending Stocks