DAIRY MARKET REPORT VOLUME 28 | ISSUE 12
12/22/2025
EDITOR’S NOTE Some of the data normally reported in the Dairy Market Report is still delayed due to the recent government shutdown. This issue reports the latest dairy data available.
OVERVIEW Falling milk prices spurred largely by an imbalance between milkfat supply and demand have continued in recent months and may continue into 2026. U.S. fluid milk sales in October were just 0.1% lower than a year earlier. Total domestic commercial use of milkfat was down moderately from a year earlier during June-August, while total skim solids use rose by 3%. U.S. exports of butter and American-type cheese were up by triple-digit percentages during July-September. Total U.S. milkfat production grew by 5.5% from a year earlier during August-October, almost two percentage points faster than liquid milk production during the same period. U.S. cheddar cheese production rose 3.2% year-over-year during August-October, down considerably from its 8.8% annual growth rate during May-July. Prices for cheese, nonfat dry milk and dry whey showed moderate changes from September to November, but butter prices dropped by over $0.40/lb during the same period. Overall retail price inflation ticked down to a 2.7% year-over-year gain in November, while average retail dairy product prices dropped by 1.6% that month. The DMC margin dropped by $1/cwt from August to October, to $10.52/cwt, mostly on a drop of $0.90/cwt in the all-milk price, to $20/cwt.
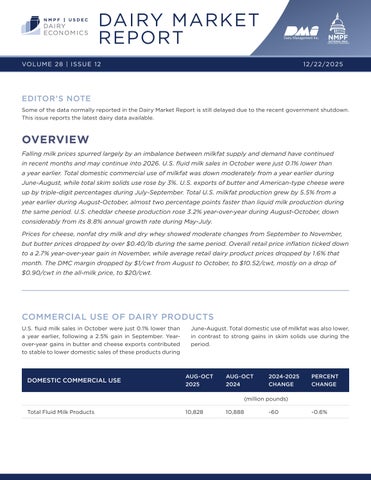
COMMERCIAL USE OF DAIRY PRODUCTS U.S. fluid milk sales in October were just 0.1% lower than a year earlier, following a 2.5% gain in September. Yearover-year gains in butter and cheese exports contributed to stable to lower domestic sales of these products during
DOMESTIC COMMERCIAL USE
June-August. Total domestic use of milkfat was also lower, in contrast to strong gains in skim solids use during the period.
AUG-OCT 2025
AUG-OCT 2024
2024-2025 CHANGE
PERCENT CHANGE
(million pounds) Total Fluid Milk Products
10,828
10,888
-60
-0.6%