DAIRY MARKET REPORT VOLUME 29 | ISSUE 9
9/29/2026
EXECUTIVE SUMMARY Liquid milk production grew 1.7% in July. While the size of the milking herd grew 1.9%, heat stress and wildfire smoke contributed to a slight decrease in milk output per cow. Turning toward markets, dairy ingredients are showing signs of strength. Nonfat dry milk prices rose into the $2.10s in late September as domestic use rose and supply remained limited. Dry whey prices are elevated too as more of the whey stream heads into whey protein concentrates. Conversely, even as butter is experiencing healthy domestic demand, growth in production volumes has outpaced domestic use. Cheese prices are also under pressure, feeling the effects of wavering consumer confidence as quick service restaurant foot traffic falls and retail sales ease. Still, exports continue to see double-digit growth, helping maintain some market balance. For producers, DMC margins declined to $9.93/cwt in July as feed costs rose. Signs of increased economic pressure on producers are growing – feed costs are expected to rise through the end of the year, elevated diesel prices are increasing hauling charges, and borrowing costs are likely to rise due to the increase in bond markets and interest rates.
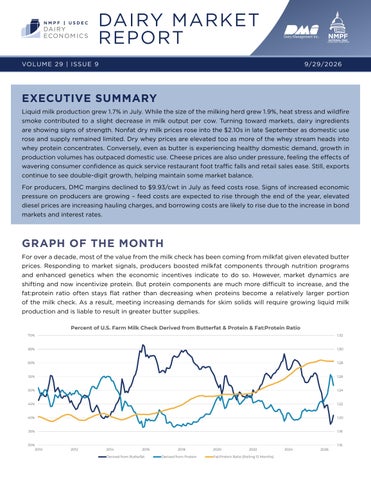
GRAPH OF THE MONTH For over a decade, most of the value from the milk check has been coming from milkfat given elevated butter prices. Responding to market signals, producers boosted milkfat components through nutrition programs and enhanced genetics when the economic incentives indicate to do so. However, market dynamics are shifting and now incentivize protein. But protein components are much more difficult to increase, and the fat:protein ratio often stays flat rather than decreasing when proteins become a relatively larger portion of the milk check. As a result, meeting increasing demands for skim solids will require growing liquid milk production and is liable to result in greater butter supplies.
PRICES
RETAIL
FMMO
NDSPR
Nonfat Dry Milk prices rebounded north of $2 per pound by late September as domestic use jumped. Dry whey prices too reached heights last seen in 2022 as more of the whey stream headed towards protein concentrates and isolates. By contrast, despite nearing the holiday buying season, CME Cheddar and Butter prices slid into the $1.30s per pound as strong product production outpaced domestic needs.
2
AUG 2026
JULY 2026
AUG 2025
YOY CHANGE
Cheese
$1.61
$1.50
$1.75
-$0.15
Whey
$0.66
$0.65
$0.58
$0.08
Butter
$1.50
$1.62
$2.48
-$0.98
NFDM
$1.59
$1.69
$1.28
$0.30
Base Class I
$18.76
$21.33
$18.93
-$0.17
Base Class I ESL
$18.04
$19.87
$19.50
-$1.46
Class II
$18.71
$21.89
$19.18
-$0.47
Class III
$16.64
$15.52
$17.24
-$0.60
Class IV
$17.36
$18.34
$18.50
-$1 .14
Whole Milk (gal)
$4.23
$4.31
$4.17
$0.06
Lowfat Milk (gal)
$3.72
$3.80
$3.66
$0.06
Cheddar Cheese (1 lb)
$5.98
$5.74
$6.12
-$0.14
Butter (1 lb)
$4.02
$3.92
$4.83
-$0.81
MARKET COMMENTARY CHEESE Cheese production rose 2% in July even as warning signs flashed for domestic demand. Circana data now shows retail sales increasing only 0.1% so far this year, and more recent time periods are showing year-over-year declines. Sales of sliced cheese declined 1.9% over the summer months as high beef prices took a toll on summer grilling. Placer.ai data also reports that quick service restaurant visits fell 2.8% in July, challenging cheese usage through food service. While demand is lackluster stateside, exports had another month of double-digit growth in July. So far this year, cheese exports have grown 24%, on top of 20% growth in 2025. Accounting for over 10% of U.S. production over the past year, exports are becoming a third pillar of demand for U.S. cheese alongside retail sales and foodservice.
WHEY U.S. dry whey is doubling down on exports. For U.S. manufacturers, it offers neither the nutrition label benefits of high protein whey nor the affordability it used to before supplies were tightened by whey stream diversions to whey protein concentrates. Domestic use of dry whey fell over 26 million pounds in July, but exports grew almost a proportional amount as China and Canada both significantly increased purchases though much of that is expected to be whey permeate. However, production increases in July sent significant volumes into storage and stocks are now sitting 37% above prior year levels, potentially limiting price upside. Whey protein concentrate prices have begun to retreat slowly from their mid-July highs as manufacturers began to consider alternatives for product formulation. Domestic demand is still strong and prices remain at historic altitudes, but the change in direction is notable and worth monitoring.
BUTTER Butter production grew 5.5% in July as increased milkfat component growth coupled with firm liquid milk production amplified total milkfat availability. Despite, or perhaps spurred by, low prices, domestic demand for butter is impressive. Retail sales have grown 3.4% YTD according to Circana, and full-service restaurant foot traffic has proven more resilient than casual dining. However, a significant portion of the growth in retail sales has been from imported products. Sales of Irish butter have grown 16% in 2026 and have accounted for 60% of the total category growth. Even with overall domestic consumption rising an impressive 4% YoY in July, supplies continue to outpace demand. Butter exports fell 8% in July, but the decline came in part due to lapping last year’s particularly strong export months to Europe driven by a sizeable discount in 2025 that has narrowed since. Despite the overall decrease, volumes increased to Mexico, Canada, Central America, and the Middle East and North Africa, which are likely to be more viable markets long-term for U.S. butter.
NONFAT DRY MILK/SKIM MILK POWDER Nonfat Dry Milk prices have rebounded back near record territory following July’s brief dip into the $1.40s. While other products like yogurt, cottage cheese, and ultrafiltered milk have been pulling skim solids out of the dryer, production of NFDM rose 27% in July and joint NFDM/SMP production rose 7.0%. So far this year, NFDM/ SMP production is 4.3% higher than in 2025. How, then, can the market sustain current price levels? Domestic utilization, which rose 126% in July, tells the story. Manufacturers may be using NFDM as a substitute for UF milk or condensed skim, which are likely still more expensive, in products like yogurt which are seeing significant sales growth. Exports of NFDM/SMP fell 23% in July as manufacturers produced NFDM for the domestic market instead of SMP and the U.S. prices were elevated above other exporters. Despite price increases, U.S. exports of NFDM/SMP to the Philippines have grown 12% YTD and volumes to Indonesia have grown 20%, likely via prebooked shipments. Note: Data tables are available in the Appendix on Page 9
3
FLUID MILK USDA’s Estimated Fluid Milk Sales Report showed 0.2% year-over-year growth in milk sales in July. Sales rose 0.5% for conventional products, led by a 5.5% increase in sales of whole milk and 1.7% increase in sales of 2% milk. With the school year quickly approaching, increased sales at higher fat levels could reflect school milk purchases under the Whole Milk for Healthy Kids Act. Circana retail data shows milk sales have slipped 0.4% year to date, although higher-protein ultrafiltered milk sales have risen 11%.
JULY 2026
SALES (million pounds)
YOY VOLUME CHANGE
YOY PERCENT CHANGE
All Conventional Fluid Milk
3,124
14
0.5%
h
Whole Milk
1,351
71
5.5%
h
Reduced Fat Milk (2%)
913
15
1.7%
h
Lowfat Milk (1%)
287
-16
-5.3%
i
Skim Milk
124
-42
-25.3%
i
All Organic Fluid Milk
235
-7
-3.0%
i
TRENDING
CULTURED AND SOFT PRODUCTS Circana retail data shows that consumers are still looking for dairy proteins at retail. So far this year, cottage cheese sales have risen 12% and yogurt sales have grown 6.5%. Even more impressive, Greek yogurts have seen a 14% boost in sales while traditional yogurt varieties have fallen by 3.7%. July USDA Dairy Product Production statistics mirrored these trends, with yogurt production rising 6% YoY and cottage cheese production growing 10%.
4
JULY 2026
PRODUCTION (million pounds)
YOY VOLUME CHANGE
YOY PERCENT CHANGE
Yogurt
477,717
28,319
6%
h
Cottage Cheese
135,039
12,370
10%
h
Ice Cream
107,190
-190
0%
i
Sour Cream
123,774
-1,366
-1%
i
TRENDING
MILK PRODUCTION Milk production increased 1.7% on a liquid basis in July. While the milking herd grew 1.9% over the past year, milk per cow declined 0.2%. Market chatter indicates that July’s high temperatures, humidity, and wildfire smoke contributed to reduced milk output per cow. However, components continued their upward climb – milkfat tests rose by 0.06% and the FMMO Protein test grew by 0.04%.
JULY 2026
YOY CHANGE
YOY PERCENT CHANGE
Milk Production (million pounds)
20,045
339
1.7%
h
# Milking Cows (1000s)
9,695
184
1.9%
h
Milk Lbs/Cow
2,068
(4)
-0.2%
h
Milkfat
4.2%
0.06%
h
Skim Solids
9.0%
0.04%
h
Total Solids
13.21%
0.10%
h
TRENDING
Components
YEAR OVER YEAR CHANGE IN MILK PRODUCTION — JULY 2026 (million pounds)
10
5
ADJACENT MARKETS • CBOT Corn and Soybean Meal Futures rose substantially as drought conditions deteriorated yield forecasts. • The CME Feeder Cattle Index eased as imports of beef resumed from Mexico but remains historically elevated. • WTI Crude Oil prices rose as disruptions to oil flows from conflict in the Middle East appeared increasingly likely to continue.
6
SEPT. 2026 CBOT CORN FUTURES
SEPT. 2026 CBOT SOYBEAN MEAL FUTURES
CME FEEDER CATTLE INDEX
WEST TEXAS INTERMEDIATE CRUDE OIL SPOT PRICE
Sources: CBOT, CME, EIA
DAIRY MARGIN COVERAGE July’s DMC margin fell to $9.93/cwt. An $0.80/cwt decrease in the All-Milk Price combined with a $0.15/cwt increase in feed prices led to a total $0.95/cwt decrease from June’s margin. Looking forward, rising corn and soybean meal futures indicate that feed costs are poised to increase rapidly to near $12.00/cwt in the last three months of the year. With CME futures suggesting only minor variation predicted in the All-Milk Price, margins are predicted to fall below the $9.50/cwt maximum payment threshold September through December.
JULY 2026
JUNE 2026
JULY 2025
$20.30
$21.10
$20.80
i
Corn (bushel)
$4.26
$4.28
$4.29
i
Soybean Meal (ton)
$337.96
$319.68
$259.10
h
Alfalfa (ton)
$242.00
$239.00
$245.00
i
DMC Feed Costs
$10.37
$10.22
$9.86
h
DMC Margin
$9.93
$10.88
$10.94
i
All Milk Price ($/cwt)
TRENDING
Feed Prices
7
CONSUMER DEMAND INDICATORS Consumer sentiment fell again in August as persistent inflation eroded discretionary spending and confidence. With jobs data indicating a steady labor market, the Fed raised interest rates in September to address lingering inflation above the 2% target. While rising prices has impacted many facets of the economy, dairy product prices at retail actually fell in aggregate in July. However, as changes to SNAP take effect, program participation has dropped almost 13% since last year. An estimated 10% of SNAP dollars are spent on dairy products.
AUG 2026
JULY 2026
AUG 2025
TRENDING
GDP Growth (%)
1.5% (Q2)
2.1% (Q1)
3.8% (Q2)
i
Unemployment Rate
4.1%
4.1%
4.3%
i
Federal Funds Effective Rate
3.6%
3.6%
4.3%
i
Index of Consumer Sentiment
51.7
55.2
58.2
i
CPI — All Products
3.4%
3.4%
2.9%
h
CPI — Dairy Products
-0.3%
-0.4%
1.3%
i
Restaurant Performance Index
100.3 (July)
100.2 (June)
99.8
h
LOOKING AHEAD Several indicators show that economic pressures on producers may increase in the coming months. A significant jump in corn and soybean meal futures is forecast to increase feed prices by 16% between July and October. Diesel prices over $6.00/gal are resulting in increased hauling charges for many producers in addition to higher costs on farm. The cost of capital may also increase due to the Fed’s September rate hike and a skittish bond market. At the same time, the All-Milk Price is anticipated to remain fairly steady as strength from NFDM and dry whey is balanced by weaker cheese and butter prices. Turning toward consumers, continued economic pressure from inflation will likely continue trends of slower quick-service restaurant foot traffic and lackluster cheese retail purchases. However, dairy products are meeting consumer demands for both high protein products and affordable staples.
Dairy Management Inc.™ and state, regional, and international organizations work together to drive demand for dairy products on behalf of America’s dairy farmers, through the programs of the American Dairy Association®, the National Dairy Council®, and the U.S. Dairy Export Council®. Katriel Marks-Yant, National Milk Producers Federation kmarksyant@nmpf.org www.nmpf.org
8
The National Milk Producers Federation (NMPF) develops and carries out policies that advance dairy producers and the cooperatives they own. NMPF’s member cooperatives produce more than two-thirds of U.S. milk, making NMPF dairy’s voice on Capitol Hill and with government agencies.
APPENDIX See page 3 for commentary.
CHEESE — JULY 2026 VOLUME (million pounds)
YOY VOLUME CHANGE
YOY PERCENT CHANGE
TRENDING
Beginning Stocks
1435.5
-9.4
-0.7%
i
Production
1264
26.4
2%
h
Imports
27.5
4.7
21%
h
2726.9
21.6
0.8%
h
Domestic Utilization
1150.1
-12
-1.0%
i
Exports
143.9
28.8
25%
h
Total Demand
1294
16.8
1%
h
1433.1
1.0
0.1%
h
VOLUME (million pounds)
YOY VOLUME CHANGE
YOY PERCENT CHANGE
TRENDING
Beginning Stocks
65.1
7.8
14%
h
Production
80.2
11.8
17%
h
Imports
0
-0.6
-100%
i
Total Supply
Ending Stocks
WHEY — JULY 2026
145.2
19
15%
h
Domestic Utilization
13.9
-26.4
-66%
i
Exports
62.9
27.2
76%
h
Total Demand
76.8
0.8
1%
h
68.4
18.3
37%
h
VOLUME (million pounds)
YOY VOLUME CHANGE
YOY PERCENT CHANGE
TRENDING
Beginning Stocks
332
-23.6
-7%
i
Production
189.2
9.8
5%
h
Imports
18.5
9.9
115%
h
Total Supply
Ending Stocks
BUTTER — JULY 2026
539.6
-3.9
-1%
i
Domestic Utilization
201
7.7
4%
h
Exports
17.2
-1.6
-9%
i
Total Demand
218.2
6.1
3%
h
321.4
-10.1
-3%
i
Total Supply
Ending Stocks
NONFAT DRY MILK/SKIM MILK POWDER — JULY 2026 VOLUME (million pounds)
YOY VOLUME CHANGE
YOY PERCENT CHANGE
TRENDING
Beginning Stocks
246
-1.7
-1%
i
Production
187.9
12.3
7%
h
Nonfat Dry Milk
165.1
34.6
27%
h
Skim Milk Powder
22
-22.4
-50%
i
0.2
-0.2
-50%
i
Imports
434.1
10.4
2%
h
Domestic Utilization
96.1
53.6
126%
h
Exports
101.5
-30.8
-23%
i
Total Demand
197.6
22.8
13%
h
236.5
-12.4
-5%
i
Total Supply
Ending Stocks
9