1 minute read
COMMUNITY

Demographics
Traffic Counts
Advertisement
The information contained is provided by WFG’s Customer Service Department to our customers, and while deemed reliable, is not guaranteed.
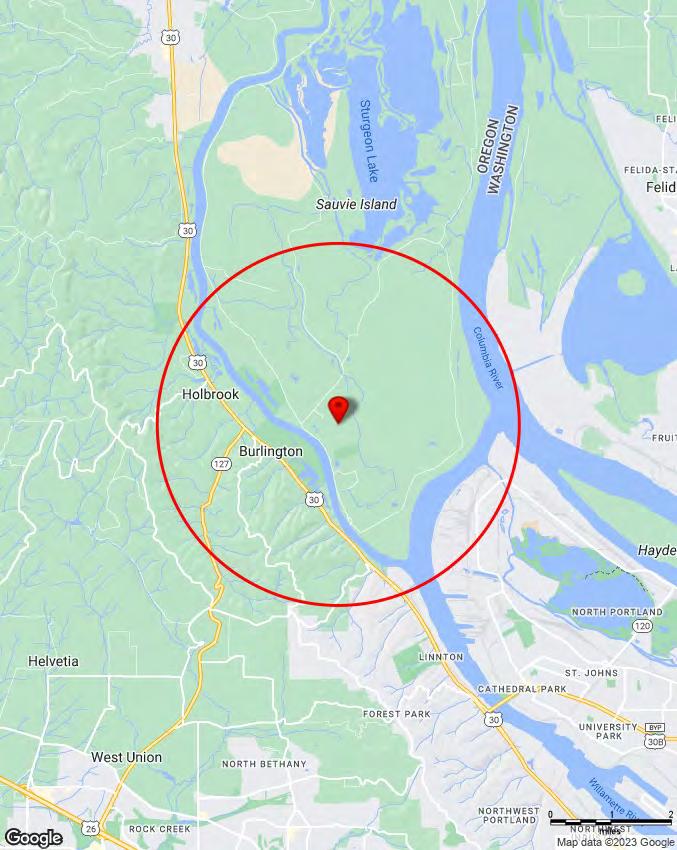
2N1W16 Tax Lot 903, Portland, OR 97231
2N1W16 Tax Lot 903, Portland, OR 97231 Sitewise Online Pop-Facts: Population Quick Facts
Copyright © Claritas, LLC 2022. All rights reserved.
Pop-Facts: Demographic Snapshot (Part 1)
2N1W16 Tax Lot 903, Portland, OR 97231 Sitewise Online
Pop-Facts: Demographic Snapshot (Part 2)
2N1W16 Tax Lot 903, Portland, OR 97231 Sitewise Online
Pop-Facts: Demographic Snapshot (Part 2)
Pop-Facts: Demographic Snapshot (Part 2)
Copyright © Claritas, LLC 2022. All rights reserved.
* This row intentionally left blank. No Total Category.
**1939 will appear when at least half of the Housing Units in this reports area were built in 1939 or earlier.
2N1W16 Tax Lot 903, Portland, OR 97231 0 - 3 mi
Copyright © Claritas, LLC 2022. All rights reserved.
Tax Lot 903, Portland, OR 97231 Sitewise
Lot 903, Portland, OR 97231
* GAFO (General merchandise, Apparel, Furniture and Other) represents sales at stores that sell merchandise normally sold in department stores. This category is not included in Total Retail Sales Including Eating and Drinking Places.
2N1W16 Tax Lot 903, Portland, OR 97231
Sitewise Online
Retail Market Power Opportunity Gap Report By Retail Store Types
Retail Market Power Opportunity Gap Report By Retail Store Types
Retail Market Power data is derived from two major sources of information. The demand data is derived from the Consumer Expenditure Survey (CE Survey or CEX), which is fielded by the U.S. Bureau of Labor Statistics (BLS). The supply data is derived from the Census of Retail Trade (CRT), which is made available by the U.S. Census. Additional data sources are incorporated to create both supply and demand estimates. The difference between demand and supply represents the opportunity gap or surplus available for each merchandise line in the specified reporting geography. When this difference is positive (demand is greater than the supply), there is an opportunity gap for that merchandise line; when the difference is negative (supply is greater than demand), there is a surplus.
Copyright © 2022 Environics Analytics. All rights reserved.
2N1W16 Tax Lot 903, Portland, OR 97231 0 - 3 mi
2022 Demand 2022 Supply Opportunity Gap/Surplus