Reporting period: 1 January – 31 December 2024 (emissions)
Includes: Climate Transition Plan 2025
Published: April 2026
FOREWORD
This report presents MSF Australia and MSF New Zealand’s 2024 emissions and ongoing actions to deliver the 2025 Climate Transition Plan. As the fourth Climate Emergency Report, it records progress toward MSF’s global goal to cut emissions 50 per cent from 2019 levels by 2030.
Since 2013, MSFA has audited greenhouse gas emissions annually and, since 2021, reported on climate transition. This report supports decision-making, outlining our pathway to reduce emissions and build resilience across governance, strategy, metrics, targets, and risk.
In 2024, total emissions were 3,701.4 tonnes of carbon dioxide equivalent (tCO₂-e), 4.4 per cent above the 2019 baseline. Emissions intensity and like-for-like emissions have declined since 2019.
We have reached a turning point. Governance, policies, and planning are in place. Achieving our targets and goals now depends on organisational commitment and sustained leadership. Without implementing the Climate Transition Plan, particularly in procurement, financial decisions, and discretionary travel, we risk missing our 2030 target.
Climate action is not negotiable; climate change is a risk multiplier for MSF. It affects our ability to operate, disrupting our supply chains and altering the predictable patterns of infectious disease. It contributes to rising medical humanitarian needs due to increased extreme weather events and
population displacement. It compounds the complexity of crisis and disaster response and disproportionately impacts the health of the most vulnerable communities we serve.
Climate action is a core responsibility of governance.
The Board oversees the Climate Transition Plan and holds management accountable to targets. Integrating climate scenario analysis into planning from 2026 will support more informed decisions and improve organisational resilience.
MSF’s role extends beyond its own operations. As a humanitarian and medical organisation, we will continue to raise awareness of the health impacts of climate change and advocate for states to meet the needs and rights of the most affected communities.
Taking climate action ensures MSF can meet growing needs as climate impacts intensify and operate amid increasing risks. By reducing emissions and building resilience, we safeguard supply chains and strengthen our core function to provide critical humanitarian medical aid to those who need it most.
Jananie Balendran, Chair ESG Committee
Katrina Penney, President MSF Australia
Executive summary
This report presents MSF Australia and MSF New Zealand’s emissions for calendar year 2024 (CY2024) and progress implementing the 2025 Climate Transition Plan.1
It tracks delivery against MSF’s global commitment to reduce emissions by 50 per cent from 2019 levels by 2030. As a medical humanitarian organisation, MSF is also increasingly responding to the health impacts of climate change and advocating for action to protect the communities most affected.
MSFA has conducted annual greenhouse gas audits since 2013 and publicly reported on climate mitigation since 2021. This report provides disclosures to support governance, planning and risk management.
The Climate Transition Plan sets out the approach to reduce emissions and strengthen organisational resilience across governance, strategy, risk, and metrics and targets. Governance, systems and policies are now established. The next phase is implementation.
Emissions performance
In 2024, total emissions were 3,701.4 tonnes of carbon dioxide equivalent (tCO₂-e):
• –1.9 per cent compared to 2023
• +4.4 per cent compared to the 2019 baseline
On a like-for-like basis, excluding expanded activities such as Kiribati and APAC, emissions are 2.5 per cent below 2019, indicating underlying progress.
Change in organisational boundary and like-for-like emissions:
Our organisational boundary has expanded since 2019 to include additional activities, such as the MSF Operational Group Geneva (OCG) Kiribati project and MSF Australia Pacific Partnership (APAC). This means total emissions are not directly comparable to the 2019 baseline.
All emissions (full scope) +4.4% vs 2019 Total emissions remain above baseline. The organisation is not yet reducing absolute emissions.
All emissions (year-on-year) –1.9% vs 2023 Small year-on-year reductions. Insufficient to meet the required trajectory.
Like-for-like emissions –2.5% vs 2019 Some underlying reductions in core activities. Offset by growth and expanded boundary.
Emissions intensity –24.6% vs 2019 Improved efficiency. Has not translated into absolute emissions reductions.
Revenue growth +38.4% vs 2019 Activity has increased significantly. Without stronger controls, growth will continue to drive emissions.
Electricity (Scope 2) –34.7% vs 2019 Structural decarbonisation delivering sustained reductions. Limited further reduction potential.
Flights (Scope 3) –37.7% vs 2019 Reductions driven by lower field travel. Temporary and expected to reverse as operations increase to meet humanitarian needs.
Discretionary travel Limited change Non-essential, long-distance travel has not reduced. This remains a key source of controllable emissions.
Supply chain (Scope 3) 98% of total emissions Emissions are concentrated in suppliers and fundraising. Reductions depend on procurement decisions and supplier engagement, which are not yet consistently applied.
Since 2019:
• Emissions intensity -24.6 per cent
• Flights -37.7 per cent
• Electricity -34.7 per cent
• Revenue +38.4 per cent
This indicates improved efficiency and partial decoupling from growth. However, absolute emissions have not declined and remain above the baseline.
Over 98 per cent of emissions occur in the supply chain and travel, primarily from suppliers, fundraising and business travel.
Reductions in flight emissions have been driven by lower field travel and are unlikely to be sustained as activity increases. Discretionary and non-essential travel has not reduced sufficiently and is now a key area for change.
• Partial decoupling of organisational growth from emissions, with activity increasing while emissions intensity has declined.
• Structural decarbonisation in electricity and parts of the supply chain, delivering steady reductions in emissions intensity.
• Temporary reductions in operational activity, particularly lower field travel, which have reduced emissions but are expected to reverse.
Improvements in direct, supplier-specific measurement in future reporting periods will provide a clearer view of absolute emissions reductions. Combined with ongoing economy-wide decarbonisation in Australia, this is expected to support steady reductions to 2030, provided implementation of the Climate Transition Plan is sustained.
Progress toward targets
• MSF has committed to reduce emissions by 50 per cent by 2030 from a 2019 baseline.
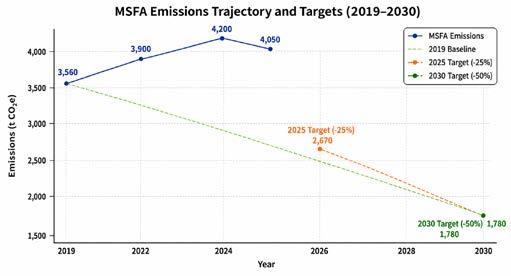
• To meet the 2025 interim target (–15 per cent), emissions must reduce to 3,013.7 tCO₂-e.
• The 2030 target (–50 per cent) requires emissions to fall to 1,587 tCO₂-e.
• Achieving the 2030 target will require sustained reductions, particularly in supply chain emissions.
Climate Transition Plan implementation (2025)
The Climate Transition Plan has strengthened governance and emissions management:
• Climate risk embedded in procurement and financial planning
• Supplier Engagement Strategy implemented
• Improved supply chain (Scope 3) measurement
• Paper sourcing reforms (90 per cent certification target by 2026)
• Initial allocation of a portion of cash reserves (5 million AU$) to low carbon deposits2
• Increased internal capability and advocacy
From 2026, climate scenario analysis will be integrated into planning.
Carbon mitigation key messages
• MSF has a clear approach to climate action, with governance, stakeholder support and the Climate Transition Plan in place. Revenue has increased by 38 per cent since 2019, and emissions intensity has improved
• Total emissions are still above the 2019 baseline, mainly due to an expanded reporting boundary. On a like-for-like basis, emissions have reduced
• Around 98 per cent of emissions come from the supply chain and travel. Reductions depend on procurement decisions, supplier engagement and travel behaviour
• Emissions are expected to start declining over the next few years as suppliers reduce their emissions and MSF’s systems and policies are put into practice
• Meeting the 2030 target depends on leadership implementing the Climate Transition Plan commitments and driving behaviour change across procurement, financial decisions and travel
Governance
Climate governance is integrated into MSFA oversight structures.
• Board approves Climate Transition Plan and report
• ESG Committee monitors progress
• Annual external review improves data quality
MSFA is aligning with ISSB / AASB S2 frameworks.3
Scenario analysis will be undertaken in 2026.
Climate governance is a core responsibility of MSFA and MSFNZ. Climate change is a foreseeable and escalating risk that affects the communities we serve and the resilience of our operations.4
Australia’s climate-related financial disclosure standard aligned with the ISSB framework.5 The ISSB standards promote globally consistent and comparable sustainability-related disclosures. As a not-forprofit MSFA and MSFNZ are not currently subject to mandatory reporting under Australian Accounting Standards Board (AASB).6
We align our disclosures with this framework to improve transparency so we can strengthen management of climate-related risks. Disclosures cover governance, strategy, risk management, and metrics and targets. They integrate climate transition into oversight, planning and risk assessment, rather than limiting reporting to emissions.
The Board approves the Climate Transition Plan and Climate Emergency Report. The ESG Committee oversees climate governance, monitors progress and reviews disclosures prior to Board approval.
An independent organisation reviews our emissions data and methodology annually to improve data quality. This review does not constitute formal third-party assurance.
We will conduct formal climate scenario analysis in 2026 to better identify material climate-related risks and inform resilience planning.
MSF international climate governance
Climate action across MSF is guided by a movement-wide strategic priority on climate and the environment.7 This framework sets shared ambitions across adaptation, mitigation and advocacy, and provides direction for coordinated action across operational centres and partner sections.
Oversight is still in development and will be supported by a dedicated coordination mechanism that brings together operational directorates and technical networks to monitor progress and strengthen alignment.
This structure underpins MSF’s commitment to reduce operational emissions by 50 per cent by 2030, from a 2019 baseline, and to strengthen climate adaptation in vulnerable settings. Governance arrangements are still being established, but capacity and reporting remain uneven across the movement. Integration of climate considerations into enterprise risk management and financial planning is progressing but not yet fully embedded.
Strengthening accountability, improving consistency of monitoring and embedding climate risk into core governance systems are priorities for the next phase of implementation.
3 See International Sustainability Standards Board 2023, IFRS S2 Climate-related Disclosures, IFRS Foundation, viewed 26 March 2026, https://www. ifrs.org; Australian Accounting Standards Board 2024, AASB S2 Climate-related Disclosures, Australian Accounting Standards Board, viewed 26 March 2026, https://www.aasb.gov.au
4 See Australian Institute of Company Directors (AICD), Director Tool: Climate Risk Governance Guide, 2022; AICD, Climate Change Risk and the Duties of Directors, legal opinion by Noel Hutley SC and Sebastian Hartford-Davis, 2016 (with supplementary opinions 2019 and 2021).
5 Mandatory climate-related financial disclosures commenced on 1 January 2025 for certain large entities and will be phased in for other entities by 2027-28. MSF is not currently subject to mandatory reporting under AASB S2 Climate-related Disclosures (2024), issued under the Australian Securities and Investments Commission Act 2001 (Cth).
6 The ASSB recognises that users of not-for-profit financial reports include donors, governments, taxpayers and service recipients. For MSF, stakeholders are concerned with our ability to sustain humanitarian activities and deliver services.
7 See MSF Strategic Planning, Accountability, Resources Cycle 2026 – 2031, From Commitment to Action on Climate Mitigation, Adaptation and Advocacy.
MSFA’s climate response integrates emissions reduction, climate adaptation and advocacy.
Climate change is a material risk to the communities MSF serves and to the delivery of humanitarian assistance. It is also a matter of equity, with populations least responsible for emissions facing the greatest health impacts.
MSFA’s approach addresses this through:
• Reducing emissions across operations and supply chains
• Supporting adaptation in climate-affected settings
• Advocating for equitable and effective climate action
• Transition Plan implementation progress (2025)
These areas are integrated into program delivery, procurement, financial decision-making and external engagement, and are supported through the Climate Transition Plan.
Carbon mitigation
MSFA and MSFNZ reduces emissions across its operations and supply chain. This is supported by targets, improved measurement of direct (Scope 1), energy (Scope 2) and value chain (Scope 3) emissions, and integration into operational, procurement and financial decision-making, with governance oversight.
Climate adaptation
MSFA supports climate adaptation through humanitarian programs in settings most exposed to climate-related health risks.
MSF is prioritising adaptation as part of its global strategic planning. Climate adaptation refers to developing and implementing healthcare and emergency response strategies that account for the evolving health risks and challenges posed by climate change and environmental degradation to continue to effectively deliver humanitarian care to affected populations.
In 2025, MSF co-authored the MSF–Lancet Countdown Joint Brief.8 It asked for more investment in adaptation measures to strengthen healthcare and emergency response to manage rising health risks from heat, floods and food insecurity.
Kiribati on the front line of the climate crisis
Kiribati, a low-lying Pacific island nation, is acutely vulnerable to the impacts of climate change. Rising sea levels, increasing temperatures, frequent droughts and environmental degradation threaten access to clean, safe drinking water. These environmental pressures, combined with overfishing and geographic remoteness, are exacerbating public health and humanitarian challenges.
MSF’s water and sanitation specialists, in collaboration with the Kiribati Ministry of Health and Medical Services, are tackling these challenges head-on as part of a unique climatehealth response: an evidence-based approach at the intersection of climate, nutrition and health.
MSF is investigating environmental risk factors by testing well water for salinity and coliform bacteria. High salinity levels can correlate with hypertensive disorders of pregnancy and gestational diabetes due to the behavioural change of adding sugar to water to change the taste. The water sources are then mapped and matched with women of child-bearing age and pregnant individuals to monitor health outcomes throughout their antenatal care. In Abaiang, most freshwater wells were found to be contaminated,
due to surface runoff, including animal waste and other pollution, which can cause diarrhoea, skin and eye infections particularly in children.
In response, MSF plans to begin rehabilitating some of the most contaminated wells – especially those near clinics and schools – by covering open wells, improving drainage and creating community hygiene committees to reinforce the message of how to protect water sources. MSF is also planning to install rainwater harvesting in remote primary healthcare centres to provide a more climate-resilient drinking water source.
Environmental risks don’t end at water. MSF is also supporting improvements in healthcare waste management – another under-recognised threat in climate-fragile settings. Simple changes like proper waste segregation and covered burn pits can dramatically reduce pollution and prevent hazardous materials from entering groundwater or the marine environment.
This is what a climate crisis looks like in practice: recognising that health systems, human behaviour and environmental factors are deeply interwoven.
MSFA undertakes advocacy to draw attention to the health impacts of climate change and promote equitable policy responses.
Climate change is a driver of humanitarian need, with communities least responsible for emissions facing the greatest risks. Climate justice recognises these disproportionate impacts and seeks to address them through a range of measures.
Climate Transition Plan progress
MSFA and MSFNZ are moving from emissions disclosure to implementation. Governance, systems and reporting are now established. The next phase requires consistent application across procurement, financial decision-making, operations and advocacy.
The Climate Transition Plan sets out how emissions reduction and climate risk are embedded into organisational decisions and applied in practice. Implementation is progressing, but outcomes will depend on consistent application across the organisation.
Pillar Status 2025 progress Next steps
Governance Progressing Governance frameworks are in place. The Board and ESG Committee provide oversight. Annual reporting is established.
Build Board capability for climate governance oversight. Establish ESG Committee schedule and decision points.
In 2025, MSF Australia incorporated climate policy priorities into its federal election advocacy for the first time.
MSF Australia called on all candidates to strengthen action on climate change, with a focus on the health impacts in the Asia Pacific region, to reduce morbidity and mortality among vulnerable populations.
Key policy asks included:
• Increasing aid allocations for health and climate action in the Asia Pacific
• Funding implementation of the National Health and Climate Strategy, including integration into the Australian Centre for Disease Control
• Ending the export and financing of fossil fuels in line with Paris Agreement commitments
• Accelerating the transition to renewable energy, including ending reliance on fossil fuels by 2030
MSF Australia partnered with Doctors for the Environment Australia on a joint open letter calling for stronger climate leadership. Advocacy also highlighted climate-induced displacement and the need for increased health support for affected populations.
The #Vote4Humanity campaign mobilised staff and association members, targeting candidates in 25 marginal seats. It included over 80 direct engagements with MPs and candidates, coordinated sector messaging, and reached more than 70,000 people through media and digital channels.
Metrics and targets
Progressing
Strategy –Travel Progressing
Data coverage has improved across all scopes. Supplier engagement is underway. Emissions intensity has decreased, but total emissions remain above baseline. Measurement systems are in place but partially rely on estimates.
The revised MSFA travel policy is drafted but not implemented. It applies MSF Environmental International Travel Guidance (endorsed November 2024) and covers all staff, volunteers and governance travel.
Increase use of supplier-specific data and reduce reliance on spend-based estimates. Develop a climate reporting dashboard for the Climate Transition Plan and targets. Embed climate and reporting requirements into procurement and contracts.
Finalise and implement the travel policy. Embed requirements in approval and financial processes. Prioritise essential travel only and reduce nonessential, long-haul travel. Strengthen monitoring and reporting. Support implementation with guidance and virtual collaboration tools.
Strategy –Procurement and suppliers
Progressing
Strategy –Advocacy
Progressing
Sustainable procurement systems are established and partially in use. The Supplier Engagement Strategy has been implemented, with sustainability clauses in contracts and initial training underway.
First climate and health advocacy campaign delivered (#Vote4Humanity). COP31 strategy in development, as Australia holds the presidency, creating an opportunity to elevate health in climate negotiations, with a focus on Pacific priorities.
Risk Early stage Initial climate risk framework established. Carbon audit complete. Adaptation framework developed. Climate risk is not yet integrated into planning or financial decisionmaking.
Build on year one of the Supplier Engagement Strategy, continuing engagement with face-toface and telemarketing suppliers. Strengthen implementation of sustainability requirements in contracts. Expand engagement in high-emissions categories. Build capability to track sustainable procurement through the contract management system.
Finalise and implement the COP31 advocacy strategy. Position health across key negotiation streams (adaptation, finance, loss and damage). Align with Pacific priorities and partnerships. Strengthen coordination across advocacy, programs and fundraising.
Integrate climate risk into planning and decisionmaking. Expand the risk register. Conduct scenario analysis from 2026 and link findings to organisational planning.
“#Vote4Humanity” Campaign
Key insights
Total emissions remain 4.4 per cent above the 2019 baseline, despite reductions in emissions intensity.
Approximately 98 per cent of emissions are Scope 3, primarily from the supply chain and travel. Achieving the 2030 target will require targeted decarbonisation in these areas.
Many large suppliers are now required to measure and reduce emissions under emerging regulation, which is expected to support gradual reductions. However, a significant portion of MSFA’s supply chain, particularly face-to-face and telemarketing providers, has low climate maturity. The Supplier Engagement Strategy is critical to improving disclosure, setting expectations and building capability.
While field travel is essential, discretionary travel remains within organisational control. Most controllable emissions arise from long-haul, non-field travel, where reductions have been limited. This highlights a gap between policy and implementation.
Implementation priorities
The next phase will prioritise organisation-wide implementation:
• Apply climate considerations in procurement and financial decision-making
• Require emissions disclosure from priority suppliers and expand engagement in high-emissions categories
• Enforce the travel policy, prioritising reductions in non-essential, long-haul travel
• Undertake scenario analysis from 2026 and integrate into planning
• Strengthen climate and health advocacy
Emissions reduction will not be achieved through reporting alone. It requires consistent implementation across travel, procurement and supplier engagement.
The Climate Transition Plan provides the framework. Success now depends on implementation across the organisation.
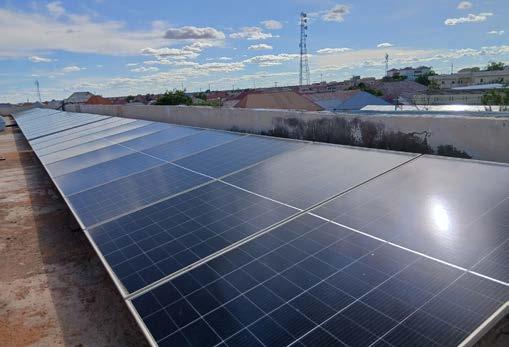
Image
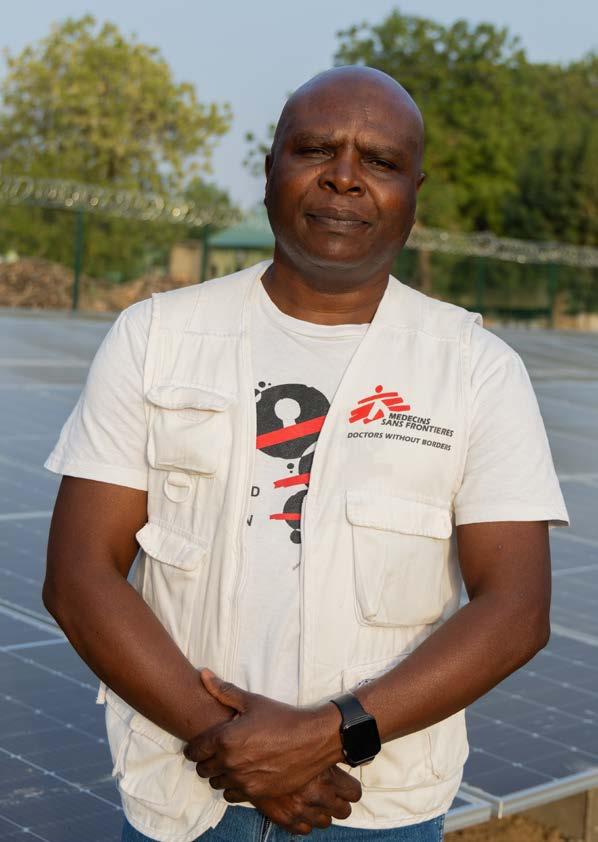
Solarisation of Zurmi General Hospital. Converting MSFsupported Nigerian hospitals, like Zurmi General Hospital, to solar energy is a passion of energy manager, Israel Mushore.
Climate change is a significant risk to MSFA and MSFNZ, impacting both the communities we serve and our program delivery.9
Physical risks are already increasing humanitarian needs for MSF operations. More frequent and severe events disrupt access, supply chains, and service delivery, increasing vulnerability in affected communities, while also placing pressure on staff and health systems. These compounding and cascading risks are expected to escalate.
Climate risk creates operational and financial challenges for MSFA and MSFNZ, similar to other Australian organisations. These include rising costs, supply chain disruptions, and increased expectations from regulators, donors, and partners.
These risks exist regardless of current legal disclosure requirements. In Australia, climate risk is recognised as a foreseeable financial and governance risk, and directors are expected to identify, assess and manage material climaterelated risks as part of their duties of care and diligence.²
Climate risk in organisational planning
MSFA and MSFNZ are not yet systematically incorporating climate risk into planning and financial decisions, but progress is ongoing. We are integrating climate risk into procurement, supplier engagement, and operations in alignment with the Strategic Plan 2026–31. The 2026 MSFA Annual Plan includes a deliverable that updates governance frameworks to address key risks, including climate risks.
Future scenario analysis (2026 commitment)
In 2026, we will conduct climate scenario analysis to enhance risk assessment and inform planning. This will support the Climate Transition Plan and the 2030 emissions reduction target.
Emissions overview
Total emissions decreased from 2023 but remain above the 2019 baseline.
• Increased fundraising costs (+34 per cent)10
• Reduced emissions intensity (–24.6 per cent)
These trends indicate improved efficiency and partial decoupling of emissions from growth.
Emissions drivers
Emissions trends since the 2019 baseline have been influenced by the following drivers:
• Reduced air travel mainly from flights to the field (–37.7 per cent)
• Renewable electricity procurement (–34.7 per cent)
Progress towards targets
Table 5 shows emissions against the 2019 baseline, current performance and future targets.
Emissions remain above the required trajectory. On a like-for-like basis (excluding new activities), emissions are 2.5 per cent below 2019, indicating underlying reductions.
Figure 1: MSFA emissions trajectory and targets (2019–2030)
Emissions intensity
Emissions intensity decreased by 24.6 per cent since 2019, indicating improved carbon efficiency.
Emissions intensity is used to track progress because it indicates whether we are reducing emissions relative to organisational growth, not just in absolute terms.
During the reporting period, revenue increased but emissions intensity decreased compared to 2019. This shows partial decoupling. Organisational growth did not cause a proportional rise in emissions.
Key insights
• Emissions are concentrated in Scope 3 categories, particularly fundraising and travel
• Travel emissions have decreased significantly since 2019, primarily due to reduced field travel
• ICT emissions have increased as digital activity has expanded
• Electricity emissions remain low and continue to decline
Emissions intensity measures greenhouse gas emissions per AU$1 million of revenue. It shows if emissions are rising due to organisational growth or more carbon-intensive activities.
Table 7 shows emissions intensity, measured as tonnes of carbon dioxide equivalent (tCO₂-e) per million Australian dollars (AU$m) of revenue.
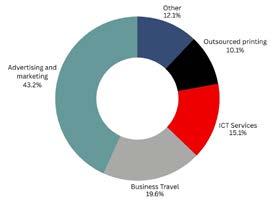
• Other categories each contribute less than 5 per cent of total emissions
Table 9 provides a detailed breakdown of emissions by category and scope, including year-on-year and baseline comparisons.
Table 6: Emissions intensity summary (tCO₂-e per $m revenue)
Table 8: Emissions by category
Table 9: Emissions by category and scope (detailed)
Table 7: Emission’s intensity (tCO2-e per AU$m revenue)11
Figure 2: Main emissions categories (%)
Scopes 1 and 2: Direct emissions and purchased electricity
Scope 1 and 2 emissions make up a small proportion of our total emissions.
Scope 1 Emissions
Scope 1 emissions (refrigerants and fuel) were 3.5 tCO₂-e in 2024 (<0.1 per cent of total) and decreased by 29.3 per cent from 2023, reflecting low direct fuel use and refrigerant leakage
Driven by renewable electricity procurement (GreenPower).
Location-based electricity emissions -35% since 2019
Reduction against average electricity grid emissions.
Scope 2: Purchased electricity emissions
In 2024, MSFA used 100,968 kWh of electricity. Emissions are reported using both location-based and market-based methods.
Location-based emissions were 72.7 tCO₂-e (–35 per cent vs 2019), reflecting average grid emissions. The reduction since 2019 is mainly due to grid decarbonisation.
Market-based emissions were 9.1 tCO₂-e (–68 per cent vs 2023), reflecting renewable electricity procurement through GreenPower.12
Scope 3 – Supply Chain Emissions
Scope 3 emissions account for 98.3 per cent of MSFA’s total footprint and are primarily driven by fundraising, travel and ICT services. These emissions arise from activities outside MSFA’s direct control, making them the most significant and complex area for emissions reduction.
Fundraising
Fundraising is the largest source of emissions. Fundraising emissions include face-to-face fundraising, telemarketing, digital campaigns and direct mail (outsourced printing).
In 2024, fundraising emissions totalled 1, 958 tCO₂-e, which is 3.2 per cent below the 2019 base year and 3 per cent below 2023 levels see Table 9 Fundraising emissions year on year.
Emissions are concentrated in a small number of activities:
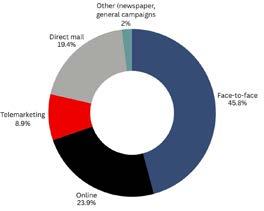
• Face-to-face fundraising (45.8 per cent)
• Online/digital (23.9 per cent)
• Outsourced printing (19.4 per cent)
• Telemarketing (8.9 per cent)
• Other activities (2.0 per cent)
Fundraising remains the most significant opportunity for emissions reduction, with progress dependent on supplier engagement, improved data and changes in procurement and delivery models.
Figure 3 Proportion of total emissions by fundraising activity
Reducing fundraising emissions
Each fundraising channel requires a tailored strategy to reduce emissions, reflecting differences in emissions profiles, operational models and supplier transition maturity. Three strategies have been used: supplier engagement; improved supplier-specific emissions reporting and sustainable paper procurement.
Channel (% fundraising emissions) Spend Action
Face-to-face (46%) High Priority engagement; require reporting transition plans
Telemarketing (9%) Medium Strengthen disclosure and engagement
Online (24%) High Shift to supplier-specific data from 2026
Direct mail & printing (19%) Medium FSC paper; embed sustainable procurement in 2026. Other (2%) Low Monitor proportionately
Face-to-face and telemarketing: Supplier engagement strategy
In 2025, MSF Australia launched a supplier engagement strategy targeting face-to-face and telemarketing fundraising channels.
These suppliers were prioritised because they account for the largest share of fundraising emissions and have limited climate reporting.
MSFA and MSFNZ:
• Added emissions reporting and ESG clauses to contracts
• Communicated MSF’s 2030 reduction target
• Commenced structured engagement to establish baselines and support transition planning
• Will commence supplier-specific reporting in 2026.
This shifts the focus from measuring emissions to managing transition risk in high-impact supply chain areas.
Sustainable Paper Sourcing
In 2025, MSF developed a sustainable paper sourcing strategy and completed a supplier audit.
Results:
90 per cent of paper sourced met recognised standards (FSC or PEFC)14
FSC-certified paper exceeded the 50 per cent interim milestone
These are responsible sourcing targets, not emissions targets. FSC and PEFC certification ensure paper comes from sustainably managed forests, but they do not directly measure or guarantee emissions reductions.
They support the Climate Transition Plan by improving procurement practices and reducing exposure to high-risk supply chains. Any emissions benefit is indirect and not counted toward reduction targets.
Embedding these requirements into procurement policy and staff training is scheduled for 2026.
In 2024, emissions were 463.1 tCO₂-e, compared with 198.5 tCO₂-e in 2019 (base year) and 552.5 tCO₂-e in 2023.
Advertising services emissions were:
• 463.1 tCO₂-e in 2024
• +133 per cent vs 2019
• –16 per cent vs 2023
The increase since 2019 reflects growth in digital fundraising and expanded reporting coverage.
Most major digital suppliers publish climate disclosures and transition plans. From 2026, MSF will transition from spend-based estimates to supplier-specific and activity-based emissions data for major providers.
Improved data quality may reduce reported emissions where supplier intensities are below sector averages. Any methodological changes will be transparently disclosed.
Table 14 outlines the key assumptions and sensitivities for projected online emissions reductions.
Priority suppliers decarbonise in line with published targets
Supplier-specific emissions factors are lower than sector averages
Table 12: Actions to reduce emissions by fundraising activity
Table 14: Assumptions and sensitivity to online emissions reductions
Table 13: Advertising services (online and campaigns)
vs 2023. -36.0% vs 2019. Significant reduction from baseline.
Emissions remain below 2019 levels due to reduced field travel. Business travel makes up 19.2 per cent of total emissions.
Total business travel emissions were 750.8 tCO₂-e in 2024, down 14.2 per cent from 2023 and 36.0 per cent from 2019. Flights are the main source of business travel emissions, followed by hotel emissions. Other business travel categories, such as taxis, car hire, public transport, parking and rideshare, each made up less than 0.1 per cent of total emissions.
Flights
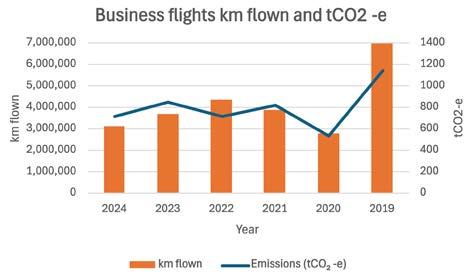
In 2024, flights produced 714.2 tCO₂-e, 34.5 per cent below the 2019 baseline. Reductions have been driven by decreased field travel (–52.7 per cent), while non-field travel has declined by only 6.9 per cent and remains close to baseline levels. This indicates limited sustained change in discretionary travel. Flight trends
• Distance flown: 3.0 million km (–19 per cent vs 2023; –57 per cent vs 2019)
• Emissions: –34.5 per cent vs 2019
• Field travel: –52.7 per cent
• Non-field travel: –6.9 per cent (near baseline)
Reductions driven by lower field travel; discretionary travel largely unchanged.
The reduction in 2024 was largely driven by lower field-based travel requirements. This is expected to remain low in 2025, and field flights are expected to increase in 2026 with a projected increase in field worker departures.
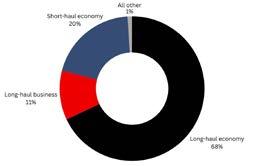
Emissions are concentrated in long-haul travel, which is 79 per cent of flight emissions in 2024. Domestic flights produced 150 tCO₂-e, representing 21 per cent of total flight emissions. Table 12 provides the breakdown by distance band.
Long-haul: >3,700
Short-haul: >400 km to ≤3,700 km
Very short-haul: ≤400 km
Table 15: Business travel emissions, year-on-year
Table 17: Business air travel emissions by distance band (CY2024)
Figure 4: Business flights annual tCO2-e and km flown
Table 16: Field flights vs all other flights
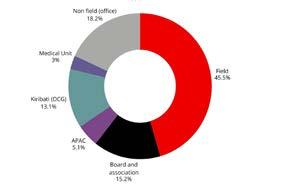
5 Proportion of emissions by air travel type and Figure 6 Proportion of flight emissions by team provide analysis by travel type and team.
Hotel Accommodation
Hotel accommodation emissions were 21.0 tCO₂-e in 2024. This is a 19.5 per cent reduction from 26.1 tCO₂-e in 2019.
In 2024, 712 hotel nights were recorded, compared to 759 in 2019.
Emissions intensity fell from 0.03 tCO₂-e per night in 2019 to 0.03 tCO₂-e per night in 2024, a 14.2 per cent reduction. This improvement is due to better emissions factors and supplier performance, not just reduced activity.
Further progress will depend on travel discipline under the revised Travel Policy from 2026, greater use of lower-emissions accommodation where possible, and improved data quality.
Key insight
Air travel remains a material source of emissions. While total emissions are below the 2019 baseline, reductions have been driven by lower field travel.
Non-field travel now accounts for 56.6 per cent of emissions (2019: 39.9 per cent). This shift indicates that further reductions will depend on addressing discretionary and long-haul travel.
Next steps
• Strengthen virtual-first practices
• Review travel approval and class policies
• Implement revised MSF Travel Policy (2026), requiring travel to be essential and justified
• Invest in digital collaboration to reduce reliance on travel
Figure
Figure 5: Proportion of emissions by air travel type
Employee commuting emissions remain below the 2019 base year, despite increased travel. After significant reductions in 2020 and 2021, emissions rose as travel resumed but remained lower than pre-pandemic levels. In 2024, emissions were 21.2 per cent below 2019 levels, indicating improved emissions intensity
Office supplies and services
Emissions from office supplies and services remain low in absolute terms.
Office cleaning services accounted for 4.2 tCO₂-e in 2024, an increase from the 2019 baseline, reflecting higher service levels and operational activity.
Office paper emissions were 0.2 tCO₂-e in 2024, a 93.9 per cent reduction from 2019, due to reduced paper use and the transition to 100 per cent FSC/PEFC-certified paper.
ICT services and equipment
ICT services emissions increased to 556.4 tCO₂-e in 2024, up 37.5 per cent from 2023 and significantly higher than the 2019 baseline. This increase reflects expanded digital activity and improved capture of ICT-related emissions, which can be attributed to the transformation project and consulting costs rather than like-for-like growth.
ICT equipment emissions were 3.5 tCO₂-e in 2024, remaining low and below the 2019 baseline.
tCO₂-e +37.5% vs 2023. +3,874.6% vs 2019. Increase reflects expanded reporting and ICT capture.
tCO₂-e
of 54.3% vs 2019 baseline.
Postage, couriers and logistics
Logistics emissions declined in 2024 and remain below the 2019 baseline.
• Australia Post emissions decreased 15.8 per cent compared to 2023 and are 6.9 per cent below 2019 levels. In 2024, Australia Post accounted for approximately 94 per cent of total logistics emissions (83.7 tCO₂-e of 88.7 tCO₂-e), making it the dominant driver of this category.
• Other couriers reduced significantly (-79.9 per cent vs 2023; -56.4 per cent vs 2019), reflecting reduced reliance on ad hoc freight.
• Warehousing, introduced in 2023, declined 33.8 per cent year-on-year.
Professional services emissions come from external advice and support, including legal, insurance, audit, banking and consulting. Emissions are driven by increased premiums, organisational scale, compliance requirements and major projects.
The 2019 baseline included only consulting (13.3 tCO₂-e). Other categories, including legal, insurance, banking, accounting, education and other professional services, were not included and have since been added as part of an expanded operational boundary. This contributes to the increase in reported emissions.
Emissions were 125.7 tCO₂-e in 2024, down 6.7 per cent from 2023, mainly due to lower consulting emissions.
Insurance (19 per cent), legal (21 per cent) and banking (13 per cent) were the largest contributors. Increases reflect higher spend and improved data classification, rather than operational change.15
A consistent baseline will improve trend analysis over time.
vs 2019.
and improved reporting.
Waste
Waste emissions were 3.8 tCO₂-e in 2024, 15 per cent below 2019 and 11 per cent above 2023.
Landfill waste was 2.95 tonnes (9 per cent below baseline). Recycling was 3.02 tonnes (24 per cent above 2019). Landfill remains the main source of emissions. Waste emissions are a small share of total emissions.
The increase in 2024 likely reflects the MSFA office move and associated clean-up. Waste levels are expected to decline in 2025 as operations stabilise. The priority is to reduce landfill and maintain high diversion rates.
Water
Water use in 2024 was 1,704 kL, 11 per cent higher than 2019 and 7 per cent higher than 2023. Water emissions were 4.9 tCO₂-e. Water is a minor part of total emissions.
Financed emissions reflect the emissions associated with MSFA’s cash reserves. In 2024, financed emissions were 932 tCO₂-e (approximately 19 per cent of total emissions), up 54 per cent from 2019 and down 8.8 per cent from 2023, driven by changes in reserve balances and portfolio mix rather than operational activity.17
Financed emissions are reported separately and are not yet included in MSFA’s operational inventory or 2030 target.
Given their materiality, MSFA intends to integrate financed emissions into formal targets over time, subject to governance decisions and alignment of investment practices. This may require adjustment of the 2019 baseline.
In 2025, MSFA initiated actions to reduce financed emissions, including:
• Introduction of an Ethical Red Lines Policy
• Engagement with financial institutions on climate performance
• Allocation of AU$5 million to low carbon deposits.18
Table 23: Summary of professional services emissions (tCO₂-e), 2019–202416
Table 24: Summary of waste and water emissions (tCO₂-e)
Methodology
Operational boundary and emissions calculation
Operational boundary by emissions scope showing Scope 1, Scope 2 and Scope 3 emissions in accordance with the Greenhouse Gas Protocol.
MFSA applies the operational control approach. Emissions are reported for activities under MSFA’s operational control. The operational boundary for 2024 remains consistent with that of 2023.
The organisational boundary is defined by the entities listed in MSFA’s annual financial statements to the Australian Charities and Not-for-profits Commission (ACNC), ensuring consistency between financial and emissions reporting.
Operational boundary What activities are included in emissions reporting. Operational control Reporting emissions from activities MSFA manages.
The boundary includes:
• MSF Australia and MSF New Zealand activities
• Official business travel for staff, Board and Association members
• MSFA-supported operational activities, including the OCG-managed Kiribati project
• MSF Sydney Medical Unit (OCP) staff and supported program expenses
• MSF Asia Pacific (APAC) Australia-related activities
• Financed emissions associated with MSFA’s cash reserves.
• Kiribati and APAC activities are included in the 2024 boundary, although they were not part of the 2019 base year. Significant emissions from these activities are reported separately to enhance transparency.
Calculation approach
Emissions are reported in metric tonnes of carbon dioxide equivalent (tCO₂-e).
Scope 1 and Scope 2 emissions are calculated using primary activity data. Scope 3 emissions use primary data where available.
Where possible, we use activity-based data (for example, kilometres flown or postal volumes). Where this is not available, we apply expenditure-based (input/output) factors. This conservative approach may overestimate some third-party emissions but reduces the risk of underreporting. Assumptions are reviewed annually to improve data quality and reduce estimation uncertainty.
Reporting standard Emissions are prepared in line with the GHG Protocol (Corporate and Scope 3 standards) and disclosed in accordance with IFRS S2 climate-related requirements.
Greenhouse gases Greenhouse gases are reported in tonnes of carbon dioxide equivalent (tCO₂-e).
Organisational boundary Operational control approach applied. 100% of emissions from entities under MSFA operational control are included.
Operational boundary All Scope 1, Scope 2 emissions are reported. All Scope 3 categories are included and defined in Tables 3.2 and 3.3.
Geographical scope Reporting covers Australian operations and Kiribati operations within MSFA’s operational control boundary.
Measurement basis Emissions are calculated using direct, supplier or activity data with carbon conversion factors under Method 1 of the NGER Determination, unless stated otherwise. Where data is unavailable, a spend-based method is used. This conservative approach may overestimate some supply chain emissions but reduces the risk of underreporting.
Conversion factors National Greenhouse Accounts (NGA) Factors are applied unless more specific supplier or activity data are available.
Baseline year The baseline reflects emissions within the defined operational boundary. It is adjusted where structural changes or newly identified Scope 3 sources alter emissions by more than 5%.
Prior year restatements
Prior year figures are restated where improved data or policy changes occur. Significant adjustments are disclosed.
Materiality Emission sources contributing less than 1% in aggregate may be excluded. This approach aligns with streamlined life cycle assessment principles.
Estimation methods Where activity data are unavailable, expenditure-based (input/output) factors are applied as a conservative proxy.
Financed emissions (Scope 3 Cat. 15)
Reported on an optional basis. No prescribed GHG Protocol method exists for cash equivalents; estimates reference publicly available sustainability data.
GHG Protocol
GHG Protocol
GHG Protocol; IFRS S2 29(a)(ii)
GHG Protocol; IFRS S2 29
NGER Determination; NGA Factors20
NGA Factors
GHG Protocol base year recalculation guidance; IFRS S2 36
Table 26: Operational boundary emissions (CY2024)
Table 27: Summary of greenhouse gas (GHG) Reporting Policies – MSFA
GHG Protocol; IFRS S2 29, 36–3719
Limitations
This report is based on the best available data and methodologies at the time of preparation. However, emissions estimates remain subject to data gaps, methodological limitations and evolving reporting practices. These limitations affect the precision of results and highlight areas where further improvement in data quality, systems alignment and supplier engagement is required.
Area Limitation Response
Overall data All emissions are estimated; data gaps and methodological differences may affect accuracy.
Strengthen controls, improve supplier data and disclose assumptions transparently.
Key assumptions
We apply these assumptions to boundaries, calculations and data collection.
MSFA greenhouse gas (GHG) emissions are calculated in accordance with the GHG Protocol Corporate Standard, covering Scope 1 (direct emissions), Scope 2 (purchased electricity) and relevant Scope 3 value chain emissions.
Business travel (2019) Some non-agency and Europe-booked flights may be underreported.
Financial alignment Potential misclassification between financial and carbon systems.
Improve reconciliation and clarify reporting responsibilities.
Refine mapping and review annually.
Fundraising supply chain Limited supplier data and transition visibility. Assess suppliers > AU$100k; require reporting and transition plans.
Target credibility Poor data or reliance on offsets risks reputational impact.
Climate-related risks Climate related risks are not yet systematically quantified or linked to financial impacts. Scenario analysis has not yet been undertaken.
Prioritise real reductions; strengthen governance and data maturity.
Scenario analysis will be introduced in 2026.
Image
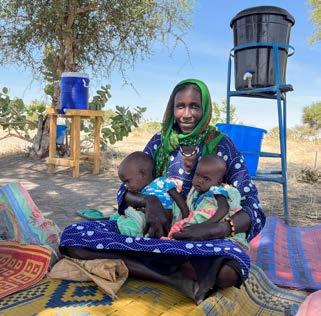
Zara Soumaila and her two twin daughters Kaltouma Adam and Khadidja Adam, 10-month-old wait to receive the malnutrition treatment in Karandom, Chad.
“My two daughters were sick. When I arrived, I was told that they were malnourished. My breasts don’t produce milk, so even if I put the children to my breasts, they can’t suckle. There is nothing else in the village to feed my daughters.
Food insecurity in Chad is a major concern, exacerbated by various factors such as population displacement, climate change and the country’s economic situation.
Working from home S3 Cat. 7 Standard activity proxy 7.6 hrs/day; 230 days/year
Postal services S3 Cat. 4 Activity-based Australia Post CY2023 factors Low
Waste S3 Cat. 5 Estimated where required Bin size × collection frequency × fullness; NGA 2019 factors Moderate
Recycling S3 Cat. 5 100–0 method Zero emissions attributed to recycling process Low
Refrigerants Scope 1 Direct × GWP IPCC AR6 global warming potentials Low
Third-party services S3 Multiple Expenditure-based Input/output factors where supplier data unavailable Higher
Investments S3 Cat. 15 (optional) Financed emissions proxy No prescribed method for cash equivalents; based on public sustainability data Higher
Table 28: Limitations summary
Table 29: Carbon audit assumptions
Appendix
Key terms
Baseline (2019)
The starting year used to measure emissions reductions
Absolute emissions
Total emissions produced in a year
Emissions intensity
Emissions per $m revenue. Shows how efficient the organisation is as it grows.
Carbon dioxide equivalent (CO₂-e)
A standard unit to measure all greenhouse gases together
Operational boundary
Set out which emissions are included in reporting, including both direct emissions and indirect emissions from the organisation’s activities.
Organisational boundary
Set out which operations are included in emissions reporting, based on ownership or control.
Scope 1 emissions
Direct emissions from sources MSFA controls (e.g. fuel, refrigerants)
Scope 2 emissions
Emissions from purchased electricity
Scope 3 emissions
Emissions from suppliers, travel and services
Climate adaptation
Actions to reduce the impact of climate change on people and health systems
Climate risk
The risk that climate change affects an organisation’s operations, finances, and ability to deliver services, including physical impacts and changes from the transition to a low-carbon economy.
Climate governance
How MSFA oversees and manages climate risks and emissions
Scenario analysis
Measuring how different climate conditions and policies could alter risks and operations in future.
Climate justice
Climate justice means putting equity and human rights at the core of decision-making and action on climate change.
Table 30: Changes in absolute emissions (tCO₂-e)
Médecins Sans Frontières (MSF) is an international, independent, medical humanitarian organisation founded in France in 1971. The organisation delivers emergency medical aid to people affected by armed conflict, epidemics, exclusion from healthcare and disasters. Assistance is provided based on need and irrespective of race, religion, gender, or political affiliation.
Today, Médecins Sans Frontières is a worldwide movement of 24 associations, including one in Australia.
This report is available in digital form. Please avoid making paper copies if possible.