BACKGROUND STUDY
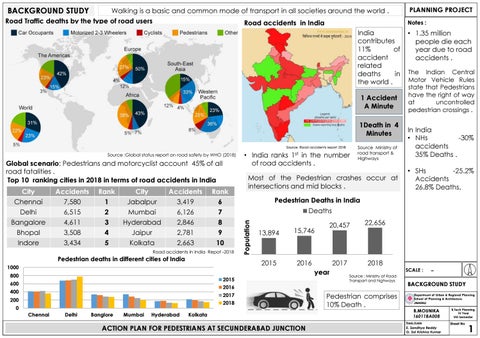
Walking is a basic and common mode of transport in all societies around the world . Road Traffic deaths by the type of road users Road accidents in India India contributes 11% of accident related deaths in the world . 1 Accident A Minute 1Death in 4 Minutes Source :Road accidents report 2018
Global scenario: Pedestrians and motorcyclist account 45% of all road fatalities . Top 10 ranking cities in 2018 in terms of road accidents in India City Chennai Delhi Bangalore
Accidents 7,580 6,515 4,611
Rank 1 2 3
City Jabalpur Mumbai Hyderabad
Accidents 3,419 6,126 2,846
Rank 6 7 8
Bhopal Indore
3,508 3,434
4 5
Jaipur Kolkata
2,781 2,663
9 10
Road accidents in India Repot -2018
Pedestrian deaths in different cities of India 1000
• India ranks 1st in the number of road accidents .
Most of the Pedestrian crashes occur at intersections and mid blocks .
13,894
15,746
2015
2016
2015
600
20,457
22,656
2017
2018
2017
200
2018
0 Chennai
Delhi
Banglore
Mumbai
Hyderabad
The Indian Central Motor Vehicle Rules state that Pedestrians have the right of way at uncontrolled pedestrian crossings .
In India • NHs -30% accidents 35% Deaths . • SHs -25.2% Accidents 26.8% Deaths.
SCALE : Source : Ministry of Road Transport and highways
2016
400
• 1.35 million people die each year due to road accidents .
Deaths
year
800
Notes :
Pedestrian Deaths in India Population
Source :Global status report on road safety by WHO (2018)
Source Ministry of road transport & Highways
PLANNING PROJECT
Kolkata
ACTION PLAN FOR PEDESTRIANS AT SECUNDERABAD JUNCTION
Pedestrian comprises 10% Death .
-
BACKGROUND STUDY Department of Urban & Regional Planning School of Planning & Architecture JNAFAU
B.MOUNIKA 16011BA008 Thesis Guide
E. Sandhya Reddy G. Sai Krishna Kumar
B.Tech Planning IV Year VIII Semester
Sheet No
1
WORKING METHODOLOGY PROBLEM STATEMENT Background study AIM
PLANNING PROJECT
Lack of infrastructure facilities for pedestrians . Rising of the pedestrian accidents day by day. Pedestrian accident Statistics
Literature studies
Behavior & infrastructure for pedestrians.
Desktop studies
Pedestrian safety action plans .
15 days
To prepare an Action Plan for pedestrians at Secunderabad Junction.
3. Study area is selected and delineated based on the identified parameters.
4. To analyze the identified parameters at selected nodes through surveys.
5. Proposals to improve the pedestrian safety and accessibility at selected Nodes .
• Study the NMT policy. • Review the Pedestrian infrastructure. • Study the Pedestrian behavior & flow .
• Pedestrian accident statistics. • Major pedestrian flow areas. • Signalized and unsignalized intersections.
• Pedestrian flow. • Pedestrian accident rate. • Surrounding land use. • Type of junction • Type of road . • Crossing widths.
• Pedestrian & traffic volume . • Land use • LOS of pedestrian. • Parking capacity • Pedestrian opinion survey.
Provide •Pedestrian infrastructure facilities. •Efficient management and monitoring.
Primary data Pedestrian & Traffic volume count LOS of pedestrians at intersections Opinion survey
DATA ANALYSIS PROPOSAL
DATA COLLECTION
Secondary data Accident statistics Land use maps Parking data
Analysis of the data and gap identification. To prepare an Action plan for pedestrians at Secunderabad Junction.
15 days
2. To identify the pedestrian accident and major pedestrian flow areas at distinct nodes.
30 days
1. To review the existing pedestrian policies, infrastructure facilities and their behavior.
7 days
OBJECTIVES
Expected outcome :Provide safe & accessible infrastructure for Scope :Effective management of pedestrian movements. pedestrians .
ACTION PLAN FOR PEDESTRIANS AT SECUNDERABAD JUNCTION
Limitations: The study is limited to different nodes in the Hyderabad city where pedestrian accidents occur frequently and pedestrian flow is heavy. Study justification : Increasing the support for walking will make the transportation system more socially , environmentally and economically sustainable . • Affordable mode of transportation. • Produces no pollution. • Supports healthy lifestyle. • It encourages transit use . SCALE :
-
METHODOLOGY Department of Urban & Regional Planning School of Planning & Architecture JNAFAU
B.MOUNIKA 16011BA008 Thesis Guide
E. Sandhya Reddy G. Sai Krishna Kumar
B.Tech Planning IV Year VIII Semester
Sheet No
2
TIME LINE NMT POLICY)
NUTP POLICY(2006)
National urban transport policy • Safe , affordable , quick , comfortable ,reliable and sustainable urban transport. • Priority to non motorized transport.
UTTIPEC (2009)
Unified Traffic and Transportation Infrastructure {Plg. & Eng..} Centre • Increase in comfort for current walking population. • Prioritization of public transport • Reduced dependency on the car.
Footpaths should be provided on both sides on all categories of street.
INFRASTRUCTURE
IRC Guidelines (2012)
Pedestrian Crosswalks
Footpath zone
Width
Mid block zones
Crossing interval
Residential
1.8m
80-250m
Commercial
2.5m
Residential areas Commercial
80-150m
High intensity commercial area
Pedestalization if possible
Shopping frontage 3.5-4.5m Bus stops
3m
High intensity commercial areas
4m
At-grade Crosswalk Zebra crossing
Themed Crosswalks
Zebra crossings should always be accompanied by a STOP Line . Width -2-4 m.
Refuge islands can provide a safe place for pedestrians to wait for a green signal.
Themed crosswalks can be used on streets that are buzzing with pedestrian activities, like a shopping district. Minimum 3m wide pedestrian crossing should be provided at all crossings .
ITDP (2013)
Road safety manual –WHO (2013)
Indian Road Congress • Pedestrian vehicle conflicts . • Pedestrian safety. • Inclusive planning. • Standard designs.
Smart city AMRUT Green transport scheme
Institute for Transport Development Policy • A guide to creating footpaths that are safe, comfortable, and easy to use.
Raised crosswalks
Raised crosswalk shall have a minimum width of 3m.
PLANNING PROJECT
Segregation of pedestrians and vehicles either in space or it time so that pedestrians and vehicles are not in the same place simultaneously.
Pedestrian Lighting ·Along the sidewalk, ·At street corners, ·At access to atgrade crosswalk. · All subways and foot over bridges should be well lit.
Grade Separated Crosswalk All foot over bridges and subways should be universally accessible. Foot Over Bridges are necessary for streets with high speed transit corridors.
Humped pedestrian crossing
SCALE :
-
LITERATURE REVIEW Department of Urban & Regional Planning School of Planning & Architecture JNAFAU
B.MOUNIKA 16011BA008
ACTION PLAN FOR PEDESTRIANS AT SECUNDERABAD JUNCTION
Thesis Guide
E. Sandhya Reddy G. Sai Krishna Kumar
B.Tech Planning IV Year VIII Semester
Sheet No
3
(a)One-step (b)Two-step
PLANNING PROJECT
Movement
Oblique crossings perpendicular crossing
BEHAVIOUR
of
pedestrians:
Pedestrian signals
Stepping , walking or running off footway .
Mixed crossings Source : Pedestrian safety manual –WHO
Source :Pedestrian Road Crossing Behavior Under Mixed Traffic Conditions
Source : Ministry of road transport and Highways
Other factors
• Inadequate enforcement of traffic laws; • Unsafe driving practices. • Driver distraction, including mobile phone use.
FACTORS Speed:
Higher the speed of vehicles higher the risk for pedestrian. – S.J Aston , Road safety
San Francisco MTA Vision Zero Action Plan
Vehicle design: The design of the vehicle exterior can have a significant effect on the severity of injuries. – SJ Aston , Road safety .
Inadequate visibility :Crash Built up & non severity increases as vehicle built up: Most of
speed increases, visibility of the crashes occur in built up area . pedestrian decreases.
Source : Pedestrian safety manual –WHO
Source : Walkable City Rules
INTERSECTIONS
Y – SKEWED SCALE :
CROSS
T –INTERSECTION
OFFSET
CROSS SKEWED ROTATORY INTERJUNCTION
MULTI-INTERSECTION
Source : Intersection safety Federal highway
ACTION PLAN FOR PEDESTRIANS AT SECUNDERABAD JUNCTION
-
LITERATURE REVIEW Department of Urban & Regional Planning School of Planning & Architecture JNAFAU
B.MOUNIKA 16011BA008 Thesis Guide
E. Sandhya Reddy G. Sai Krishna Kumar
B.Tech Planning IV Year VIII Semester
Sheet No
4
LITERATURE REVIEW TITLE
PUBLICATION CONCEPT
INDICATORS/ PARAMETERS
METHOD/ANALYSIS
Pedestrian 1998, Accommodati swless ons at Intersections in US .
Design features • locations of • Informal that are critical in high pedestrian study. order to provide use. • Review for pedestrian statistics. access at intersections.
Pedestrian 2009 Safety at winter Intersections at US.
Reduce pedestrian fatalities injuries.
• Intersections • Pedestrian and Fatalities statics
PLANNING PROJECT OUTCOME
traffic • Crosswalk improvements; crash • Intersection design. • Intersection operations and signal technology.
• Traffic volumes. • Observations. • Road safety audit.
• • • •
Enhancements. Curb extension. Raised crosswalk. Rectangular Rapid-Flashing Beacon.
• Signalized • Direct observation. • Crosswalk and intersection sites • videography Improvements. • Four arm surveys. intersections • Pedestrian crossing speed. • Pedestrian crossing compliance.
OBSERVATIONS
Notes
Pedestrian accommodations at intersections include both traffic signal and pavement marking improvements.
• The average pedestrian crossing speed is estimated to be 1.36 m/sec for perpendicular movement conditions and as 1.98 m/sec for oblique movement conditions.
Pedestrian safety at intersections requires coordination among authorities, professional engineers, education experts, and vehicle designers.
• Pedestrian crossing behavior is divided into four categories namely “one stage”, “two-stage” “perpendiculaire direction” and “oblique direction”.
Study on 2014 Pedestrian Vedagiri Crossing Behavior at Signalized Intersections in Mumbai.
Increase walkability reduce pedestrian accidents.
Pedestrian 2014 crossing Akash Jain1 , behavior Ankit Gupta analysis at intersections in Roorkee.
Improve • Land use • Direct observation • Crossing Time and pedestrian safety • Width of the methods, Waiting Time. while crossing the road • Video observation • Pedestrian road. • Type of methods Crossing Speeds intersection. • Time Lapse Photography • Pedestrian opinion surveys.
The pedestrian crossing behavior analysis is an important factor for pedestrian safety .
Study on 2019 pedestrian Archana crossing behavior at intersections in Thrissur district.
Understanding • Pedestrian flow. the pedestrian • Pedestrian crossing behavior characteristics. at both controlled and uncontrolled intersections.
To develop pedestrian delay models at controlled and SCALE : uncontrolled intersections.
• video survey.
graphic • Pedestrian Crossing Patterns. • Crossing Speed and Crossing Pattern.
Pedestrian-vehicular interaction were analyzed. Gender , age has a significant impact on crossing speed.
• Pedestrian crossing speed of a male is more than that of a female.
-
LITERATURE REVIEW Department of Urban & Regional Planning School of Planning & Architecture JNAFAU
B.MOUNIKA 16011BA008
ACTION PLAN FOR PEDESTRIANS AT SECUNDERABAD JUNCTION
Thesis Guide
E. Sandhya Reddy G. Sai Krishna Kumar
B.Tech Planning IV Year VIII Semester
Sheet No
5
PEDESTRIAN PLAN FOR KOZHIKODE CITY
DELHI PEDESTRIAN DESIGN GUIDELINES • Delhi is the capital city of India with a population about 11millions. • Its area is about 159 sq.kms. • Roads in Delhi were primarily designed to increase the speed and ease movement of cars . Delhi has more cars than in other states. • Nearly half of the fatal accidents in Delhi involve PEDESTRIANS. Modal share of Delhi 40% of the total roads do not have sidewalks
44%
23% 33%
Kozhikode is a coastal city in Kerala with a population about 6,13,255.
Issues
• Lack of pedestrian infrastructure facilities . • About 90% of the roads of Kozhikode do not have footpaths. • Rise in the use of private vehicles.
Objectives
Motorized Private Transport Public Transport Non motorised Transport
Goals 1. Ensure preferred pubic transport. 2. Provide safety, comfort and amenities to all users . 3. Provide universal accessibility and civic amenities . Proposals & achievements Pavement zone
Pedestrian only Zone
Kerb height -Continuous 150mm pavement
Auditory signals
• Provide pedestrian infrastructure facilities . • Widening of sidewalks . • Integrate land use pattern & street connectivity . PEDESTRIAN VIBRANCY MAP Priority
Built ups
Catchment area
Score
Up to 400m
10
HIGH
Transit stations CBD Market , hospital
400m-800m
7
Above 800m
4
Up to 400m
7
400m-800m
4
Above 800m
1
Up to 400m
4
400m-800m
1
Above 800m
0
MEDIUM
LOW
Nodes FOB
Accessible bus stops
Tactile paving
School / college High residential area community centers Local bus stop , restaurant
Slope
Trees occupy walking zone
Crossings
Marked cycle lanes-vehicles freely drive and park on these cycle lanes.
Bus stops completely occupy the footpath without accessing pedestrians.
Pedestrian vibrancy map of city
Land use Pedestrian vibrancy map
Failures
Hawkers occupy footpaths
PLANNING PROJECT
Proposals Pedestrian network plan . Safe routes to schools. Rerouting and speed limits. Curb ramps , sidewalks according IRC standards . • Pedestrian only districts . • • • • •
ACTION PLAN FOR PEDESTRIANS AT SECUNDERABAD JUNCTION
Pedestrian activity map SCALE :
-
DESKTOP STUDY Department of Urban & Regional Planning School of Planning & Architecture JNAFAU
B.MOUNIKA 16011BA008 Thesis Guide
E. Sandhya Reddy G. Sai Krishna Kumar
B.Tech Planning IV Year VIII Semester
Sheet No
6
COMPARISION OF DESKTOP STUDIES
PEDESTRIAN SAFETY ACTION PLAN FOR VIRGINIA Virginia, a southeastern U.S state along the coast with a Population of 85.2 lakhs .
SUMMARY OF Virginia pedestrian safety plan
Year
2012
2013
2014
2015
2016
Pedestrian crashes
1752
1641
1595
1564
1681
Location of Fatal versus Injury Crashes
62%
51%
Mid-Block
12%
19%
Unsignalized Intersection
13%
Source : Virginia Department of Transportation
22%
Signalized Intersection
1
2
3
4
Objectives • Identify the locations with the highest number of pedestrian crashes . • Consider the relationship between land use and pedestrian safety . • Identify countermeasures that address key pedestrian safety issues. Parameters • Speed limit. • Presence of median or signalized crossing. • Land use context and nearby pedestrian destinations. • Location of crashes relative to crossing types. Counter measures Pedestrian crash Hotspots
High-visibility crosswalk
In-street Yield sign
Curb Extension
raised crosswalks
Increase pedestrian Pedestrian crossing time Countdown signal
Transit stop access improvements.
PLANNING PROJECT
channelized right turn Source :Virginia departm ent of transport ation
• Virginia is a state in U.S with a population about 85.2 lakhs. • Pedestrian crashes were more at un signalized intersections and mid blocks according to the pedestrian crash analysis. • 19 hotspots were identified with high traffic , pedestrian activity. • Counter measures were planned. Source :Virginia department of transportation
SUMMARY OF DELHI PEDESTRIAN DESIGN GUIDE LINESS • Delhi is the capital city of India with a population about 11 million . • Pedestrian design guidelines were prepared as 44% of the population use non motorized transport. • The were no side walkways , inadequate kerb heights , encroached footpaths. • Guidelines were prepared in order to provide safe , accessible and comfort infrastructure for pedestrians. Source : Delhi pedestrian design guidelines
SUMMARY OF KOZHIKODE CITY PEDESTRIAN PLAN.
• Kozhikode is a small city with 6 lakhs population. • The use of private vehicles has been increased. • Pedestrian vibrancy map has been prepared use index scoring method . • Study area is delineated based on the high activity nodes. • Nodes, slope , land use and high pedestrian activity areas were taken for site selection. • Pedestrian activity map is prepared. Source :comprehensive mobility plan for Kozhikode city
ACTION PLAN FOR PEDESTRIANS AT SECUNDERABAD JUNCTION
SCALE :
-
DESKTOP STUDIES Department of Urban & Regional Planning School of Planning & Architecture JNAFAU
B.MOUNIKA 16011BA008 Thesis Guide
E. Sandhya Reddy G. Sai Krishna Kumar
B.Tech Planning IV Year VIII Semester
Sheet No
7
Urban sprawl of GHMC Area in Hyderabad 1997 2007
Location Telangana
2017
PLANNING PROJECT Key Map
India
Hyderabad
Profile
• Hyderabad is the capital city of Telangana state. • Population is about 6.9 million as per 2011 census. • It is second largest metropolitan region with 7,228 sqkms. • Hyderabad is a great hub for administration ,Industrial , education , medical , cultural activities . • There are 3 National highways and 5 State highways . Population Total registered vehicles (2019)
Vehicles
6000000
Urban Sprawl of GMNC Area from 1997-2017
Pedestrian accidents occur more in the peripheral area of GHMC due to the urban sprawl of the city which is more to wards the west (IT Hub). • lack of pedestrian infrastructure. • 3 National highways and 5 State highways. Total pedestrains involved in accidents 1000
Telangana
Hyderabad
800
40 Million
12.24 million
600
1,25,59,616
55,69,000
Registered vehicles
Jaywalking is one of most common issue on the city roads.
400 200 0 Simple
4000000
Grievous 2016
Fatal 2017
Total 2018
Injured 2019
2000000 0 2015
2016
2017 2018 Year Registered vehicles
2019
Source : Telangana government , RTO
1/4th
Hyderabad accounts of the total vehicles in Telangana state .More than 1000 new vehicles are registered within Hyderabad daily .
Deaths
Pedestrians struggle to cross the roads in the absence of zebra crossing .
3000 2900 2800 2700 2600
2945 2761
Source : Hyderabad , Cyberabad Traffic police
Pedestrian infrastructure facilities in Hyderabad
2834 2846
Accidents Accidents in Hyderabad
Footpaths available
MCH
GHMC
HMA
Footpath
44%
12%
1%
No Footpath
56%
88%
99%
Total length
582km
660km
3674km
Total road length of HMA -17,000KM
ACTION PLAN FOR PEDESTRIANS AT SECUNDERABAD JUNCTION
SCALE :
-
PROFILE Pedestrians forced to walk on the road as two-wheelers were riding on the footpath.
Department of Urban & Regional Planning School of Planning & Architecture JNAFAU
B.MOUNIKA 16011BA008 Thesis Guide
E. Sandhya Reddy G. Sai Krishna Kumar
B.Tech Planning IV Year VIII Semester
Sheet No
8
PARAMETERS FOR SELECTION CRITERIA OF THE NODES
CORE AREA (MCH)
IN PERIPHERAL AREA OF GHMC
1.Pedestrian flow
1.Accident Prone Areas
2.Land use
2.Land use
3.Junctions
3.Junctions
4.Type of road
4.Type of Road
PEDESTRIAN ACCIDENTS FROM 2017-2019 Police station 2017 2018 area 47 49 Miyapur 56 51 KPHB 45 36 Madhapur 40 45 Kukatpally 23 43 RC puram 38 Rajendranagar 37 35 50 Medchal Pet 43 35 baheerabad 47 38 Banjara hills 31 Mailardevpally 41 30 25 Saidabad 27 30 Panjagutta 25 39 S.R.Nagar 32 29 Raidurgam 27 40 RGIA 27 Chandanagar 38 29 32 Narsingi 27 32 Bowenpally Osmania 27 27 university 30 22 Saidabad
2019
Total
Average
65 30 46 35 50 40 26
161 137 127 120 116 115 111
54 46 42 40 39 38 37
27
105
35
18 29 39 36 29 32 26 26 28 25
103 101 94 93 93 93 93 91 89 84
34 34 31 31 31 31 31 30 30 28
29
83
28
28
80
27
Source: Hyderabad traffic police
High pedestrian accident prone areas in GHMC .
A buffer zone of 750m is considered around the node . PEDESTRIAN FLOW (Persons /day) Area Total Secunderabad 20,580 Mehdipatnam 10,190 Kukatpally 9,900 Paradise 4,618 Tarnaka junction 3,707 ECIL X road 3,494 Balanagar junction 2,940 Fever hospital junction 2,048 Radhika theatre 1,970 Mettuguda junction 1,781
Pedestrian Accident prone areas
PLANNING PROJECT Key Map
LEGEND Source : CTS report 2011
NODES IN GHMC PERIPHERIAL AREA Area Miyapur KPHB
2017 2018 2019 Total Average
Junction
Land use
47 56
49 51
65 30
161 137
54 46
Miyapur Xroads Commercial JNTU junction Institutional
Madhapur 45
36
46
127
42
RC Puram
23
43
50
116
39
Cyber Towers Junction Beeramguda Jn
Rajendra nagar
37
38
40
115
38
Office Industrial
Rajendra nagar Residential X roads Source: Hyderabad traffic police
Area Secunderabad (RT +BT+MT) Medhipatnam (Key junction ) Paradise Tarnaka ECIL
NODES IN CORE AREA OF GHMC Pedestrian flow Junction 20,580 10,190 4,618 3,707 3,494
Rathifile Rithu bazar junction Paradise junction Tarnaka X Rd ECIL X Roads
ACTION PLAN FOR PEDESTRIANS AT SECUNDERABAD JUNCTION
Land use Transportation hub Mixed Commercial Commercial Industrial Source : CTS report
Rules pertaining to zebra crossings are been violated by the pedestrians and motorist. SCALE :
1:25,000
SELECTION CRITERIA Department of Urban & Regional Planning School of Planning & Architecture JNAFAU
B.MOUNIKA 16011BA008 Thesis Guide
E. Sandhya Reddy G. Sai Krishna Kumar
B.Tech Planning IV Year VIII Semester
Sheet No
9
Land use patterns play a significant role in encouraging walks.
There are about 152 signalized intersections in Hyderabad.
PEDESTRIAN ACCIDENT HOTSPOTS 1 Miyapur
2 JNTU Junction
Intersection :Y type. Landuse: commercial Road type :National Highway . 4 Buffer zone :750m 50 accidents per year.
3 Madhapur
Intersection :T type. Landuse: Institutional Road type : National Highway. Buffer zone :750m High pedestrian accident prone area .
4 RC Puram
Intersection :X Roads. Landuse: Office space Road type :Major arterial Road . Buffer zone :750m IT Hub. Intersection :T type Landuse: Industrial Road type : National Highway. Buffer zone :750m Suburb of the city.
PLANNING PROJECT
6 Secunderabad
Intersection :Y ,Rotatory . Land use: Transportation hub. Road type :Major Arterial Road Buffer zone :750m It connected with Bus ,Rail and Metro terminal .
7 Medhiptnam
Intersection :Y , T type Land use: Mixed Road type :Major Arterial Road . Buffer zone :750m It is a key junction connecting to shamshabad airport and outer parts of the city .
8 Paradise 5
5 Rajendra Nagar
10 Tarnaka
9 ECIL Intersection :X Roads Land use: Residential Road type : State Highway . Buffer zone :750m.
Key Map
Intersection :X type Landuse: Commercial Road type :Major Arterial road Buffer zone :750m
ACTION PLAN FOR PEDESTRIANS AT SECUNDERABAD JUNCTION
Intersection :X road s Land use: commercial Road type :National Highway. Buffer zone :750m It is connected with metro and bus terminal . Intersection :Rotatory Land use: Mixed Road type :Arterial road Buffer zone :750m It is a major bus transportation terminal .
NODE : A node is a meeting point of two or more routes. SCALE :
1:25,000
SELECTION CRITERIA Department of Urban & Regional Planning School of Planning & Architecture JNAFAU
B.MOUNIKA 16011BA008 Thesis Guide
E. Sandhya Reddy G. Sai Krishna Kumar
B.Tech Planning IV Year VIII Semester
Sheet No
10
Telangana
STUDY AREA
Hyderabad district
Secunderabad is the twin city of Hyderabad. Secunderabad is one of the oldest and busiest area . It is a major transportation hub . The area surrounding the Secunderabad railway station is mainly a hub for commercial and residential areas, and military and national security forces. • Secunderabad Railway is an oldest and busiest railway station in India which handles 1.8 lakhs passengers per day. Source :Maps of India • Bus terminals in Secunderabad like Rathifile, Chilakalguda, Uppal Secunderabad Junction bus stop, Alpha Hotel (opposite the railway station) and bus stand opposite Gurudwara provide connectivity to various parts of the city . • • • •
Mode of changes at Secunderabad Railway station area • Metro • MMTS • City busses • Autos • Cabs • Private vehicles (4 wheeler & 2 wheeler ) • Pedestrians Pedestrian inter change mode at secunderabad railway station area .
Pedestrian Inter change Modes
% of Pedestrians
54%
22%
Rail-Bus
Rail-Auto
Source : International transport guidelines
Inference :11,500 pedestrians per hour are observed moving between various halts of the city buses and study area.
18%
Bus-Bus Modes
4%
2%
Rail-Private vehicle
Bus-Auto
Source : Planning for multi modal hub at secunderabad Report(2014)
PLANNING PROJECT
Secunderabad Node
Case Area :750sqmts walkability distance.
Study out line Land use observation Pedestrian infrastructure facilities
Pedestrian volume count Traffic volume count
Existing features Road carriage widths
Parking survey
• Total commuters and pedestrian movement is 5.10 lakh per day. • 60% of the commuters travelling are interchanges. • Estimated area for operating the bus terminals is about 3.10 acers.
ACTION PLAN FOR PEDESTRIANS AT SECUNDERABAD JUNCTION
SCALE :
1:2,500
STUDY AREA Department of Urban & Regional Planning School of Planning & Architecture JNAFAU
B.MOUNIKA 16011BA008 Thesis Guide
E. Sandhya Reddy G. Sai Krishna Kumar
B.Tech Planning IV Year VIII Semester
Sheet No
11
1
Secunderabad Railway station
2 Kukatpally Bus Terminal
3 Rathifile Bus Terminal
4
44
Rezimental bazar Bus Terminal
PLANNING PROJECT
5 Rezimental St
2
6
5
Secunderabad 6 East Metro
3
11
8 1
7
7
9
Secunderabad Exist Terminal
10
SCALE :
1:2500
BASE MAP Department of Urban & Regional Planning School of Planning & Architecture JNAFAU
11 Secunderabad bus stop
10 Bhoiguda Bus stop
9 ChilkalgudaCircle
ACTION PLAN FOR PEDESTRIANS AT SECUNDERABAD JUNCTION
8
Uppal bus Terminal
B.MOUNIKA 16011BA008 Thesis Guide
E. Sandhya Reddy G. Sai Krishna Kumar
B.Tech Planning IV Year VIII Semester
Sheet No
12
LAND USE MAP OF STUDY AREA
Land Use 7%
Residential Commercial
38%
20% 3% 32%
PLANNING PROJECT Land use Legend Residential
Public semi Public Transportation
Commercial Public % Semi Public Transportation & Communication
Roads
Roads
Inference : Secunderabad study area has a mixed type of land use with various government offices and commercial spaces such as Monda market , Rezimental bazar. The roads are occupied by street hawker along the footpaths and roads.
Metro line
Source : Primary Survey
TRAFFIC FLOW PATTERN
Traffic Vehicle Composition volume 1% count is 12% 2- Wheeler observed 2% in the 3-Wheeler 35% peak Car/Jeep hours 8- 22% LCV/Tempo 10 , 12-2 , 4-6 and 8Bus 28% 10.
Traffic Flow High Traffic flow Moderate Traffic flow Low traffic flow Public traffic flow
Truck/Lorry
• Bikes are the dominant vehicles followed by 3-wheelers . • 1000 buses originate and terminate in these bus stops . • Around 3 lakh vehicles flow in the study area . Source : Primary Survey ACTION PLAN FOR PEDESTRIANS AT SECUNDERABAD JUNCTION
SCALE :
1:2,500
LAND USE ,TRAFFIC Department of Urban & Regional Planning School of Planning & Architecture JNAFAU
B.MOUNIKA 16011BA008 Thesis Guide
E. Sandhya Reddy G. Sai Krishna Kumar
B.Tech Planning IV Year VIII Semester
Sheet No
13
RATHIFLFE JUNCTION
CHILKALGUDA JUNCTION
Towards Blue sea
PLANNING PROJECT
LEGEND
Towards Sec T2
Towards Mettuguda
Towards Railway station
Towards Oliphanta Bridge
Towards Chilkalguda circle TRAFFIC FLOW AT RATHIFILE JUNCTION AT PEAK HOURS 9AM 12 AM 4 PM
Towards Bhoiguda Towards Sitafalmandi TRAFFIC FLOW AT CHILKALGUDA JUNCTION AT PEAK HOURS 9AM
4 PM
8 PM
TVC Heavy Moderate Low
Radar Legend 8 PM
6 PM
RATHIFILE JUNCTION 4%
0%
3-Wheeler
9%
Car/Jeep
47%
21%
Towards Rathifile 2000 1500 1000 500 0
2-Wheeler
0%
LCV/Tempo Bus
19%
HGV
Towards Other Chilkalaguda Circle
12 PM
10 PM
CHILKALGUDA JN 3%
1%
Towards Blue sea Hotel
2-Wheeler
8%
3-Wheeler 44%
24%
Inference- The radar shows the hourly average vehicular traffic flow through the Rathifile Junction. The traffic flow is mainly dominated 2-wheeler followed by 4-wheelers. The traffic flow is high in towards Chilkalguda and blue sea hotel. Source :Primary Data Survey
6 PM
Car /Jeep LCV /Tempo
20%
Bus
Truck/Lorry
Towards Mettuguda 1500 Towards 1000 Oliphanta 500 Bridge 0 Towards Secunderabad Railway station
10 PM
Towards Sitafalmandi
Towards Bhoiguda
Inference : The radar shows the hourly average traffic flow through Chilkalguda junction. The traffic composition is dominated by 2-wheelers and followed by cars. The traffic flow is high towards Mettuguda , Bhoiguda and Oliphanata Source :Primary Data Survey Bridge
ACTION PLAN FOR PEDESTRIANS AT SECUNDERABAD JUNCTION
SCALE :
1:1000
TVC ANALYSIS Department of Urban & Regional Planning School of Planning & Architecture JNAFAU
B.MOUNIKA 16011BA008 Thesis Guide
E. Sandhya Reddy G. Sai Krishna Kumar
B.Tech Planning IV Year VIII Semester
Sheet No
14
NORTH TERMINAL (GURUDWARA) JN
SECUNDERABAD JUNCTION
PLANNING PROJECT
Towards Clock Tower
Legend Towards Rathifile
Towards Shankar Mandal Rd TRAFFIC FLOW AT SECUNDERABAD JN AT PEAK HOURS
TRAFFIC FLOW AT GURUDWARA JUNCTION AT PEAK HOURS 9AM
4 PM
9AM
8 PM
12APM
TVC
8 PM
Heavy Moderate Low
Radar Legend
12 PM 0%
32%
21% 28%
TRAFFIC FLOW
1000 0
4 PM
10 PM
6 PM
GURUDWARA JN
18%
1%
6 PM
600 800
SECUNDERABAD JUNCTION Inference : The bar graph 0% 2-Wheeler shows the hourly average 2-Wheeler flow through Towards 3-Wheeler traffic 3-Wheeler monda junction. The 1% 20% Car /Jeep Gurudwara 32% market Car /Jeep Traffic flow is high towards LCV /Tempo clock tower and railway LCV /Tempo Bus 20% station The traffic flow is Truck/Lorry Bus 27% dominated by the 2-wheelers.
500 750
350 600
24 30
2-Wheeler 3-Wheeler Car /JeepLCV /Tempo Towards Clocktower
Truck/Lorry
450 350 Bus
2
4
Truck/Lorry
Towards Railway station
Towards Rathifile 600 400 200 0
10 PM
Towards Clock tower
SCALE :
Towards Shankar Mandal
Inference : The Radar shows the hourly average traffic flow that is high towards Clock Tower and Rathifile . The vehicle composition is dominated by 2-wheelers followed by 3Source :Primary Data Survey wheeler ,4-wheeler and Buses.
ACTION PLAN FOR PEDESTRIANS AT SECUNDERABAD JUNCTION
Source :Primary Data Survey
1:1000
TVC ANALYSIS Department of Urban & Regional Planning School of Planning & Architecture JNAFAU
B.MOUNIKA 16011BA008 Thesis Guide
E. Sandhya Reddy G. Sai Krishna Kumar
B.Tech Planning IV Year VIII Semester
Sheet No
15
The pedestrian flow at this site area varies with the peak months such as holidays festival s. There is a continuous flow of pedestrians from 5am to 12 am due to the presence of railway station.
PLANNING PROJECT LEDEND : Pedestrian flow /15min
Above 700 500 - 700 300 - 500
100 - 300 50 - 100 0 - 50 SITE AREA ALONG THE ROAD ACROSS THE ROAD
41% 59% RATHIFILE JUNCTION
CHILKALGUDA JUNCTION
ALONG THE ROAD
44% 56%
ALONG THE ROAD
48%
ACROSS THE ROAD
52%
Inference : Pedestrians flow is high along the road towards blue sea hotel due to the presence of bus terminal which connects east part of the city.
ACROSS THE ROAD
Inference : Pedestrians flow across the road and along the road are nearly equal due to the presence of bus stops towards each road at this junction.
GURUDWARA BUS STOP
ALONG THE ROAD
32% 68%
ACROSS THE ROAD
Inference :The pedestrian flow is high along the road than across the road at this junction. Source : Primary Survey
ACTION PLAN FOR PEDESTRIANS AT SECUNDERABAD JUNCTION
SECUNDERABAD JUNCTION
43% 57%
ALONG THE ROAD ACROSS THE ROAD
Inference :Pedestrians at this junction mostly consists of railway passengers they walk to the railway station from bus terminals.
Inference : Overall 59 % of the pedestrian flow is along the road .
SCALE :
1:2,500
PEDESTRIAN FLOW MAP Department of Urban & Regional Planning School of Planning & Architecture JNAFAU
B.MOUNIKA 16011BA008 Thesis Guide
E. Sandhya Reddy G. Sai Krishna Kumar
B.Tech Planning IV Year VIII Semester
Sheet No
16
Towards Blue sea
RATHIFILE JUNCTION
PLANNING PROJECT
Road Cross Sections
RATHIFILE JUNCTION
A’
Towards Railway station
A
PVC
C’
Heavy Moderate
C
Low B’ B
A Towards Chilkalguda circle
A’
PEDESTRIAN FLOW AT RATHIFILE JUNCTION AT PEAK HOURS
8:30-9:30AM
12:30-1:30PM
Finding • A sky walk is provided from the metro to the rathifile bus stop. • The way through ROB is unhygienic and congested for the pedestrians to walk.
Source : Primary Survey
5:30-6:30 PM 8:30-9:30 PM • The pedestrian flow is high towards railway station with 4,068 pedestrians per hour in the evening hours . • The pedestrian flow towards Blue sea hotel is about 1,680 persons per hour. Most of the pedestrians move towards railway station and to wards Blue sea hotel. • Most of the pedestrians cross the road at rathifile junction with a maximum count of 1452 per hour.
B
B’
SCALE :
1:1000
PVC ANALYSIS Department of Urban & Regional Planning School of Planning & Architecture JNAFAU
C
ACTION PLAN FOR PEDESTRIANS AT SECUNDERABAD JUNCTION
C’
B.MOUNIKA 16011BA008 Thesis Guide
E. Sandhya Reddy G. Sai Krishna Kumar
B.Tech Planning IV Year VIII Semester
Sheet No
17
450 400 350 300 250 200 150 100 50 0 08:00-08:15 08:15-08:30 08:30-08:45 08:45-09:00 09:00-09:15 09:15-09:30 09:30-09:45 09:45-10:00 12:00-12:15 12:15-12:30 12:30-12:45 12:45-01:00 01:00-01:15 01:15-01:30 01:30-01:45 01:15-02:00 04:00-04:15 04:15-04:30 04:30-04:45 04:45-05:00 05:00-05:15 05:15-05:30 05:30-05:45 05:45-06:00 08:00-08:15 08:15-08:30 08:30-08:45 08:45-09:00
ALONG THE ROAD FROM BLUE SEA TO RATHIFILE JN
Time
Towards Railway Station
500 400 200 100 08:00-08:15 08:15-08:30 08:30-08:45 08:45-09:00 09:00-09:15 09:15-09:30 09:30-09:45 09:45-10:00 12:00-12:15 12:15-12:30 12:30-12:45 12:45-01:00 01:00-01:15 01:15-01:30 01:30-01:45 01:15-02:00 04:00-04:15 04:15-04:30 04:30-04:45 04:45-05:00 05:00-05:15 05:15-05:30 05:30-05:45 05:45-06:00 08:00-08:15 08:15-08:30 08:30-08:45 08:45-09:00
0
ACROSS THE ROAD TOWARDS BLUE SEA HOTEL ACROSS THE ROAD FROM BLUE SEA TO RATHIFILE JN
PLANNING PROJECT
RATHIFILE JUNCTION Pedestrian Flow at at this junction mostly inter change at the Bus terminals and Railway station.
Towards Blue sea
ALONG THE ROAD TOWARDS RAILWAY STATION ALONG THE ROAD FROM RAILWAY STATION
300
ACROSS THE ROAD TOWARDS RAILWAY STATION ACROSS THE ROAD FROM RAILWAY STATION
Inference The Pedestrian flow is extremely high in to and fro direction from Railway station To Rathifile junction. The average Pedestrian Flow along the roads is 400 persons and 200 across the road per 15 minutes.
Towards Chilkalguda circle
Towards ROB (Chilkalguda circle) 350 300 250 200 150 100 50 0
ALONG THE ROAD TOWARDS ROB ALONG THE ROAD FROM ROB TO JN
08:00-08:15 08:15-08:30 08:30-08:45 08:45-09:00 09:00-09:15 09:15-09:30 09:30-09:45 09:45-10:00 12:00-12:15 12:15-12:30 12:30-12:45 12:45-01:00 01:00-01:15 01:15-01:30 01:30-01:45 01:15-02:00 04:00-04:15 04:15-04:30 04:30-04:45 04:45-05:00 05:00-05:15 05:15-05:30 05:30-05:45 05:45-06:00 08:00-08:15 08:15-08:30 08:30-08:45 08:45-09:00
Pedestrians
Inference • The average pedestrian flow along the road is about 230 persons per 15 minutes. • The pedestrian flow across the road is about 100 persons per 15minutes. • The pedestrian flow is high in the morning and evening hours. • Most of pedestrians flow towards ROB due to the presence of 5 bus stops.
ALONG THE ROAD TOWARDS BLUE SEA HOTEL
Towards Railway station
Pedestrians
600
Towards Blue sea –From blue sea Pedestrians
Inference • Pedestrian flow is heavy due to the presence of Metro and a 2 bus terminals. • Average pedestrian flow along the road is about 360 pedestrians and across the road is about 300 per 15 minutes. • The pedestrian flow is heavy during the morning and evening hours.
Time
ACTION PLAN FOR PEDESTRIANS AT SECUNDERABAD JUNCTION
ACROSS THE ROAD TOWARDS ROB ACROSS THE ROAD FROM ROB TO JN
Source : Primary Survey
SCALE :
1:1000
PVC ANALYSIS Department of Urban & Regional Planning School of Planning & Architecture JNAFAU
B.MOUNIKA 16011BA008 Thesis Guide
E. Sandhya Reddy G. Sai Krishna Kumar
B.Tech Planning IV Year VIII Semester
Sheet No
18
Towards Oliphanta Bridge
CHILKALGUDA JUNCTION
A’
D
D’
B’ C C’
Towards Mettuguda
A
Towards Sec T2
PLANNING PROJECT
E’
E
Towards Bhoiguda
Road Cross Sections
CHILKALGUDA JUNCTION LEGEND
A
A’
B B’
B
Towards Sitafalmandi
PEDESTRIAN FLOW AT CHILKALAGUDA JUNCTION AT PEAK HOURS 8:30-9:30AM
12:30-1:30PM PVC C
Heavy
C’
Moderate Low
D
5:30-6:30 PM • • • • •
D’
8:30-9:30 PM
At this junction the pedestrian flow is high across the roads. There are about 6 bus stops near the junction. Pedestrians interchange from railway station to different bust stops. The pedestrian flow is high towards ROB . The pedestrian flow is observed with the arrival and departure of E trains from the Exist road. Source : Primary Survey ACTION PLAN FOR PEDESTRIANS AT SECUNDERABAD JUNCTION
SCALE :
1:1000
PVC ANALYSIS Department of Urban & Regional Planning School of Planning & Architecture JNAFAU
E’
B.MOUNIKA 16011BA008 Thesis Guide
E. Sandhya Reddy G. Sai Krishna Kumar
B.Tech Planning IV Year VIII Semester
Sheet No
19
CHILKALGUDA JN –TOWARDS ROB
08:00-08:15 08:15-08:30 08:30-08:45 08:45-09:00 09:00-09:15 09:15-09:30 09:30-09:45 09:45-10:00 12:00-12:15 12:15-12:30 12:30-12:45 12:45-01:00 01:00-01:15 01:15-01:30 01:30-01:45 01:15-02:00 04:00-04:15 04:15-04:30 04:30-04:45 04:45-05:00 05:00-05:15 05:15-05:30 05:30-05:45 05:45-06:00 08:00-08:15 08:15-08:30 08:30-08:45 08:45-09:00
Pedestrians
350 300 250 200 150 100 50 0
Time
Towards Oliphanta Bridge
CHILKALGUDA - METTUGUDA
350 250 200
CHILKALGUDA JUNCTION
ALONG THE ROAD TOWARDS METTUGUDA
150 ACROSS THE ROAD TOWARDS METTUGUDA
100 50 0
ACROSS THE ROAD FROM METTUGUDA
The pedestrian flow is high due to the presence of Bus stops where they interchange. The pedestrian crossing pattern is high at this junction. The pedestrians are high along the road towards Mettuguda TOWARDS BHOIGUDA
TOWARDS CKILKALGUDA CIRCLE
Inference: The pedestrian outflow is high than the inflow at the SEC EXIT (T2) road .
200 150 100 50 0 08:00-08:15 08:15-08:30 08:30-08:45 08:45-09:00 09:00-09:15 09:15-09:30 09:30-09:45 09:45-10:00 12:00-12:15 12:15-12:30 12:30-12:45 12:45-01:00 01:00-01:15 01:15-01:30 01:30-01:45 01:15-02:00 04:00-04:15 04:15-04:30 04:30-04:45 04:45-05:00 05:00-05:15 05:15-05:30 05:30-05:45 05:45-06:00 08:00-08:15 08:15-08:30 08:30-08:45 08:45-09:00
Towards Sitafalmandi
SECUNDERABAD T2
TOWARDS SECUNDERABAD
PLANNING PROJECT
ALONG THE ROAD FROM METTUGUDA
08:00-08:15 08:15-08:30 08:30-08:45 08:45-09:00 09:00-09:15 09:15-09:30 09:30-09:45 09:45-10:00 12:00-12:15 12:15-12:30 12:30-12:45 12:45-01:00 01:00-01:15 01:15-01:30 01:30-01:45 01:15-02:00 04:00-04:15 04:15-04:30 04:30-04:45 04:45-05:00 05:00-05:15 05:15-05:30 05:30-05:45 05:45-06:00 08:00-08:15 08:15-08:30 08:30-08:45 08:45-09:00
Pedestrian Flow
150 100 50 0
300
08:00-08:15 08:15-08:30 08:30-08:45 08:45-09:00 09:00-09:15 09:15-09:30 09:30-09:45 09:45-10:00 12:00-12:15 12:15-12:30 12:30-12:45 12:45-01:00 01:00-01:15 01:15-01:30 01:30-01:45 01:15-02:00 04:00-04:15 04:15-04:30 04:30-04:45 04:45-05:00 05:00-05:15 05:15-05:30 05:30-05:45 05:45-06:00 08:00-08:15 08:15-08:30 08:30-08:45 08:45-09:00
Towards Sec T2
Towards Mettuguda
Towards Bhoiguda
Inference • The average pedestrian flow along the road towards ROB is ALONG THE ROAD FROM about 190 persons and towards ROB the circle is about 230 persons per 15 minutes. ACROSS THE ROAD TOWARDS ROB • The average pedestrian crossings is about 120persons ACROSS THE ROAD per 15 minutes. FROM ROB • The pedestrian flow is high in the morning and evening peak hours. ALONG THE ROAD TOWARDS ROB
Along the Road
Across the Road
Inference : The pedestrian Flow is high due to the presence of bus stop. The pedestrian Flow is High in the morning and evening hours. The average pedestrian flow is about 120 pedestrians per 15 min.
ACTION PLAN FOR PEDESTRIANS AT SECUNDERABAD JUNCTION
Source : Primary Survey
SCALE :
1:1000
PVC ANALYSIS Department of Urban & Regional Planning School of Planning & Architecture JNAFAU
B.MOUNIKA 16011BA008 Thesis Guide
E. Sandhya Reddy G. Sai Krishna Kumar
B.Tech Planning IV Year VIII Semester
Sheet No
20
NORTH TERMINAL (GURUDWARA) JUNCTION
Towards Clock tower
Road Cross Sections
PLANNING PROJECT
GURUDWARA JUNCTION
A’ A
LEGEND D D’
C
B’
Towards Rezimental Bazar
C’
A
Towards Railway station
A’
B
Towards Monda Market
Towards Railway station
PVC Heavy
PEDESTRIAN FLOW AT GURUDWARA JUNCTION AT PEAK HOURS 8:30-9:30AM
Moderate
12:30-1:30PM
B
Towards Clock tower
C’
C
Towards Market Rd
5:30-6:30 PM
8:30-9:30 PM
B’
D
D’
Towards CT
• The pedestrian flow is high towards the clock tower with maximum count of 2121 persons per hour along the road. • The pedestrians across the road are about 1109 per hour.
ACTION PLAN FOR PEDESTRIANS AT SECUNDERABAD JUNCTION
Low
Source : Primary Survey
SCALE :
1:1000
PVC ANALYSIS Department of Urban & Regional Planning School of Planning & Architecture JNAFAU
B.MOUNIKA 16011BA008 Thesis Guide
E. Sandhya Reddy G. Sai Krishna Kumar
B.Tech Planning IV Year VIII Semester
Sheet No
21
PLANNING PROJECT
Towards Clock Tower Pedestrian Flow
500
GURUDWARA JUNCTION
400
300 200 Along the Road Across the Road
100 0
Time
Inference • The average pedestrian flow along the road is about 320 persons per 15 minutes. • The pedestrian crossings are about 150 per 15 minutes. • The pedestrian flow is maximum in the evening hours • The pedestrian flow is high due to the presence of informal sector , church, temple and a city bus stop. • The footpaths are occupied by two wheelers .
400 350 300 250 200 150 100 50 0
Time
ACTION PLAN FOR PEDESTRIANS AT SECUNDERABAD JUNCTION
08:45-09:00
08:30-08:45
08:15-08:30
08:00-08:15
05:45-06:00
05:30-05:45
05:15-05:30
05:00-05:15
04:45-05:00
04:30-04:45
04:15-04:30
04:00-04:15
01:15-02:00
01:30-01:45
01:15-01:30
01:00-01:15
12:45-01:00
12:30-12:45
12:15-12:30
12:00-12:15
09:45-10:00
09:30-09:45
09:15-09:30
09:00-09:15
08:45-09:00
08:30-08:45
08:15-08:30
Source : Primary Survey
08:00-08:15
Pedestrian Flow
Inference • The pedestrian flow is high in the morning peak hours. • The average pedestrian flow is 280 persons per 15 minutes. • Most of the pedestrians are the railway passengers . • The presence of monda market is one of the reason for high Towards Railway Station pedestrian flow .
Along the Road Across the Road
SCALE :
1:1000
PVC ANALYSIS Department of Urban & Regional Planning School of Planning & Architecture JNAFAU
B.MOUNIKA 16011BA008 Thesis Guide
E. Sandhya Reddy G. Sai Krishna Kumar
B.Tech Planning IV Year VIII Semester
Sheet No
22
SECUNDERABAD JUNCTION
Towards Clock Tower
PLANNING PROJECT
Road Cross Section
SECUNDERABAD JUNCTION A
D
A C
C’
A’
Towards Rathifile Bus Stop
A
Towards Rathifile
Towards Monda market
D
B’
LEGEND
B’
B
Towards Shankar Mandal Road
C
B
A’
Towards Monda Market
C’
Towards Shankar Mandal Rd D
PEDESTRIAN FLOW AT SECUNDERABAD JUNCTION AT PEAK HOURS 8:30-9:30AM
12:30-1:30PM
Towards Clock tower
D’
• There is a continuous flow of pedestrians at this junction. • The pedestrian flow is heavy during the arrival and departure of the trains. • The roads are blocked by the Street hawkers causing inconvenience to the pedestrians. • Pedestrian in and out count is about 7,216 and 5,264 per hour. • Railway passengers are the major pedestrians at this junction.
PVC Heavy Moderate Low Source : Primary Survey
SCALE :
1:1000
PVC ANALYSIS 5:30-6:30 PM
8:30-9:30 PM
Department of Urban & Regional Planning School of Planning & Architecture JNAFAU
B.MOUNIKA 16011BA008
ACTION PLAN FOR PEDESTRIANS AT SECUNDERABAD JUNCTION
Thesis Guide
E. Sandhya Reddy G. Sai Krishna Kumar
B.Tech Planning IV Year VIII Semester
Sheet No
23
8 AM
10 AM
PLANNING PROJECT
12 AM
SECUNDERABAD JUNCTION
420
432
6 PM
4 PM
438
510
464
8 PM
410
Average Pedestrian flow for 15 minutes at Secunderabad junction . • Secunderabad Junction is a major intercity railway station and a commuter rail hub in the Hyderabad urban area. In the city center, the station is in the South Central Railway zone of Indian Railways. • Built in 1874 by the Nizam of Hyderabad during the British era. • Pedestrian flow in and out count is about 7,216 and 5,264 per hour. • Due to the presence of Railway station , bus stops and metro stations generate huge pedestrians at this junction. • Monda market is the informal street fully occupied by street vendors and pedestrians.
Source : Primary Survey
SCALE :
1:1000
PVC ANALYSIS Department of Urban & Regional Planning School of Planning & Architecture JNAFAU
B.MOUNIKA 16011BA008
ACTION PLAN FOR PEDESTRIANS AT SECUNDERABAD JUNCTION
Thesis Guide
E. Sandhya Reddy G. Sai Krishna Kumar
B.Tech Planning IV Year VIII Semester
Sheet No
24
10
PLANNING PROJECT
4 9
OFF-STREET PARKING
10
9
6
ON STREET PARKING
2
1
Legend
8
5 8
3
Visitors parking area in Secunderabad railway station is about 12,500 sqm.
7
7 1
Off-street Parking
2
3
4
5
6
On-street parking
• Vehicles are being parked on the footpath. • There are 6 parking lots • There are no proper bus terminal s for the buses to • Four 2-wheeler ,Two 4-wheeler be parked . • Parking Area Capacity of 2-wheeler vehicles -2,300 two • Buses are parked on the roads. wheelers. • Dominated on street vehicles are the 3-wheelers. • Parking Demand – 11,300 vehicles • On street parking decreases the capacity of the • The parking lots are occupied at their capacity . existing roadway. • The parking charges are very high compared with the railway tickets. Source : Planning for multi modal hub at Secunderabad Report Source : Primary Survey ACTION PLAN FOR PEDESTRIANS AT SECUNDERABAD JUNCTION
SCALE :
1:2,500
PARKING ANALYSIS Department of Urban & Regional Planning School of Planning & Architecture JNAFAU
B.MOUNIKA 16011BA008 Thesis Guide
E. Sandhya Reddy G. Sai Krishna Kumar
B.Tech Planning IV Year VIII Semester
Sheet No
25
LOS A –Pedestrian Space >4.9 m2 Flow rate ≤ 12 p/m/m At LOS A walkways, pedestrians move in the path choose by them without shifting their movement in response with other pedestrians.
LOS B- Pedestrian Space >3.3-4.9 m2 Flow rate ≤ 12-15 p/m/m Pedestrians can choose their own walking speed because there is sufficient area for pedestrians to move freely and to bypass other pedestrians. >1.9-3.3m2
Vp=
Legend Rail way line Roads LOS A LOS B
V15 = peak 15 min flow rate(p /15-min ) LOS C
LOS D -Pedestrian Space >1.3-1.9m2 Flow rate ≤ 21-27 p/m/m The freedom to select the individual walking speed and to Bypass other pedestrians is restricted .Crossing or reverse flow moments face a high probability of conflict.
LOS D
LOS F Pedestrian Space ≤ 0.6m2 Flow rate varies All walking speeds are severely restricted and forward movement of pedestrians is only done by shuffling. Normal walking speed is very poor and reverse flow movement is highly impossible.
V15 -------------15* WE
PLANNING PROJECT
V p = pedestrian unit flow rate (p/min/m)
LOS B
LOS C- Pedestrian Space Flow rate ≤ 15-21p/m/m The space is sufficient for normal walking speeds and for bypassing other pedestrian in primarily unidirectional streams.
LOS E- Pedestrian Space >0.6-1.3m2 Flow rate ≤ 27-45 p/m/m All the pedestrians restrict their normal walking speed .Frequently adjusted. Forward movement of pedestrians is only possible by shuffling. Cross flow moments are only possible with difficulties .
LOS Unit flow rate
LOS A
LOS C LOS D
WE = effective walkway width (m)
LOS E LOS F
WE = Effective walkway width (m). WT =
Total walkway width (m).
Wo = Sum of the walkway widths and sky
Source : IRC Guidelines 1032012 HCM 2000,2010
distances from obstructions on the walkway (m).
PEDESTRIAN LEVEL OF SERVICE
LOS E
LOS F
ACTION PLAN FOR PEDESTRIANS AT SECUNDERABAD JUNCTION
SCALE :
1:2,500
LEVEL OF SERVICE Department of Urban & Regional Planning School of Planning & Architecture JNAFAU
B.MOUNIKA 16011BA008 Thesis Guide
E. Sandhya Reddy G. Sai Krishna Kumar
B.Tech Planning IV Year VIII Semester
Sheet No
26
LOS A -At LOS A walkways, pedestrians move in the path choose by them without shifting their movement in response with other pedestrians.
LOS B- Pedestrians can choose their own walking speed because there is sufficient area for pedestrians to move freely and to bypass other pedestrians.
LOS C- The space is sufficient for normal walking speeds and for bypassing other pedestrian in primarily unidirectional streams.
LOS D -The freedom to walking speed and pedestrians is restricted flow moments face a conflict.
LOS E- All the pedestrians restrict their normal walking speed .Frequently adjusted. Forward movement of pedestrians is only possible by shuffling. Cross flow moments are only possible with difficulties .
LOS F- All walking speeds are severely restricted and forward movement of pedestrians is only done by shuffling. Normal walking speed is very poor and reverse flow movement is highly impossible.
select the individual to Bypass other .Crossing or reverse high probability of
RATHIFILE JN
RATHIFILE JUNCTION Total Effectiv IRC Road width e width LOS 1
D
Road
From blue sea
1.2
0.7
E
Towards clock tower
1
1
E
Towards ROB
1
0.75
D
From ROB Towards R S From R S
1 1 3
0.5 1 1
F E E
Towards R S
2
1
D
Towards 31B.S
1
1
C
Towards Mettuguda From Mettuguda Towards Sitafalmandi From Sitafalmandi
2 1 1 1
2
FLOW RATE
0.5 1 0.5
Towards Bhoiguda
1
0.5
From Bhoiguda
1.5
1
Towards Sec T2
1
From Sec T2
2
1 1.5
A A
A C
LOS B
>3.3-4.9 m2
A
LOS C
>1.9-3.3m2
A A
LOS E LOS F
SECUNDERABAD JUNCTION
LOS B
≤ 12-15 p/m/m
LOS C
≤ 15- 21 p/m/m
LOS D
≤ 21-27 p/m/m
Sec IN
3
3
D
LOS E
≤ 27-49 p/m/m
LOS F
Varies
Sec OUT
3
3
E
Towards Monda market
1
1
C
Towards shankar mandal
1
1
A
PEDESTRIAN SPACE >4.9 m2
LOS D
≤ 12 p/m/m
CHILKALGUDA JN LOS A
LOS A LOS B
LOS A
SECUNDERABAD JN
A
Roads
Total Effectiv IRC width e width LOS
3
Total Effectiv IRC width e width LOS
Rail way line
LOS C
Towards Blue sea
Road
Legend
GURUDWARA JN
GURUDWARA JUNCTION
CHILKALGUDA JUNCTION
PLANNING PROJECT
Road
Total Effectiv IRC width e width LOS
LOS D
>1.3-1.9m2
Towards Rathile
3
2
F
LOS E
>0.6-1.3m2
From rathifile
3
1
F
LOS F
≤ 0.6m2
Towards CT
1
1
E
ACTION PLAN FOR PEDESTRIANS AT SECUNDERABAD JUNCTION
SCALE :
1:2,500
LEVEL OF SERVICE Department of Urban & Regional Planning School of Planning & Architecture JNAFAU
B.MOUNIKA 16011BA008 Thesis Guide
E. Sandhya Reddy G. Sai Krishna Kumar
B.Tech Planning IV Year VIII Semester
Sheet No
27
Legend Rail way line
LOS B
LOS C LOS D
LOS C
LOS D -Pedestrian Space >1.3-1.9m2 Flow rate ≤ 21-27 p/m/m The freedom to select the individual walking speed and to Bypass other pedestrians is restricted .Crossing or reverse flow moments face a high probability of conflict.
LOS D
LOS E
LOS E
LOS F
CHILKALGUDA JUNCTION
LOS F
SECUNDERABAD JUNCTION
LOS F Pedestrian Space ≤ 0.6m2 Flow rate varies All walking speeds are severely restricted and forward movement of pedestrians is only done by shuffling. Normal walking speed is very poor and reverse flow movement is highly impossible.
LOS A LOS B
LOS C- Pedestrian Space >1.9-3.3m2 Flow rate ≤ 15-21p/m/m The space is sufficient for normal walking speeds and for bypassing other pedestrian in primarily unidirectional streams.
LOS E- Pedestrian Space >0.6-1.3m2 Flow rate ≤ 27-45 p/m/m All the pedestrians restrict their normal walking speed .Frequently adjusted. Forward movement of pedestrians is only possible by shuffling. Cross flow moments are only possible with difficulties .
Roads
RATHIFILE JUNCTION
LOS B- Pedestrian Space >3.3-4.9 m2 Flow rate ≤ 12-15 p/m/m Pedestrians can choose their own walking speed because there is sufficient area for pedestrians to move freely and to bypass other pedestrians.
PLANNING PROJECT
LOS A
GURUDWARA JUNCTION
LOS A –Pedestrian Space >4.9 m2 Flow rate ≤ 12 p/m/m At LOS A walkways, pedestrians move in the path choose by them without shifting their movement in response with other pedestrians.
ACTION PLAN FOR PEDESTRIANS AT SECUNDERABAD JUNCTION
SCALE :
1:2,500
LOS Department of Urban & Regional Planning School of Planning & Architecture JNAFAU
B.MOUNIKA 16011BA008 Thesis Guide
E. Sandhya Reddy G. Sai Krishna Kumar
B.Tech Planning IV Year VIII Semester
Sheet No
28
ISSUES • •
PEDESTRIANS
• •
• •
FOOTPATHS
•
•
ROADS
• • •
TRAFFIC
• •
•
SIGNAGE
• •
PARKING
•
RATHIFILE JN CHILKALGUDA JN GURUDWARA JN Pedestrians walk on the • Haphazard crossing of • Haphazard road erupting the traffic. roads . movement of Vehicles Occupy the • Intersection is operated pedestrians. Crosswalks. manually. • Pedestrians walk on Jay walking . • No pedestrian signal. the road erupting the Nearly 800 pedestrians traffic. cross the road. • Absence of footpath barrier. Illegally Occupied by • Insufficient footpaths • Illegally vehicles commercial shops . • Vehicles are parked on Occupy Footpaths Encroachment of the footpaths. • Absence of footpath footpaths. • Absence of footpaths barrier Vehicles are parked on in both the direction. • Occupied by street the footpaths. • Contain electric poles. vendors. Inadequate footpath • Contain electric poles widths. . Lack of Authorized Bus • Lack of Authorized Bus • Roads are occupied Stops. Stops with3-wheelers . Congested roads. • Improper design of the junction. Nearly 187 buses take U- • Five busy roads • U-Turn of the buses Turn at the junction converge. due to the bus stops which interrupts the • Manual Operation of interrupts the traffic traffic flow . Intersections flow . Wrong direction driving. • Heavy traffic flow in • 3-wheelrs park on the Lining up of Buses . peak hours. road & obstruct traffic • Buses stop at flow. intersection. Lack of signs and zebra • Lack of signs • Lack of signs and crossings • Manual operation of zebra crossings. Manual Operation of heavy traffic . • Manual Operation of Intersections. Intersections. 3-wheelers block the • On street parking is • Buses are parked on road . observed . road . Insufficient of bus bay • 3-wheelers are parked • Insufficient of bus bay area for parking of on street. area for parking of buses. buses. ACTION PLAN FOR PEDESTRIANS AT SECUNDERABAD JUNCTION
• •
•
• • •
SECUNDERABAD JN Irregular flow of pedestrians erupting traffic. Haphazard crossing of roads. Nearly 1200 pedestrians flow per 15 min at peak hours. Illegally Occupied by street hawkers. Encroachment of footpaths by commercials. Poor construction materials are used.
PLANNING PROJECT
Street vendors occupying Footpath
• 3-wheelers park on the roads causing congestion. • Manual Operation of Intersections. • Lining up of Buses . • U-Turn of the buses(218) due to the bus stops interrupts the traffic flow . • Lack of signs and zebra crossings. SCALE :
• Insufficient of bus bay area for parking of buses
-
ISSUES Department of Urban & Regional Planning School of Planning & Architecture JNAFAU
B.MOUNIKA 16011BA008 Thesis Guide
E. Sandhya Reddy G. Sai Krishna Kumar
B.Tech Planning IV Year VIII Semester
Sheet No
29
1
4
3
2
5
PLANNING PROJECT
ISSUES Footpath
Pedestrian
ENCROACHMENT OF FOOTPATHS & ROADS
HAPAZARD MOVEMENT OF PEDESTRIANS 6
Signage 3
Parking Infrastructure
17 2 7
12
7 11 5
1
Traffic
6
9 10 16
4
14 19 8 18
8
13
15 9
11
13
14
ONSTREET PARKING 10
15
16
CONGESTED ROADS
12
17
18
HEAVY TRAFFIC 19
SCALE :
1:2,500
PRIORITASION OF ISSUES Department of Urban & Regional Planning School of Planning & Architecture JNAFAU
IMPROPER FOOTPATHS
ACTION PLAN FOR PEDESTRIANS AT SECUNDERABAD JUNCTION
B.MOUNIKA 16011BA008 Thesis Guide
E. Sandhya Reddy G. Sai Krishna Kumar
B.Tech Planning IV Year VIII Semester
Sheet No
30
The pedestrian flow 80% of the is about 1.6 lack Footpaths in per day. the study area are completely occupied by the hawkers .
Pedestrians Nearly 500 buses take a U occupy 2/3rd turn causing traffic of the roads congestion. due heavy pedestrian activity in the study area.
Commuters and pedestrians face a hardship due to the presence of 3-4 liquor shops in the site area.
PLANNING PROJECT
St. Johns road is congested due to heavy traffic and narrow roads of 10m of carriage width.
Total commuters and pedestrians per day are about 5 lakhs in the study area.
Parking demand is about 11,000 vehicles per as the supply is only about 8,000 vehicles per day.
Buses are parked on the roads due to insufficient bus terminal area.
Oliphanta bridge was constructed in 1874 .
Uneven pavement surfaces are present . All the footpaths space is encroached by trees and electric poles at Chilkalguda junction.
ACTION PLAN FOR PEDESTRIANS AT SECUNDERABAD JUNCTION
SCALE :
1:2,500
QUANTIFICATION OF PROBLEM Department of Urban & Regional Planning School of Planning & Architecture JNAFAU
B.MOUNIKA 16011BA008 Thesis Guide
E. Sandhya Reddy G. Sai Krishna Kumar
B.Tech Planning IV Year VIII Semester
Sheet No
31
RATHIFILE JUNCTION
LAND USE
DESIGN ELEMENTS
PLANNING PROJECT
KEY MAP
SCALE :
LEGENG
LEGENG
COMMERCIAL PUBLIC-SEMI PUBLIC
TRANSPORTATION
FOOTPATH
BUS STOP
STREET LIGHTS
MEDIAN
SIGNAL
TREES
ACTION PLAN FOR PEDESTRIANS AT SECUNDERABAD JUNCTION
1:1000
PROPOSALS Department of Urban & Regional Planning School of Planning & Architecture JNAFAU
B.MOUNIKA 16011BA008 Thesis Guide
E. Sandhya Reddy G. Sai Krishna Kumar
B.Tech Planning IV Year VIII Semester
Sheet No
32
PLANNING PROJECT
Towards Railway station BB’
Towards Blue Sea AA’
RATHIFILE JUNCTION
FOOTPATH MEDIAN
BUS STOP SIGNAL
STREET LIGHTS TREES
COMMERCIAL
Towards Oliphanta Bridge CC’
LEGEND
Footpaths should have uniform height (150mm) and continuous.
PSP -1
ACTION PLAN FOR PEDESTRIANS AT SECUNDERABAD JUNCTION
Curb ramps are provided for people using wheel chairs at the junction.
SCALE :
1:1000
PROPOSALS Department of Urban & Regional Planning School of Planning & Architecture JNAFAU
B.MOUNIKA 16011BA008 Thesis Guide
E. Sandhya Reddy G. Sai Krishna Kumar
B.Tech Planning IV Year VIII Semester
Sheet No
33
PLANNING PROJECT
CHILKALGUDA JUNCTION
LAND USE
LEGENG RESIDENTIAL
TRANSPORTATION
CHILKALGUDA JUNCTION
PUBLIC-SEMI PUBLIC
Public and semi public is the dominant land use present at this junction.
Bus stop is proposed to provide safe & A bus stop is comfortable waiting proposed at space . Gurudwara temple.
ON STREET PARKING
Vertical clearance of 2.4m is maintained .
Parallel parking is provided at the junction.
On street parking is provided at a distance of 25 m away from the Junction.
LEGEND FOOTPATH
BUS STOP SCALE :
MEDIAN
SIGNAL
STREET LIGHTS
METRO
1:1000
PROPOSALS Department of Urban & Regional Planning School of Planning & Architecture JNAFAU
B.MOUNIKA 16011BA008
TREES
ACTION PLAN FOR PEDESTRIANS AT SECUNDERABAD JUNCTION
Thesis Guide
E. Sandhya Reddy G. Sai Krishna Kumar
B.Tech Planning IV Year VIII Semester
Sheet No
34
PLANNING PROJECT
CHILKALGUDA JUNCTION
LEGEND FOOTPATH
MEDIAN METRO
SIGNAL STREET LIGHTS
Krishnadevaraya Rd AA’
0
TREES RESIDENTIAL PSP -1
Design speed of the rotatory junction is about 30kmhr
Towards Sitafalmandi BB’
SCALE :
1:1000
PROPOSALS Department of Urban & Regional Planning School of Planning & Architecture JNAFAU
Towards ROB EE’
Towards SEC Exit DD’
Towards Bhoiguda CC’’
ACTION PLAN FOR PEDESTRIANS AT SECUNDERABAD JUNCTION
B.MOUNIKA 16011BA008 Thesis Guide
E. Sandhya Reddy G. Sai Krishna Kumar
B.Tech Planning IV Year VIII Semester
Sheet No
35
GURUDWARA JUNCTION
LAND USE
PLANNING PROJECT LEGENG
RESEDENTIAL
TRANSPORTATION
PUBLIC-SEMI PUBLICL
COMMERCIAL
GURUDWARA JUNCTION
SIGNAGE Sign boards are installed at the junction with 2.4m of vertical clearance.
DESIGN ELEMENTS
STREET LIGHTING Single light is proposed for the streets less than 12m. LEGENG
SCALE :
FOOTPATH
BUS STOP
STREET LIGHTS
MEDIAN
SIGNAGE
PLANTATION
FOB & METRO
1:1000
PROPOSALS Department of Urban & Regional Planning School of Planning & Architecture JNAFAU
B.MOUNIKA 16011BA008
ACTION PLAN FOR PEDESTRIANS AT SECUNDERABAD JUNCTION
Thesis Guide
E. Sandhya Reddy G. Sai Krishna Kumar
B.Tech Planning IV Year VIII Semester
Sheet No
36
Towards Clock Tower
Towards Railway station AA’
GURUDWARA JUNCTION
PLANNING PROJECT
GURUDWARA JUNCTION FOOTPATH
GURUDWARA JUNCTION
MEDIAN BUS STOP SIGNAL STREET LIGHTS
0
Towards Clock tower BB’
TREES RESIDENTIAL PSP -5 COMMERCIAL
Towards Railway Station
STREET LIGHTS Towards Monda market CC’ A bus stop is proposed at gurudwara temple
Towards CT DD’ SCALE :
1:1000
PROPOSALS LED street lights with a height of 12 m are proposed with 30m of interval distance. ACTION PLAN FOR PEDESTRIANS AT SECUNDERABAD JUNCTION
Department of Urban & Regional Planning School of Planning & Architecture JNAFAU
B.MOUNIKA 16011BA008 Thesis Guide
E. Sandhya Reddy G. Sai Krishna Kumar
B.Tech Planning IV Year VIII Semester
Sheet No
37
LAND USE
PLANNING PROJECT
LAND USE
SECUNDERABAD JUNCTION
LEGENG COMMERCIAL
TRANSPORTATION
PUBLIC-SEMI PUBLIC
BURIAL GROUND
1m of MUZ is provides to accommodate vendors the
footpaths
at
on the
Secunderabad junction.
DESIGN ELEMENTS Universal accessibility is provide for all , including differently disabled by providing Kerb ramps at crossings. A FOB connecting the sky way is proposed at the sec railway station in gate to provide accessibility to the pedestrians.
SCALE :
LEGEND FOOTPATH MEDIAN
BUS STOP FOB
STREET LIGHTS TREES
ACTION PLAN FOR PEDESTRIANS AT SECUNDERABAD JUNCTION
1:1000
PROPOSALS Department of Urban & Regional Planning School of Planning & Architecture JNAFAU
B.MOUNIKA 16011BA008 Thesis Guide
E. Sandhya Reddy G. Sai Krishna Kumar
B.Tech Planning IV Year VIII Semester
Sheet No
38
Shankar Mandal Rd DD’
PLANNING PROJECT
SECUNDERABAD JUNCTION LEDENG
SECUNDERABAD JUNCTION
FOOTPATH MEDIAN BUS STOP SIGNAL STREET LIGHTS
Monda Market Rd CC’
0
TREES RAILWAY STATION
PSP -5 COMMERCIAL
Towards Rathifile AA’
Towards Clock Tower BB’
SCALE :
1:1000
PROPOSALS Department of Urban & Regional Planning School of Planning & Architecture JNAFAU
B.MOUNIKA 16011BA008
ACTION PLAN FOR PEDESTRIANS AT SECUNDERABAD JUNCTION
Thesis Guide
E. Sandhya Reddy G. Sai Krishna Kumar
B.Tech Planning IV Year VIII Semester
Sheet No
39
PLANNING PROJECT
SKY WALK
• The skywalk will help in the improvement of the flow of passengers and vehicles in and around the junction , reduction in traffic congestion resulting in smooth and safe flow of pedestrians. • The walkway width is about 4.5m on Snt Mary Rd and it is about 6 m at Secunderabad west metro. • FOBs and escalators are place at gurudwara temple and at the In gate of Secunderabad railway station Structure of Sky walk at Metro.
The structure of the skywalk is based on the simple geometry of a tetrahedron/ space.
Integration of a sky walk to the existing metro track at gurudwara junction.
Structure of sky walk on St Mary Rd. The total length of sky walk is about 650mts.
Material Pile foundation Steel
Quantity M 40 500 MT
Truss Slab(Polycarbo nate sheet) Staircase Steel FOB Escalator
6069Kg 2600sqmts
Amount .Rs 50lakhs 200 lakhs 4 lakhs 13 lakhs
Steel (200 tones) 0.5lakhs 2 20lakhs 4 400lakhs
Total cost
Rs.700 lakhs
COST ESTIMATIONS AND SPECIFICATIONS SL.NO
ELEMENT
PER UNIT COST
1 2 3 4 5
FOOTPATH ROAD MARKINGS BUS STOP STREET LIGHTS SIGNAL
6 7 8 9 10
SIGNAGE KERB KERB RAMP SKY WALK MISCELLANEOUS
Rs100/sqmts Rs300/sqmts Rs1lakh/unit Led Rs 2000/unit LED traffic signal -10,000/Unit Pedestrian signal Rs3000/Unit Rs 200/unit Rs60 /m (500mm*120mm*150mm) Rs3600/unit
TOTAL QUANTITY
TOTAL COST
11,500sqmts 270sqmts 3 units 150 units 5 units 10units 25units 3000mts 20units 1unit
Rs.11,50,000 Rs.1,00,000 Rs.3,00,000 Rs.3,00,000 Rs.50,000 Rs.30,000 Rs.50,000 Rs.1,80,000 Rs.72,000 Rs 7,00,00,000 Rs.1,00,000 Rs8,00,00,000(8 crores)
TOTAL COST ACTION PLAN FOR PEDESTRIANS AT SECUNDERABAD JUNCTION
Steel columns are provided around the metro columns.
SCALE :
1:2,500
PROPOSALS Department of Urban & Regional Planning School of Planning & Architecture JNAFAU
B.MOUNIKA 16011BA008 Thesis Guide
E. Sandhya Reddy G. Sai Krishna Kumar
B.Tech Planning IV Year VIII Semester
Sheet No
40