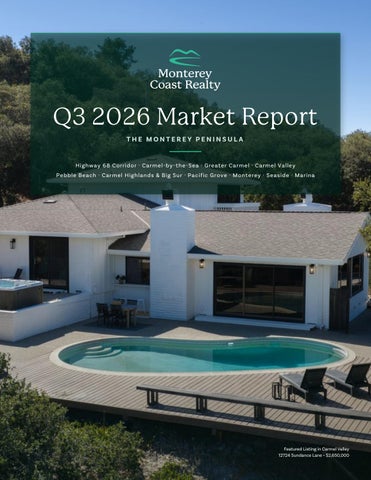
Q3 2026 Market Report THE MONTEREY PENINSULA
Highway 68 Corridor · Carmel-by-the-Sea · Greater Carmel · Carmel Valley Pebble Beach · Carmel Highlands & Big Sur · Pacific Grove · Monterey · Seaside · Marina
Featured Listing in Carmel Valley 12724 Sundance Lane • $2,650,000
MONTEREY COAST REALTY
Featured Listings A selection of Monterey Coast Realty’s current offerings across the peninsula. Unobscured Views in Carmel Highlands
Serene Beauty in the Redwoods of Big Sur
231 Spindrift Road 4 bed, 3.5 bath · $5,195,000
59755 Garrapatos Road 4 bed, 3+ bath · $3,400,000
Luxury Country Living in Corral de Tierra
Modern Coastal Living in Marina
372 Corral de Tierra Road 4 bed, 4.5 bath · $3,299,000
2501 Ocean Bluff Avenue 4 bed, 3 bath · $1,295,000
Two Parcels on 7.45 Acres in Carmel
Build Your Retreat on 5.3 Acres in Carmel
27631 & 27635 Schulte Road 7.45 acres · $1,178,000
2 Arroyo Sequoia 5.3 acres · $349,999
2
M O N T E R E Y C O A S T R E A LT Y
Significant Sales A selection of Monterey Coast Realty’s notable closed sales this quarter. Exceptional Space and Privacy in Fremont
Beautifully Remodeled Home in Quail Lodge
44471 View Point Circle $4,150,000 · Rep Buyer & Seller
8022 River Place $2,900,000 · Rep Seller
Refined Coastal Living in Sea Haven
Spacious Pebble Beach Retreat
2967 Garnet Way $2,375,000 · Rep Seller
1171 Chaparral Road $2,175,000 · Rep Seller
Surrounded by Natural Beauty in Monterey
Unparalleled Views at The Dunes
17 Toda Vista $1,405,000 · Rep Buyer & Seller
266 Sandy Gulch Drive $1,287,550 · Rep Seller
3
Q3 2026 MARKET REPORT The Q3 market report is in, and I wanted to share a quick snapshot of what’s happening across the 68 Corridor and the Peninsula. CLOSE TO HOME ON HIGHWAY 68
The corridor recorded 35 sales, two more than a year ago. Prices eased after a strong second quarter, with an average of $1.29M and a median of $1.05M. Inventory is tighter than last year (36 active listings vs. 51), so the right home still draws attention. THE BIG PICTURE ACROSS THE PENINSULA
310 closed sales, up 7% from Q3 last year Average sale price of $1.92M, easing slightly Total volume of $594.3M, essentially flat year over year Homes sold in an average of 65 days July was the strongest month for sales since 2021, and September was the highest since 2022. Buyers are active, but they’re taking their time and being selective. WHAT STOOD OUT
Monterey, Seaside and Marina were busy. Monterey posted its most sales since Q2 2024, and Marina had its most since Q4 2021, including the highest sale in Marina history. Carmel Valley’s average price reached $2.36M, its highest since Q2 2025. Pebble Beach’s 2026 volume through Q3 already exceeds the full-year totals for each of the past three years. Homes are taking longer to sell in many areas, which gives buyers more room to negotiate. Well-priced homes continue to move. LOOKING AHEAD
October started with 410 active listings and 134 transactions scheduled to close before year-end, so the market is carrying good momentum into Q4. I’ve attached the full report with neighborhood-by-neighborhood detail. If you’re curious what this means for your home’s value, or you’re thinking about a move in the year ahead, I’m always happy to talk it through. Best,
Matt Pridey MOBILE EMAIL OFFICE
831.596.6294 Matt@MontereyCoastRealty.com Dolores St Between 7th & 8th, Carmel-By-The-Sea, CA 93921
REALTOR® DRE #02126360
4
M A R K E T O V E RV I E W
The Monterey Peninsula As summer transitions into fall, the Monterey Peninsula offers a season all its own. With warm, sun-filled afternoons often extending well into autumn, these months are an especially inviting time to enjoy the region’s coastal beauty, outdoor lifestyle, and vibrant local communities. Our market has also benefited from the beginning of the substantial wealth creation taking place in the San Francisco Bay Area. While many technology buyers need to stay near the Bay Area to complete their stock vesting, early founders and financial investors are starting to invest in neighboring markets like Napa Valley and Monterey. We are beginning to see the benefits of this and expect it will continue at a measured level for the next few years. The Monterey Peninsula recorded 310 closed sales in Q3, a 7% increase over the same period last year. While the average sales price eased slightly to $1.92 million, total sales volume remained essentially unchanged at $594.3 million, reflecting continued stability across the market. Summer brought the busiest stretch of the year, with July posting its strongest sales activity since 2021 and September reaching its highest level since 2022. Homes sold in an average of 65 days, highlighting a market where buyers remain engaged but continue to make thoughtful, selective decisions. Looking ahead, the Peninsula carries positive momentum into the final quarter. October has brought a notable increase in activity in each of the past two years, and the month started with 410 active listings. With 134 transactions already scheduled to close before year-end, including 110 in October, the market remains active as we enter the fall season. Across our markets, local knowledge and experienced representation is essential to navigating changing conditions and making informed real estate decisions. Our team of agents at Monterey Coast Realty and Carmel Realty Company are the best in the business and it shows. We are the current market leaders by volume across the Monterey Peninsula. Our team is tenaciously focused on this market. We are collaborative experts, providing early access and excellent service to buyers and sellers across our local markets. Please reach out to us for exceptional real estate representation. We hope you enjoy the following detailed analysis of the Monterey Peninsula real estate market. T O TA L S A L E S
AV E R A G E P R I C E
ACTIVE LISTINGS
VOLUME
D AY S O N M A R K E T
310
$1.9M
410
$594.3M
65
5
MARKET UPDATE
Highway 68 Corridor The Highway 68 Corridor recorded 35 sales in Q3 2026, two more than a year ago and down from 43 in Q2. Pricing eased after a strong second quarter. The average sale price was $1,285,571 and the median was $1,050,000, as all but one sale closed under $2M and just one topped $5M. Homes took longer to sell, averaging 57 days on market compared with 40 last quarter. Total volume reached $44,995,000, nearly even with Q3 2025. Inventory is tighter than last year, with 36 active listings at quarter end compared with 51 a year ago. Through three quarters the corridor has logged 108 sales, one more than the same stretch of 2025. Buyers have more room to negotiate, while well priced homes continue to sell. AVERAGE SALE PRICE
TOTAL SALES VOLUME
$1,285,571
$45.0M
▼ 15.5% QoQ
▼ 6.8% YoY
▼ 31.2% QoQ
▼ 1.1% YoY
UNITS SOLD
AVERAGE DAYS ON MARKET
35
57
▼ 18.6% QoQ
▲ 6.1% YoY
▲ 42.5% QoQ
6
▲ 18.8% YoY
MARKET DETAIL
Highway 68 Corridor
SALES BY PRICE SEGMENT
<$1M
$1M-2M
$5M+
16 homes · 46%
18 homes · 51%
1 home · 3%
A V E R A G E V S . M E D I A N P R I C E trailing five quarters
$1.5M
$1.25M
$1.0M
Q3 ’25
Q4 ’25
Q1 ’26
Average
Q2 ’26
Q3 ’26
Median
Q U A R T E R L Y M O M E N T U M 2025 versus 2026 SALES VOLUME
CLOSED SALES
AVERAGE DAYS TO SELL
$75M
60
75
$50M
40
50
$25M
20
25
$0
2025
Q1
Q2
Q3
Q4
0
Q1
Q2
2026
Source: MLSListings, closed single family, condo & townhouse sales, Q3 2026.
7
Q3
Q4
0
Q1
Q2
Q3
Q4
M A R K E T U P D AT E
Carmel-by-the-Sea & Carmel Point Carmel-by-the-Sea and Carmel Point had a quieter quarter, with 22 sales, down 37% from Q2 2026 and 29% from Q3 2025, though still ahead of the 20 sales in Q1. August and September brought just six sales each. The average price of $4.28M was the second highest of the past five quarters, up nearly 14% from last quarter and 29% from last year, while total volume of $94.2M was the lowest of 2026. Only one sale closed above $10M, at $15.5M, and inventory thinned after July, ending the quarter at 23 active listings. Monterey Coast Realty and partner brokerage Carmel Realty Company represented five sides of the top four sales and at least one side of half of all transactions. AV E R AG E SA L E P R I C E
T O TA L S A L E S V O L U M E
$4,283,275
$94.2M
▲ 13.7% QoQ
▲ 29.0% YoY
▼ 28.6% QoQ
▼ 8.5% YoY
UNITS SOLD
AV E R A G E D AY S O N M A R K E T
22
51
▼ 37.1% QoQ
▼ 29.0% YoY
▼ 13.6% QoQ
8
▼ 32.0% YoY
M A R K E T D E TA I L
Carmel-by-the-Sea & Carmel Point
SA L E S BY P R I C E S EG M E N T
$1M-2M
$2M-3M
$3M-5M
$5M+
2 homes · 9%
6 homes · 27%
9 homes · 41%
5 homes · 23%
AV E R AG E VS . M E D I A N P R I C E trailing five quarters
$5.0M
$4.0M
$3.0M
$2.0M Q3 ’25
Q4 ’25
Q1 ’26
Average
Q2 ’26
Q3 ’26
Median
Q UA RT E R LY M O M E N T U M 2025 versus 2026 SA L E S VO LU M E
C LOS E D SA L E S
$150M
AV E R AG E DAYS TO S E L L
40
100
20
50
$100M
$50M
$0
2025
Q1
Q2
Q3
Q4
0
Q1
Q2
2026
Source: MLSListings, closed single family, condo & townhouse sales, Q3 2026.
9
Q3
Q4
0
Q1
Q2
Q3
Q4
M A R K E T U P D AT E
Greater Carmel Greater Carmel opened the quarter slowly, with just four sales in July, then picked up through August and September to finish with 24 sales, one more than last quarter. The median price of $1.60M and average of $1.76M stayed in the range typical for the area, with the median easing 3% from Q2. Volume of $42.2M ran a little light because only two sales closed above $3M, compared with five last quarter. Homes averaged 80 days on market, on the higher side for Greater Carmel and matching Q1. The quarter ended with 49 active listings, level with last quarter and up nine from a year ago. Monterey Coast Realty represented the buyers on a $3.63M sale, the area's second highest of the quarter. AV E R AG E SA L E P R I C E
T O TA L S A L E S V O L U M E
$1,757,438
$42.2M
▼ 8.3% QoQ
▼ 2.6% YoY
▼ 4.3% QoQ
▼ 22.1% YoY
UNITS SOLD
AV E R A G E D AY S O N M A R K E T
24
80
▲ 4.3% QoQ
▼ 20.0% YoY
▲ 27.0% QoQ
10
▲ 12.7% YoY
M A R K E T D E TA I L
Greater Carmel
SA L E S BY P R I C E S EG M E N T
<$1M
$1M-2M
$2M-3M
$3M-5M
$5M+
6 homes · 25%
10 homes · 42%
6 homes · 25%
1 home · 4%
1 home · 4%
AV E R AG E VS . M E D I A N P R I C E trailing five quarters
$2.0M
$1.5M
$1.0M Q3 ’25
Q4 ’25
Q1 ’26
Average
Q2 ’26
Q3 ’26
Median
Q UA RT E R LY M O M E N T U M 2025 versus 2026 SA L E S VO LU M E
C LOS E D SA L E S
$75M
AV E R AG E DAYS TO S E L L
40
100
20
50
$50M
$25M
$0
2025
Q1
Q2
Q3
Q4
0
Q1
Q2
2026
Source: MLSListings, closed single family, condo & townhouse sales, Q3 2026.
11
Q3
Q4
0
Q1
Q2
Q3
Q4
M A R K E T U P D AT E
Carmel Valley Carmel Valley had a particularly strong quarter. The average sale price of $2.36M was the highest since Q2 2025, up 8% from last quarter and 10% from last year. The 36 sales were the second highest count since Q4 2024, with most closing in July, a slower August and a rebound in September. Volume reached $84.8M, up 34% from Q2, as more homes than usual sold above $2M. Homes averaged 116 days on market, high even for Carmel Valley, since 14 of the 36 sales took more than three months to close. Active inventory rose to 73 listings, the most since May 2025. Monterey Coast Realty and Carmel Realty Company represented nine clients in Carmel Valley this quarter. AV E R AG E SA L E P R I C E
T O TA L S A L E S V O L U M E
$2,356,472
$84.8M
▲ 7.9% QoQ
▲ 9.8% YoY
▲ 33.9% QoQ
▲ 1.3% YoY
UNITS SOLD
AV E R A G E D AY S O N M A R K E T
36
116
▲ 24.1% QoQ
▼ 7.7% YoY
▲ 93.3% QoQ
12
▲ 61.1% YoY
M A R K E T D E TA I L
Carmel Valley
SA L E S BY P R I C E S EG M E N T
<$1M
$1M-2M
$2M-3M
$3M-5M
$5M+
5 homes · 14%
13 homes · 36%
12 homes · 33%
4 homes · 11%
2 homes · 6%
AV E R AG E VS . M E D I A N P R I C E trailing five quarters $3.0M
$2.0M
$1.0M Q3 ’25
Q4 ’25
Q1 ’26
Average
Q2 ’26
Q3 ’26
Median
Q UA RT E R LY M O M E N T U M 2025 versus 2026 SA L E S VO LU M E
C LOS E D SA L E S
$100M
40
$50M
20
AV E R AG E DAYS TO S E L L 150
100
50
$0
2025
Q1
Q2
Q3
Q4
0
Q1
Q2
2026
Source: MLSListings, closed single family, condo & townhouse sales, Q3 2026.
13
Q3
Q4
0
Q1
Q2
Q3
Q4
M A R K E T U P D AT E
Pebble Beach Pebble Beach recorded 24 sales, matching Q3 2025 and three fewer than last quarter. Half closed in September, unusual for Pebble Beach and its busiest month since October 2025. The average price of $4.41M came in below the past two quarters, as 42% of sales fell in the $2M to $3M range. At the top, one sale closed at $24M and one more above $10M, at $13.25M. Even so, 2026 has been a very strong year, and volume through Q3 already exceeds the full-year totals for 2023, 2024 and 2025. Homes sold in an average of 50 days after topping 80 days for three straight quarters. MCR and CRC represented at least one side of 13 of the 24 sales. AV E R AG E SA L E P R I C E
T O TA L S A L E S V O L U M E
$4,406,457
$105.8M
▼ 11.1% QoQ
▼ 11.6% YoY
▼ 21.0% QoQ
▼ 11.6% YoY
UNITS SOLD
AV E R A G E D AY S O N M A R K E T
24
50
▼ 11.1% QoQ
no change YoY
▼ 39.8% QoQ
14
▼ 9.1% YoY
M A R K E T D E TA I L
Pebble Beach
SA L E S BY P R I C E S EG M E N T
<$1M
$1M-2M
$2M-3M
$3M-5M
$5M+
1 home · 4%
4 homes · 17%
10 homes · 42%
5 homes · 21%
4 homes · 17%
AV E R AG E VS . M E D I A N P R I C E trailing five quarters
$6.0M
$4.0M
$2.0M
Q3 ’25
Q4 ’25
Q1 ’26
Average
Q2 ’26
Q3 ’26
Median
Q UA RT E R LY M O M E N T U M 2025 versus 2026 SA L E S VO LU M E
C LOS E D SA L E S
$150M
30
$100M
20
$50M
10
AV E R AG E DAYS TO S E L L 100
50
$0
2025
Q1
Q2
Q3
Q4
0
Q1
Q2
2026
Source: MLSListings, closed single family, condo & townhouse sales, Q3 2026.
15
Q3
Q4
0
Q1
Q2
Q3
Q4
M A R K E T U P D AT E
Carmel Highlands, Big Sur & South Coast Carmel Highlands, Big Sur and the South Coast had another typical quarter with six sales, the same count as four of the last five quarters, and three of them closed in September. The average price was high at nearly $6.2M, since three of the six sales topped $7M, a pattern common in a small market with occasional large sales. Homes averaged 212 days on market, up 40% from last quarter and nearly 60% from a year ago, though long marketing times are normal here. Volume of $37.0M was down from Q2, yet the year-to-date total already exceeds all of 2023 and 2024 and is approaching 2025. Three MCR agents took part in two transactions, and CRC double-ended the quarter's highest sale. AV E R AG E SA L E P R I C E
T O TA L S A L E S V O L U M E
$6,158,333
$37.0M
▼ 28.8% QoQ
▲ 10.8% YoY
▼ 28.8% QoQ
▲ 10.8% YoY
UNITS SOLD
AV E R A G E D AY S O N M A R K E T
6
212
no change QoQ
no change YoY
▲ 40.4% QoQ
16
▲ 59.4% YoY
M A R K E T D E TA I L
Carmel Highlands, Big Sur & South Coast
SA L E S BY P R I C E S EG M E N T
$1M-2M
$3M-5M
$5M+
1 home · 17%
2 homes · 33%
3 homes · 50%
AV E R AG E VS . M E D I A N P R I C E trailing five quarters
$9.0M
$6.0M
$3.0M
Q3 ’25
Q4 ’25
Q1 ’26
Average
Q2 ’26
Q3 ’26
Median
Q UA RT E R LY M O M E N T U M 2025 versus 2026 SA L E S VO LU M E
C LOS E D SA L E S
$60M
AV E R AG E DAYS TO S E L L
10
300
$40M
200 5
$20M
$0
2025
100
Q1
Q2
Q3
Q4
0
Q1
Q2
2026
Source: MLSListings, closed single family, condo & townhouse sales, Q3 2026.
17
Q3
Q4
0
Q1
Q2
Q3
Q4
M A R K E T U P D AT E
Pacific Grove Pacific Grove posted a typical quarter with 37 sales, in line with the area's usual pace outside the standout quarters of Q4 2025 and Q2 2026. The average price of $1.41M was the lowest since Q2 2022, against an average near $1.6M over the past three years, as no sales closed above $3M. Seven listings above that price remain on the market heading into Q4. Days on market rose to 64, up 94% from a year ago, driven by four sales over $2M that each took more than 150 days. Most homes still sold in under 50 days, and Pacific Grove remains in high demand. Volume of $52.1M is in line with pre-COVID levels. AV E R AG E SA L E P R I C E
T O TA L S A L E S V O L U M E
$1,406,988
$52.1M
▼ 16.8% QoQ
▼ 18.6% YoY
▼ 31.6% QoQ
▼ 5.9% YoY
UNITS SOLD
AV E R A G E D AY S O N M A R K E T
37
64
▼ 17.8% QoQ
▲ 15.6% YoY
▲ 39.1% QoQ
18
▲ 93.9% YoY
M A R K E T D E TA I L
Pacific Grove
SA L E S BY P R I C E S EG M E N T
<$1M
$1M-2M
$2M-3M
9 homes · 24%
23 homes · 62%
5 homes · 14%
AV E R AG E VS . M E D I A N P R I C E trailing five quarters $2.0M
$1.5M
$1.0M Q3 ’25
Q4 ’25
Q1 ’26
Average
Q2 ’26
Q3 ’26
Median
Q UA RT E R LY M O M E N T U M 2025 versus 2026 SA L E S VO LU M E
C LOS E D SA L E S
$100M
AV E R AG E DAYS TO S E L L
60
75
40
50
20
25
$50M
$0
2025
Q1
Q2
Q3
Q4
0
Q1
Q2
2026
Source: MLSListings, closed single family, condo & townhouse sales, Q3 2026.
19
Q3
Q4
0
Q1
Q2
Q3
Q4
M A R K E T U P D AT E
Monterey Including Del Rey Oaks Monterey had a strong quarter, with 76 sales, the most since Q2 2024 and the second highest since Q1 2022. July, August and September each topped 20 sales. Volume reached $95.7M, the highest since Q2 2024 and up nearly 20% from a year ago. The average price of $1.26M held almost level with last quarter, down just 1%, as only one sale closed above $3M, in Monterra. Homes sold in an average of 46 days, quicker than most areas and a touch faster than through last year. The quarter ended with 70 active listings, a healthy supply after such a busy stretch. Five MCR and CRC agents represented Monterey sales, including one collaborative doubleended transaction. AV E R AG E SA L E P R I C E
T O TA L S A L E S V O L U M E
$1,259,431
$95.7M
▼ 1.1% QoQ
▼ 12.0% YoY
▲ 4.4% QoQ
▲ 19.5% YoY
UNITS SOLD
AV E R A G E D AY S O N M A R K E T
76
46
▲ 5.6% QoQ
▲ 35.7% YoY
▲ 2.2% QoQ
20
▼ 4.2% YoY
M A R K E T D E TA I L
Monterey
SA L E S BY P R I C E S EG M E N T
<$800K
$800K-1.2M
$1.2M-2M
$2M-3M
$3M+
18 homes · 24%
21 homes · 28%
30 homes · 39%
6 homes · 8%
1 home · 1%
AV E R AG E VS . M E D I A N P R I C E trailing five quarters
$1.5M
$1.25M
$1.0M
Q3 ’25
Q4 ’25
Q1 ’26
Average
Q2 ’26
Q3 ’26
Median
Q UA RT E R LY M O M E N T U M 2025 versus 2026 SA L E S VO LU M E
C LOS E D SA L E S
$100M
100
$50M
50
AV E R AG E DAYS TO S E L L 75
50
25
$0
2025
Q1
Q2
Q3
Q4
0
Q1
Q2
2026
Source: MLSListings, closed single family, condo & townhouse sales, Q3 2026.
21
Q3
Q4
0
Q1
Q2
Q3
Q4
M A R K E T U P D AT E
Seaside Seaside had a very strong quarter with 35 sales, the second highest in the past two years, behind only Q4 2025. Volume of $33.5M was up 21% from last quarter and 26% from a year ago, the second highest since 2024. Higher-priced homes stood out, with 20% of sales above $1.2M, more than the area typically sees, led by sales in The Enclave and Seaside Highlands. That mix lifted the average price to $958K, up 7% from Q2 and 11% from last year. Homes sold in an average of 44 days, typical for Seaside. Monterey Coast Realty was happy to bring the buyer to our own Seaside listing this quarter. AV E R AG E SA L E P R I C E
T O TA L S A L E S V O L U M E
$957,686
$33.5M
▲ 7.3% QoQ
▲ 11.4% YoY
▲ 21.1% QoQ
▲ 25.8% YoY
UNITS SOLD
AV E R A G E D AY S O N M A R K E T
35
44
▲ 12.9% QoQ
▲ 12.9% YoY
▲ 57.1% QoQ
22
▼ 10.2% YoY
M A R K E T D E TA I L
Seaside
SA L E S BY P R I C E S EG M E N T
<$600K
$600K-800K
$800K-1M
$1M-1.2M
$1.2M+
3 homes · 9%
13 homes · 37%
10 homes · 29%
2 homes · 6%
7 homes · 20%
AV E R AG E VS . M E D I A N P R I C E trailing five quarters
$1.0M
$800K
$600K Q3 ’25
Q4 ’25
Q1 ’26
Average
Q2 ’26
Q3 ’26
Median
Q UA RT E R LY M O M E N T U M 2025 versus 2026 SA L E S VO LU M E
C LOS E D SA L E S
$40M
40
$20M
20
AV E R AG E DAYS TO S E L L 60
40
20
$0
2025
Q1
Q2
Q3
Q4
0
Q1
Q2
2026
Source: MLSListings, closed single family, condo & townhouse sales, Q3 2026.
23
Q3
Q4
0
Q1
Q2
Q3
Q4
M A R K E T U P D AT E
Marina & East Garrison Marina and East Garrison stayed busy with 50 sales, the most since Q4 2021 and up 25% from Q3 2025. The average price of $982K eased 6% from last quarter but stayed consistent with recent quarters. Sales above $1M keep growing, with 42% of homes closing above that mark. Homes averaged 63 days on market, the longest since before COVID. Even with 50 sales, the quarter ended with 65 active listings, a healthy supply. Monterey Coast Realty was proud to represent the seller in the highest sale of the quarter and in Marina history, a $2.375M home in Sea Haven. AV E R AG E SA L E P R I C E
T O TA L S A L E S V O L U M E
$981,738
$49.1M
▼ 5.6% QoQ
▼ 2.3% YoY
▼ 3.7% QoQ
▲ 22.2% YoY
UNITS SOLD
AV E R A G E D AY S O N M A R K E T
50
63
▲ 2.0% QoQ
▲ 25.0% YoY
▲ 6.8% QoQ
24
▲ 16.7% YoY
M A R K E T D E TA I L
Marina & East Garrison
SA L E S BY P R I C E S EG M E N T
<$600K
$600K-800K
$800K-1M
$1M-1.2M
$1.2M+
5 homes · 10%
8 homes · 16%
16 homes · 32%
9 homes · 18%
12 homes · 24%
AV E R AG E VS . M E D I A N P R I C E trailing five quarters $1.1M
$1.0M
$900K
Q3 ’25
Q4 ’25
Q1 ’26
Average
Q2 ’26
Q3 ’26
Median
Q UA RT E R LY M O M E N T U M 2025 versus 2026 SA L E S VO LU M E
C LOS E D SA L E S
AV E R AG E DAYS TO S E L L
$60M
60
75
$40M
40
50
$20M
20
25
$0
2025
Q1
Q2
Q3
Q4
0
Q1
Q2
2026
Source: MLSListings, closed single family, condo & townhouse sales, Q3 2026.
25
Q3
Q4
0
Q1
Q2
Q3
Q4
Representing Buyers & Sellers of Quality Properties Across the Monterey Peninsula
Scan the Code to Learn More About Our Agents & Team Members The quality of life on the Monterey Peninsula is unmatched. Let us help make it your reality. Monterey Coast Realty represents buyers and sellers of quality properties from cozy cottages to magnificent estates throughout the Monterey Peninsula all the way east to Salinas Valley, through Carmel Valley and south to Big Sur.
Locally Owned. Globally Connected. MontereyCoastRealty.com • 831.624.2300 • DRE #01871677