6 minute read
Multivariate Geomorphometric Approach to Prioritize Erosion Prone Watershed of Upper Cauvery Karnataka

from Multivariate Geomorphometric Approach to Prioritize Erosion Prone Watershed of Upper Cauvery Karnata
World Academics Journal of ______________________________________________ Research Paper . Engineering Sciences Vol.6, Issue.1, pp.07-17, October (2019) E-ISSN: 2348-635X

Advertisement
Multivariate Geomorphometric Approach to Prioritize Erosion Prone Watershed of Upper Cauvery Karnataka
Mohammed Badiuddin Parvez 1
*, M Inayathulla 2
1,2
Dept. of Civil Engineering, UVCE, Bangalore University, Bangalore, Karnataka, India
Corresponding Author: parvezuvce@gmail.com Tel.: +919060506390
Available online at: www.isroset.org
Received: 05/Oct/2019, Accepted: 17/Oct/2019, Online: 31/Oct/2019 Abstract-Prioritization of watershed has Grabbed up significance in watershed management. Morphometic investigation is been usually applied to organize the watershed. In the present study upper cauvery of Karnataka with an area of 10874.65 km 2 and highest order stream of 8 was considered. The area was divided into Eight Watersheds. Various morphometric parameters namely Bifurcation ratio(Rb), Drainage density (Dd), Stream frequency(Ns), Texture ratio(T), Form factor(Rf), Circularity ratio(Rc), Elongation Ratio(Re), length of overland flow, shape factor(Bs), compactness ratio (Cc) has been determined for each watershed and allotted position on premise of relationship as to arrive at a Compound value for final ranking of watershed. The morphometric parameters ranges between Rb (3.416-5.0442), Dd (1.377-1.463), Ns (1.397-1.579), T (5.235- 8.540), Rf (0.233-1.082), Rc (0.179-0.447), Re (0.545-1.173), Cc (1.496-2.365), Lof (0.341-0.363), and Bs (0.924-4.284). It is found that the 38.83 % of area falls under high priority category where as 42.12% of area falls under this Medium category and 19.05% of the area falls under low catergory.
Keywords: GIS, DEM, Morphometric analysis, Watershed, Priority, Compound Factor.
I. INTRODUCTION
Soil disintegration is viewed as one of the most significant corruption forms on the planet. The soil resource is limited and its wide use is of utmost importance; it sustains bio geochemical processes and is the habitat for a great diversity of microorganisms. Morphometric analysis provides quantitative description of the basin geometry to understand initial slope or inequalities in the rock hardness, structural controls, recent diastrophism, geological and geomorphic history of drainage basin (Strahler, 1964). Morphometric analysis requires measurement of linear features, gradient of channel network and contributing ground slopes of the drainage basin. Morphometry is the measurement and mathematical analysis of the configuration of the earth's surface, shape and dimension of its landforms. A major emphasis in geomorphology over the past several decades has been on the development of quantitative physiographic methods to describe the evolution and behavior of surface drainage networks (Horton, 1945). Drainage basin examination based on morphometric parameters is very fundamental for watershed planning since it gives an thought regarding the basin characteristics in terms of slope, topography, soil condition, runoff characteristics, surface water potential etc. Geographic Information System techniques strategies described by an exceptionally high
exactness of mapping and measurement prove to be a tool in morphometric analysis. One of the advantages of quantitative analysis is that many of the basin parameters derived are in the form of ratios, and dimensionless numbers, thus providing an effective comparison irrespective of the scale (Krishnamurthy et al. 1996).
II. MATERIALS AND METHODS
2.1 Study Area The study area geographically lies between 75 0
29’ 19” E and 76 0
37’ 40” E longitude and 11 0
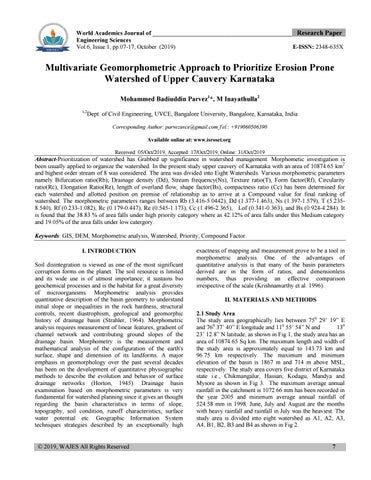
55’ 54” N and 13 0 23’ 12.8” N latitude, as shown in Fig 1, the study area has an area of 10874.65 Sq km. The maximum length and width of the study area is approximately equal to 143.73 km and 96.75 km respectively. The maximum and minimum elevation of the basin is 1867 m and 714 m above MSL, respectively. The study area covers five district of Karnataka state i.e., Chikmangalur, Hassan, Kodagu, Mandya and Mysore as shown in Fig 3. The maximum average annual rainfall in the catchment is 1072.66 mm has been recorded in the year 2005 and minimum average annual rainfall of 524.58 mm in 1998. June, July and August are the months with heavy rainfall and rainfall in July was the heaviest. The study area is divided into eight watershed as A1, A2, A3, A4, B1, B2, B3 and B4 as shown in Fig 2.
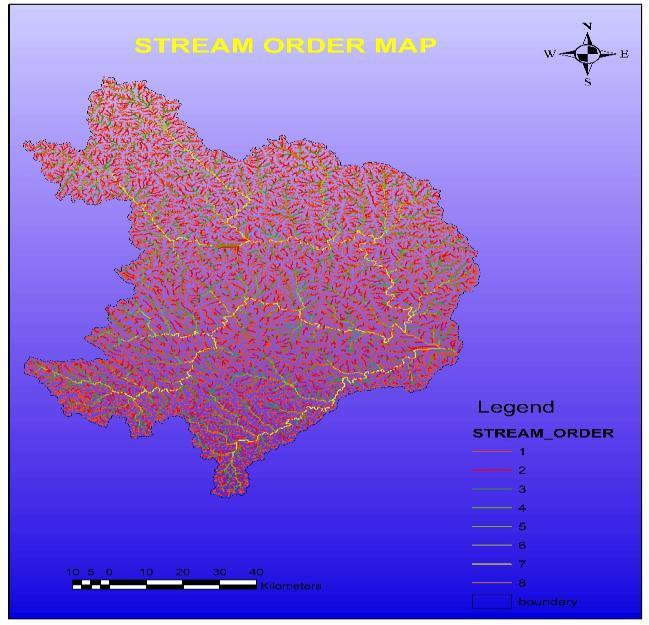
2.2 Methodology By using SRTM DEM data, basin was delineated and the drainage network was extracted. Initially the sink or depression area in DEM is been filled to get rid of small uneveness in the data. Then on basis of relative slopes between pixels flow direction is determined. Flow accumulation grid has been prepared using this data. Stream order was generated using above data on the basis of drainage flow direction study area was divided into Eight Watersheds designated as (as A1, A2, A3, A4, B1, B2, B3 and B4). Morphometric aspects such as Bifurcation ratio(Rb), Drainage density(Dd), Stream frequency(Ns), Texture ratio(T), Form factor(Rf), Circularity ratio(Rc), Elongation Ratio(Re), length of overland flow, shape factor(Bs), drainage texture, compactness ratio(Cc) is calculated. Stream order Map is shown in Fig 4.
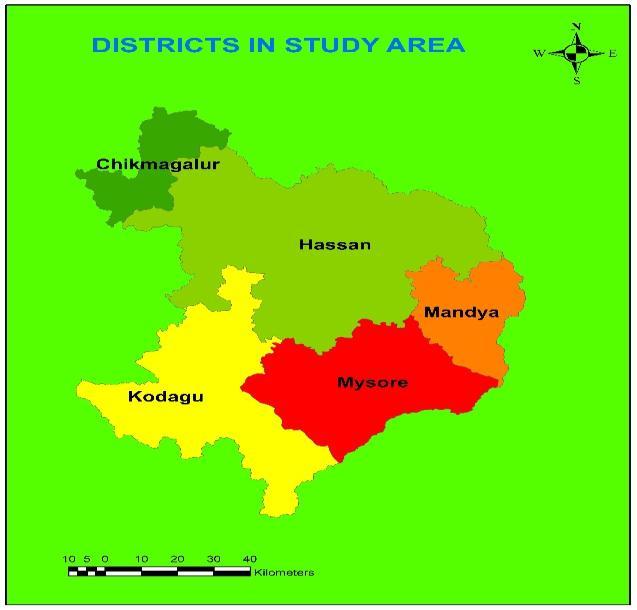
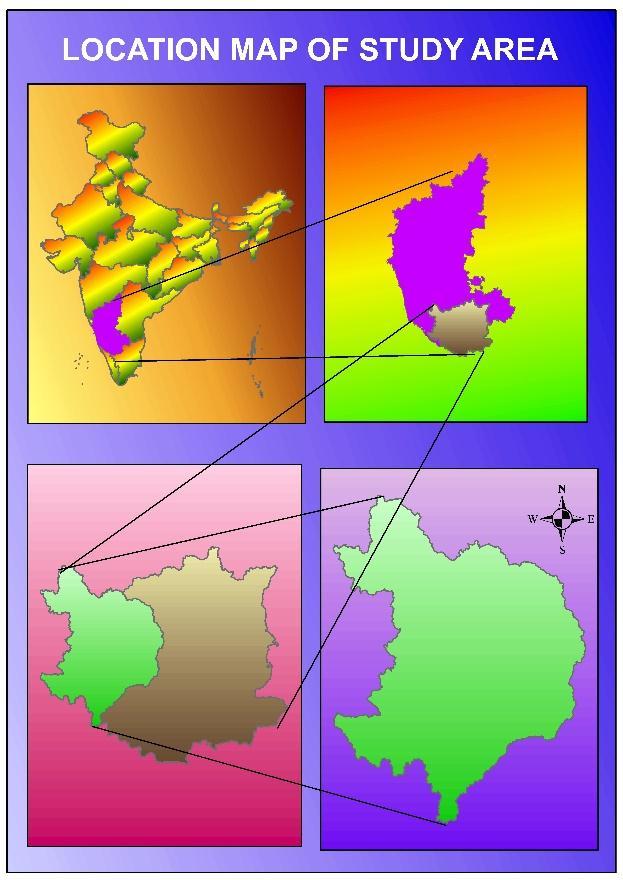
Fig 3 District map of study area
Fig 1 location map of study area
Fig 2 Watershed Map of Area
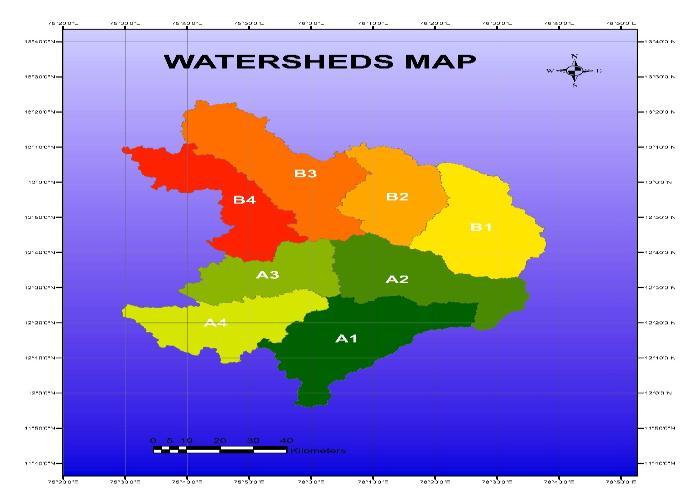
Fig 4 Stream order Map
The total Area (A), Perimeter (P) of Eight Watersheds is calculated using Arc GIS and values are tabulated in table 1.
III. RESULTS AND DISCUSSIONS
3.1 Morphometric analysis Designation of Stream order is the basic step in morphometric analysis of a drainage basin, based on the hierarchic making of streams proposed by Strahler (1964). The highest order stream in the study area is 8 th
order. The morphometric parameters were calculated it shows that Bifurcation ratio (Rb) ranges from 3.416-5.0442 A3 have low Rb whereas B2 have high Rb. Drainage density (Dd) is
low in A3 and high in B1 its value ranges from 1.377-1.463. Stream frequency (Ns) varies from 1.397-1.579 with A1 having low and B4 has high value. Texture ratio (T) ranges from 5.23-8.54 with low in B4 and high in B1. Form factor (Rf) is low in B3 and high in B2 it ranges from 0.233 to 1.082. Length of overland flow varies from 0.341 to 0.363 with low in B1 and high in A3. Basin shape (Bs) is low in B2 and high in B3 it ranges from 0.921 to 4.284.
Compactness coefficient (Cc) show wide variation across the watershed it is more in B4 and less in B1 it varies from 1.496 to 2.365. Elongation ratio(Re) varies from 0.545 to 1.173 with B2 has low and B2 has high value. Circularity ratio(Rc) of watersheds ranges from 0.179 to 0.447 with low in B4 and high in B1. The Tabulated results are shown in Table 3. Linear morphometric characteristics is shown in Table 2.
Subwatersheds
Table 1 : Watersheds of Upper Cauvery Catchment Area(km 2 ) Perimeter(km) Length(km)
A1 A2 A3 A4 B1 B2 B3 B4
1705.50 1411.28 973.81 1205.17 1463.36 1097.97 1759.84 1257.72
263.13 244.53 201.52 222.98 202.94 193.21 315.76 297.45
76.20 50.02 38.50 52.17 38.75 31.85 86.83 65.26
Width(km) 56.52 24.30 22.84 22.21 24.87 30.40 21.3 15.22
Watershed
A1
A2
A3
A4
Table 2: Linear Morphometric Characteristics of Watershed of Upper cauvery Stream order No of Streams Total length of Streams (km) Cumulative Length(km) Mean Stream Length(km) Bifurcation Ratio 1 1857 1203.930 1203.930 0.648 2 387 618.430 1822.360 1.598 4.798 3 83 271.300 2093.660 3.269 4.663 4 19 137.110 2230.770 7.216 4.368 5 6 49.050 2279.820 8.175 3.167 6 1 97.200 2377.020 97.200 6.000 1 1562 1022.530 1022.530 0.655 2 321 521.640 1544.170 1.625 4.866 3 70 249.480 1793.650 3.564 4.586 4 13 120.370 1914.020 9.259 5.385 5 1 9.520 1923.540 9.520 13.000 6 1 13.060 1936.600 13.060 1.000 7 2 72.950 2009.550 36.475 0.500 8 1 17.300 2026.850 17.300 2.000 1 1090 680.950 680.950 0.625 2 238 341.090 1022.040 1.433 4.580 3 51 152.990 1175.030 3.000 4.667 4 12 79.430 1254.460 6.619 4.250 5 4 40.190 1294.650 10.048 3.000 6 2 20.830 1315.480 10.415 2.000 7 1 26.110 1341.590 26.110 2.000 1 1449 937.440 937.440 0.647 2 301 424.630 1362.070 1.411 4.814 3 66 213.250 1575.320 3.231 4.561 4 19 80.580 1655.900 4.241 3.474 5 5 48.200 1704.100 9.640 3.800 6 1 58.930 1763.030 58.930 5.000 1 1734 1116.050 1116.050 0.644
Length Ratio
2.465 2.045 2.208 1.133 11.890
2.482 2.193 2.598 1.028 1.372 2.793 0.474
2.294 2.093 2.207 1.518 1.037 2.507
2.181 2.290 1.313 2.273 6.113