

Transportation Market Overview






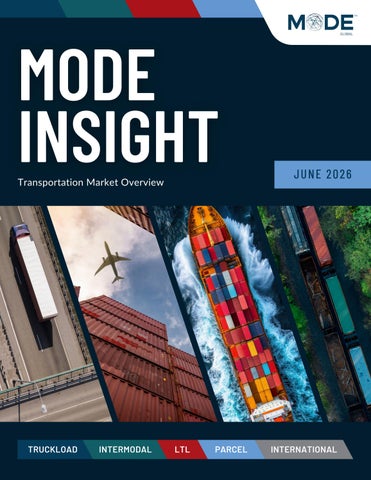
Spot rates and tender rejections have both skyrocketed over the past 30 days, with spot rates 50% higher than the previous year, and tender rejections hovering around 17% The volatility in diesel prices, with an already strained network, has created uncertainty and even deeper coverage challenges than anticipated There are bright spots in signals indicating demand recovery for the balance of the year, with most durable goods sale indices increasing YoY. With a heightened focus on carrier compliance in light of the recent Montgomery Supreme Court decision, coupled with widespread capacity constraints, it is critical that shippers engage trusted capacity and adjust rating expectations to ensure quality coverage through market volatility.
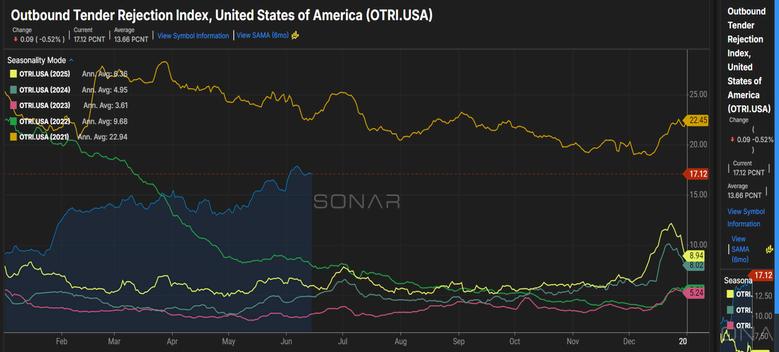
DAT’s National Van Spot Linehaul RPM remained high and increased dramatically from April to May Dry Van load volumes are up significantly YoY The degree to which capacity tightens due to both demand, geopolitics and the recent Supreme Court ruling will set the stage for what could be a sustained period of elevated rates. Significant volatility with fuel will impact available capacity and further pressure test rates.
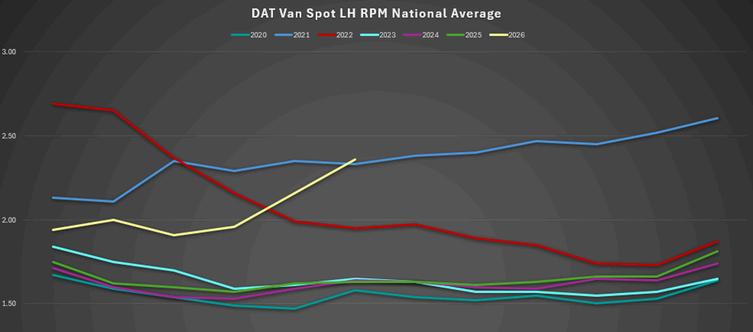


High fuel costs and truckload rates, combined with truckload capacity constraints, continue to create tighter intermodal capacity across North America, particularly in Chicago and California. Traditional truckload shippers are investigating intermodal service options more frequently, with more conversions continuing to occur.
The continued high volumes off the West Coast could potentially lead to an earlier-than-normal peak season being declared by the railroads and intermodal providers. Traditionally, peak season begins in late August or early September; however, many industry experts envision peak being declared in July.
Intermodal carriers and railroads are instituting rate increases of 3-5% in most lanes, and the strongest head-haul lanes such as outbound California, Chicago and Laredo have seen even higher rate increases. Rate increase concessions remain few and far between due to the continued surging demand for intermodal services
The intermodal volume forecast for 2026 has risen 3%, and 2027 projections have changed to 1 6% Domestic truckload to intermodal conversions remain the expected primary driver for intermodal growth

Here are links to some top stories in the industry for you to check out:
FedEx Freight Embarks on Journey as Standalone LTL Carrier
Old Dominion’s May Update Shows an Improving LTL Market
Saia Reports Mixed Operating Metrics in Q1
As we move into June, the overall market environment has become more consistent, but where the freight is coming from remains uneven. With bid season largely behind us and most network adjustments now in place, carriers are shifting their attention away from pricing discussions and toward execution. The focus has become less about positioning for the market and more about performing within it.
The market continues to be a bit of a mixed bag. Some customers, industries and regions are showing steady activity, while others remain cautious. The result is a market where opportunities exist, but not in a way that is moving the industry as a whole Carriers remain focused on network balance, density and operational consistency rather than aggressive growth strategies
Service levels remain strong across much of the LTL landscape With capacity generally available, carriers continue emphasizing operational consistency while looking for opportunities to improve density and network utilization. As a result, execution is becoming a larger differentiator than price alone in many transportation decisions.
Shippers remain cautious with inventory and purchasing decisions, resulting in smaller shipment profiles and continued pressure on overall freight volumes despite pockets of activity. Until confidence improves across the manufacturing and consumer sectors, most carriers appear content operating disciplined networks rather than positioning for rapid growth.
Bottom line: As June gets underway, the market feels less focused on finding its direction and more focused on execution. Carriers are prioritizing service, efficiency and profitability while waiting for stronger demand signals to emerge.
SOURCE: DC Velocity, “Startup Lets LTL Carriers Measure Shipper Performance,” June 2, 2026
As the LTL industry continues to focus on efficiency and cost control, new technology is beginning to shine a light on an area that has historically received little attention: shipper performance. FreightFacts recently introduced a platform that allows carriers to evaluate shippers using operational data and a standardized scoring methodology.
The platform measures performance across 24 operational metrics, including dwell time, appointment compliance, payment timing, accessorial frequency and damage claims. The goal is to provide carriers, shippers and third-party logistics providers with greater visibility into the factors that can influence transportation costs, service levels and overall network efficiency.
Traditionally, shippers have evaluated carrier performance through scorecards and service metrics, while carriers had limited tools to quantify how shipper behavior impacts operations. FreightFacts aims to create a more balanced, data-driven approach by helping all parties identify opportunities to improve processes and reduce avoidable costs.
The concept reflects a broader trend within transportation: leveraging data to strengthen collaboration rather than simply negotiating rates As carriers become more focused on network efficiency and profitability, operational performance at the shipping dock may increasingly become part of the conversation alongside pricing and service
At MODE Global, we've long believed that transportation success extends beyond rates alone. The most effective supply chains are built on strong operational execution, clean shipping practices and collaboration between

The ISM Manufacturing PMI rose to 54.0 in May 2026, its strongest reading since May 2022 and above market expectations. Growth accelerated across new orders, production and order backlogs, while employment remained in contraction but improved from April. Although price pressures eased slightly, costs remained elevated, and supplier delivery times continued to reflect a constrained supply environment Customer inventories remained in “too low” territory, a signal that could support future production and freight demand as replenishment activity continues. Survey respondents continued to cite geopolitical uncertainty, tariffs, and pricing volatility as key concerns
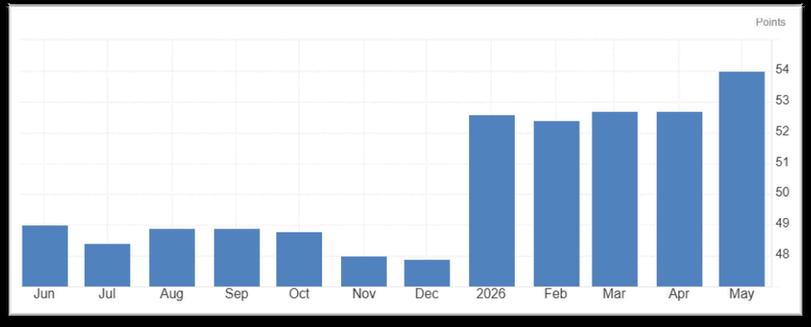
Source: Trading Economics & Federal Reserve
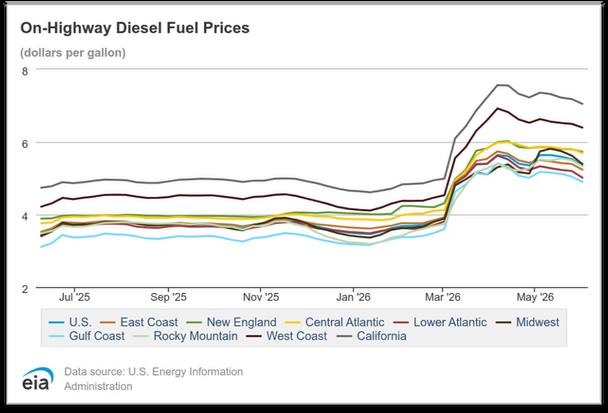
The U.S. national average cost per gallon for on-highway diesel in May 2026 came in at approximately $5 60, which is $0.10 (1.8%) higher than April 2026’s average of roughly $5.50. May 2025’s average was approximately $3.50, putting May 2026 about $2.10 (60.0%) higher year over year. As of the first week of June 2026 (week ending June 1, 2026), the national average stands at $5.35 per gallon, reflecting a decrease of $0.25 (4.5%) from the May monthly average.

Four things shippers should be paying attention to: fuel surcharges are decoupling from fuel prices, FedEx moved to differentiate through data intelligence partnerships, the tariff environment added another layer of uncertainty, and peak season surcharge announcements are weeks away.
Ground fuel surcharges at FedEx and UPS have climbed sharply over the past 12 months, and the increases have significantly outpaced actual diesel price movement. The national average on-highway diesel price declined roughly 6% year-over-year through Q1 2026, yet carrier ground fuel surcharge rates moved in the opposite direction. Both carriers adjusted their index calculation tables in December 2025: FedEx effective December 1, UPS effective January 5, 2026, meaning surcharges rose even when diesel prices are flat or falling. A UPS Ground domestic shipment now carries a 22 75% fuel surcharge at a $3 85 diesel reference price, compared to just 7 13% in 2013 at roughly the same cost per gallon
Fuel surcharges now represent 25–30% of total surcharge spend and are the single largest surcharge category for most shippers. The index tables, not just fuel prices, are the variable to watch.
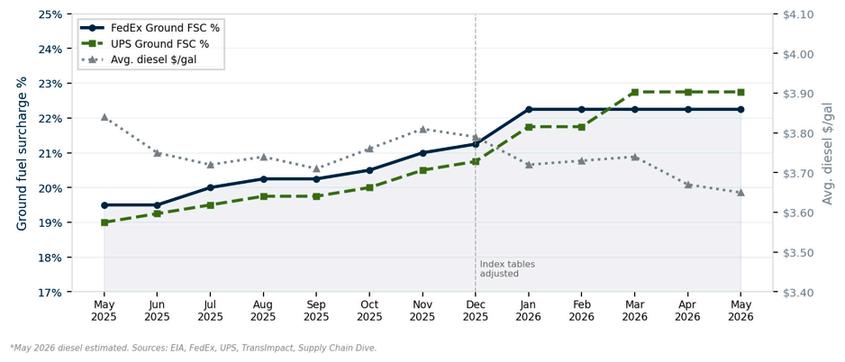
*May 2026 diesel average estimated. FSC rates reflect ground domestic surcharge at the $3.85 reference price. Sources: EIA, FedEx, UPS, TransImpact, Supply Chain Dive.
On July 12, USPS will lower its dimensional weight divisor from 166 to 139 and begin rounding all package dimensions up to the next whole inch, applying to Ground Advantage, Parcel Select, Priority Mail and Priority Mail Express packages over one cubic foot. The change brings USPS pricing in line with UPS and FedEx, which adopted similar dimensional rules in 2025, and raises Ground Advantage Commercial rates by an average of 11.8%.
The practical impact: USPS’s higher divisor and 1-cubic-foot threshold previously gave it an edge for large, lightweight packages; that edge narrows materially after July 12. Shippers who route lightweight or bulky volume to USPS based on historical cost assumptions should re-run the comparison against current FedEx and UPS rates.
If you haven’t run a current carrier comparison for your lightweight, bulky package profile, now is the time before the July 12 change takes effect.
The end of the U.S. de minimis exemption is now the baseline reality for cross-border parcel. Every commercial shipment entering the U.S. requires full customs entry and documentation, adding $15–25 per parcel in brokerage and compliance costs. That’s a structural cost shift, not a temporary one.
Looking ahead, the USMCA treaty review beginning July 1 introduces new uncertainty for Canadian and Mexican cross-border volume. Shippers with cross-border programs should ensure their cost models and compliance processes reflect where policy currently stands, not where it was a year ago.
Cross-border programs built on 2025 cost assumptions are likely underestimating current landed costs. Q2 is the right time to recalibrate.
FedEx and UPS peak season surcharge announcements for 2026 are expected in July and August. Based on the 2025 peak season structure, the chart below shows the full picture of what standard rates become during Demand Period 2, the highest-cost window running from Black Friday through late December. Six surcharge categories drive the most meaningful cost increases, split across two scales: per-package fees in the low-to-mid dollar range and the high-dollar charges that can stop a shipment entirely if not anticipated.
The left panel covers Express services, Ground Residential, Ground Economy/Ground Saver and Additional Handling. The right panel shows Oversize/Large Package and the Unauthorized Package charge, which reaches $545 per package at peak. These surcharges stack: a large residential package shipped via Ground Economy during Demand Period 2 can trigger multiple categories simultaneously.
Standard vs. Peak Season Surcharges FedEx and UPS, All Categories (Demand Period 2 maximums)
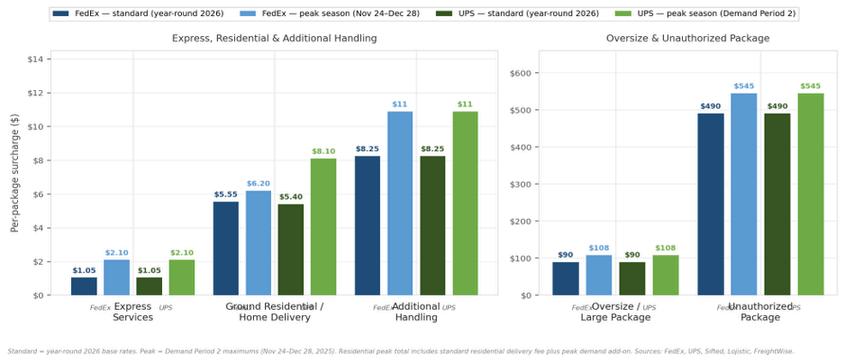
Peak rates reflect highest demand period (Nov 24–Dec 28, 2025) Standard rates reflect year-round 2026 base Residential peak shows demand add-on above standard residential delivery fee
Peak surcharges were in effect for nearly five months of 2025 across various service levels. Shippers that modeled only the GRI going into Q4 consistently underestimated total carrier cost by 15–25% during peak periods.


Rates: Asia to U.S. rates are up sharply moving into June, driven mostly by fuel increases, but also carrier rate increases due to early peak-season volumes and capacity constraints.
Volume: May container imports increased by more than 11%, and June already looks stronger as peak season volumes come earlier than expected.
Capacity: Fallout from blank sailings in May is now causing carriers to scramble to redeploy to handle surging volumes.
Ocean container rates on major East-West trade lanes that held mostly steady in the last half of May, spiked by at least $1,000 per FEU on primarily rate increases and surcharges that took effect June 1.
The ongoing closure to most global shipping through the Strait of Hormuz by Iran has kept container rates elevated but somewhat in check; however, fuel costs have driven most of the sharp increases. Additionally, the onset of some early peak season demand is now pushing rates up sharply from that elevated baseline as space gets tighter.
Spot rates for 40-foot containers moving from China to North America's East Coast have almost doubled since late February, rising from $2,600 to over $5,000 The trans-Pacific route to the West Coast has increased nearly $1,400 over the same period to $4,000 as of the first week of June Both lanes experienced more than a 75% increase over an eight-week period, according to the Freightos Baltic Daily Index.
Spot rates for 40-foot containers moving from China to North America's East Coast have almost doubled since late February, rising from $2,600 to over $5,000. The trans-Pacific route to the West Coast has increased nearly $1,400 over the same period to $4,000 as of the first week of June. Both lanes experienced more than a 75% increase over an eight-week period, according to the Freightos Baltic Daily Index.
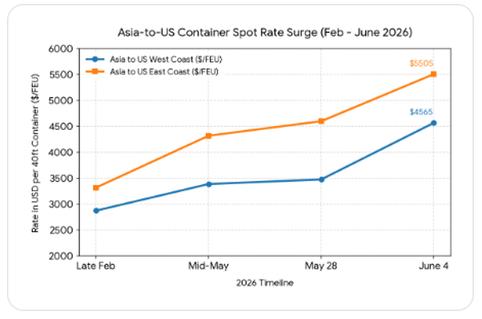
Source: Freightos
But June 1 GRIs and PSS (peak season surcharges) introductions have daily rates spiking from $1,000 per FEU to $1,800 per FEU Additional significant increases have been announced by CMA CGM, Maersk and other lines planned for mid-month
Recently, CMA CGM announced one of the biggest, a whopping $2,600 increase on 40- and 45-foot containers moving from the East Mediterranean to U.S. East Coast ports.
Asia-U.S. West Coast rates have now risen by more than 85% since April 1, with Asia-East Coast rates matching that pace. This is now the third year out of the past four that peak conditions started in the second quarter (historically considered early). Analysts feel the drivers are a combination of sharply increasing volumes and restricted capacity growth (heavy blank sailings), which has seemingly taken the carriers by surprise.
Market analysts anticipate that pricing power will remain firmly in the carriers' hands through the first half of June. Rates will remain firm, with an expected increase (again) of between $800-1000 per FEU on June 15. However, some forward-looking logistics data suggests a potential cooling off or slight decline in trans-Pacific rates by late June.
Global trade volume is pacing toward a modest 2.5% to 3.5% growth rate for the full year, but June has seen an immense artificial demand spike Rather than waiting for the traditional late Q3 peak season, shippers are aggressively pushing bookings forward
Demand is surging as the peak season gets underway According to SONAR, the Ocean Volume Index has risen to 65,346 from 49,032 since May 4. According to Datamyne, containerized imports in May increased 11.1% year-onyear versus 2025. June data is obviously not in yet, but the expectation is that there will be a substantial surge in volumes.
The National Retail Federation forecasted a July start to peak season; however, according to the most recent data, peak season volume levels may have already started.
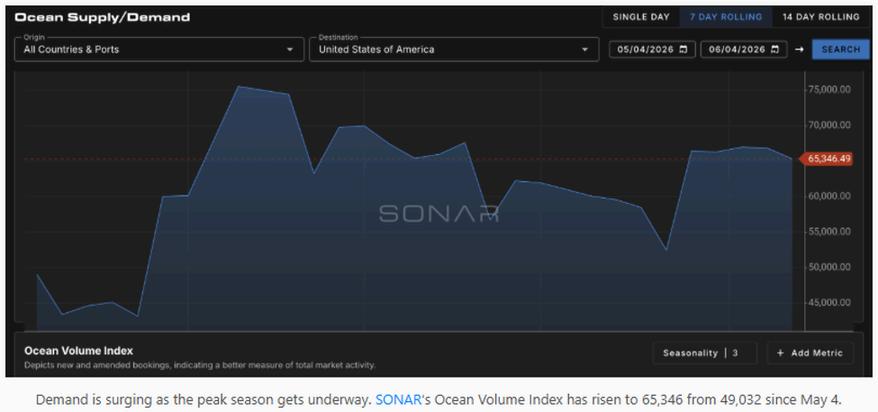
Key Drivers:
Tariff Hedging: Importers, particularly in trans-Pacific trades, are front-loading cargo to beat sweeping new U.S. tariff structures expected to take effect in July.
Front-loading of some volumes ahead of the possible reemergence of Section 301 tariffs this summer will likely continue to drive volume growth in June. The Section 122 temporary tariffs are set to expire on July 24. Alternatively, an argument could be made that overall peak-season volumes may continue to shift away from the traditional Q3 period and become the norm in late Q2.
Bunker Fuel Avoidance: Shippers are pushing bookings forward in anticipation of expected July 1 bunker fuel surcharge increases as well as more future unknown increases should the Iran conflict continue
Event-Driven Logistics: Some analysts feel that a degree of volume increase can be attributed to increased consumer demand and retail stock replenishment linked to the 2026 FIFA World Cup held in the U.S. starting in June.
As seen many times in the past, the ocean carriers once again seem to have miscalculated the size and scope of their capacity management processes. Higher levels of blank sailings, in April and May when volumes were moderate, are now having to be quickly rolled back because of actual demand/volume increases. The challenge for the ocean carriers is that the process of redeploying vessels back into rotation may take weeks.
Currently, the effective operational capacity in June is exceptionally tight due to carrier capacity management practices over the last few months.
Strategic Blank Sailings: Carriers are now more tightly regulating vessel space. Some reports show very limited blank sailing levels on the trans-Pacific route for early June (see below), utilizing maximum fleet allocation to capture surging volumes
Geopolitical and Routing Factors: Continued security risks in the Middle East require ongoing network adjustments and longer transit routes around Africa It is estimated that about 30% of global containers are traveling empty to correct deep trade imbalances, consuming critical slot capacity.
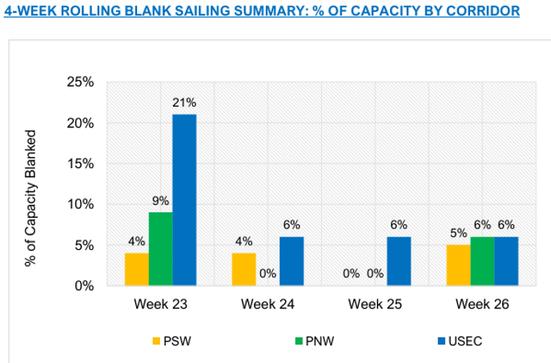
Source: M+R Spedag Group
Blank sailings in May resulted in severe space shortages from all cargo origins in Asia. This prompted carriers to raise spot rates every two weeks and apply significant restrictions on contract cargo (accepting contract cargo vs higher paying spot rate freight) as well as restricting heavy containers moving through the Panama Canal.
With this said, we do expect that the capacity situation will begin to improve, not only fewer blank sailings but with several carriers now studying “extra loader” deployment later in June These “extra loaders” are additional weekly vessel sailings in key volume lanes