
Transportation Market Overview







Market conditions continue to favor carriers with the week of July 4 yielding an alltime high for van spot rates. Continuation of elevated spot rates is expected, with overall trucking conditions favoring carriers [FTRs Trucking Conditions Index (TCI) posted an all-time high in May at 20 4]
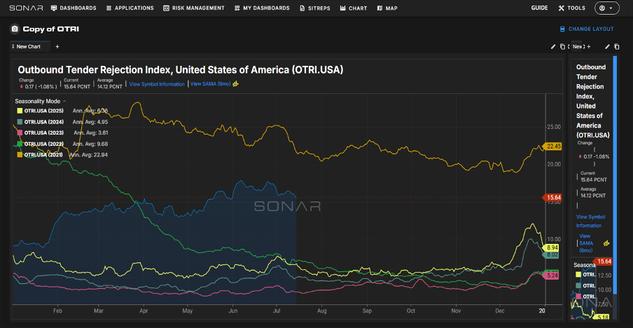
Demand signals are elusive and by no means certain; with a still strained capacity market, tender rejections are hovering at about 15% compared to 17% the month prior. The question that remains is to capitalize on favorable conditions with the challenges that exist securing capacity and navigating regulatory requirements.
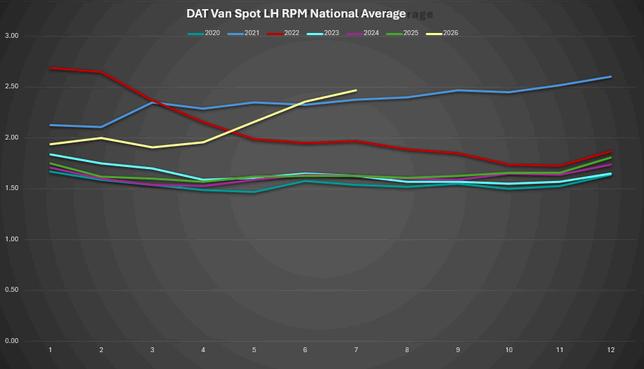
DAT’s National Van Spot Linehaul RPM remains high and increased from May to June. All indicators currently point to the balance of 2026 remaining in an elevated state, and further geopolitical considerations with the Strait of Hormuz will likely repeat strains on diesel in the coming weeks.


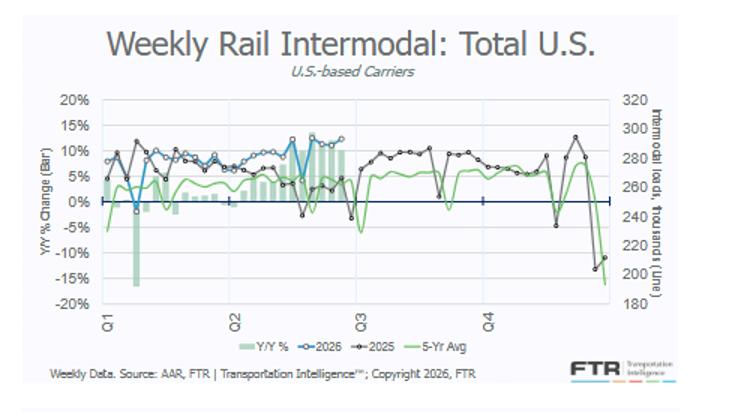
Intermodal providers and the railroad have declared peak season much earlier than normal out of Southern California. Peak season began in early July this year, when traditionally Peak season begins in late August or early September. When Peak season is declared, customers with year-round consistent volumes are allowed to ship the same weekly volumes at the same rate that has been shipped all year; however, there is a surcharge implemented for shipping over the average weekly volumes for the year to date. The surcharges are intended to protect existing customers by preventing new volume surges from consuming capacity for existing business.
Aside from Southern California, intermodal capacity is constrained in many markets across the United States and Canada. The challenges are not only with intermodal equipment availability, but there are also difficulties in finding drayage drivers to pick up and deliver the containers to and from the customer.
Domestic intermodal rates are expected to show significant increases of almost 9% in 2026 and 4% in 2027, primarily due to truck capacity constraints Intermodal volume projections for 2026 have grown to 3 8%, while the 2027 forecast has increased to 1 8% Truckers leaving the market and higher truckload rates, along with fuel costs, are among the drivers behind the current trend of truckload-to-intermodal conversions

Here are links to some top stories in the industry for you to check out:
June Manufacturing
Data Supportive of LTL Demand
Saia Transitions Over 10,000 Devices to
ABF
Saia Continues to Boost Midwest LTL Operations
As we move into July, the conversation across the LTL market is beginning to change. Carriers are still operating in a disciplined environment, but there's a growing sense that customers are becoming more comfortable making transportation decisions instead of waiting for more certainty. Freight demand hasn't accelerated, but it's becoming more consistent as supply chains settle into a steadier rhythm.
Carriers continue to see progress with one customer and one lane at a time instead of broad growth. Some industrial freight is beginning to strengthen, shipment weights are improving in parts of the network, and seasonal shipping activity is starting to build. While none of these trends point to a major market shift on their own, together they suggest the market is gradually moving in the right direction.
Operationally, the focus remains on consistency. Service performance continues to be a key differentiator, and carriers are staying disciplined with pricing while looking for opportunities to improve network utilization. Instead of expanding aggressively, most are choosing to grow where freight fits their existing operations and supports long-term profitability
Looking ahead, attention is beginning to shift toward the second half of the year Many in the industry are watching to see whether improving manufacturing activity and seasonal freight can translate into more meaningful volume growth. While market conditions continue to improve, the recovery remains uneven. Some carriers continue to navigate localized operational constraints, even as the broader LTL market trends in a more positive direction.
What This Means to MODE: The market is rewarding execution more than opportunity right now. While broad demand remains measured, carriers that continue delivering consistent service, maintaining strong relationships and making disciplined network decisions will be in the best position when volumes begin to strengthen.
SOURCE: FreightWaves, "Why the Best LTL Carriers Are Built, Not Bought: Old Dominion Freight Line's Approach to LTL Consistency," Matt Herr, June 30, 2026.
In today's LTL market, service consistency has become just as important as competitive pricing. While rates often receive the most attention during carrier selection, long-term performance is ultimately driven by the operational investments carriers make behind the scenes. A recent FreightWaves article highlights how Old Dominion Freight Line has built its reputation through a disciplined approach to fleet maintenance, technology, employee development and operational execution
Rather than relying on any single initiative, Old Dominion focuses on a series of interconnected processes designed to improve service reliability Preventive fleet maintenance, strategic load planning, optimized routing and disciplined dock operations all work together to reduce transit delays and cargo claims while improving ontime performance.
Technology also plays an increasingly important role. Investments in electronic bills of lading, API connectivity, shipment visibility, route optimization and dock management systems allow customers to receive more timely information while helping carriers operate more efficiently. These tools improve communication across the shipment lifecycle and reduce operational friction for both carriers and shippers.
Equally important is the company's investment in its workforce. By promoting from within, developing drivers internally and emphasizing long-term employee retention, Old Dominion has created a culture where operational knowledge and customer service continue to build over time. That combination of experienced people, standardized processes and modern technology has helped the carrier consistently deliver industry-leading service metrics year after year
In the LTL industry, consistency isn't achieved through a single investment, it's the result of disciplined execution across people, processes, technology and equipment As shippers continue to prioritize reliability alongside cost, partnering with carriers that consistently invest in operational excellence will become an even greater competitive advantage. At MODE Global, that's exactly what we look for when building our carrier network and recommending transportation solutions to our customers.

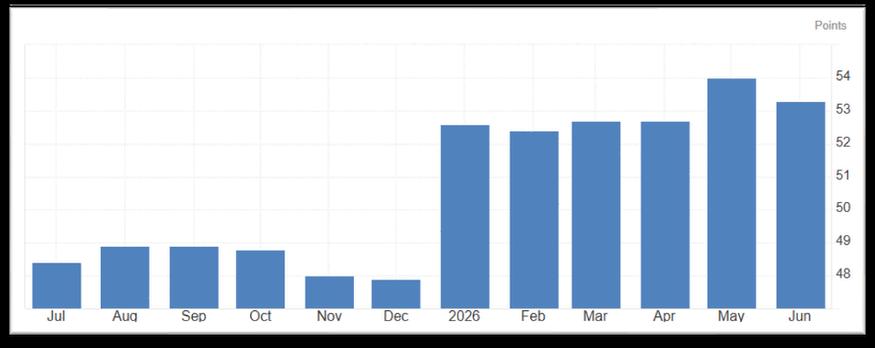
The ISM Manufacturing PMI eased to 53.3 in June 2026 from 54.0 in May, signaling that manufacturing continued to expand but at a slower pace. Production and new orders remained in growth territory, though both moderated from the previous month. Employment improved slightly but remained in contraction. The biggest positive was a meaningful decline in price pressures, although input costs remain elevated Manufacturers continue to cite inflation, geopolitical tensions, tariff uncertainty and the potential for higher interest rates as ongoing challenges that could weigh on demand and investment.
Source: Trading Economics & Federal Reserve
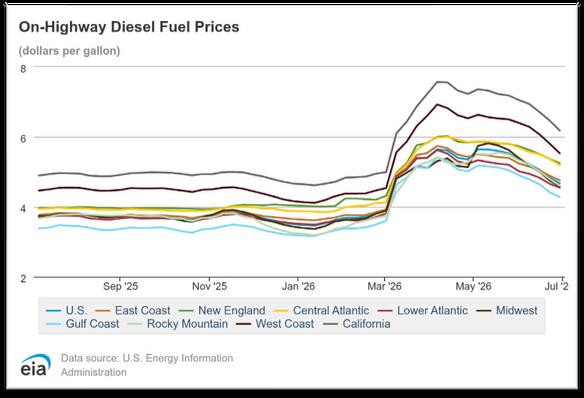
The U.S. national average cost per gallon for on-highway diesel in June 2026 came in at approximately $5 02, which is $0.58 (10.4%) lower than May 2026's average of approximately $5 60 June 2025's average was approximately $3.78, putting June 2026 about $1.24 (32.8%) higher year over year As of the first week of July 2026 (week ending June 29, 2026), the national average stands at $4.67 per gallon, reflecting a decrease of approximately $0.35 (7.1%) from the June monthly average

July 12 marked the biggest structural change to USPS package pricing in recent memory not another across-theboard rate hike, but a rewrite of how packages get measured and billed. It continues a theme that's run through this series all year: carrier pricing is converging, and all three national carriers are moving costs outside their annual rate increases. Meanwhile, a Postal Regulatory Commission filing confirms that more hikes are already on the calendar through 2028, and FedEx and UPS both have their own mid-cycle fee changes landing this summer
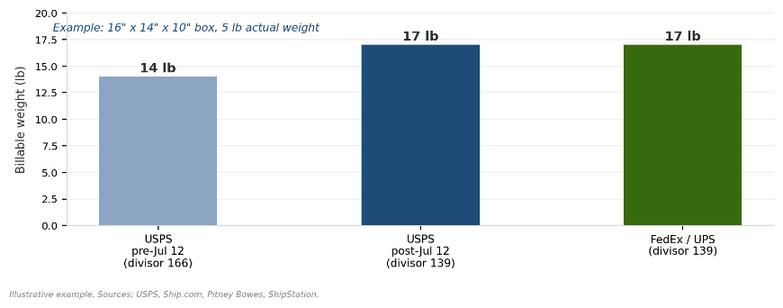
Effective July 12, USPS lowered its dimensional weight divisor from 166 to 139 and now requires every package dimension to round up to the next whole inch before, matching the measurement rules FedEx and UPS adopted in 2025. The change applies to Priority Mail Express, Priority Mail, Ground Advantage and Parcel Select, hitting large, lightweight boxes hardest: a package that used to bill on actual weight can now bill on volume instead.
The practical effect is that USPS's longstanding price edge on bulky, lightweight parcels has largely closed Shippers routing that volume to USPS based on last year's cost comparison should re-run the math against current FedEx and UPS rates The cheapest carrier for a given box now varies more by weight and zone than it has in years.
USPS also introduced new hazmat fees alongside the divisor change (a $7.50 handling fee on Priority Mail and Priority Mail Express hazmat shipments and a $50 fee for undeclared or mislabeled hazmat) plus a per-package fee for missing or inaccurate dimensions. To avoid issues, confirm your shipping platform is transmitting accurate length, width and height on every label.
The recent pricing overhaul isn't happening from a position of strength. USPS posted a $9.5 billion net loss in fiscal 2025, and Postmaster General David Steiner has told Congress the agency could run out of cash within 12 months without new borrowing authority prompting a freeze on nonessential spending, including hiring and travel, alongside this month's price and dimensional changes.
A December Postal Regulatory Commission filing shows USPS anticipates additional price increases in January and July through 2028, meaning July 12 is a checkpoint, not a conclusion. Lawmakers on both sides of the aisle have also raised concerns about delivery delays in recent months, adding scrutiny to a carrier many shippers still default to as the reliable low-cost option.
For those leaning on USPS Ground Advantage or Priority Mail as a lower-cost alternative to UPS or FedEx, the combination of scheduled increases through 2028 is a trend to flag now, not a one-time adjustment to model around.
USPS isn't the only carrier adjusting pricing mid-year. The Rate and Service Guide update from UPS, effective July 6, raised Extended, Pickup and Remote Area Surcharges to the greater of $61 per shipment or $0.61/lb, and Residential Surcharge to $6.60 per package on Standard services ($6.95 on International Air and 3 Day Select). A new $5 Non-Compliant Label Fee also lands August 2 on UPS Ground Saver shipments that don't meet labeling requirements or aren't processed through an approved shipping system.
FedEx has its own changes landing on a similar timeline. New Delivery and Pickup Area Surcharge ZIP code lists take effect July 20, and August 3 brings a renamed, EU-expanded Inbound Processing Fee alongside a Disbursement Fee increase to the greater of $17.50 or 2.5% of duty and tax charges. Neither of these is a headline GRI, they're the kind of accessorial and fee adjustments that increasingly show up between annual rate increases, and both carriers are now making them multiple times a year
Businesses that only reconcile invoices against the January GRI are missing a growing share of their actual cost increase. Both UPS and FedEx are layering in ZIP code, surcharge and fee changes on a rolling basis — a standing reminder to review invoices quarterly, not annually.


Rates: Asia to U.S. rates are still high but showing some signs of stabilization moving into mid- and late July. Fuel is still a big driver in overall elevated rates, but a heavy influx of capacity is providing some downward pressure and stability.
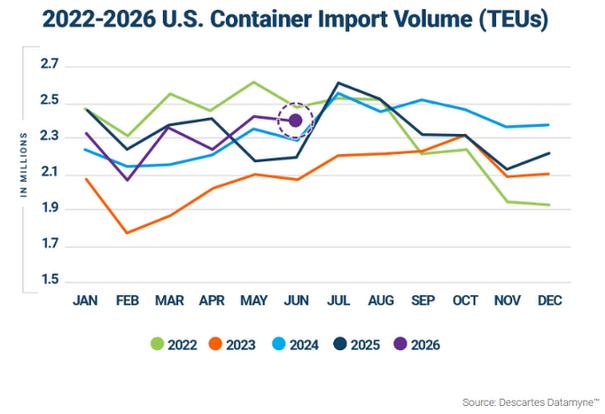
Volume: June saw containerized imports of 2.4M TEU, nearly matching the record month of May 2022. Peak season is likely to hit the ceiling, with monthly decreases expected through November.
Capacity: Carriers in mid- to late June started pulling back on blank sailings to take advantage of the demand surge, causing a significant increase in functional capacity and now equipment shortages.
After ten consecutive weeks of substantial spikes since mid-May, spot rates have started showing the first signs of stabilization in the second week of July Carriers have been successful in capitalizing on tighter space through massive General Rate Increases (GRI) and fuel surcharges.
Market data for the week of July 10 showed spot rates from Asia to the U.S. West Coast sliding down 0.1% weekon-week to $7,069USD per FEU. Rates from Asia to the U.S. East Coast slightly increased 0.3% to $8,808USD per FEU.
Additionally, rates from Asia to North Europe slipped 0.2% to $5,503USD per FEU, and Far East-Mediterranean rates fell 0.9% to $6,855USD per FEU. As such, it appears that at least for July the very sharp increases of the past few months have lost some traction.
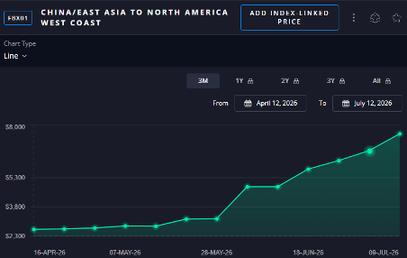
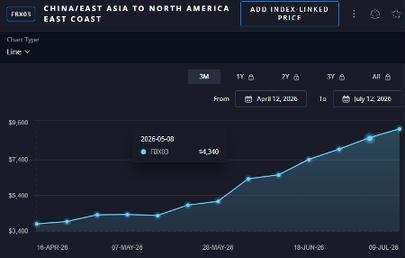
Since mid-May, transpacific ocean rates to the U S West Coast have climbed 120%, and by 85% to East Coast By comparison, Asia–North Europe rates are up 70% in that time, and 85% to the Mediterranean These Asia–Europe levels are the highest since September 2024
What remains to be seen is whether demand continues to be strong or if volumes also start to slip back. In the latter case, it is likely that rates will soften and start to drop back. Many trade and industry analysts feel that transpacific rates have peaked for the month of July already, and there may be far less support for increases in mid-July. The carriers will likely readjust their rates at that time to maintain current volumes.
Driven by intense retailer anxiety surrounding potential tariff increases and abnormally early peak season surges, inbound U.S. volumes experienced a sharp 15% month-over-month increase. June/July import volumes are now hovering around 2.25 million TEUs (up 14.3% year-over-year).
Traditional peak season timelines (typically August–October) have been completely disrupted by an unseasonal, heavily compressed pull-forward import procurement strategy. The National Retail Foundation (NRF) reports June import volumes at 2.33 million TEUs, up 18.7% YoY, bringing first-half volume to 12.77 million TEUs, a gain of 2% from the same period in 2025.
A 3.3% projected import increase puts July volume at 2.47 million TEUs, which would top the previous monthly record of 2.4 million TEUs set in May 2022, as the U.S. emerged from the pandemic. August imports are expected to drop 4 5% to 2 22 million TEUs, while September volume is forecast at 1 99 million TEUs, down 5 7% YoY October is expected to be 3 8% weaker at 1 99 million TEUs, and November lower by 5.2%, at 1.92 million TEUs.
The National Retail Federation said 32% of surveyed consumers had started their back-to-school shopping in June, up from 26% in 2025, an indicator for retail spending later in the year. The early peak season push is likely caused by several different factors, from frontloading ahead of carrier increases and fuel surcharges, manufacturer price increases, as well as approaching U.S. tariff deadlines. However, with importers pulling peak season volumes forward, it is likely that we should expect this early start to mean an early peak season end as well, possibly at some point in August or early September
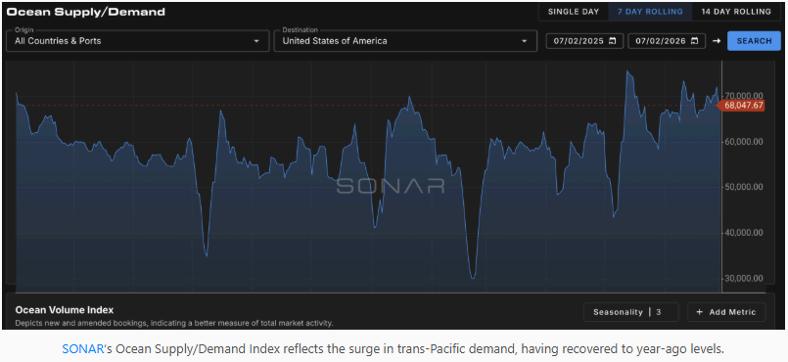
Functional capacity in the market has shifted substantially, moving into July. While carriers are injecting record amounts of nominal vessel tonnage, severe physical infrastructure bottlenecks are choking effective supply.
In response to upward-trending rates, ocean carriers unleashed a sudden capacity surge in early July Offered capacity to the U S West Coast hit a historic four-week rolling average of 350,000 TEUs, mirroring all-time highs Offered capacity increased 5 5% week-on-week on the Far East–U S West Coast trade, 6 2% to the U S East Coast and 3 1% to North Europe
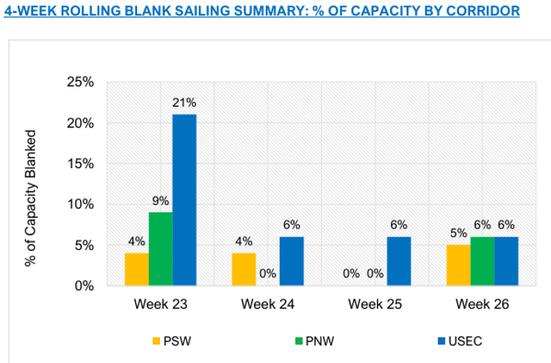
After an active month of blank sailings in May and early June, late June capacity normalized, and July’s cancelled transpacific capacity is expected to settle under 5% of total trade supply. The only exception to this is the Pacific Northwest services, which are forecasted to have continued blank sailings later in July. This could force more inland rail volumes through the ports of LA/LB, which in turn could further increase rail dwell times.
Reflecting ultra-tight capacity and desperate attempts by carriers to fulfill demand, only a handful of blank sailings are being reported across major East-West corridors going into mid-July. However, despite the physical vessel availability, a severe shortage of 40foot containers across China and Southeast Asia is stranding cargo at origins with booking rolls Container availability and loading congestion is expected to be the longer-term challenge for the next couple of months.