Solutions Manual for Understanding Behavioral Statistics v1 1st Edition by Lorch
ISBN: 9781453341476

ISBN: 9781453341476
Ideally, students would be assigned to read Chapter 1 before the initial class meeting. It is very short and covers topics that are usually addressed in the first class. There are three purposes to this brief chapter:
1. Give students tips on how to learn statistics.
2. Provide a very brief overview of the content and organization of the text.
3. Set the context for the first section of the text on descriptive statistics.
It is common to provide study advice and an overview of the text in a preface, but most students do not read the preface. The study advice in Section 1 is very important. Many students majoring in the behavioral sciences begin their first course in statistics with apprehension and misconceptions about how to approach the material. The misconceptions include beliefs that they need to memorize formulas and learn how to apply rote procedures to process numbers that do not mean much to them. Many students believe they “aren’t good at math.” Unconstructive beliefs and misconceptions about how to study statistics should be addressed—and, hopefully, dispelled—at the outset of the course.
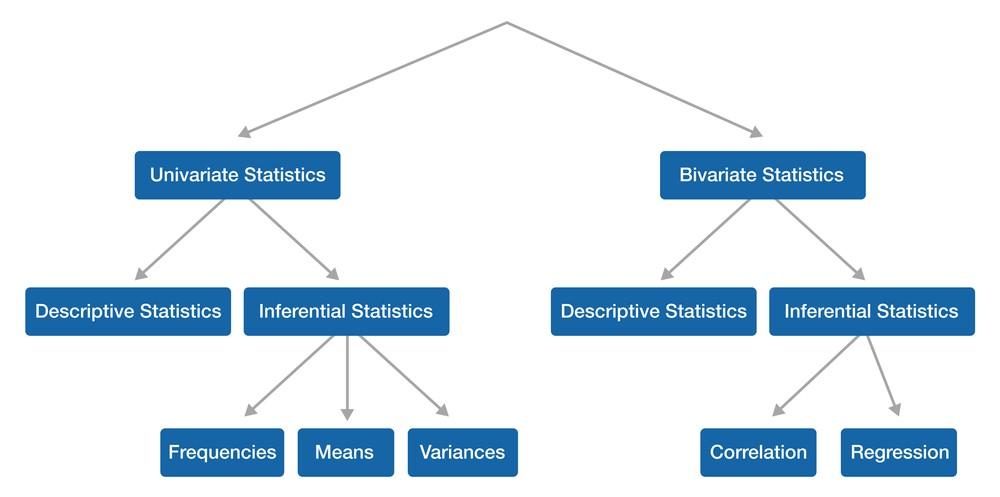
The second section, overviewing the content and organization, is kept very brief. It seems obligatory, but it is not very meaningful to students who are new to the study of statistics.
The final section of the chapter sets up the topic for the first part of the book, univariate descriptive statistics. This section sets up an example of a situation where descriptive statistics are sufficient for the purposes of data analyses (i.e., inferential statistics are irrelevant because the entire population of interest is available for study). The example is straightforward, and the statistics are already familiar to most students. Students are invited to think about what information they might collect and how they would present the information to an audience. The goal is to engage students at the outset so that their study of descriptive statistics in Chapters 2 and 3 will be more meaningful.

Robert F. Lorch, Jr.

Published by:
FlatWorld ©2024 by FlatWorld. All rights reserved. Your use of this work is subject to the license agreement available on our website at www.flatworld.com/terms.
No part of this work may be used, modified, or reproduced in any form by any means except as expressly permitted under the licensing agreement.

1. Learn how to study statistics.
2. Preview major topics in the book and their organization.
3. Introduce a context for the first topic in the book, descriptive statistics.
•Always aim for understanding!
•Be patient.
•Study the textbook (don’t just read it).
• Think as you read.
• Use the learning aids available in the chapters.
• Do the problems!
•Learn the language of statistics.
•Use your resources.
Research in the behavioral sciences usually involves the collection of many observations that are tabulated in some organized way, often on a spreadsheet.
The first step in making sense of a dataset is to describe the results in systematic ways.
One category of descriptive statistics are methods for capturing trends across the entire dataset by either
Constructing tables that organize the observations into meaningful categories and measure the observations in some way (e.g., simply count how many observations fall in each category) or
Drawing graphs that organize observations into categories
A second category of descriptive statistics includes measures of important characteristics of the dataset, such as
Measures of a typical observation in a dataset
Measures of how much observations differ from one another
Student evaluations are solicited for every course at the end of each semester. In a course like introductory psychology, there may be 2,000 ratings compiled on each of the many questions in the survey. One question on the survey asks students to indicate their expected grade for the course. What would you like to know about students’ responses to this question?
You probably would like to see the entire distribution of responses to the question in a table or graph.
How would you tabulate the observations? What would your categories be?
You might want to summarize the typical expected grade somehow. What might you select as a measure of the “typical” grade?
You might want to summarize the amount of variation in expected grades somehow. What might you select as a measure of variation?
Another question on the survey might be “What is your GPA in your college courses?”
with students asked to type their answer to two decimal places.
How would you tabulate these observations into categories for presentation in a table or graph?
How is this process more complicated than the tabulation of expected grades in the previous example?
How might you summarize the “typical” GPA? Would you choose the same measure that you selected for expected grades?
How might you summarize the amount of variability in GPAs? Again, would you do the same thing that you did for expected grades?
You are already familiar with many of the topics we will cover in our study of descriptive statistics.
Pay close attention to the “when?” and “why?” of the procedures we study.
Chapter 2 covers procedures for tabling and graphing entire distributions of observations
Chapter 3 covers statistics for summarizing the “typical” observation in a dataset, the amount of variation in observations in a dataset, and a couple of other characteristics of distributions of observations.