Solutions Manual for Microeconomics 2026 Release 1st Edition by McConnell, Brue, Flynn
ISBN: 9781266440137
ISBN: 9781266440137
CHAPTER 1 CONNECT ASSET MAP
WHAT’S NEW IN CHAPTER 1
SUGGESTIONS FOR IMPLEMENTATION
LEARNING OBJECTIVES
OVERVIEW OF THE CHAPTER
COMMENTS AND TEACHING SUGGESTIONS
STUDENT STUMBLING BLOCKS
LECTURE OUTLINE
QUIZ
McConnell, Brue, Flynn, Microeconomics, 23e: Chapter 1: Limits, Alternatives, and Choices
Chapter 1: Limits, Alternatives, and Choices
SmartBook 2.0
End of Chapter Exercises
Video (Connect the Dots)*
Interactive Graph: Production Possibilities*
Interactive Graph: Graphing Linear Equations*
Limits, Alternatives, and Choices
PPF Shifts and Pivots
Tradeoffs
PPF Efficiency
Production Possibilities 1 (Opportunity Costs)
Production Possibilities 2 (Efficient and Attainable)
Graphing Linear Equations: Introduction to the Interactive Graph
Graphing Linear Equations: Understanding Slope
Graphing Linear Equations: Calculating Slope
Graphing Linear Equations: Calculating Slope (Algo) (Variation 1)
Graphing Linear Equations: Calculating Slope (Algo) (Variation 2)
Graphing Linear Equations: Points on a Line 1 (Algo)
Graphing Linear Equations: Points on a Line 2 (Algo)
Graphing Linear Equations: Points on a Line 3 (Algo)
Graphing Linear Equations: Points on a Line 4 (Algo)
Graphing Linear Equations: Intercept-Slope Form (Algo)
Graphing Linear Equations: Intercept-Slope Form (Algo)
Graphing Linear Equations: Intercept-Slope Form - Application (Algo)
Graphing Linear Equations: Intercept-Slope Form - Application (Algo)
Graphing Linear Equations: Two-Point Form 1 (Algo)
Graphing Linear Equations: Two-Point Form 2 (Algo)
Graphing Linear Equations: Two-Point Form - Application (Algo) (Variation 1)
Graphing Linear Equations: Two-Point Form - Application (Algo) (Variation 2)
Graphing Linear Equations: Two-Point Form - Application (Algo) (Variation 3)
Graphing Linear Equations: Two-Point Form - Experimentation (Algo)
Graphing Linear Equations: Slope-Intercept Form - Experimentation (Algo)
Interactive Graph: Graphing Quadratic Equations*
Graphing Quadratic Equations: Introduction to the Interactive Graph
Graphing Quadratic Equations: Slopes Along a Curve (Algo)
Graphing Quadratic Equations: Slopes Along a Curve (Algo)
McConnell, Brue, Flynn, Microeconomics, 23e: Chapter 1: Limits, Alternatives, and Choices
Graphing Quadratic Equations: Describing a Curve Using Its Tangent (Variation 1)
Graphing Quadratic Equations: Describing a Curve Using Its Tangent (Variation 2) (Algo)
Graphing Quadratic Equations: Estimating Slopes on a Curve 1
Graphing Quadratic Equations: Estimating Slopes on a Curve 1 (Algo)
Graphing Quadratic Equations: Estimating Slopes on a Curve 2 (Algo)
Graphing Quadratic Equations: Slopes and Cost Calculations (Algo)
Graphing Quadratic Equations: Slopes and Cost Calculations (Algo)
Graphing Quadratic Equations: Slopes and Profit (Algo)
Economics and Ethics Discussion Questions*
Application-Based Activity*
An Ethical Dilemma, a Common Example In Many Discussions
Scarcity and Household Decisions
Scarcity and Parenting
Scarcity and The Allocation of Resources
Scarcity and The Allocation of Resources (Alternative version)
Cost-Benefit Analysis and Decision Making
Decision Making
Economic Growth and Intertemporal Choices
Production Possibilities
Unemployment Test Bank
*All content marked with an asterisk is available for assignment in the menu in the “course-wide content” menu in the Connect question picker. New Experience > Assignments > Add Assignment > Question Bank > Course-Wide Content Dropdown Tab >
**The full Connect Asset Map for the entire product can be found in the Instructor’s Resource Page. Click path in Connect: New Experience > Dashboard > Instructor Resources (lower right) > Connect Asset Map
McConnell, Brue, Flynn, Microeconomics, 23e: Chapter 1: Limits, Alternatives, and Choices
Each chapter of Microeconomics, 23rd edition, contains data updates and numerous revised examples that will be fresh and relevant for today’s students. Chapter-specific updates include new boxed pieces, additional Key Graphs, and substantial revisions to the core content. The content and examples were also revised with a keen eye toward diversity, equity and inclusion.
Chapter 1: Limits, Alternatives, and Choices
Chapter 1 features updated examples, a revised and clarified presentation of capital, intangible intellectual property, and investment The explanation for using marginal analysis to identify the optimum point along a production possibilities curve has also been revised.
Here are the more substantial content changes in Chapter 1:
• The CT about celebrities skipping college has been updated, with Kevin Durant replacing Ryan Seacrest
• The Last Word (LW) on Starbucks has been replaced by a new Last Word titled “Pitfalls to Sound Economic Reasoning. ”
The purpose of this Teaching Guide is to support you in the delivery of your chosen curriculum in either a face-to-face or online classroom format. It also was created to help you address some of the following challenges in higher education:
• Addressing the inability to measure student comprehension prior to major assignments such as a midterm or project.
• Overcoming the inability to tailor your lecture to the topics that students find difficult.
• Increasing student engagement by providing opportunities for them to apply the knowledge gained in the classroom to real-world scenarios.
• Providing students with opportunities for self-reflection outside of classroom activities.
• Increasing students’ critical-thinking and problem-solving skills.
You will learn that we created many different teaching resources you can use either before, during, or after class. Because of the quantity of options, the goal of this implementation guide is to provide an overview of how you might select the many teaching resources at your disposal.
Need help getting started with Connect Economics?
Would you like a one-on-one consultation, please reach out to your McGraw Hill representative and they’ll connect you with our implementation team. Please visit https://mhhe.com/rep to find your rep.
If you prefer self-guided help, please https://www.mheducation.com/highered/support/connect
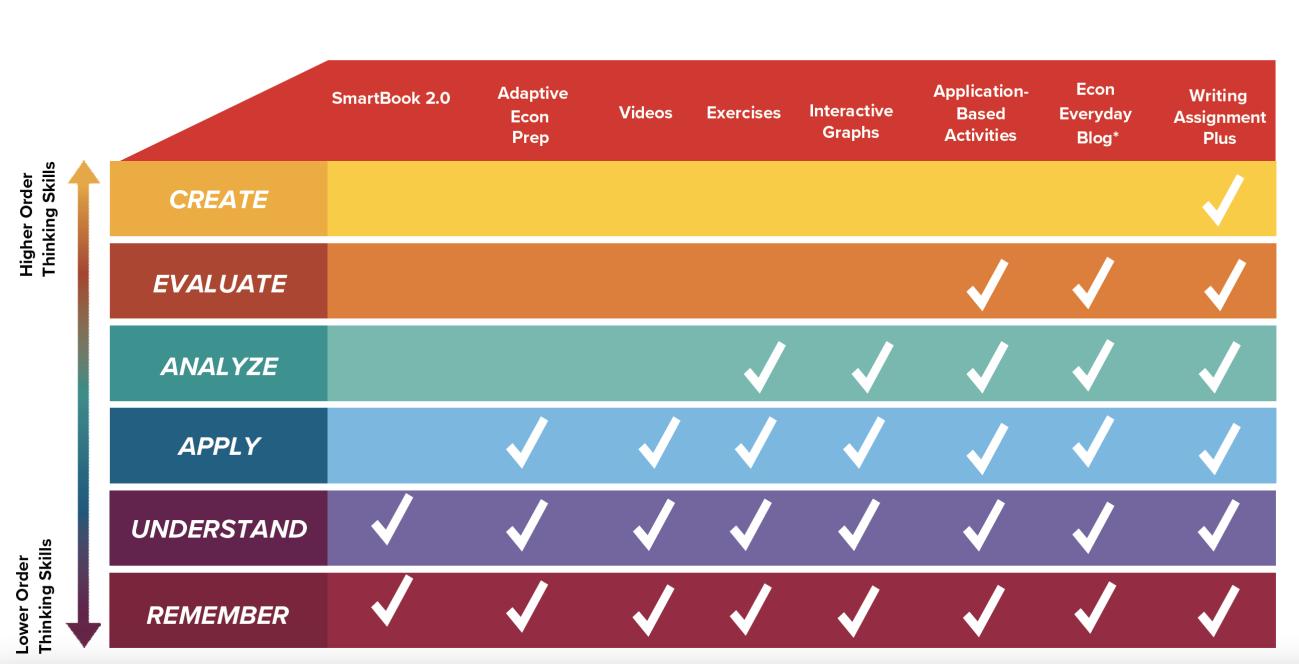
The chart below shows a few of the key assignable economics assets with Connect® aligned with Bloom’s Taxonomy. Take your students higher by assigning a variety of applications, moving them from simple memorization to concept application. Within Connect, we tag assessments accordingly so you can filter your search, assign it, and receive reporting on it.
Generally, a typical class session for any course comprises three “touch points:” before, during, and after class. For a face-to-face course, your class session would normally be the day you lecture to students. For an online course, the class session would be when you recorded the lecture or when the live lecture is streamed on the Web.
Our teaching resources fall into ten categories:
• SmartBook 2.0 SmartBook 2.0 makes study time as productive and efficient as possible. Students move between reading and practice modes to learn the content within the chapter. As they progress, the adaptive engine identifies knowledge gaps and offers up content to reinforce areas of weakness.
Click path in Connect: New Experience > Assignment > Add Assignment > SmartBook 2.0
• Narrated Lectures These videos give students a brief (15 minute) overview of the chapter content via narrated PowerPoint. These videos can be added to the course via zero point assignments
Connect: New Experience > Assignments > Add Assignment > Question Bank > Chapter X > Narrated Lectures
• Connect® Exercises End-of-chapter exercises reinforce chapter content through a variety of question types including questions that make use of the graphing tool. Problems with algorithmic variations are also available.
Click path in Connect: New Experience > Assignments > Add Assignment > Question Bank > Chapter X > Exercises
• Application-Based Exercises (ABAs) New immersive real-life scenarios engage students and put them in the role of everyday economists. Students
practice their economic thinking and problem-solving skills as they apply course concepts and see the implications of their decisions as they go. Each activity is designed as a 15-minute experience, unless students eagerly replay for a better outcome.
Click path in Connect: New Experience > Assignments > Add Assignment > Application-Based Activity
• “Connect the Dots” Videos The “Connect the Dots” video series takes important economic concepts and explains them in an engaging, relatable manner. Patrick Walsh walks students through examples that help contextualize concepts in ways that make them easier to understand and apply. Each includes a related assessment item to test student understanding.
Click path in Connect: New Experience > Assignments > Add Assignment > Question Bank > Course-Wide Content Dropdown Tab > Connect the Dots Videos (2.0, MHE)
• Interactive Graph Assignments These are designed to help students visualize and interpret economic concepts, graphs, and real data. All graphs are accompanied by assignable assessment questions and feedback to guide students through the experience of learning to read and interpret graphs and data.
Click path in Connect: New Experience > Assignments > Add Assignment > Question Bank > Course-Wide Content Dropdown Tab > Interactive Graphs (2.0, MHE)
• Adaptive Econ Prep: Math and Graphing - Help your students remediate prerequisite math skills for every economics concept in your principles course by assigning the new Adaptive math preparedness module specifically designed for each topic. Note that these are designed as supplementary assignments/ additional help with foundational math concepts. Math concepts build on each other so be sure to assign Adaptive Math Prep for supply and demand prior to assigning the one for elasticity for the best results. We suggest assigning zero points/low-stakes assignments, and perhaps making mastery a prerequisite to being able to complete the end-of-chapter homework assignments. You can either assign individual modules to accompany specific chapters or assign the entire tool as a review for students.
Click path in Connect: New Experience > Assignments > Add Assignment > Adaptive Learning Assignment
• Economics and Ethics Discussion Questions Over 60 discussion questions that highlight the challenge of ethical decision making within the economic study of allocating resources. Set-up as multiple-choice questions without a correct answer, just an explanation to help spur discussion. All ethical dilemmas are wrapped around standard economic topics like price discrimination and scalping,
the Edgeworth box and Pareto optimality, interest and usury outsourcing, environmentalism as a normal/luxury good, and more.
Click path in Connect: New Experience > Assignments > Add Assignment > Question Bank > Course-Wide Content Dropdown Tab > Economics and Ethics Discussion Questions (Beta, MHE)
• TUCE Questions Sixty multiple-choice questions designed to help students prepare for the standardized economics tests that target their knowledge of principles-level topics in economics.
Click path in Connect: New Experience > Assignments > Add Assignment > Question Bank > Course-Wide Content Dropdown Tab > TUCE Questions (1.0, MHE)
Connect gives you a wide array of flexibility in making assignments and creating grading policies. You may choose to:
• assign as many assignments as appropriate.
• determine point values for each question/application exercise individually.
• make available multiple attempts per assignment with options of accepting the highest score or averaging all the scores together.
• deduct points for late submissions of assignments (percentage deduction per hour/day/week/so forth) or create hard deadlines.
• show feedback on exercises/questions immediately or at your preference.
• provide for study-attempts to allow for completion of the assignment after the due date without assigning a point value.
Some recommendations include:
• Before selecting the option for one attempt only, select unlimited or multiple attempts on the first few assignments to allow students a chance to learn and navigate the system.
• Provide a low point value for each question because multiple questions are usually assigned for each chapter. A good rule of thumb would be to make “Test Bank Questions” worth 1 point each and “Connect Exercises” like the end-ofchapter Problems worth 5 to 10 points each because these require more time and thought.
• Select feedback to be displayed after the assignment due date to limit students from giving the correct answers to other students while the application exercise is still available.
Wouldn’t it be wonderful if you could transition from simply assigning readings, lecturing, and testing to actually adapting your teaching to student needs? By utilizing the teaching resources outlined below during the three touch points, you can significantly
impact students’ learning and create a learning environment that is more engaging, involving, and rewarding. In other words, you can now tailor your classrooms to pinpoint and address critical challenges, thereby creating the greatest impact and assisting students develop higher-order thinking skills.
You can identify which of the other resources can be used with the Connect asset map. Click path in Connect: New Experience > Dashboard > Instructor Resources (lower right) > Connect Asset Map
The learning goals we have for students determine our assignments before, during and after class. For example, you may want to focus on mastering content, applying content, or using content to solve problems. Alternatively, you may want to achieve all three goals.
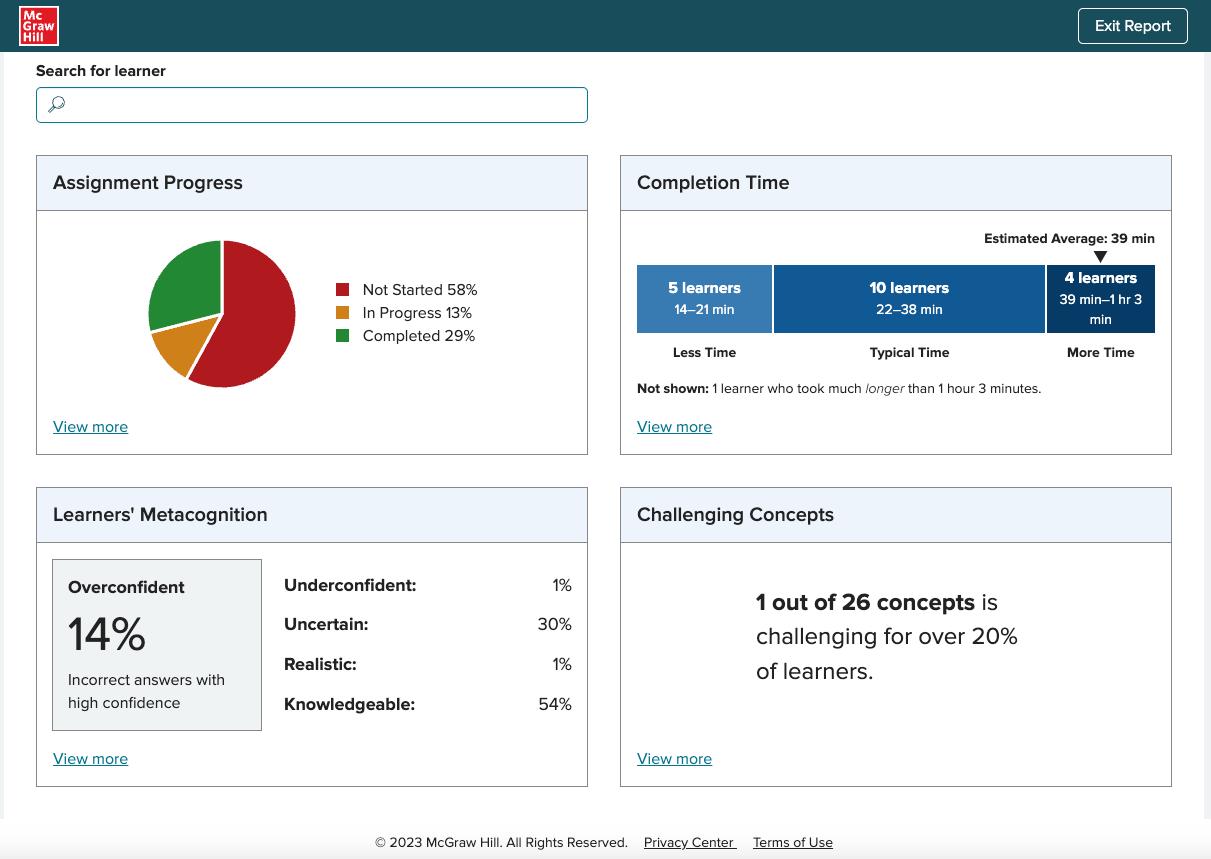
A reading assignment typically a chapter from the product in use is a student’s initial exposure to course content. Requiring students to complete a SmartBook 2.0 module either prior to class or an online lecture allows you to gauge their comprehension of the material. Having a better sense before class of which concepts your students are “getting” and which ones they are not, allows you to more effectively and efficiently plan your time with them during class. To ascertain student competency, use the reporting function of SmartBook 2.0, where you can view general results of their performance. Below is a screenshot of a general results report. Thissample report shows student Assignment Progress, Completion Time, Learners’ Metacognition and Challenging Concepts with the opportunity for the instructor to dig into the most challenging concepts/ learning objectives.
Click path in Connect: New Experience > Performance > Assignment results > select SmartBook assignment by assignment name > View report > in right column click on score
Additionally, Connect® exercises, such as Problems, Review Questions, Discussion Questions, and Test Banks offer students a second exposure to important sections of the chapter after their completion of a SmartBook 2.0 assignment.
The Teaching Guide offers a host of additional materials and experiential activities you can use to bring chapter content to life.
This chapter is supported by Guided Peer Instruction questions. Please refer to the Instructor Resources in Connect to find the “Guided Peer Instructions Instructor’s Manual” and “Guided Peer Instructions PPTs” with questions and solutions.
Click path in Connect: New Experience > Dashboard > Instructor Resources (lower right) > Guided Peer Instructions
When using GPI, students do some basic preparation as homework reading and tackling the easier problems at home and then come to class to work out more difficult problems while you’re there to guide them in their analysis. What we want them to do in
class is to think beyond the basics in the textbook or in the lecture and learn to think critically and apply economic concepts.
In GPI:
• In-class questions are meant to be harder than the basic homework questions
• We expect most students will get the questions wrong individually (30%–50% correct)
• We expect most groups will get the questions right (75%–85% correct)
Example question from biology:
Think of a large oak tree. Where does most of the mass of the tree come from?
A. The soil
B. The water
C. The atmosphere
D. Sunlight
The answer is not at all obvious. But if you think long enough, you will perhaps realize that the correct answer is c, the atmosphere. That’s because when the tree engages in photosynthesis, it uses sunlight to break up CO2 molecules from the atmosphere. The carbon from those CO2 molecules ends up forming the large majority of the mass of the tree.
However, the answer isn’t necessarily important. From the pedagogical point of view, the point of this question is not to assess student understanding but to create it. It has a non-obvious answer that students can’t get from just memorizing the book. The answer requires students to build on what they know and apply it. It makes them stretch from rote memorization to application and insight.
If your goal is content mastery and you are utilizing SmartBook 2.0, you can plan class activities and lecture based on results from the general results report and the metacognitive skills report. This allows for a more tailored class period that enhances student engagement and more opportunities to resolve gaps in knowledge.
If your goal is to jointly engage your students while applying content from the text, you can select a self-assessment follow-up activity (all follow-up activities are found in the Teaching Guide). These assets are especially useful if you are “flipping” your classroom, wherein the class session is used for application and analysis of key concepts rather than lecture.
McConnell, Brue, Flynn, Microeconomics, 23e: Chapter 1:
After the face-to-face class session, or online lecture, you can assign Connect® exercises as homework to further reinforce the material covered in the textbook and lecture. You may also want to assign a Connect the Dots video if you notice that students are struggling with a particular topic, even after class. To further gauge student comprehension, you can also assign a quiz or exam. The test banks in Connect® focus more on defining and explaining material, and the test banks focus more on application and analysis.
Finally, if you are looking to have students think critically to solve real-world problems, then you may want to utilize an application-based activity after class. Application-based activities are mini-simulations that allow students to make decisions and see their impact immediately. There are both theory-based questions that have right and wrong answers, and there are also branching questions that allow students to make ideal, subideal, and incorrect decisions based on the theory they’ve learned. A student’s particular path in the activity will depend on the decisions made on the branching questions. Application based activities should be utilized after a student has had at least one pass at the chapter content as they do not introduce new material. Rather, they encourage students to apply, analyze, and evaluate material they already understand.
1.1 Define economics and explain the economic perspective.
1.2 Describe the role of economic theory in economics.
1.3 Distinguish microeconomics from macroeconomics and positive economics from normative economics.
1.4 Explain the individual’s economizing problem and how trade-offs, opportunity costs, and attainable combinations can be illustrated with budget lines.
1.5 List the categories of scarce resources and delineate the nature of society’s economizing problem.
1.6 Apply production possibilities analysis, increasing opportunity costs, and economic growth.
1.7 Explain how economic growth and international trade increase consumption possibilities.
1.8 (Appendix) Understand graphs, curves, and slopes as they relate to economics.
This chapter begins with a discussion of the meaning and importance of economics. In this first chapter, however, we will not plunge into problems and issues; instead we consider some important preliminaries. We first look at the economic perspective how economists think about problems. Next, we examine the specific methods economists use to examine economic behavior and the economy, including distinguishing between macroeconomics and microeconomics. We then look at the economizing problem from both an individual and societal perspective. For the individual we develop the budget line, for society the production possibilities model. In our discussion of production possibilities, the concepts of opportunity costs and increasing opportunity costs, unemployment, growth, and present versus future possibilities are all demonstrated.
The appendix to Chapter 1 provides an important introduction to graphical analysis. While this will be review material for most students, for some this may be new. Instructors are strongly urged to confirm that their students understand this section before proceeding. The software supplement can provide effective remedial help for those students who are not familiar with graphical analysis, or just need a refresher.
1. This chapter and related classroom activities will set the tone for the rest of the course. The methods used in the initial class meetings set the expectations and attitudes of the students. Making dramatic changes later can be confusing and the outcome less successful than desired. Please refer to the preface for detailed suggestions. If you plan to make current events an integral part of the class, consider offering educational subscriptions to The Wall Street Journal, or one of the weekly news or business publications such as The Economist
2. On the level of personal decision-making, students might be asked to list all of the economic choices they had to make that day or that week. This impresses upon them that, as Alfred Marshall said in the 1890s, “economics is the study of man in the ordinary business of life.” To illustrate the rational basis of their decisions, students could analyze one or two of these choices in terms of the alternatives they gave up. What other choices did they have? What criteria were used to judge the alternatives? A discussion of how rational our decisions are might also follow, providing an opportunity to introduce problems such as imperfect information and short- versus long-term objectives.
3. There are many dimensions to the topic of “utility” that introductory students will benefit from contemplating. With these many dimensions comes the danger in taking students too deep too quickly. It is useful for students to understand that utility may be obtained both through material and nonmaterial means. Accordingly, it may be difficult to express how much one is willing to pay (or otherwise sacrifice) to obtain utility through a given activity.
When discussing rational behavior, and seemingly irrational decisions, is may be useful to point out that for some people their utility is interdependent. You can have a bit of fun telling students that economists define love as “strongly interdependent utility functions.” The main point, of course, is that there are many situations where people obtain utility through seeing others having material and nonmaterial wants satisfied. Likewise, some gain utility from watching others suffer, even if it means that they are themselves worse off in material terms.
If a question arises about the measurement of utility, the distinction between cardinal and ordinal utility can be made, but there is little to be gained from an elaborate discussion. Students may find it interesting that Jeremy Bentham (whom they meet in Origin of the Idea 1.2) envisioned some sort of “util-o-meter,” a contraption that one might strap to the head to record brain waves in an attempt to measure utility from an activity. Even suggesting that one might use “utils” as a measure of satisfaction often amuses students and helps them better recall this topic.
4. As the text suggests, it may be useful to discuss several noneconomic examples to illustrate the importance of models or simplification for example, explaining that a road map is a model or simplification of the real world. The amount of detail on any road map would be determined by the needs of the traveler, i.e., “I need to travel between Chicago and Denver as quickly as possible,” versus, “I would like to visit some historical museums as I am traveling through Nebraska.” Neither road map would have the details of the real world. Devoting some time and effort to this point can help students see the importance of using economic models to represent the real world. You may wish to use the example below.
“What do you consider the largest map that would be really useful?”
“About six inches to the mile.”
“About six inches!” exclaimed Mein Herr. “We very soon got six yards to the mile. And then came the grandest idea of all! We actually made a map of the country on a scale of a mile to a mile!”
“Have you used it much?” I enquired.
“It has never been spread out yet,” said Mein Herr. “The farmers objected. They said it would cover the whole country and shut out the sunlight!”
Lewis Carroll Silvie and Bruno, 1889
In many ways, good economic models are like good maps. Both are abstractions that purposely leave out irrelevant facts and circumstances. Both are useful and practical because they simplify complex realities.
Maps not only help us understand geographical relationships but also serve as useful tools. A road map of the United States, for instance, helps us understand where Connecticut is located relative to California. It also is highly practical in helping us drive between Indiana and Idaho.
In much the same way, economic models are helpful and useful. For example, a model indicating how consumers respond to a change in a product’s price helps us understand a significant facet of human behavior. That model also is highly practical; among other things, it identifies the primary way a business can reduce an overstock of unsold goods.
The appropriate map or appropriate economic model is the simplest one that accomplishes a specific goal. Although we may need a highly detailed street map of Cleveland to find a specific residence there, we need only a general road map to drive between Cleveland and Columbus.
Similarly, we need a highly complex, detailed economic model to predict the economic effects of a general reduction of U.S. tariffs (taxes on imported goods) on the relative outputs of various U.S. industries. In contrast, a much simpler model will suffice to show how a reduced U.S. tariff on imported beef will affect the total consumption of beef in the United States.
You will discover many economic models in your study of economics. The trick is to use the right model for the right purpose. Think of these models as highly useful, highly practical “maps,” which help us better understand elements of the highly complex economy.
5. Most students are all too familiar with the problem of scarcity. Although income and time are not resources in the way in which we define resources in economics, these are what are most scarce to students. Explain how making a budget is dealing with the problem of their limited financial resources and their virtually unlimited wants. Other examples can be how businesses choose between two products when allocating their limited resources and choose between two resources when allocating their limited revenues. Further discussion can bring in examples of allocating federal and/or state tax revenues, especially when state revenues compete with funding the state university.
6. To personalize the problem of opportunity cost, ask what else they could be doing during a specific economics class; what are their foregone alternatives? Why might it be more expensive for older students to attend the class than younger ones? Encourage students to find examples of opportunity cost in newspaper articles and magazines. Choice is a necessary part of life; every action has its costs and benefits. Identifying and quantifying these trade-offs is at the heart of economic analysis.
You may also want to use the following illustration to facilitate student understanding of opportunity cost.
The concept of opportunity cost can be illustrated through the eyes of a small child. Suppose that a young girl named Amber receives a $30 gift certificate from her grandparents to be used at Toys4Me. The grandparents take the girl to the store, where she spots several toys she would like—all priced above $30. After gaining a sense of what is affordable, Amber narrows her focus to small stuffed animals ($10 each) and picture books ($5 each).
The grandparents tell Amber that she can buy three stuffed animals, six books, or some limited combinations of the two items. She initially settles on one stuffed animal at $10 and four picture books at $5 each. The grandparents assure her that this selection works; it will exactly use up the $30 certificate. Amber takes the goods to the checkout counter.
But while waiting to pay, she changes her mind. She decides she wants another stuffed animal because they are so cute. What should she do? The grandparents tell her to go pick out a second stuffed animal and then return two of her four books to the shelf. She
makes the exchange, ending up with two stuffed animals at $10 each and two picture books at $5 each.
From an adult’s perspective, the second stuffed animal cost $10. But in the eyes of the child, it cost two picture books. To get the second stuffed animal, Amber had to give up two books. That sacrifice was the opportunity cost of her last-minute decision. Amber’s way of looking at cost is one of the fundamental ideas in economics.
7. Current news articles can serve many purposes in a principles class. Most instructors assign a high priority to helping students apply the general principles of economics to the specific problems and decisions they make. Short essays, oral reports, class discussion and longer-term projects are all examples of how current news could be incorporated into the course. A term project focused on current issues such as health care, welfare reform, environmental problems, defense spending, or education can help students develop an appreciation of the problem of scarcity and the trade-offs that need to be considered when formulating public policy.
8. The problems of underdeveloped countries could also be used to illustrate the seriousness of choosing between capital goods and consumer goods. Focusing a project on the problems of a single developing country can be interesting. It would allow students to make many comparisons including the impact of differing economic systems, degree of government regulation, environmental quality standards, differences in resource availability, climate, educational levels, and the choice between consumer and capital goods.
1. Instructors cannot take for granted students’ background knowledge of economics. Students generally have no idea about the magnitude of common economic measurements and, therefore, their reading of the news may be colored by this lack of knowledge. One teaching tip that has worked for others is to give students a pretest during the first week of class, in which simple questions are asked about the U.S. economy. For example, questions can be asked about the size of population and labor force, unemployment and inflation rates, GDP, federal budget, deficits and debt. You will find wildly different answers to these questions with most far away from “ball park” figures. This exercise accomplishes two things. First, it lets students know that they have a lot to learn about “everyday” news items. Second, the correct answers can give them some early perspective on news events as they relate to the course. As the course progresses, don’t forget to reinforce these facts by reminding students of them.
2. The specialized definitions in economics sometimes frustrate students, especially when they are familiar with a term in a different context. You may wish to use the following example to help students appreciate that specialized definitions are common in our everyday lives.
“Then you should say what you mean,” the March Hare went on.
“I do,” Alice hastily replied; “at least I mean what I say that’s the same thing you know.”
“Not the same thing a bit!” said the Hatter.
“Why, you might just as well say that ‘I see what I eat’ is the same thing as ‘I eat what I see!’”
Lewis Carroll, Alice in Wonderland,
1865
In an indirect way, the specialized terms used in games such as soccer, baseball, bowling, and so forth provide insights on the study of economics. Consider the game of pool, for example. The following terms are used in pool but have slightly or totally different meanings in everyday language: “pool,” “cue,” “ kiss,” “bank,” “bridge,” “combination,” “break,” “lag,” “run,” “rack,” “scratch,” “chalk,” and “rail.” Economics, too, uses terms that have different meanings than in everyday usage. In economics “labor” usually means all productive effort, not simply blue-collar workers; “capital” means human-made productive resources, not money used to buy resources. Also, “investment” means spending to pay for production and accumulation of capital goods,
not purchases of stocks and bonds; “public good” means goods that have special characteristics, not the good of society; and so forth.
Learning to communicate in the game of pool (or any other game) requires learning the meaning of specialized terms. It’s the same with economics! It is not enough to “mean what you say,” in economics. To communicate effectively (and to do well on exams!) you must “say what you mean,” using the precise terms of the discipline.
3. Principles of economics students are often frustrated by the apparent lack of precision and definitive answers in the discipline. Economists establish a framework of rational decision-making based on maximizing utility, only to have that utility be immeasurable, or decision outcomes to be less than optimal because of imperfect information or seemingly irrational behavior. It is important to help students understand that, among other things, they are gaining more of an analytical toolkit than a set of hard and fast rules or immutable natural laws. To help students appreciate this, it is useful to appeal back to the road map illustration. Using a road map, one can find the shortest (and presumably fastest) route from one point to another. Even if someone has driven a route many times, there are factors such as traffic, weather, and road construction that may cause the otherwise quickest route to be less than ideal for that day’s travel. Maps, like economic models, are often effective at telling people what they need to know. They are, however, limited in their effectiveness by factors beyond view.
4. In the discussion of marginal analysis, students often bring up examples that include “sunk” costs. For example, if you ask students why they came to class, many will answer that they paid tuition and imply that they would somehow lose that money if they didn’t attend. If probed further, however, students will acknowledge that the college is unlikely to refund their money for any missed classes. That doesn’t mean there wouldn’t be future expenditures (paying tuition later to retake a failed class). It also doesn’t mean that there aren’t some psychological benefits to “getting what you paid for,” but many students will erroneously identify that tuition payment as a marginal cost of attending a given day of class. While your intention may be to discuss sunk costs in a later chapter, student questions and discussion may require you to be prepared to introduce the concept earlier.
5. The concept of “full employment” is potentially problematic, particularly for those courses that will eventually cover macroeconomics. The use of the term in this chapter refers to the use of all available resources, human and non-human. In macroeconomics the concept is used to describe general conditions in labor markets and the economy as a whole, but is usually focused on the economy’s use of its human resources. Even then it is recognized that under conditions of full employment there is unemployed labor. There is also the potential for confusion as the concept applies to the land resource. Fully employed deposits of coal or petroleum do not imply exhaustion of those resources. It is more a question of whether there is an adequate amount of these nonhuman resources available to sustain full employment in labor markets. A full discussion of this is probably not appropriate with students at this point, but you may find it useful to emphasize here that the concept is most often applied to the human resources. Then,
when the topic arises again in Chapter 26 (for those covering macroeconomics), students will be less likely to feel that you are changing definitions on them.
6. The production possibilities curve simplifies many concepts for students who don’t have “graph anxiety.” However, for those who are uncomfortable with graphs, this model may confuse rather than simplify. Computerized tutorials will be especially helpful for these students.
7. Some topics may elicit emotional and/or politically charged responses from students. While one must be sensitive, especially regarding those directly and negatively impacted by those events, it presents an opportunity to demonstrate how economists attempt to detach their emotional and political biases to achieve a more objective economic analysis. It is also an opportunity to point out that the usual role of the economist is to tell us what choices are available, not what choices should be made.
8. The instructor could treat the appendix on graphical analysis as a supplement for those students who have weak backgrounds in reading or constructing simple graphs. There is often a wide disparity among student abilities here. Instructors may wish to have a remedial session and special assignments for students deficient in graphing skills. Comparing graphs to maps seems to help students who have “graph anxiety.” Instructors may also administer a math assessment on the basic math skills necessary to succeed in the course early in the course term.
McConnell, Brue, Flynn, Microeconomics, 23e: Chapter 1: Limits, Alternatives, and Choices
As opposed to providing a traditional outline, the author team would like to direct instructors to the McConnell 23e PowerPoints to serve as chapter outlines. The chapter PowerPoints offer the most organized outline of the chapter and can be downloaded from the Instructor’s Resource page in Connect.
Click path in Connect: New Experience > Dashboard > Instructor Resources (lower right) > PowerPoint Presentation
The following questions are unique to this Teaching Guide and cannot be found in Connect. They are included for instructors who want to provide in-class quizzes or otherwise have some chapter-aligned content available outside of Connect. Many additional auto-graded problems can be found in Connect and can be sorted by difficulty, learning objective, and other criteria.
1. Economics is a social science concerned with:
A. the best use of scarce resources to achieve the maximum satisfaction of economic wants.
B. increasing the level of productive resources so there is a minimum level of income.
C. increasing the level of productive resources so there is maximum output in society.
D. the best use of scarce resources paid for at the minimum level of cost to consumers and businesses.
Answer: A
2. A person should consume more of something when its marginal:
A. benefit exceeds its marginal cost.
B. cost exceeds its marginal benefit.
C. cost equals its marginal benefit.
D. benefit is still positive.
Answer: A
3. The process of developing hypotheses, testing them against facts, and using the results to construct theories is called:
A. Opportunity cost calculation
B. Microeconomics
C. Marginal analysis
D. The scientific method
Answer: D
4. Which is an illustration of a microeconomic question?
A. What is the current national rate of unemployment?
B. Is the economy experiencing a decline in the rate of inflation?
C. Will a new type of television set increase the number of buyers?
D. Is the production of goods and services in the economy greater this year than last year?
Answer: C
5. A schedule or curve that shows the various combinations of two products a consumer can purchase with a specific amount of money income is:
A. A trade-off
B. A budget line
C. A tangent point
D. An optimal output
Answer: B
6. Which of the following is real capital?
A. a pair of stockings
B. a construction crane
C. a savings account
D. a share of IBM stock
Answer: B
7. A point inside a production possibilities curve best illustrates:
A. unemployment.
B. the efficient use of resources.
C. the use of best-available technology.
D. unlimited wants.
Answer: A
8. A normative statement is one that:
A. is based on the law of averages.
B. applies only to microeconomics.
C. applies only to macroeconomics.
D. is based on value judgments.
Answer: D
9. The problems of aggregate inflation and unemployment are:
A. major topics of macroeconomics.
B. not relevant to the U.S. economy.
C. major topics of microeconomics.
D. peculiar to command economies.
Answer: A
McConnell, Brue, Flynn, Microeconomics, 23e: Chapter 1: Limits, Alternatives, and Choices
10. On a production possibilities curve, the single optimal or best combination of output for any society:
A. Is at a point near the top of the curve
B. Is at the precise midpoint of the curve
C. Is at a point near the bottom of the curve
D. Depends upon the preferences of society
Answer: D