
ISBN: 9781265680978
Corret Answers are located at the end of each chapter.
TRUE/FALSE - Write 'T' if the statement is true and 'F' if the statement is false.
1) A business process is a coordinated, standardized set of activities conducted by both people and equipment to accomplish a specific business task.
⊚ true ⊚ false
2) A business analyst is a data scientist who collects data to help an organization make effective business decisions.
⊚ true
false
3) Data is defined as information organized in a meaningful way to be useful to the user.
⊚ true
⊚ false
4) Information is defined as being data organized in a meaningful way to be useful to the user in a given context.
⊚ true
⊚ false
5) A data scientist is a liaison between decision makers and business analysts.
⊚ true
⊚ false
6) Operations analytics uses business analytics to measure and improve the efficiency and effectiveness of the company’s operations.
⊚ true ⊚ false
7) The third step in the SOAR analytics model is to Access the data.
⊚ true
⊚ false
8) Exploratory data visualization is used to communicate results of the analysis to decision makers and other stakeholders.
⊚ true
⊚ false
CHECK ALL THE APPLY. Choose all options that best completes the statement or answers the question.
9) A visualization may be used to help with which component of the SOAR model?
A) Specify the Question
B) Obtain the Data
C) Analyze the Data
D) Report the Results
MULTIPLE CHOICE - Choose the one alternative that best completes the statement or answers the question.
10) The difficulty a person faces in understanding a problem and making a decision as a consequence of having too much data.
A) Data Complexity
B) Data Overload
C) Analytics Mindset
D) Data Challenges
11) Which step of the SOAR model would usually involve computing an average?
A) Specify the Question
B) Obtain the Data
C) Analyze the Data
D) Report the Results
12) Which step of the SOAR model most appropriately addresses the skill mentioned by EY’s analytics mindset of “extract, transform and load relevant data”?
A) Specify the Question
B) Obtain the Data
C) Analyze the Data
D) Report the Results
13) Use of a dashboard to track relevant outcomes would be consistent with which component of the SOAR model?
A) Specify the Question
B) Obtain the Data
C) Analyze the Data
D) Report the Results
14) What type of question(s) works to explain “Why did net income increase even though sales did not?”
A) What happened? What is happening?
B) Why did it happen? What are the root causes of past results?
C) Will it happen in the future? What is the probability something will happen? Is it forecastable?
D) What should we do based on what we expect will happen? How do we optimize our performance based on potential constraints?
15) What type of question is used in finding the level of sales needed to break even (exactly zero profit)?
A) What happened? What is happening?
B) Why did it happen? What are the root causes of past results?
C) Will it happen in the future? What is the probability something will happen? Is it forecastable?
D) What should we do based on what we expect will happen? How do we optimize our performance based on potential constraints?
16) What type of question is “How long will it take for Christmas products to arrive at our stores if we source the products from Mexico rather than Indonesia?”
A) What happened? What is happening?
B) Why did it happen? What are the root causes of past results?
C) Will it happen in the future? What is the probability something will happen? Is it forecastable?
D) What should we do based on what we expect will happen? How do we optimize our performance based on potential constraints?
17) What type of question is “Should we source our products from Mexico rather than Indonesia?”
A) What happened? What is happening?
B) Why did it happen? What are the root causes of past results?
C) Will it happen in the future? What is the probability something will happen? Is it forecastable?
D) What should we do based on what we expect will happen? How do we optimize our performance based on potential constraints?
18) What type of question is predicting whether borrowers will be able to repay their loans?
A) What happened? What is happening?
B) Why did it happen? What are the root causes of past results?
C) Will it happen in the future? What is the probability something will happen? Is it forecastable?
D) What should we do based on what we expect will happen? How do we optimize our performance based on potential constraints?
19) What type of question is used in determining how to maximize revenues if there is a trade war with another country?
A) What happened? What is happening?
B) Why did it happen? What are the root causes of past results?
C) Will it happen in the future? What is the probability something will happen? Is it forecastable?
D) What should we do based on what we expect will happen? How do we optimize our performance based on potential constraints?
20) What term is used to refer to the accuracy, validity and consistency of data used and stored over time?
A) Data veracity
B) Data integrity
C) Data quality
D) Truthful data
21) Dashboards showing current company performance are usually associated with what type of updating?
A) Dynamic
B) Static
C) Opportunist
D) Monthly
22) How much data is there expected to be in existence by the end of 2025?
A) 175 terabytes
B) 175 zettabytes
C) 175 exabytes
D) 175 yottabytes
23) Which type of graphical summary is used by a company to track various measures?
A) Trackboard
B) Graphical interface
C) Dashboard
D) Web page
24) Which type of analyst addresses questions regarding sales forecasts for each product?
A) Operations analyst
B) Marketing analyst
C) Accounting analyst
D) Financial analyst
25) Which type of analyst would help plan the production of each product?
A) Financial analyst
B) Operations analyst
C) Accounting analyst
D) Marketing analyst
26) Which of the following is the third step of the SOAR analytics model?
A) Access the Data
B) Acquire the Data
C) Analyze the Data
D) Address the Question
27) What term refers to all the items, events and interactions that determine a company’s financial health?
A) Net Income
B) Business Value
C) Stock Price
D) Market Value
28) What term refers to the willingness and ability to specify business questions, extract high quality data, analyze the data and report the results?
A) Analytics mindset
B) Analytics skills
C) Statistical skills
D) Business mindset
29) Which common visualization type would be used to compare values?
A) Pie chart
B) Bar chart
C) Line Graph
D) Scatterplot
30) The best visualization type to show the relative proportion of Tesla’s domestic sales to China, to Europe and to the United States would be which of the following?
A) Bar chart
B) Pie chart
C) Line Graph
D) Scatterplot
31) The best visualization type to show the trend in sales over the past five years at Apple would be which of the following?
A) Bar chart
B) Line Graph
C) Histogram
D) Scatterplot
32) Which common visualization type would be used to evaluate the composition of values?
A) Pie chart
B) Bar chart
C) Line Graph
D) Scatterplot
33) A line graph would be used for which visualization purpose?
A) Comparison of values
B) Distribution of values
C) Trends of values over time
D) Relationships between values
34) A scatterplot would be used for which visualization purpose?
A) Comparison of values
B) Distribution of values
C) Relationships between values
D) Composition of values
35) A full year’s worth of Instagram posts and Twitter tweets before filtering or extraction would be considered to be which of the following?
A) Evidence
B) Knowledge
C) Information
D) Data
36) Which type of value chain is composed of the events and processes going all the way from the collection of data to the compilation of information to the ultimate business decision?
A) Data value chain
B) Knowledge value chain
C) Decision value chain
D) Information value chain
37) A specialist who knows how to work with, manipulate, and statistically test data is a:
A) data scientist.
B) data analyst.
C) data acquirer.
D) decision maker.
38) Data ethics should be considered as part of which step of the SOAR model?
A) Specify the Question
B) Analyze the Data
C) Obtain the Data
D) Report the Results
39) Which analytics type explicitly uses artificial intelligence?
A) Descriptive analytics
B) Diagnostic analytics
C) Adaptive or autonomous analytics
D) Predictive analytics
40) Which type of visualization is a graphical representation that is useful for uncovering patterns and useful insights in the data, generally as part of descriptive or diagnostic analytics?
A) Explanatory
B) Descriptive
C) Predictive
D) Exploratory
41) Which type of visualization is used in communicating the findings of the analysis to interested stakeholders?
A) Exploratory
B) Diagnostic
C) Prescriptive
D) Explanatory
42) Which type of analyst would monitor the investments made in company assets and their expected risk and return?
A) Operations analyst
B) Financial analyst
C) Accounting analyst
D) Marketing analyst
43) Suppose a company has access to high quality data (not biased), but the data is five years old. Which quality of information might it be lacking?
A) Reliability
B) Relevance
C) Clean data (not missing data)
D) Verifiable data
44) Based on the final spreadsheet in Lab 1.1 Excel, Assessing Profitability of a Mowing Business, what is the reason for the difference between Scenario 1 and Scenario 2?
B) The
C) The
D)
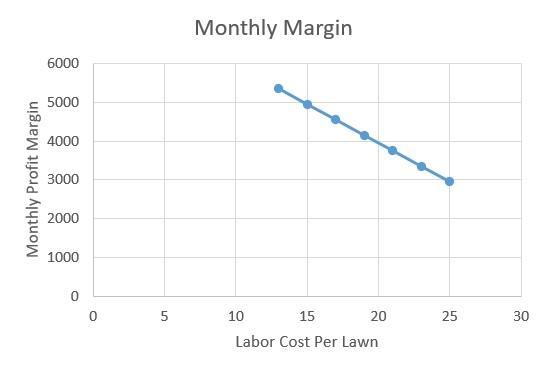
45) Based on the scatterplot in Lab 1.1 Excel, Assessing Profitability of a Mowing Business, if the labor cost per lawn is $25, what is the expected monthly profit margin?
A) $3,000
B) $5,300
C) $3,400
D) $4,500
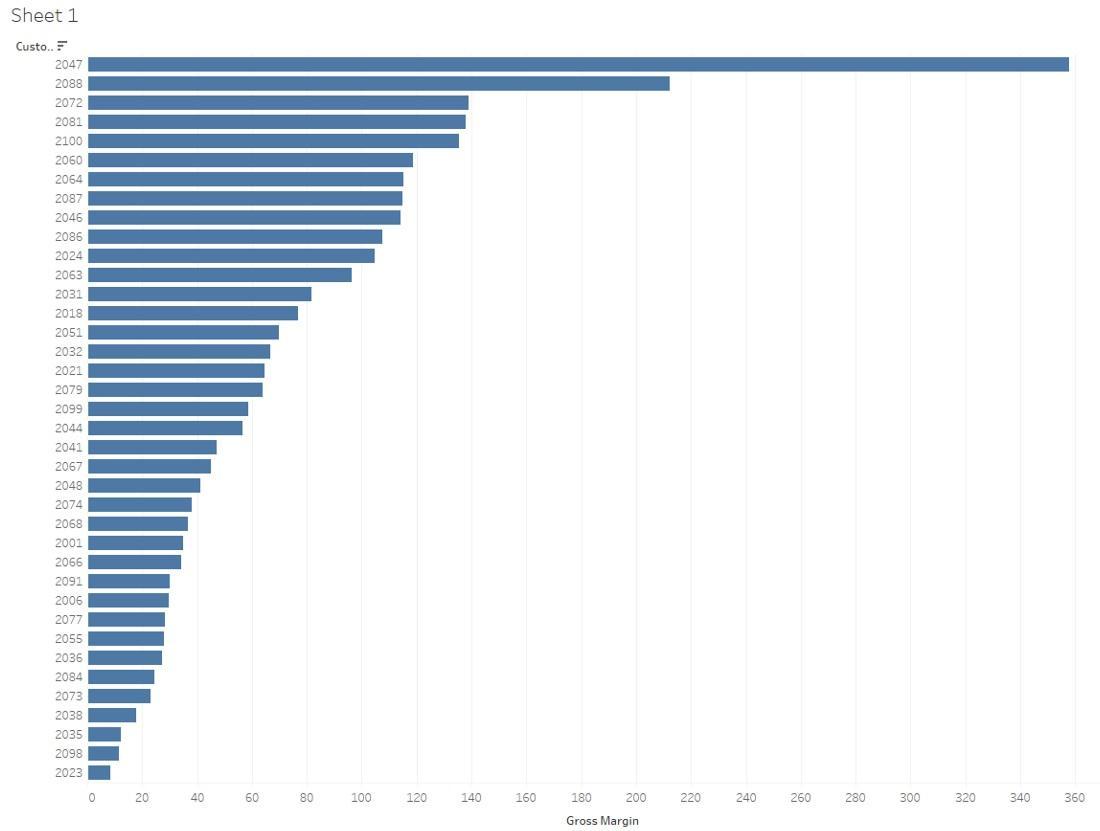
47) Based on this visualization in Lab 1.2 Tableau, Assessing Customer Profitability, which of the following customers are the most profitable?
A) Customer 2072
B) Customer 2081
C) Customer 2079
D) Customer 2074
48) Based on this chart in Lab 1.2 Power BI, Assessing Customer Profitability, which of the
customers are the most profitable?
49) Based on this pivot table in Lab 1.3 Excel, Assessing Product (SKU) Profitability, which product number is the most profitable per dollar of sales?
Chico fruit
Miracle fruit
Longan
Lime
Cucumber
FRT-KII Kiwifruit
Jambul
Jackfruit
Jabuticaba
Guava
FRT-GRI GrapeRaisin
A) FRT-GRI
B) FRT-AVD
C) FRT-PIL
D) FRT-JAU
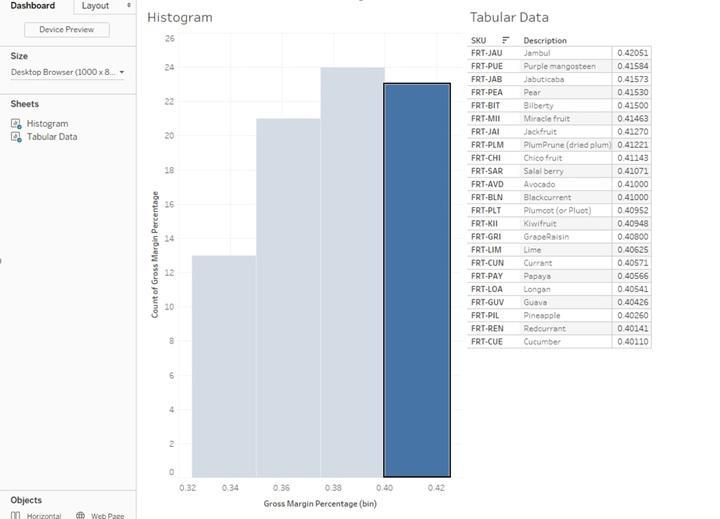
50) Based on the histogram in Lab 1.3 Tableau, Assessing Product (SKU) Profitability, how many products are in the lowest bin?
A) 13
B) 21
C) 24
D) 23
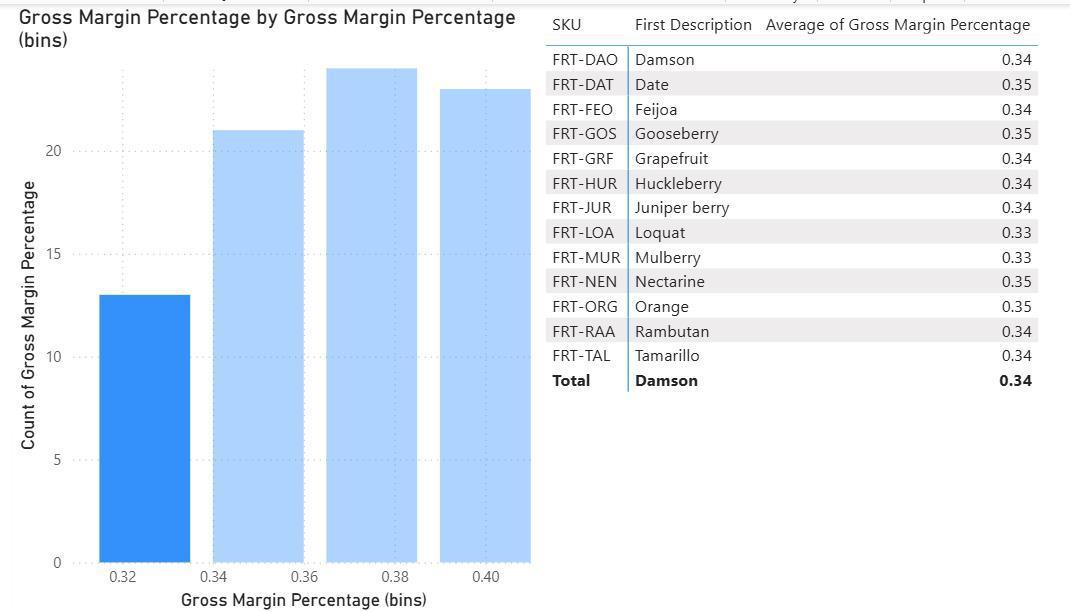
51) Based on the visualization in Lab 1.3 Power BI, Assessing Product (SKU) Profitability, what is the gross margin percentage of FRT-DAT in the lowest bin?
A) 0.34
B) 0.35
C) 0.36
D) 0.37
52) Which of the following is not an example of a GenAI product?
A) Copilot
B) ChatGPT
C) Unicorn
D) Gemini
53) When working with GenAI, the skilled analyst must understand what to generate the desired results?
A) Questions
B) Creating statements
C) Prompt engineering
D) Summarizing explanations
54) Based on Lab 1.4 Excel Subtotals by Date, Invoice and Customers using Excel Subtotal Command and the Exhibit below, is this subtotal summarizing by date, invoice, or customer?
55) Based on Lab 1.5 Excel Subtotals by Date, Invoice and Customers using Pivot Tables and the Exhibit below, the pivot table summarizes sales by date. What would need to change to summarize sales by invoice #?
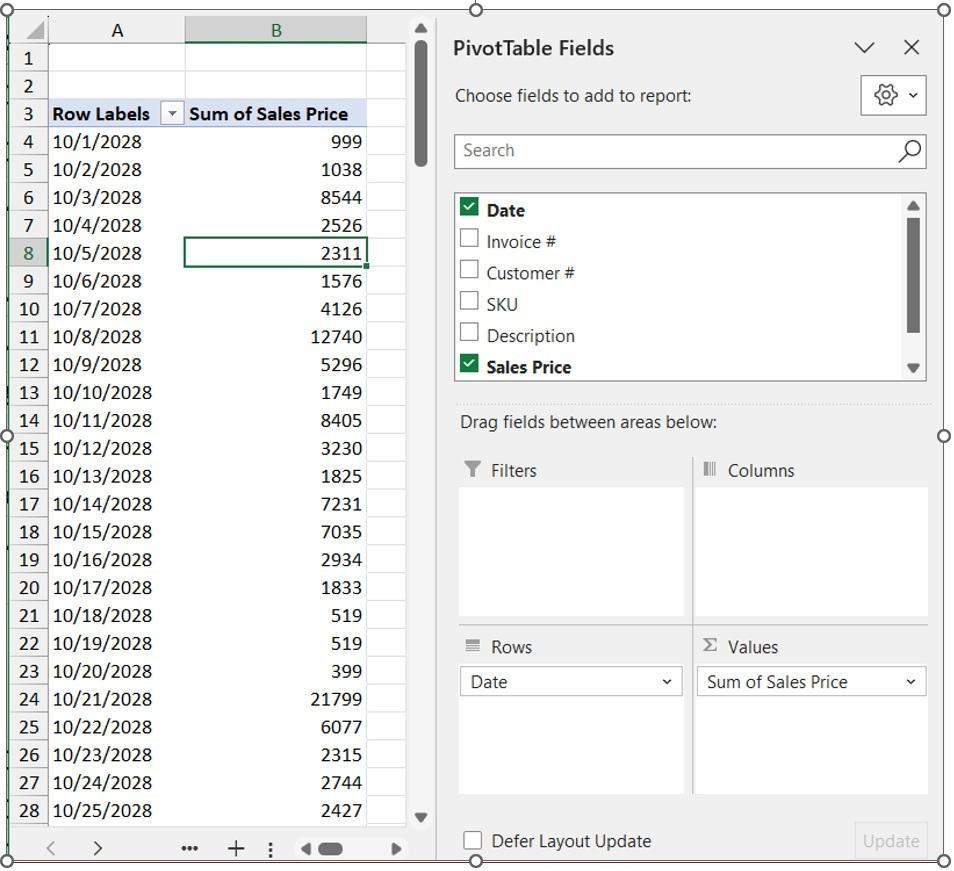
A) Replace Date with Invoice # in the Rows
B) Replace Sum of Sales Price with Sales Price in the ∑Values area
C) Replace Sum of Sales Price with Invoice # in the ∑Values area
D) Replace Date with Invoice # in the Rows and Sum of Sales Price with Sales Price in the ∑Values area
ESSAY. Write your answer in the space provided or on a separate sheet of paper.
56) Why are business analysts needed, and what do they do?
57) What is the trade-off between reliable data (that reports the truth with minimal errors) and relevant data (that most closely addresses the question at hand)? When would you choose one over the other?
58) Walk through the steps of the SOAR model to address the question of predicting the needed level of production of iPhone sales for its next major model. What is an example of each step of the SOAR model?
59) Should a company be concerned with whether the data it uses to answer its questions violates customer privacy?
60) Explain the difference between exploratory data visualizations and explanatory data visualizations. When would each be used?
61) What does it mean that the SOAR analytics model is recursive? Why is that?
Answer Key
Test name: Chapter 01
B
C
B
D
B
D
D 17) D 18) C 19) D 20) B 21) A 22) B 23) C 24) B
B
C
B
A
B
B
B
A
C
C
D
D
A
38) C
39) C
40) D
41) D
42) B
43) B
44) C
45) A
46) C
47) A
48) A
49) D
50) A
51) B
52) C
53) C
54) C
55) A
56) Essay
57) Essay
58) Essay
59) Essay
60) Essay
61) Essay