Solutions Manual for Foundations of Investments-An Introduction 2nd
Edition by Adair, Nofsinger
ISBN: 9798214056944

ISBN: 9798214056944
1. Real vs. Financial Assets Compare and contrast real assets with financial assets. (LO 1-1)
Real assets are assets that either contribute to production or which create income or wealth. Most real assets have a physical existence, with the most common examples being real estate and land, machinery, precious metals, and commodities. However, certain intangible assets like patents, trademarks, and intellectual property can also create income, so they are considered real assets too.
Financial assets are non-physical assets whose values are derived from either a contractual claim on real assets or on the cash flows produced by those real assets. Examples of financial assets include stocks, bonds, cash, bank deposits, certificate of deposits (CDs), loans made, corporate receivables, derivative securities, and cryptocurrencies.
The difference between real and financial assets can be viewed as real assets are those used to produce economic output while financial assets serve to allocate how that output is divided up.
2. Capital Flow: Corporate vs. Investor View Regarding the flow of capital between investors, corporations, and the government, how does the view of the corporation differ from the view of the investor? (LO 1-2)
Investors provide money to companies as capital. The companies use that capital to invest in projects. When the projects return cash flows to the firm, any profits are usually subject to taxation by federal, state, and/or local governments. Of the remaining, after-tax, profits, some are retained in the firm to fund future operations and the rest are paid out to investors.
The corporation view of this system focus on decisions concerning; (1) the form and amount of funding received from investors, (2) which projects to put the funds in, (3) how to manage taxes, and (4) how much of the revenues of existing projects to keep versus paying back the firm’s investors.
The investors view of this system focus on decisions such as; (1) which firms and what types of financial instruments to invest in, (2) what terms and maturities of return cash flows to seek, and (3) how to best manage the timing and amounts of taxes paid.
3. Capital Flow Factors What are the complicating factors that make the flow of capital among corporations and investors uncertain? (LO 1-2)
Some of the complicating factors that make the flow of capital among corporations and investors uncertain are the following
The return from the projects invested by firms are not always positive and those investments are not always profitable. Many times the demand for the goods and services produced by those projects are subject to change over time in a competitive macroeconomic environment. That change could negatively affect the firm’s operations as well as their ability to sell those products and services at their hoped-for prices. Firms’ earnings can fluctuate and are not always as expected. Therefore a firm cannot guarantee the amount and timing of the returns they can give back to investors. Even if firms could perfectly forecast the beforetax returns from their operations, they have no control over government tax regulations that impact final cash flows.
Furthermore, the prices of financial assets change because of those uncertainties, and as more information arrives about a particular company, the valuation of those assets change also, which makes the price that the investor pay for those assets change also. Finally, there are a very large number of financial assets where investors can invest which make investing choices more complicated.
4. Valuation What factors are involved in assessing value? (LO 1-3)
Valuation of assets is the process of determining what an asset is worth today. The valuation of assets are based on finding the today’s value of all the expected future cash flows the asset will provide over the life of the asset.
From this definition, we see that there are three factors involved in valuing the asset: the life of the asset, the expected cash flows the asset will provide over its life and the risk of those cash flows to determine the discount rate used to find the present value of the cash flows.
Those factors vary from one asset to the other and make the valuation process complicated. For example the expected cash flows on bonds are easier to determine and calculate while the expected cash flows on stocks are much more difficult to predict. Some assets have finite lives, while others have infinite lives. Also, the riskiness of assets are not the same, which requires different discount rates.
5. Risk Aversion What are the ramifications of an investor being risk averse? (LO 1-3)
It is assumed that most rational investors are generally risk averse. This means that they will only take risk when they feel they will be compensated for the risk with a higher expected return. But that doesn’t mean they’re all equally risk averse. An investor with a long-time horizon and considerable additional savings can afford to take risks that someone with a shorter horizon and less savings would be uncomfortable with.
Because of the differences in risk aversion, people invest in different types of assets with different risk profiles. A more risk averse investor would invest in less risky assets such as government bonds, while a less risk averse investor would invest in a more risky assets such as stocks.
6. Market Efficiency Why might a market be efficient? (LO 1-4)
Financial markets are competitive markets where investors participate freely in the purchase and sale of stocks and bonds. Virtually anyone, from a child to a grandmother, may own an investment, even if it is just a savings account. Competitive financial markets also tend to be extremely efficient at making sure that new information is rapidly taken into account by valuations. If new information suggests that cash flows from different assets will be different than previously thought, the market rapidly adjusts the asset’s price. Thus, an efficient financial market implies that a security’s current price embodies all the known information concerning its potential return and risk.
7. Asset Specific Risk What is an asset-specific risk and how does it relate to portfolio diversification? (LO 1-5)
An asset-specific risk, which is also called unsystematic risk or diversifiable risk, is a type of risk that is only related to one particular asset and doesn’t affect the other assets in the market. For example, if the
ratings on Walmart’s bonds is downgraded, that would result in the price of Walmart bonds to decrease, and their yield increase, but this change in the ratings will not affect any other bonds in the market.
Asset-specific risk can be diversified away when a well-diversified portfolio with several assets is created. In such portfolio, individual asset-specific risks are eliminated, and only systematic risk or non-diversified risk remains in the portfolio.
8. Oil Prices and Diversification How would an increase in oil prices impact petroleum companies and airline firms? How does this relate to diversification? (LO 1-5)
The change in oil prices is considered a systematic risk that affects all the companies in different degrees and manners, therefore the impact of oil price changes cannot be diversified away.
A higher oil prices may be good for petroleum companies because they will sell their product at higher prices, but it may be bad for airline firms because airlines are users of oil products and they will end up paying higher prices. So oil is a type of economic factor that cannot be diversified away by creating a welldiversified portfolio.
9. Financial Crisis Recovery How did the recoveries after the financial crises of 2008 and 2020 differ for investor opportunities? (LO 1-6)
The two most recent stock bear markets (defined as a 20% or more decline) occurred in 2008 and 2020. However, their causes were very different and so where the recoveries.
Both of these financial crises share one common underlying cause: a sudden and dramatic increase in risk and uncertainty brought upon by an unexpected event which caused a shift in expectations and risk aversion for large portions of the investment community.
The causes of the financial crises of 2008 have been extensively analyzed and well-documented, with the main culprits being identified as excessive risk-taking by banks and the bursting of the U.S. housing bubble, both combining to cause the value of securities tied to U.S. real estate to fall precipitously. It took about four years for the stock market to fully recover from the financial crisis.
The primary initial causes of the COVID-19 financial crisis is even more easily identifiable as widespread lockdowns around the globe resulted in massive business closures, many of which will be permanent. The investors’ reaction to the pandemic news brought selling pressure that dropped the overall stock markets worldwide by about a third in a shocking six weeks. After the initial decline in March of 2020, investors bought the stock of technology firms, which ended 2020 with realizing great returns. Then in 2021, as the pandemic slowly subsided, investors started buying back the travel-oriented firms that they had previously dumped in anticipation of pent up travel demand.
The recovery from the Covid-19 pandemic was quicker than the recover from the financial crisis of the 2008.
10. Investment Professional Roles Discuss four kinds of investment professionals, including their primary roles in the industry. (LO 1-7)
The various kinds of roles available include stockbroker, securities analyst, portfolio manager, financial planner, and investment banker. A stockbroker works with individuals and institutions in advising and executing buy and sell orders of selling financial securities.
1. A securities analyst is an expert in specific industries and provides advice about the valuation and prospects of firms in those industries.
2. A portfolio manager makes decisions on what to buy and sell in the creation or management of the portfolio.
Solution and Answer Guide: Adair/Nofsinger 9798214056944; 2nd Edition; Chapter 1: Introduction to Investments
3. A financial planner helps individuals and families navigate the process of saving, investing, and ultimately providing retirement income.
4. An investment banker is the intermediaries between the companies and governments seeking new capital and investors with capital to offer. Thus, they work with companies to issue securities and distribute them to investors.
To be successful in this course and in your investment life, you will need access to good information. Investment professionals often have access to expensive information sources and analytical tools, like a Bloomberg Terminal. However, there are also many free financial websites that are very useful:
• Bloomberg: bloomberg.com
• CNN/Money: cnn.com/business
• Google: google.com/finance
• MarketWatch: marketwatch.com
• Morningstar: morningstar.com
• MSN Money: msn.com/en-us/money
• Yahoo! Finance: finance.yahoo.com
The purpose of this case is to explore one information source you will use during this course and in your personal financial life. Start by picking a public company to explore and finding its ticker symbol on MarketWatch. Once you have found the company, locate the following information:
a. From the Overview tab, find the stock price, PE ratio, earnings per share, dividend, capitalization, beta, and volume of shares traded.
b. From the Financials tab, obtain an annual income statement and a balance sheet. Comment on the firm’s financial statements.
c. From the Profile tab, obtain the valuation measures, profitability, management effectiveness, and share statistics.
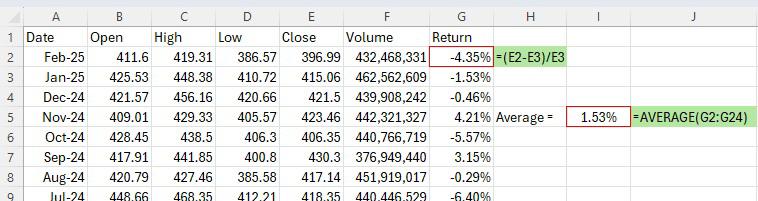
d. Historical stock price data can be found in the Historical Quotes tab. This is useful for obtaining a history of daily, weekly, or monthly stock returns. Select monthly prices. MarketWatch allows data downloads of up to one year. To get two years or more, adjust the Start and End date range to the most recent year and Download to receive a csv file for your spreadsheet. Then reset the range to another year and download that data. Appending two or more downloaded files allows the building of multi-year datasets. Note that the data is sorted as newest month first. Next, compute a monthly return using the Close column [Example: For spreadsheet row 2, compute the return as =(E2-E3)/E3]. Compute the two-year monthly average return. Comment on the monthly returns and average return.
Example:
Solution
For this representative solution, we have selected Walmart as the company. When you go to www.marketwatch.com, you can select the company you wish, and you can enter the name of the company in the search tab. MarketWatch will find the company, and once you select it from the drop-down menu, a new website will provide you with the financial information about this company.
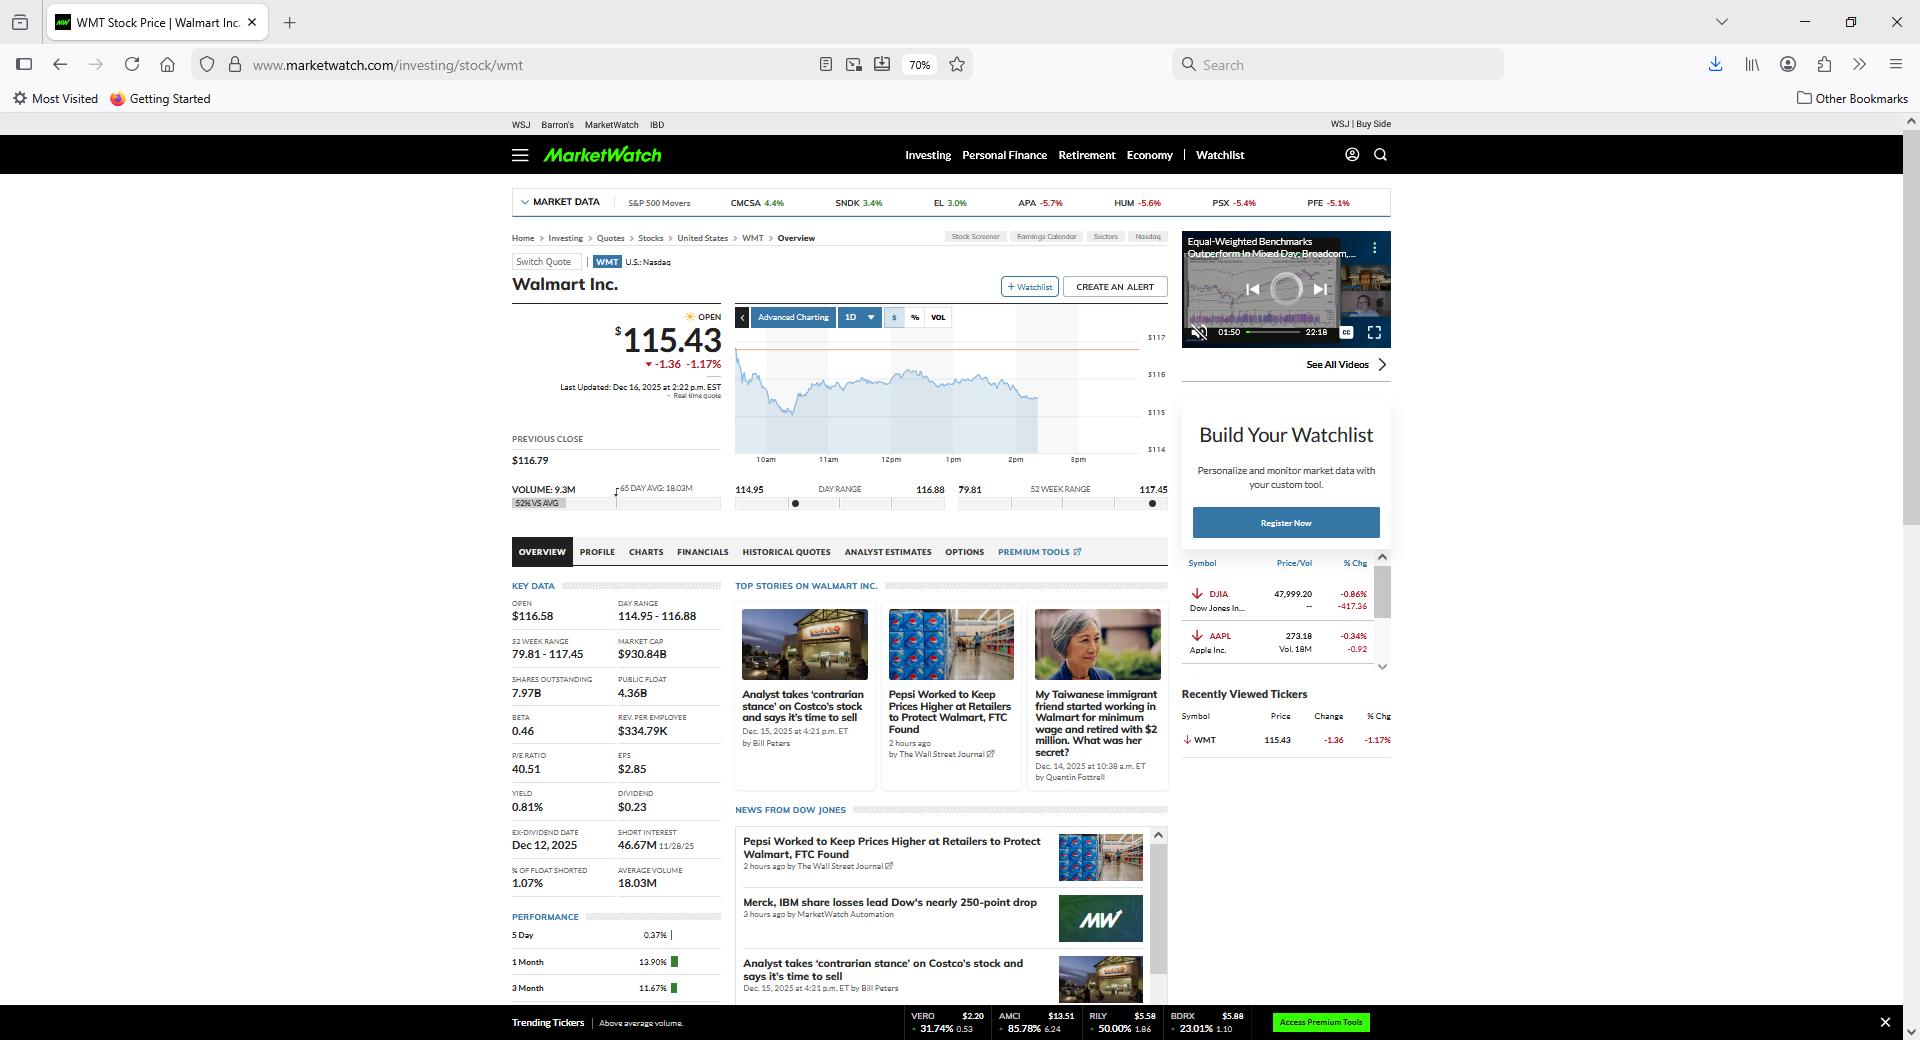
a. The first tab that will display is the overview tab, where the current stock price (on December 16, 2025) is displayed, along with the other information.
Stock Price = $115.43 (December 16, 2025)
PE ratio = 40.51 (This PE ratio is calculated using the trailing 12-month EPS.)
Earnings per share = $2.85 (This is the trailing 12-month EPS )
Dividend = $0.23 (This is the next quarterly dividend that Walmart is expected to pay )
Capitalization = $930.84 billion (This is calculated as the price multiplied by the number of shares outstanding.)
Beta = 0.49
Volume of shares traded = 18.03 million shares (average volume)
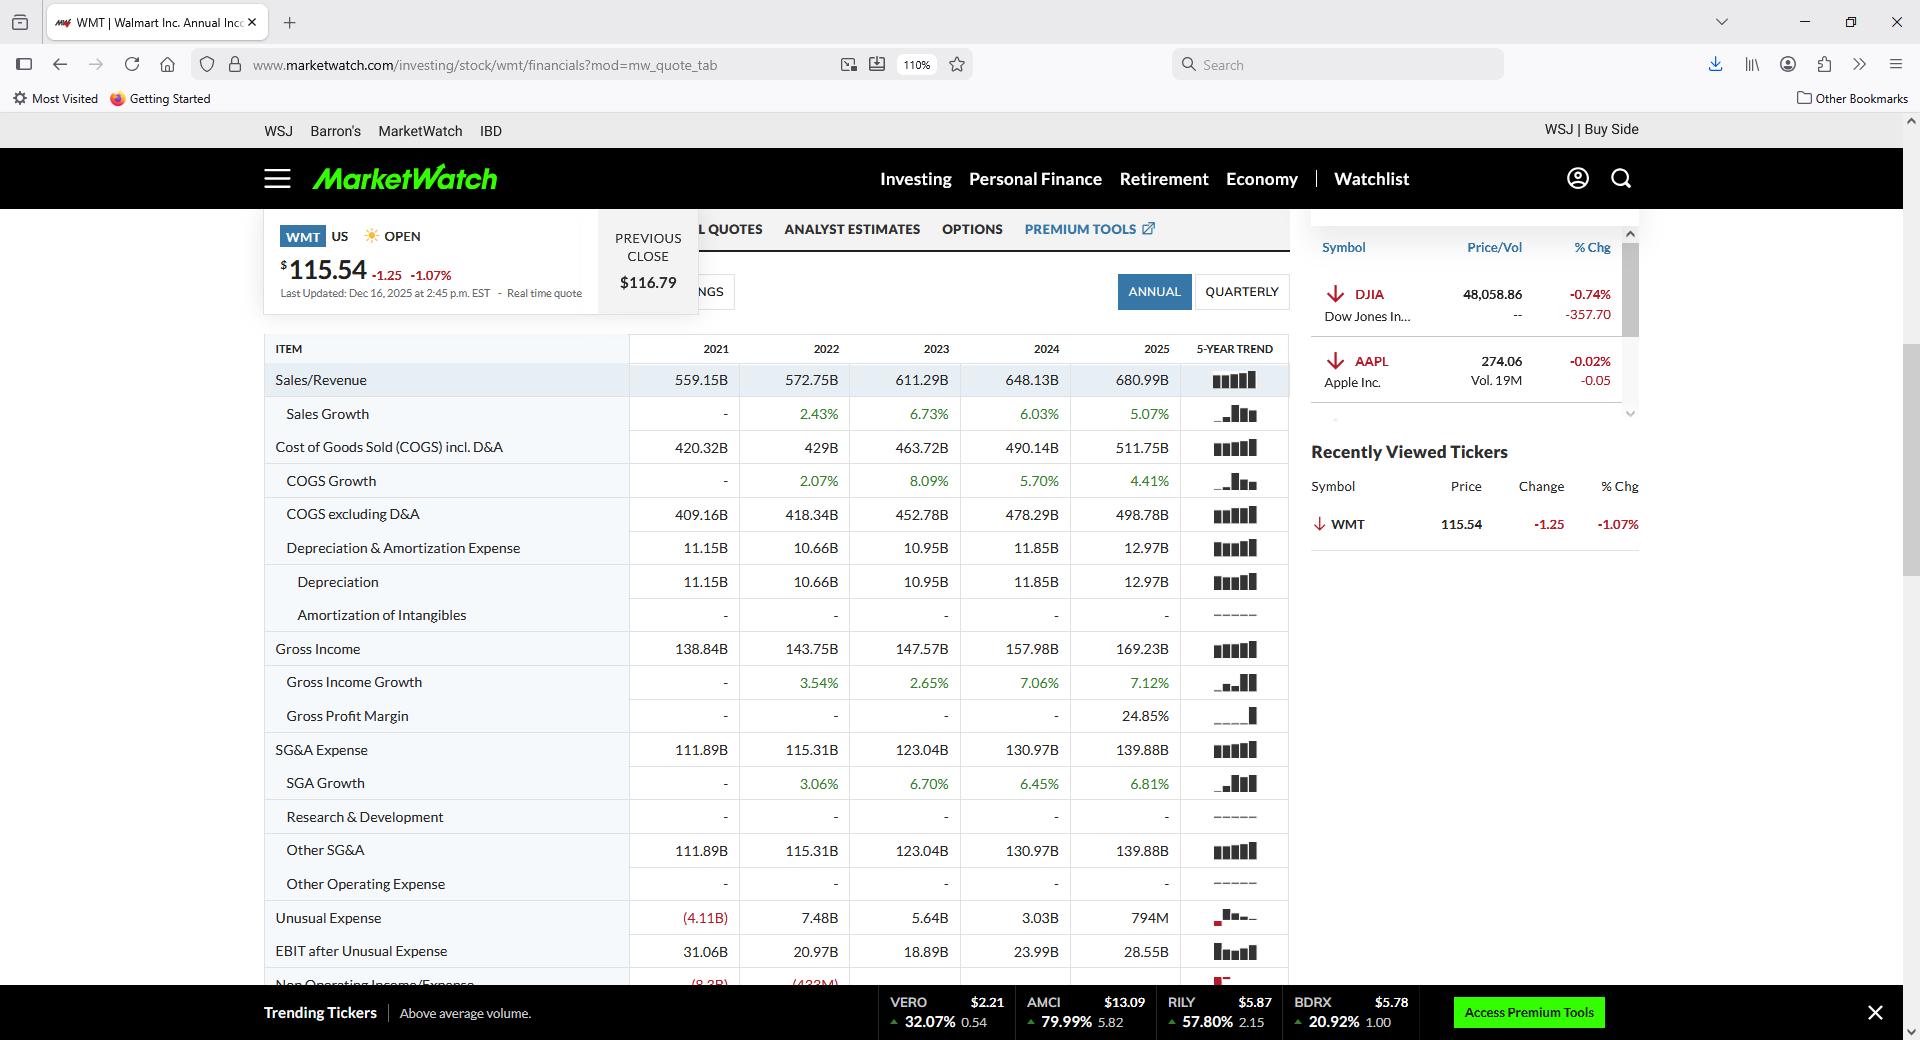
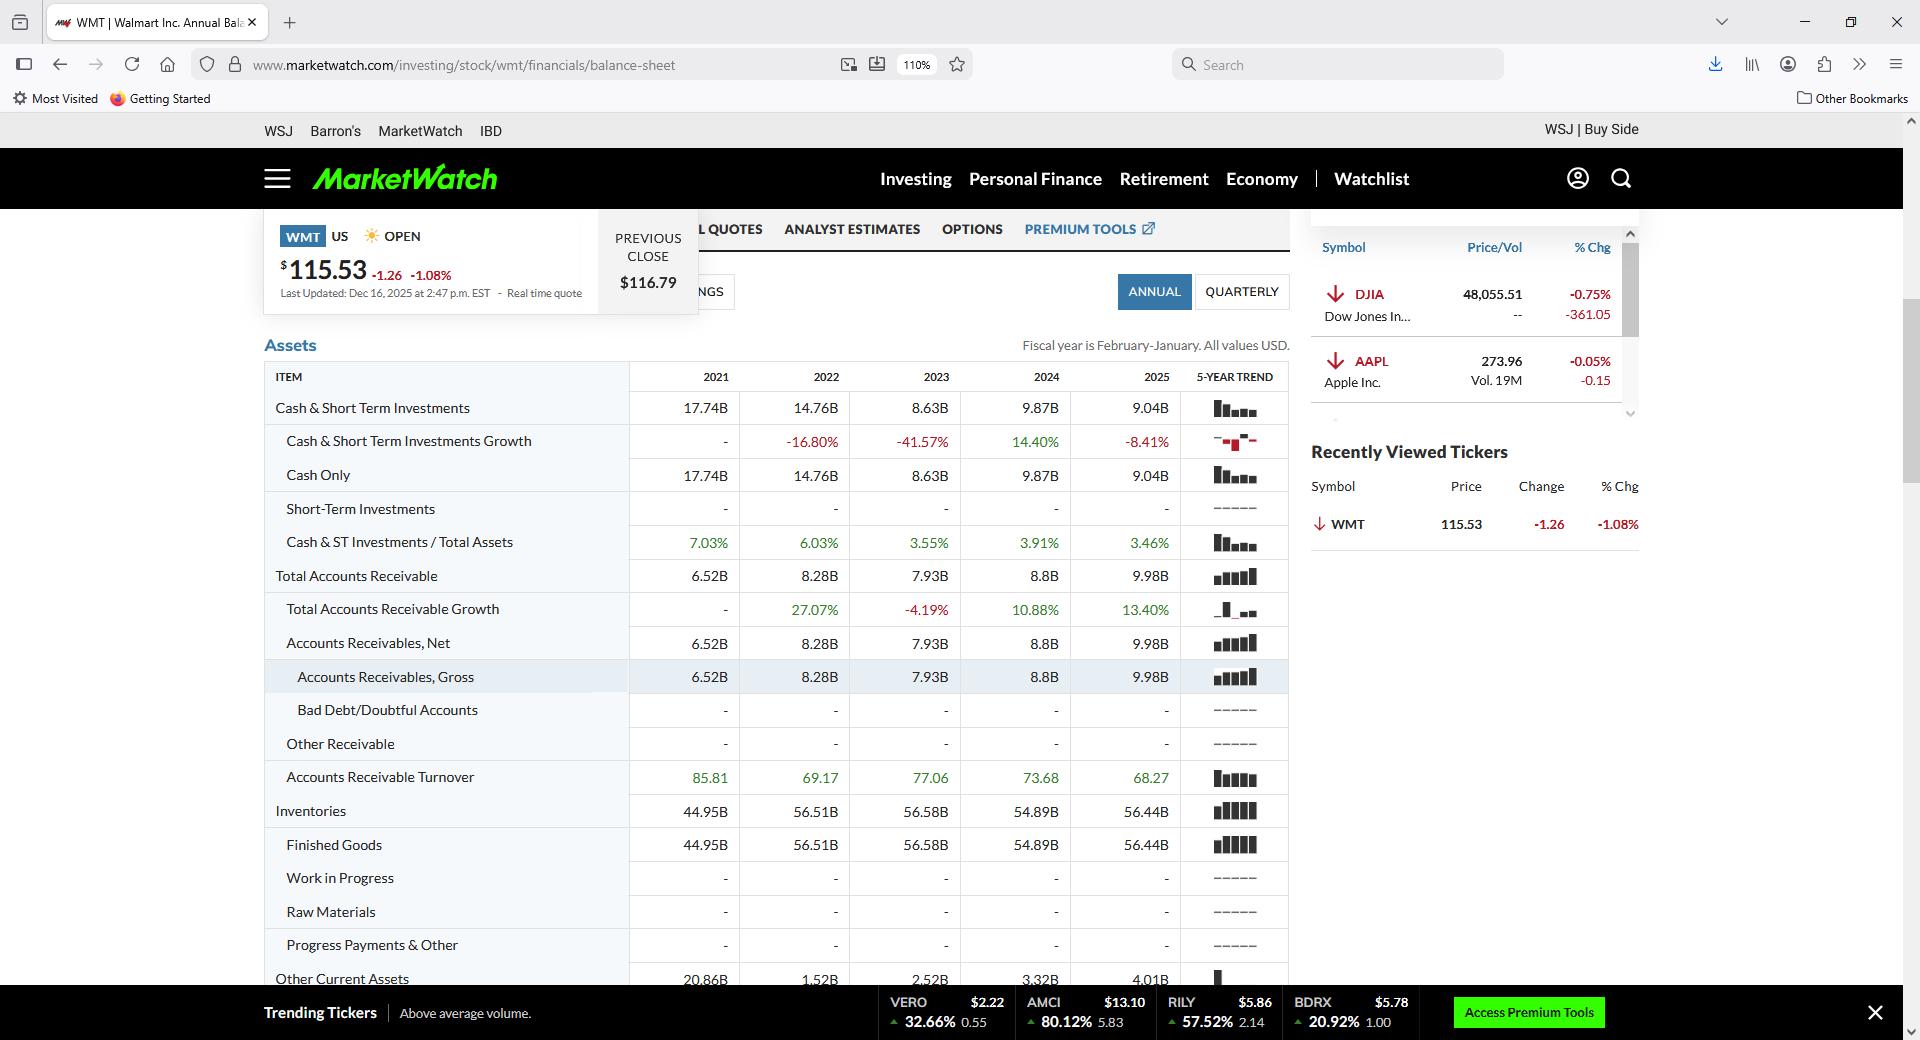
b. When the market is open, Marketwatch.com will display the current stock price in a small window as it is shown in the following screenshots. As you can see, in the financials tab, you will have access to the income statement information, the balance sheet, the statement of cash flows, and the SEC filings.
Marketwatch.com will provide financial information over the last five years. In addition, the last column will have a small graph of the five-year trend, which can be useful to see any changes in any particular variable of interest. The SEC filings tab allows for access to the different financial documents that are filed with the SEC, such as 10-K, 10-Q, etc.
For Walmart, the financial statements provide a positive picture about the company, as is shown in the screenshots below. The net income has been positive and growing over the last two years. The statement of cash flows also shows positive free cash flows for the last two years.
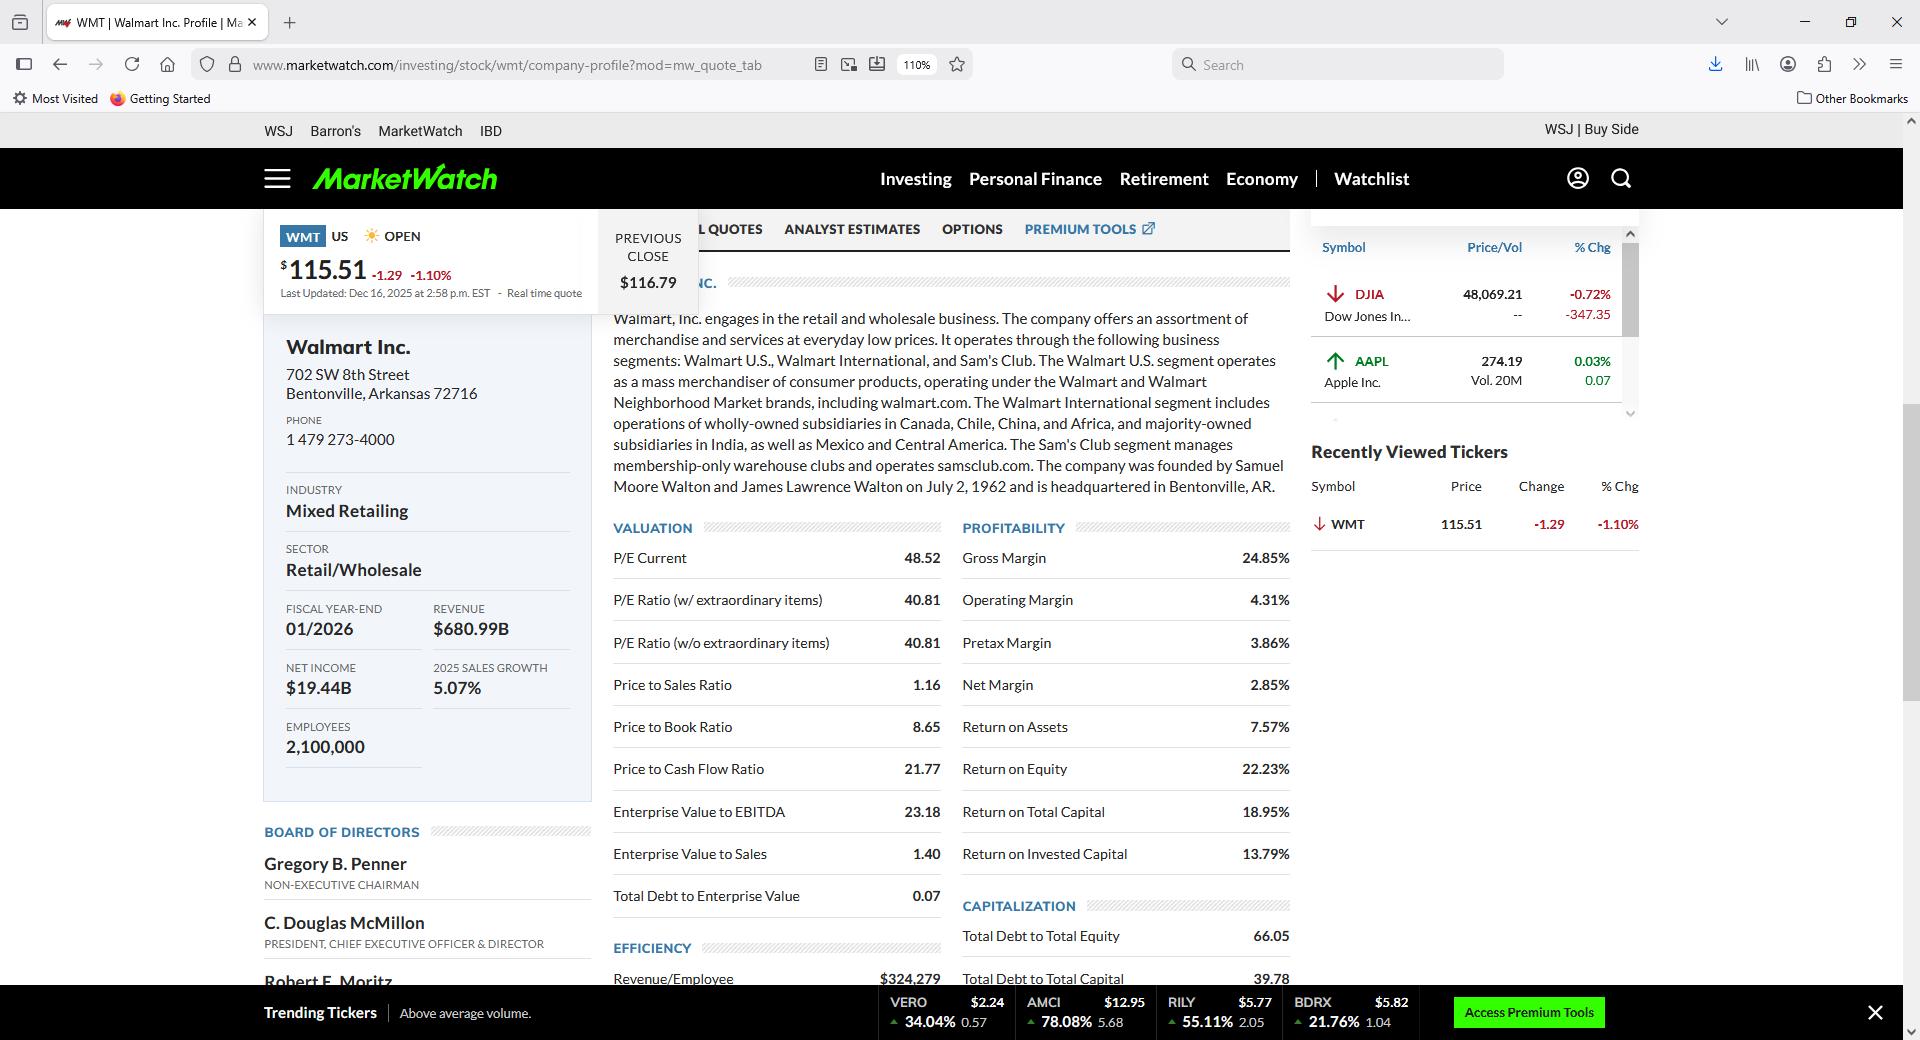
c. The Profile tab provides with ratios on valuation, profitability, efficiency, capitalization, and liquidity. Also, it lists some general statistics about the company with the names of the board of directors included.
The data provided in the following screenshot shows that Walmart has been doing well. The net profit margin is 2.85%, the operating profit margin is 4.31%; the return on assets is 7.57%, while the return on equity is 22.23%. You can check and analyze numerous other measures as well.
d. MarketWatch allows data downloads of up to one year. To download two years of monthly data, first set the range of the data from November 29, 2024, to November 28, 2025 (to obtain end-of-month data for the
entire month, since this case solution is written on December 15, 2025), then select the monthly tab, then click on update, and download the data in CVS format. Then, change the range to November 30, 2023, to November 29, 2024, and again, click on the monthly tab and then click on update and download the CVS file again. You have to copy the content of the second file into the first file and then delete one of the redundant lines for the November 2024 date. This way, you will have two years of data freely downloaded from MarketWatch.
To clean the data, delete the columns Open, High, Low, and Volume; you only need to keep the date column and the close price column. (This step is not really necessary because you can just go and sort the data from oldest to newest and be able to work on the case. However, it is a good idea to only keep the data that is needed in the Excel file and delete unnecessary data.)
Finally, select the two columns Date and Open, and using the sort function on Excel, sort the data from oldest to newest.
Once you have created a clean Excel file, you can calculate the monthly returns and then the average of the monthly returns in Excel. The monthly average return from November 2023 to November 2025 was 3.35% for Walmart.
Over the two years, the monthly returns fluctuated widely from –10.97% to 12.51%.
Instructor Manual: Troy Adair/John Nofsinger, Foundations of Investments 2e, 9798214056944, © 2027; Chapter 1: Introduction to Investments
The purpose of this chapter is to introduce the concepts that will be developed throughout the text. These are important foundational financial concepts that apply to investing, including capital flow, types of financial assets, risk and expected return, asset valuation, risk aversion, asset allocation, diversification, and market efficiency. Each of these themes reappears throughout the text. Even though a chapter might be devoted to a specific topic, such as mutual funds or bonds, these specific assets ultimately must fit into a portfolio. It is important to know the characteristics like risks and expected return of a specific security. But ultimately, the characteristics of each individual asset will interact with the other assets in your portfolio. In addition, the success of your portfolio will depend on the macroeconomic environment.
The following objectives are addressed in this chapter:
LO 1-1
Describe the difference between real assets and financial assets.
LO 1-2 Explain the system of cash flows between companies, investors, and the government.
LO 1-3 Understand the factors involved in assessing value
LO 1-4
LO 1-5
Describe the characteristics of an efficient market.
Recognize how asset-specific risk and asset allocation contribute to portfolio diversification
LO 1-6 Explain the importance of integrating the macroeconomic environment into the investing process.
LO 1-7
Describe careers in the investment service sector
The following outline organizes activities (including any existing discussion questions in PowerPoints or other supplements) and assessments by chapter (and therefore by topic), so you can see how all the content relates to the topics covered in the text
I. Investments
I. Investments (LO 1-1, PPT Slide 7)
a. The term investments can be used in a variety of ways and often depends on the context. In this text, investment means “the purchase of an asset for the purpose of storing and (possibly) increasing value over time.”
Instructor Manual: Troy Adair/John Nofsinger, Foundations of Investments 2e, 9798214056944, © 2027; Chapter 1: Introduction to Investments
b. Investment will then include the transfer of ownership as well as storing value.
c. In this text, investments do not include more philosophical investments, such as investing in one’s health through exercise.
d. Examples of investments include the purchase of stock, bonds, options, commodity contracts, cryptocurrency, antiques, stamps, and real estate. Investments also include a company’s purchase of equipment or buildings to create valuable products in the future.
e. Many individuals have investments through their retirement plan, often a 401(k) plan. These plans are named for the section of the Internal Revenue Code that defines them. Individuals set money aside in these plans with the intention of only withdrawing those funds in retirement. The benefits of these plans include (1) interest on the money you have invested in the plan, (2) the right to any company-matching contributions and the growth on those funds, and (3) the potential ability to take the money out in the future and taxed at a (potentially) lower tax rate.
f. Within a retirement plan or with any other investment, the study of investments includes determining which investments to purchase, how much to purchase of each, when to buy and sell, and how investments interact with each other.
g. Valuation is the process of determining the current worth of an asset.
h. Valuation is the present value of all the future benefits. Future benefits are usually considered the future cash flows from the investment.
i. Another important element in investing is the economic environment. Certainly, some economic situations are better for some companies than others. The overall economy impacts all companies in some way.
j. Finally, a key element in investing is the role of a diversified portfolio. Specifically, a diversified portfolio is the correlation of one investment’s cash flow with another investment’s cash flow. Investors tend to hold several different investments at the same time. The collection of those investments is called their portfolio. When the cash flows of the various investments occur at different times and in different amounts, then the portfolio is called a diversified portfolio.
Instructor Manual: Troy Adair/John Nofsinger, Foundations of Investments 2e, 9798214056944, © 2027; Chapter 1: Introduction to Investments
To have a diversified portfolio, the investments need to have low correlation with each other. Correlation refers to the degree to which the returns of two assets move together.
(20 minutes, PPT 15)
I. Considering your industry or field of interest, what are two companies’ stocks that would be highly correlated? What are two companies’ stocks that would not be highly correlated? Why might there be a difference?
II. Debrief: Stocks are more likely to be highly correlated the more similar the two companies are. If there are differences in the companies, then the stocks are likely to have a low correlation. Uncertainty is always a consideration.
II. Outline of the textbook (PPT Slide 12)
a. There are six parts to this textbook. The general outline is:
I. Part I: investment basics and environment
II. Part II: measurement and valuation tools
III. Part III: valuation of preferred and common stock
IV. Part IV: valuation of debt securities, bonds
V. Part V: valuation of derivative securities
VI. Part VI: specialized topics
III. Real assets and financial assets (LO 1-1, PPT Slide 16)
a. Real assets are physical assets that have value due to their substance and properties.
I. Examples of those with value due to substance would be gold, silver, commodities, real estate, and equipment. Examples of those with value due to properties would be patents, trademarks, and other intellectual property.
II. Real assets produce economic output. For example, if you purchase a machine, you expect to use it to create product that can then be sold.
III. Real assets can be unique. There is only one plot of land at that specific location.
b. Financial assets are instruments issued by corporations, governments, or other organizations that offer cash flow. These are called securities.
I. Examples include stocks, bonds, loans made, receivables, derivative securities, and cryptocurrencies.
II. Financial assets determine how to allocate the output that is produced. If you purchase a share of stock, then you are giving resources to the company. By owning the share of stock, you
Instructor Manual: Troy Adair/John Nofsinger, Foundations of Investments 2e, 9798214056944, © 2027; Chapter 1: Introduction to Investments
have rights to any dividends paid by the company, which would be resources from the company.
III. Financial assets are rarely unique. All the shares of a company are the same.
IV. The focus of investing is on buying the financial assets, as opposed to corporate finance, which focuses on selling the financial assets.
IV. Cash flows in the economy (LO 1-2, PPT Slide 25)
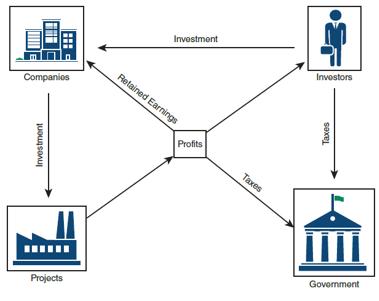
a. One could view the economy as cash flows to and from different sectors. The sectors could be investors, corporations, and the government.
I. Investors receive cash from companies in terms of dividends and interest. Investors provide cash to companies through the purchase of securities. Investors also provide cash to government through taxes.
II. Companies use resources to invest in projects/products. These are sold, leading to profits. The profits are used in three ways. First, profits can be reinvested in the company. Second, they can be paid out as dividends and interest to investors. Finally, profits are used to pay the company’s taxes to the government.
III. Governments receive cash from investors and from companies’ profits.
IV. The graphic below shows these cash flows.
Instructor Manual: Troy Adair/John Nofsinger, Foundations of Investments 2e, 9798214056944, © 2027; Chapter 1: Introduction to Investments
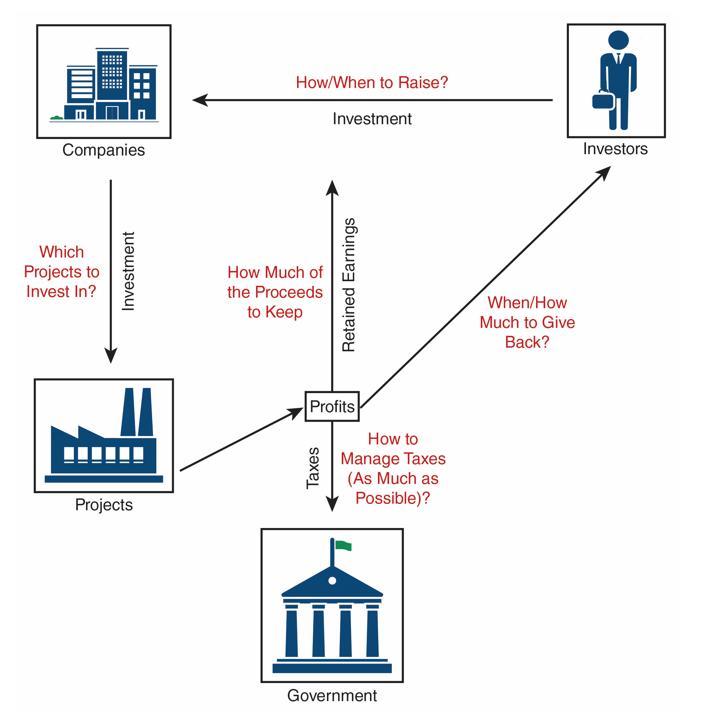
V. How and when to raise money influences how cash will flow from the investor to the company.
VI. The projects in which the company will invest influences the money flowing from management to the projects.
VII. How to use profits, of course, depends on how much cash goes to the company, to investors, or to the government.
VIII. Each of these is highlighted in the graphic below.
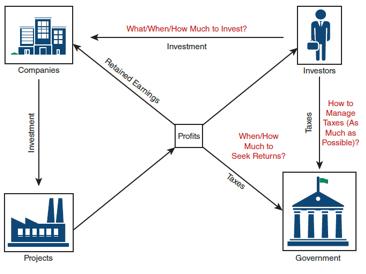
b. The investor has three main decision points:
I. How much and when to provide cash to the company.
II. How much and when to expect or seek returns from the company.
III. How to manage taxes (cash flowing to the government) as much as possible by considering the tax implications of any investment before making it.
IV. The graphic below highlights the decision points of the investor.
or
Instructor Manual: Troy Adair/John Nofsinger, Foundations of Investments 2e, 9798214056944, © 2027; Chapter 1: Introduction to Investments
c. Uncertainty is an element of each line in the graphic.
I. Uncertainty is based in part on the timing of the cash flows.
II. Changes in the economy over time will add to the uncertainty.
III. Changes in tax policy will increase uncertainty.
IV. Information in general will impact these cash flows in uncertain ways.
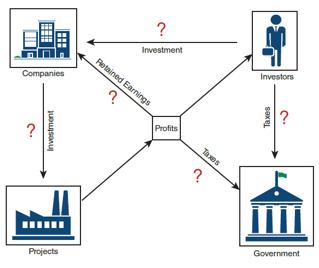
V. The cash flows and the uncertainty of those cash flows lead to the valuation of an asset. Each investment includes expected cash flows (e.g., dividends), the timing of those cash flows, and the amount of those cash flows.
Instructor Manual: Troy Adair/John Nofsinger, Foundations of Investments 2e, 9798214056944, © 2027; Chapter 1: Introduction to Investments
I. Looking at the graphic above, which of the elements represent the company and its decisions? How would you differentiate between those elements?
II. Debrief: The graphic below identifies the three elements that relate to the company. There is management, the production or services, and the profits or money made from the company. So, while the overall graph refers to three elements in the economy (company, investor, and government), over half the graphic refers to different elements within the company.
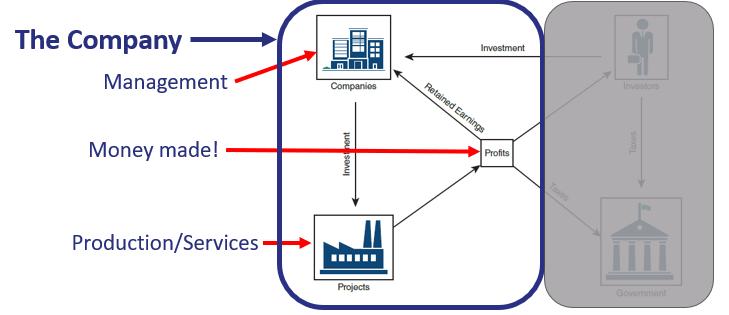
e. Having identified the elements of the graphic related to the company, one can focus on the different decisions the company needs to make along each of the arrow paths.
f. Risk
I. There are various types of risk involved in investing, such as: (1) Project risk (2) Earnings risk (3) Price risk (4) Information risk
V. Valuation (LO 1-3, PPT Slide 34)
a. In stocks, the future cash flows are the dividends along with the increase in the stock price at the time the stock was sold. In bonds, this would be the coupon payments and the maturity value. Theoretically, the present value of the future cash flows is the current valuation of that stock or bond. The valuation could also be considered what one is willing to pay for that investment.
b. In cases where the expected cash flows have relatively little risk, the valuation is easy. For example, bonds pay a fixed amount at a specified date.
c. Risk aversion
Instructor Manual: Troy Adair/John Nofsinger, Foundations of Investments 2e, 9798214056944, © 2027; Chapter 1: Introduction to Investments
I. Risk aversion is the degree to which a person desires to avoid risk. Most individuals want to avoid risk.
II. If an individual takes on risk, they want to be compensated for taking on that additional risk. Therefore, any investment with higher risk is expected to achieve a higher return.
(1) There will not always be a higher return. However, on average, over the long term, there should be a higher return for those investments with more risk.
(2) Investments with more risk tend to experience much higher and much lower returns than other investments within any one investment time period. It is that volatility in returns that creates the risk.
III. Investors have different levels of risk aversion. In other words, some investors enjoy taking on more risk and experiencing the high and low returns from period to period
IV. Investors also have different estimates of future cash flows, such as the timing and the amount.
V. It is these differences in cash flow estimates and levels of risk aversion that create the market for securities! At a specific price level, some investors will want to purchase the security as they view it as underpriced, while other investors will want to sell the security, as they view it as overpriced.
VI. Group Activity (30 minutes)
(1) Consider the three different investments with different areas of uncertainty outlined in the table below. Which would you prefer and why?
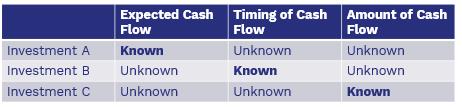
(2) For example, for Investment A, you know the type of expected future cash flow but don’t know the timing or the amount of those cash flows. On the other hand, for Investment B, you know when you will receive cash flows, but don’t know the type or how much you will receive.
VII. Return is the sum of any income received during the time the security was held and the differences in the purchase and selling price.
Instructor Manual: Troy Adair/John Nofsinger, Foundations of Investments 2e, 9798214056944, © 2027; Chapter 1: Introduction to Investments
VIII. Income is from dividends and interest.
IX. Capital gains are the difference in the purchase and selling price.
Return = income + (sale price – purchase price)
(1) For example, if one purchased a security for $80, received $2 in dividends and then sold it for $81 dollars, the total return received would be
Return = 2 + (81 – 80) = 2 + 1 = $3
X. The rate of return is the percentage of return realized on the investment.
(1) In the example above, the rate of return would be the amount of return received divided by the purchase price:
Rate of return = 3/80 = 0.0375 or 3.75%
(2) The rate of return received is called the realized return. The rate of return one hopes to receive is the anticipated return. The anticipated return does not always equal the realized return. The realized return may be more or may be less.
(3) As another example, one might hope to receive $2 in dividends and sell for $105 based on a purchase of $100. This would be an anticipated return of:
Rate of return = (2+5) / 100 = 0.07 or 7%
However, after purchasing the stock for $100, the investor might receive $3 in dividends and then sell it for $103. In this case, the realized return would be
Rate of return = (3+3)/100 = 0.06 or 6%
d. Risk is the uncertainty of returns, as noted above. An example of unexpected loss was when Enron stock went from $90.75 to $0.26 in about a year. An example of unexpected gain was when Amazon stock increased 14% in one day.
I. Speculation implies a high degree of risk. In this text, speculation means that an investment runs a good chance of losing the funds invested.
II. With this very high degree of risk, speculation does have the potential to earn a high reward. This is the potential, rather than a guarantee.
or
Instructor Manual: Troy Adair/John Nofsinger, Foundations of Investments 2e, 9798214056944, © 2027; Chapter 1: Introduction to Investments
e. Liquidity is another characteristic of a security that can impact its valuation. Liquidity refers to the ease with which an asset can be converted into cash, can be bought and sold, or can be sold without affecting its price.
I. Cash itself is the most liquid asset.
II. Receivables are another liquid asset, as companies expect to receive that money soon, or a company can sell its receivables and receive cash more immediately.
III. The ability to buy and sell an asset also reflects its liquidity. For example, if you have a DVD player that you want to sell, that might be hard. There is almost no market for DVD players and even selling it at a yard sale might be difficult. On the other hand, if you wanted to purchase a DVD player, that might also be hard, making this asset not very liquid.
IV. The third element of liquidity is selling an asset without affecting its price. If one is trying to sell ownership of a company, the sale itself might impact the price of the company.
VI. Efficient and competitive markets (LO 1-4, PPT Slide 43)
a. To begin a discussion on efficient and competitive markets, it is important to understand the concept of the law of large numbers (LNN). The LNN states that as a sample size grows, the sample mean gets closer to the population average.
I. Consider flipping a coin and counting how many times it comes up as heads. You might get the following results on each attempt and the subsequent running average is shown as well.
= 55.6%
If this continues, the average number of heads from the larger and larger samples will get closer and closer to 50%, the true population average. Graphically, this trend is shown below. The probability of heads is shown on the y-axis and the number of coin flips is shown on the x-axis.
Instructor Manual: Troy Adair/John Nofsinger, Foundations of Investments 2e, 9798214056944, © 2027; Chapter 1: Introduction to Investments
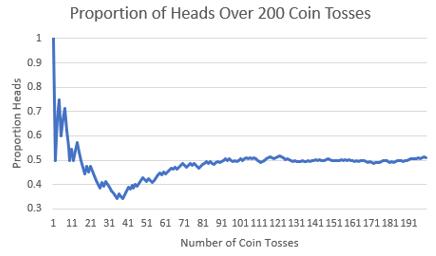
II. This concept of the law of large numbers applies to the returns investors earn after making many investments over an extended period of time. In other words, imagine an investor purchases a stock and holds it for a month and sells it. The investor does this with the same stock over and over again, month after month. As the number of months grows, the investor’s return will get closer and closer to the overall average return for that investment.
b. In competitive markets with a large number of investors, financial markets tend to be extremely efficient.
c. In a competitive market, consider what occurs when an asset is over- or underpriced.
I. If an asset was undervalued, its selling price is lower than the true value of the asset.
(1) In this case, if an investor could purchase the asset at that low price, they would expect an excessive or high return once the asset was correctly valued.
(2) Therefore, many investors would rush to purchase this underpriced asset.
(3) This rush to purchase would bid up the price.
(4) The asset would no longer be undervalued. The efficient and competitive market with many investors quickly corrects the pricing of the asset.
II. If an asset was overvalued, its selling price is higher than the true value of the asset.
Instructor Manual: Troy Adair/John Nofsinger, Foundations of Investments 2e, 9798214056944, © 2027; Chapter 1: Introduction to Investments
(1) In this case, any investor who owns this asset would want to sell it quickly to take advantage of the higher price.
(2) Therefore, all owners of the asset would be looking to sell this overpriced asset.
(3) This rush to sell would cause the price to decline.
(4) The asset would no longer be overpriced. An efficient and competitive market with many investors quickly corrects the pricing of the asset.
III. Therefore, investors cannot expect to consistently beat an efficient market.
I. Each group should look for articles on efficient market theory based on events in the market. In other words, what are some examples where market efficiency was reflected or what are some examples where market efficiency was compromised? Some examples would be:
(1) GameStop stock. In January 2021, younger investors used social media to artificially bid up the price of this company, forcing some professional hedge managers to lose money. Further describe the strategy and how that was consistent or inconsistent with an efficient market.
(2) Warren Buffet’s theory of investing. Buffet believes in the inherent value of a company and does traditional investment research into its branding, marketing, future investments, etc., as he decides whether to purchase. Does this strategy reinforce an efficient market or detract from an efficient market?
(3) Berkshire Hathaway stock price. As this company has become very successful under Warren Buffet, what has happened with its stock price? What does that imply for the marketability and liquidity of the shares?
(4) Enron scandal of October 2001. The company used an accounting scheme to make it appear that the company was more successful than actual profits would show How did this impact the decision of investors about purchasing Enron stock?
II. Each group can report out to the class on their findings and the relation to an efficient, competitive market.
Instructor Manual: Troy Adair/John Nofsinger, Foundations of Investments 2e, 9798214056944, © 2027; Chapter 1: Introduction to Investments
VII. Diversification and portfolio construction (LO 1-5, PPT Slide 49)
a. When an asset is held as part of a well-diversified portfolio, some risk is canceled out.
I. This means that a well-diversified investor receives the same return, while reducing the risk of the investments based on the structure of the portfolio.
II. A portfolio is a group of assets owned by the same investor or investors. For example, in a retirement account, an individual might own a variety of stocks, bonds, and other assets. Since it is within their own retirement account, that would be their retirement portfolio.
b. Each asset has two types of risk.
I. Asset-specific risk is risk specific to that individual company or asset. This risk can be diversified away in a portfolio.
II. Systemic risk is the risk from the market and the economy. This risk cannot be diversified away in a portfolio. The volatility from the market is reflected in the systemic risk.
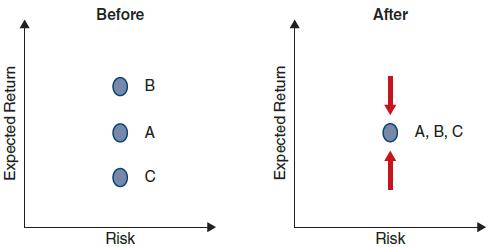
III. A diversified portfolio can eliminate asset-specific risk. In this way, all investments at the same level of systemic risk will provide the same return in an efficient market. The graphic below shows how the asset-specific risk of investments A, B, and C lead to different returns at the same level of risk. However, within a diversified portfolio, all assets at the same level of systemic risk provided the same return.
c. Diversification means that the portfolio has a variety of types of investments, such as stocks, bonds, and cash. Further, these assets are from a variety of companies in a variety of industries.
d. Asset allocation refers to the process of diversifying an investment portfolio. This process ensures that there is a variety of assets in the portfolio.
Instructor Manual: Troy Adair/John Nofsinger, Foundations of Investments 2e, 9798214056944, © 2027; Chapter 1: Introduction to Investments
VIII. Recent bear markets (LO 1-6, PPT Slide 55)
a. In a bear market, the stock market overall is declining; prices of stocks are generally going down and may indicate that the economy might be in a recession.
I. Financial crisis of 2008
(1) Caused by excessive risk taking by banks and the bursting of the U.S. housing bubble. With the fall of real estate values, any asset tied to real estate also declined in value.
(2) From October 6 to October 10, 2008, the market dropped 18%.
(3) Recovery was not complete until 2009.
II. COVID-19 crisis of 2020
(1) Businesses had to shut down because of COVID-19.
(2) Stocks of businesses were sold, causing a decline in their value. Companies in travel and tourism were hit especially hard.
(3) Some companies did very well in 2020, especially in the technology sector, such as Zoom and DocuSign.
b. In a bull market the stock market is overall increasing and the prices of stocks are generally going up.
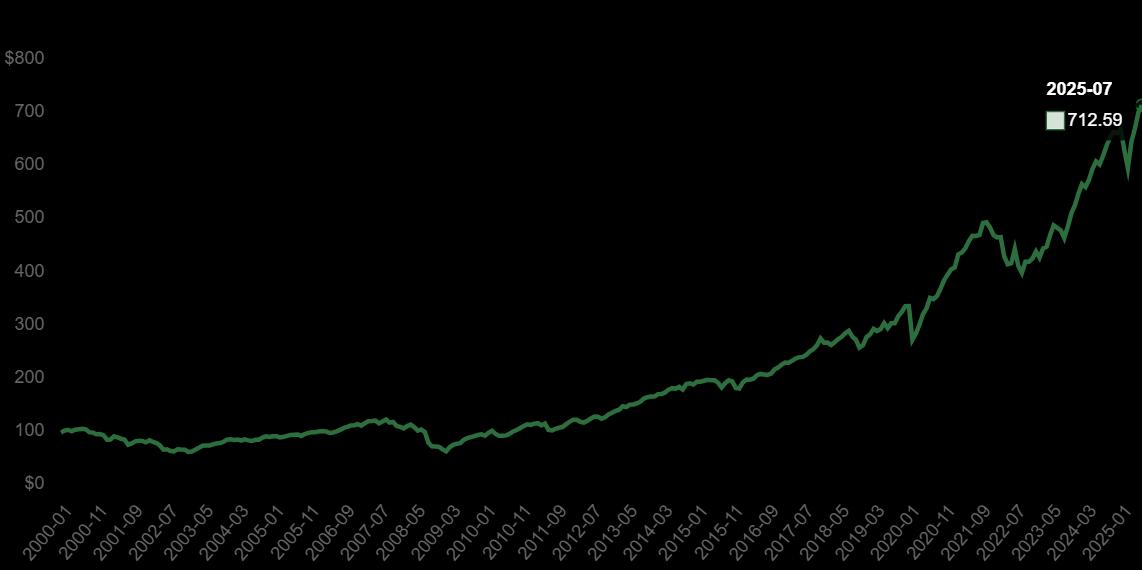
c. Consider these two graphs based on the S&P 500 stock index (source: S&P 500 Returns since 2000 [officialdata.org]) The first shows how $100 invested at the beginning of 2000 would have grown until now. While the 2008 and 2020 bear markets can be seen, the market over this time has certainly increased.
Instructor Manual: Troy Adair/John Nofsinger, Foundations of Investments 2e, 9798214056944, © 2027; Chapter 1: Introduction to Investments
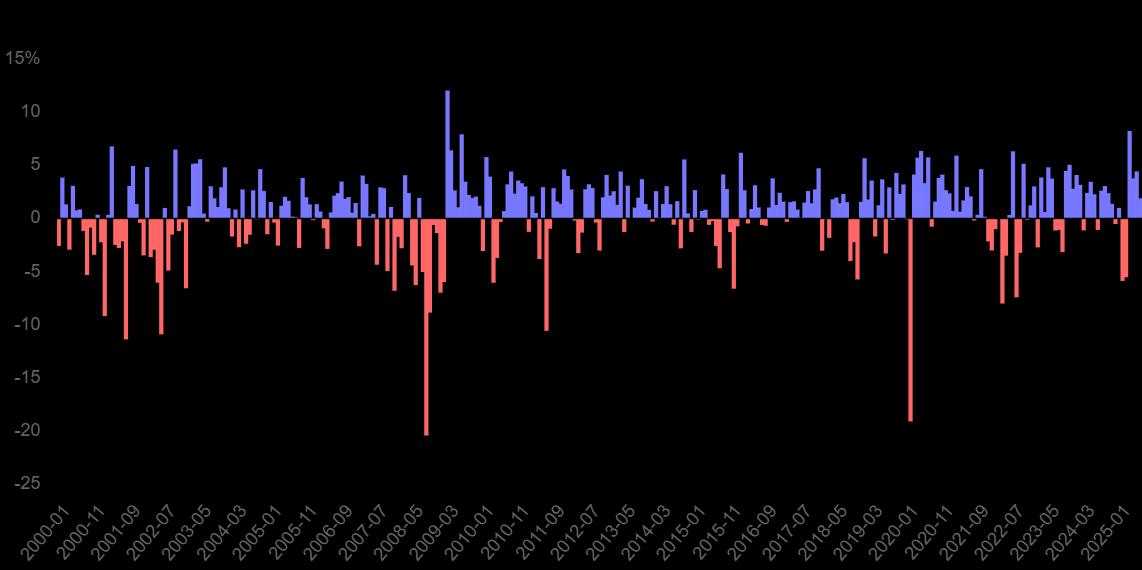
d. The second graph shows the same information but shows the S&P 500 based on monthly returns during that same period. The bear markets in 2008 and 2020 are more evident. However, it is harder to see the overall increase in the market from this chart.
IX. AI, high tech, and the Magnificent 7 (LO 1-6, PPT Slide 59)
a. AI is rapidly transforming business.
b. High-tech companies are dominating the market, with the top seven companies making up 30% of the S&P 500 valuation.
c. A select group of stocks in the high-tech sector is collectively known as the “Magnificent 7.” They are:
I. Nvidia (NVDA)
II. Tesla (TSLA)
III. Alphabet (GOOG)
IV. Amazon (AMZN)
V. Meta (META)
VI. Apple (AAPL)
VII. Microsoft (MSFT)
X. Careers and certifications in investments (LO 1-7, PPT Slide 62)
a. There are a variety of careers in investments, including:
I. Securities analyst
II. Portfolio manager
III. Financial planner
IV. Investment banker
or
Instructor Manual: Troy Adair/John Nofsinger, Foundations of Investments 2e, 9798214056944, © 2027; Chapter 1: Introduction to Investments
b. There are also a variety of certifications that can be obtained in investments, such as:
I. Chartered Financial Analyst (CFA)
II. Chartered Alternative Investment Analyst (CAIA)
III. Chartered Financial Consultant
IV. Certified Financial Planner (CFP)
[return to top]
LIST OF FORMULAS
• Return = income + (sale price – purchase price)
[return to top]