Solutions Manual for Essentials of Economics 5th Edition by Brue, McConnell, Flynn
ISBN: 9781265350642
Brue,
McConnell, Flynn
Essentials of Economics 5e
Chapter 1
Limits, Alternatives, and Choices
QUESTIONS
Question 1
Ralph Waldo Emerson once wrote: “Want is a growing giant whom the coat of have was never large enough to cover.” How does this statement relate to the definition of economics? LO1
Answer
Emerson’s statement reflects the fundamental economic problem of attempting to satisfy unlimited wants with finite (scarce) economic resources.
Question 2
“Buy 2, get 1 free.” Explain why the “1 free” is free to the buyer but not to society. LO1
Answer
Because an expenditure is not required for the buyer to obtain the “1 free” once she has already purchased the first two, it is free to the buyer. It is not free to society, however, because resources were used in producing the third unit that could have been directed to alternate uses.
Question 3
What is an opportunity cost? How does the idea relate to the definition of economics? Which of the following decisions would entail the greater opportunity cost: Allocating a square block in the heart of New York City for a surface parking lot or allocating a square block at the edge of a typical suburb for such a lot? Explain. LO1
Answer
An opportunity cost is what was sacrificed to do or acquire something else. The condition of scarcity creates opportunity cost. If there was no scarcity, there would be no need to sacrifice one thing to acquire another. The opportunity cost would be much higher in New York City as the alternative uses for that square block are much more valuable than for a typical suburban city block.
Question 4
What is “utility” and how does the idea relate to purposeful behavior? LO1
Answer
“Utility” refers to the pleasure, happiness, or satisfaction gained from engaging in an activity (eating a meal, attending a ball game, etc.). It is an important component of purposeful behavior because people will allocate their scarce time, energy, and money in an attempt to gain the most utility possible.
Question 5
Cite three examples of recent decisions that you made in which you, at least implicitly, weighed marginal cost and marginal benefit. LO1
Answer
Student answers will vary but may include the decision to come to class, to skip breakfast to get a few extra minutes of sleep, to attend college, or to make a purchase. Marginal benefits of attending class may include the acquisition of knowledge, participation in discussion, and better preparation for an upcoming examination. Marginal costs may include lost opportunities for sleep, meals, or studying for other classes. In evaluating the discussion of marginal benefits and marginal costs, be careful to watch for sunk costs offered as a rationale for marginal decisions.
Question 6
What are the key elements of the scientific method, and how does this method relate to economic principles and laws? LO2
Answer
The key elements include the gathering of data (observation), the formulation of possible explanations (hypothesis), testing the hypothesis, determining the validity of the hypothesis, and repeated testing of hypotheses that have appeared to be valid in prior tests.
The scientific method is the technique used by economists to determine economic laws or principles. These laws or principles are formulated to explain and/or predict behavior of individuals or institutions.
Question 7
Indicate whether each of the following statements applies to microeconomics or macroeconomics: LO3
a. The unemployment rate in the United States was 3.7 percent in December 2018.
b. A U.S. software firm laid off 15 workers last month and transferred the work to India.
c. An unexpected freeze in central Florida reduced the citrus crop and caused the price of oranges to rise.
d. U.S. output, adjusted for inflation, grew by 3 percent in 2017.
e. Last week Wells Fargo Bank lowered its interest rate on business loans by one-half of 1 percentage point.
f. The consumer price index rose by 2.2 percent from November 2017 to November 2018.
Answer
Microeconomics examines the decision making of specific economic units or institutions. Macroeconomics looks at the economy as a whole or its major aggregates.
a. The unemployment rate in the United States was 5.1 percent in September 2015. Macroeconomics looks at the economy as a whole or its major aggregates (unemployment).
b. A U.S. software firm discharged 15 workers last month and transferred the work to India. Microeconomics examines the decision making of specific economic units or institutions (a software firm).
c. An unexpected freeze in central Florida reduced the citrus crop and caused the price of oranges to rise. Microeconomics examines the decision making of specific economic units or institutions (citrus market).
d. U.S. output, adjusted for inflation, decreased by 2.4 percent in 2014. Macroeconomics looks at the economy as a whole or its major aggregates (U.S. output).
e. Last week Wells Fargo Bank lowered its interest rate on business loans by one-half of 1 percentage point. Microeconomics examines the decision making of specific economic units or institutions (one bank).
f. The consumer price index rose by 0.2 percent from August 2014 to August 2015. Macroeconomics looks at the economy as a whole or its major aggregates (inflation).
Question 8
What are economic resources? What categories do economists use to classify them? Why are resources also called factors of production? Why are they called inputs? LO5
Answer
Economic resources are the natural, human, and manufactured inputs used to produce goods and services. Economic resources fall into four main categories: labor, land (natural resources), real capital (machines, factories, buildings, etc.), and entrepreneurs. Economic resources are also called factors of production because they are used to produce goods and services. They are called inputs because they go into a production process (like ingredients go into a bowl to make a cake), with the resulting goods and services also being referred to as output.
Question 9
Why is money not considered to be a capital resource in economics? Why is entrepreneurial ability considered a category of economic resource, distinct from labor? What roles do entrepreneurs play in the economy? LO5
Answer
Money is not considered a capital resource because money is not productive – it provides access to resources but itself does not directly contribute to the production of goods and services. Additionally, the quantity of money in circulation does not determine an economy’s productive capacity, while the amount of capital and other resources does.Doubling the amount of money in circulation does not change the economy’s physical capacity to produce goods and services.Money is, however, referred as a financial resource and financial capital, reflecting its ability to acquire real economic resources.
Entrepreneurial ability and labor are both human resources, but they perform different functions in the productive process.Entrepreneurial ability does not directly produce goods and services; it organizes the resources that do.Labor refers to the human inputs that directly engage in production.
Entrepreneurs are risk-takers:They coordinate the activities of the other three inputs for profit or loss, which is why they are called risk-takers.Entrepreneurs sometimes manage companies that they own, but a manager who is not an owner is not necessarily an entrepreneur but may be performing some of the entrepreneurial functions for the company.Entrepreneurs are also innovators, or perhaps inventors, and profits help to motivate such activities.
Question 10
Explain the typical shapes of marginal-benefit and marginal-cost curves. How are these curves used to determine the optimal allocation of resources to a particular product? If current output is such that marginal cost exceeds marginal benefit, should more or fewer resources be allocated to this product? Explain.
Answer
The marginal benefit curve is downward sloping, MB falls as more of a product is consumed because additional units of a good yield less satisfaction than previous units.The marginal cost curve is upward sloping, MC increases as more of a product is produced since additional units require the use of increasingly unsuitable resource. The optimal amount of a particular product occurs where MB equals MC. If MC exceeds MB, fewer resources should be allocated to this use The resources are more valuable in some alternative use (as reflected in the higher MC) than in this use (as reflected in the lower MB).
Question 11
Explain how (if at all) each of the following events affects the location of a country’s production possibilities curve:
a. The quality of education increases.
b. The number of unemployed workers increases.
c. A new technique improves the efficiency of extracting copper from ore.d. A devastating earthquake destroys numerous production facilities. LO6
Answer
a. Assuming better education translates into better work skills, then productivity should rise and this would shift the curve outward.
b. An increase in unemployment should not affect the location of the curve. Production moves inward, away from the curve.
c. The curve should shift outward as more production is possible with existing resources.
d. The curve should shift inward with the destruction of resources (capital).
PROBLEMS
Problem 1
Potatoes cost Janice $1 per pound, and she has $5.00 that she could possibly spend on potatoes or other items. If she feels that the first pound of potatoes is worth $1.50, the second pound is worth $1.14, the third pound is worth $1.05, and all subsequent pounds are worth $0.30 per pound, how many pounds of potatoes will she purchase? What if she only had $2 to spend? LO1
Answer
Janice will purchase potatoes until the value of potatoes is less than the cost of potatoes or until her income has been exhausted. For example, assume Janice has $5.00 to spend on potatoes or other items and the cost of a pound of potatoes is $1. Now assume the first pound of potatoes is worth $1.50 to Janice. She will purchase this pound of potatoes since the value of the pound of potatoes ($1.50) is greater than the cost ($1). If the second pound is worth $1.14 and the third pound is worth a $1.05, then Janice will purchase these as well since the value exceeds the cost of $1. If all remaining pounds are worth $0.30, then Janice will not purchase these because the value is less than the cost. So, Janice will purchase 3 pounds of potatoes at total cost of $3.00.
Now assume Janice only has $2.00 to spend on potatoes. She will purchase the first pound because it is worth $1.50 to her and it only costs a $1. She will purchase the second pound because it is worth $1.14. She has now spent her entire income on potatoes. She would like to purchase the third pound because the value of this pound of potatoes is $1.05, but she does not have the income to make this purchase. So, Janice will purchase 2 pounds of potatoes at a total cost of $2.00.
Problem 2
Pham can work as many or as few hours as she wants at the college bookstore for $12 per hour. But due to her hectic schedule, she has just 15 hours per week that she can spend working at either the bookstore or multiple other potential jobs. One potential job, at a café, will pay her $15 per hour for up to 6 hours per week. She has another job offer at a garage that will pay her $13 an hour for up to 5 hours per week. And she has a potential job at a daycare center that will pay her $11.50 per hour for as many hours as she can work. Assume that the travel time between job locations is negligible. If her goal is to maximize the amount of money she can make each week, how many hours will she work at the bookstore? LO1
Answer
Feedback: Pham will choose to work at the bookstore as long as the wage rate at the bookstore exceeds her other opportunities. However, if another job offers a higher wage rate she will choose employment there.She will work until her total time allotment (for work) is exhausted. She will choose to work at the café for the full 6 hours because the wage rate at the café is $15 per hour, which is greater than the wage rate at the bookstore of $12. This leaves her with 9 hours of work time remaining. Next, she will choose to work at the garage for the full 5 hours because the wage rate here is $13, which again is greater than the bookstore wage rate $12. After this decision she only has 4 hours of work time remaining. She will choose to work these last 4
hours at the bookstore because the bookstore wage rate of $12 exceeds the daycare center wage rate of $11.50.
Problem 3
Suppose you won $15 on a lotto ticket at the local 7-Eleven and decided to spend all the winnings on candy bars and bags of peanuts.Candy bars cost $0.75 each while bags of peanuts cost $1.50 each. LO4
a. Construct a table showing the alternative combinations of the two products that are available.
b. Plot the data in your table as a budget line in a graph. What is the slope of the budget line? What is the opportunity cost of one more candy bar? Of one more bag of peanuts? Do these opportunity costs rise, fall, or remain constant as additional units are purchased?
c. Does the budget line tell you which of the available combinations of candy bars and bags of peanuts to buy?
d. Suppose that you had won $30 on your ticket, not $15. Is the slope of a new budget line flatter, steeper, or the same as in the diagram above? .Has the number of available combinations increased or decreased? Answer
Feedback: The slope for the budget line above, with candy bars on the horizontal axis, is -0.5 (− Pcb /Pbp or − 0.75/1.5). The opportunity cost of one candy bar is 0.5 bags of peanuts. Note that the figure could also be drawn with bags of peanuts on the horizontal axis.The slope of that budget line would be -2. The opportunity cost of one more candy bar is ½ of a bag of peanuts.The opportunity cost of one more bag of peanuts is 2 candy bars.These opportunity costs are constant.They can be found by comparing any two of the consumption alternatives for the two goods.
Part c: No; it only tells you what is possible.
Feedback: The budget line does not tell you which of the available combinations of candy bars and bags of peanuts to buy. You will need to use your preference relationship for candy bars and bags of peanuts to determine which combination to buy. The budget line only tells you which combinations are feasible.
Part d: Increased.
$15
Feedback: An increase in income will cause a parallel shift outward. The slope is the same. The budget line at $30 includes greater quantities of both goods and is preferable to the original budget line.
Problem 4
Suppose that you are on a desert island and possess exactly 20 coconuts. Your neighbor, Friday, is a fisherman, and he is willing to trade 2 fish for every 1 coconut that you are willing to give him. Another neighbor, Kwame, is also a fisherman, and he is willing to trade 3 fish for every 1 coconut. LO4
a. On a single figure, draw budget lines for trading with Friday and for trading with Kwame. (Put coconuts on the vertical axis.)
b. What is the slope of the budget line from trading with Friday (coconuts for fish)?
c. What is the slope of the budget line from trading with Kwame (coconuts for fish)?
d. Which budget line features a larger set of attainable combinations of coconuts and fish?
e. If you are going to trade coconuts for fish, would you rather trade with Friday or Kwame?
b. The slope of the budget line from trading with Friday equals –(1/2). This implies that for every coconut you give up, Friday must give up two fish. Or, for every fish that Friday gives up, you must give up (1/2) of a coconut.
c. The slope of the budget line from trading with Kwame equals –(1/3). This implies that for every coconut you give up, Kwame must give up three fish. Or, for every fish that Kwame gives up, you must give up (1/3) of a coconut.
d. The budget line from trading with Kwame features a larger set of attainable combinations of coconuts and fish. Because Kwame is willing to give up one more fish per coconut, you can consume more of both goods (assuming you make a trade). This implies that you would prefer to trade with Kwame.
e. Because Kwame is willing to give up more fish per coconut, you can consume more of both (assuming you make a trade). This implies that you would prefer to trade with Kwame.
Problem 5
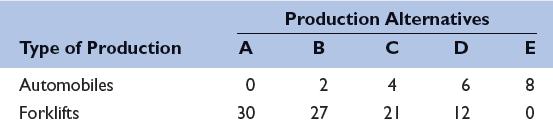
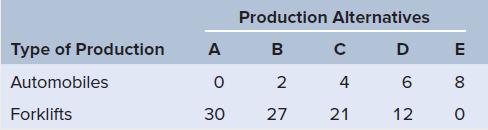
Below is a production possibilities table for consumer goods (automobiles) and capital goods (forklifts): LO5
a. Show these data graphically. Upon what specific assumptions is this production possibilities curve based?
b. If the economy is at point C, what is the cost of one more automobile? Of one more forklift? Which characteristic of the production possibilities curve reflects the law of increasing opportunity costs: its shape or its length?
c. If the economy characterized by this production possibilities table and curve is producing 3 automobiles and 20 forklifts, what could you conclude about its use of its available resources?
d. Is production at a point outside the production possibilities curve currently possible? Could a future advance in technology allow production beyond the current production possibilities curve? Could international trade allow a country to consume beyond its current production possibilities curve?
Answer
Part a: (See figure below.) The assumptions are full employment, fixed supplies of resources, fixed technology and two goods.
(12,6)
(21,4)
(27,2)
Part b: 4 automobiles and 21 forklifts; its shape.
Feedback: Consider the following example:
Assume the economy is producing at point C.Thus, the economy is producing 4 automobiles and 21 forklifts.
The cost of producing 2 more automobile (4 automobiles to 6 automobiles) can be found by moving to point D and calculating the number of forklifts given up for the 2 additional automobiles. At point D the economy is producing 12 forklifts, which is a loss of 9 forklifts (moving from C to D) for the 2 additional automobiles.
The cost of producing one more forklift can be found in an equivalent fashion. First, we will move to point B (from point C). Here we must give up 2 automobiles to get 6 forklifts. T.
Increasing opportunity cost implies that we must give up more of a particular good to get an additional unit of a different good. This implies as we move along the production possibilities curve (from left to right) I must give up more automobiles to get an additional forklift. Thus, the SHAPE of the schedule captures the increasing opportunity cost concept.
This production possibilities curve assumes that resources are not perfect substitutes and therefore there in an increasing opportunity cost. Increasing opportunity cost implies that we must give up more of a particular good to get an additional unit of a different good. This implies as we move along the production possibilities curve (from left to right), we must give up more automobiles to get an additional forklift. Thus, the shape of the schedule captures the increasing opportunity cost concept.
Part c: Underutilizing.
Feedback: The economy is underutilizing resources (inside the PPC).
Part d: No; Yes; Yes.
Feedback: No, the country cannot produce outside its PPC. Yes, a technological advance would shift the PPC outward allowing the country produce more with a given amount of inputs. Yes, by specializing in goods we have a comparative advantage producing we can trade to gain access to goods beyond our own PPC.
Problem 6
Referring to the table in problem 5, suppose improvement occurs in the technology of producing forklifts but not in the technology of producing automobiles. Draw the new production possibilities curve. Now assume that a technological advance occurs in producing automobiles but not in producing forklifts. Draw the new production possibilities curve. Now draw a production possibilities curve that reflects technological improvement in the production of both goods. LO6
CHAPTER ONE LIMITS, ALTERNATIVES, AND CHOICES
CHAPTER OVERVIEW
This chapter begins with a discussion of the meaning and importance of economics. In this first chapter, however, we will not plunge into problems and issues; instead, we consider some important preliminaries. We first look at the economic perspective how economists think about problems. Second, we examine economists’ use of the scientific method to investigate economic behavior and the economy, and distinguish between microeconomics and macroeconomics. Finally, we explore the fundamental economic problem facing both individuals and societies, including the economics of pandemics, brought to the fore by the COVID-19 pandemic, and develop the budget line, production possibilities model, and marginal benefit/cost analysis to examine resource allocation decisions.
The appendix at the end of the chapter provides an introduction to graphical analysis. Although this will be review material for most students, for some this may be new. Instructors are strongly urged to confirm that their students understand this section before proceeding. The software supplement can provide effective remedial help for those students who are not familiar with graphical analysis, or just a refresher.
WHAT’S NEW
• At the beginning of each chapter, the learning objectives have been modified to reflect tasks students should be able to complete.
• A new “Applying the Analysis” addresses how Facebook, which doesn’t charge its users, makes money.
• An “Applying the Analysis” that focuses on the COVID-19 pandemic and production possibilities has been added
• Investment levels in selected countries are compared in a new Global Snapshot.
• References in graphs, tables, questions, and problems have been updated to reflect the most current data available.
LEARNING OBJECTIVES
After reading this chapter, students should be able to:
1. Define economics and the features of the economic perspective. (LO 1-1)
2. Describe the role of economic theory in economics. (LO 1-2)
3. Distinguish microeconomics from macroeconomics. (LO 1-3)
4. Explain the individual’s economizing problem and illustrate trade-offs, opportunity costs, and attainable combinations with budget lines.. (LO 1-4)
5. List the categories of scarce resources and explain society’s economizing problem. (LO 1-5)
6. Apply production possibilities analysis. (LO 1-6)
7. (Chapter appendix) Understand graphs, curves, and slopes as they relate to economics. (LO 1-7)
COMMENTS AND TEACHING SUGGESTIONS
1. This chapter and related classroom activities will set the tone for the rest of the course. The methods used in the initial class meetings set the expectations and attitudes of the students. Making dramatic changes later can be confusing and the outcome less successful than desired. If you plan to make current events an integral part of the class, consider offering educational subscriptions to the Wall Street Journal or one of the weekly news or business publications such as the Economist. Also, our ECON Everyday blog saves you time by providing current, student-centered content all
1-1 Chapter 01
Limits, Alternatives, and Choices
semester long. Short articles, written for principles-level students, are tagged by topic; in addition, discussion questions are provided. The blog is found at www.econeveryday.com.
2. Current news articles can help students understand and apply basic economic principles. Have students bring in a printout of an online news article or a recent newspaper clipping that relates to an economic principle or concept you are covering. Allow a few minutes of discussion per article, depending on how many articles are brought in. You may even want to require students to keep a journal of economic news events each week. At the end of the term, have students summarize what they have learned by incorporating the news articles they have collected.
3. On the level of personal decision making, students might be asked to list some of the economic choices they had to make that day or that week. This impresses upon them that, as Alfred Marshall said in the 1890s, “economics is the study of man in the ordinary business of life.” To illustrate the purposeful basis of their decisions, students could analyze one or two of these choices in terms of the alternatives they gave up. What other choices did they have? What criteria were used to judge the alternatives? A discussion of how rational our decisions are might also follow, providing an opportunity to introduce problems such as imperfect information and short- versus long-term objectives.
4. To personalize the concept of opportunity cost, ask what else they could be doing during a specific economics class; what are their forgone alternatives? Why might it be more expensive for older students to attend the class than younger ones? Encourage students to find examples of opportunity cost in newspaper articles and magazines. Choice is a necessary part of life; every action has its costs and benefits. Identifying and quantifying these trade-offs is at the heart of economic analysis. You may also want to use the following illustration to facilitate student understanding of opportunity cost.
Concept Illustration Opportunity Cost
The concept of opportunity cost can be illustrated through the eyes of a small child. Suppose that a young girl named Amber receives a $30 gift certificate from her grandparents to be used at Toys4Me. The grandparents take the girl to the store, where she spots several toys she would like all priced above $30. After gaining a sense of what is affordable, Amber narrows her focus to small stuffed animals ($10 each) and picture books ($5 each).
The grandparents tell Amber that she can buy three stuffed animals, six books, or some limited combinations of the two items. She initially settles on one stuffed animal at $10 and four picture books at $5 each. The grandparents assure her that this selection works; it will exactly use up the $30 certificate. Amber takes the goods to the checkout counter.
But while waiting to pay, she changes her mind. She decides she wants another stuffed animal because they are so cute. What should she do? The grandparents tell her to go pick out a second stuffed animal and then return two of her four books to the shelf. She makes the exchange, ending up with two stuffed animals at $10 each and two picture books at $5 each.
From an adult’s perspective, the second stuffed animal cost $10. But in the eyes of the child, it cost two picture books. To get the second stuffed animal, Amber had to give up two books. That sacrifice was the opportunity cost of her last-minute decision. Amber’s way of looking at cost is one of the fundamental ideas in economics.
5. Read the following poem to the students (or have them read it on their own) and discuss how it relates to the concepts of choice and forgone opportunities. Robert Frost describes coming to a crossroads in the woods and choosing the road less traveled that “made all the difference.” You can open up discussion by asking students if the traveler made the right choice. What was the trade-off or best alternative forgone? Is the choice rational? What do you need to know before making a choice? Use this exercise to help students understand that some choices are not easy to make, especially when there is not enough information given, and that once a choice is made, we must accept the consequence or outcome.
Concept Illustration Opportunity Cost
“Two roads diverged in a yellow wood, And sorry I could not travel both And be one traveler, long I stood And looked down one as far as I could To where it bent in the undergrowth;
Then took the other, as just as fair, And having perhaps the better claim, Because it was grassy and wanted wear; Though as for that, the passing there Had worn them really about the same,
And both that morning equally lay In leaves no step had trodden black. Oh, I kept the first for another day! Yet knowing how way leads on to way, I doubted if I should ever come back.
I shall be telling this with a sigh Somewhere ages and ages hence: Two roads diverged in a wood, and I I took the one less traveled by, And that has made all the difference.”
Robert Frost
The Road Not Taken, 1915
6. There are many dimensions to the topic of “utility” that introductory students will benefit from contemplating. With these many dimensions comes the danger in taking students too deep too quickly. It is useful for students to understand that utility may be obtained both through material and nonmaterial means. Accordingly, it may be difficult to express how much one is willing to pay (or otherwise sacrifice) to obtain utility through a given activity.
When discussing purposeful (rational) behavior, and seemingly irrational decisions, it may be useful to point out that for some people their utility is interdependent. You can have a bit of fun telling students that economists define love as “strongly interdependent utility functions.” The main point, of course, is that there are many situations in which people obtain utility through seeing others having material and nonmaterial wants satisfied. Likewise, some gain utility from watching others suffer, even if it means that they are themselves worse off in material terms. One could
mention Gary Becker’s theory of employer taste for discrimination, where a utility-maximizing discriminatory employer sacrifices profits to maximize utility.
If a question arises about the measurement of utility, the distinction between cardinal and ordinal utility can be made, but there is little to be gained from an elaborate discussion. Students may find it interesting that the philosopher Jeremy Bentham envisioned some sort of “util-o-meter,” a contraption that one might strap to the head to record brain waves in an attempt to measure utility from an activity. Even suggesting that one might use “utils” as a measure of satisfaction often amuses students and helps them better recall the concept.
7. Introductory students are often eager to find exceptions to commonly accepted economic theories. Depending on time constraints and interest, you may want to address how models simplify or abstract from reality. Although this does make them more susceptible to error, it also makes them useful. Several noneconomic examples exist to illustrate the importance of models or simplification for example, explaining that a road map is an abstraction or simplification of the real world. The amount of detail on any road map would be determined by the needs of the traveler, i.e., “I need to travel between Chicago and Denver as quickly as possible,” versus, “I would like to visit some historical museums as I am traveling through Nebraska.” Neither road map would have the details of the real world. Devoting some time and effort to this point can help students see the importance of using economic models to represent the real world (as opposed to attempting to describe every economic relationship or activity in exacting detail). You may wish to share the piece below with your students to illustrate the point.
Concept Illustration Abstractions and Models
“What do you consider the largest map that would be really useful?”
“About six inches to the mile.”
“Only six inches!” exclaimed Mein Herr. “We very soon got six yards to the mile. . . . And then came the grandest idea of all! We actually made a map of the country, on a scale of a mile to the mile!”
“Have you used it much?” I enquired.
“It has never been spread out, yet,” said Mein Herr. “The farmers objected: they said it would cover the whole country and shut out the sunlight!”
Lewis Carroll Sylvie and Bruno, 1889
In many ways, good economic models are like good maps. Both are abstractions that purposely leave out irrelevant facts and circumstances. Both are useful and practical because they simplify complex realities.
Maps not only help us understand geographical relationships but also serve as useful tools. A road map of the United States, for instance, helps us understand where Connecticut is located relative to California. It also is highly practical in helping us drive between Indiana and Idaho.
In much the same way, economic models are helpful and useful. For example, a model indicating how consumers respond to a change in a product’s price helps us understand a significant facet of human behavior. That model also is highly practical. Among other things, it identifies the primary way a business can reduce an overstock of unsold goods.
The appropriate map or appropriate economic model is the simplest one that accomplishes a specific goal. Although we may need a highly detailed street map of Cleveland to find a specific residence there, we need only a general road map to drive between Cleveland and Columbus. Similarly, we need a highly complex, detailed economic model to predict the economic effects of a general reduction of U.S. tariffs (taxes on imported goods) on the relative outputs of various U.S. industries. In contrast, a much simpler model will suffice to show how a reduced U.S. tariff on imported beef will affect the total consumption of beef in the United States.
You will discover many economic models in your study of economics. The trick is to use the right model for the right purpose. Think of these models as highly useful, highly practical “maps,” which help us better understand elements of the highly complex economy.
8. The section on theory, principles, and models can be used to explain what economists do when employed in both the private and public sectors. Economists may be asked by their railroad employer to determine how the company should best allocate its boxcars, or a legislative aide may be asked to research the effects of a state’s current welfare-to-work program.
9. The marginal benefit equals marginal cost rule is one that economics majors and minors will see repeatedly over their course of study. The centrality of the concept should be emphasized and reinforced with additional examples. You may want to use examples that lead them to the corollary rule of marginal revenue equal to marginal cost (that they will see later in the text).
10. The problems of underdeveloped countries could also be used to illustrate the seriousness of choosing between capital goods and consumer goods. Focusing a project on the problems of a single developing country can be interesting. It would allow students to make many comparisons including the impact of differing economic systems, degree of government regulation, environmental quality standards, differences in resource availability, climate, educational levels, and the choice between consumer and capital goods.
STUDENT STUMBLING BLOCKS
1. Instructors cannot take for granted students’ background knowledge of economics. Students generally have no idea about the magnitude of common economic measurements and, therefore, their reading of the news may be colored by this lack of knowledge. One teaching tip that has worked for others is to give students a pretest during the first week of class, in which simple questions are asked about the U.S. economy. For example, questions can be asked about the size of population and labor force, unemployment and inflation rates, GDP, federal budget, deficits and debt. You will find wildly different answers to these questions with most far away from “ballpark” figures. This exercise accomplishes two things. First, it lets students know that they have a lot to learn about “everyday” news items. Second, the correct answers can give them some early perspective on news events as they relate to the course. As the course progresses, don’t forget to reinforce these facts by reminding students of them.
2. The specialized definitions in economics sometimes frustrate students, especially when they are familiar with a term in a different context. You may wish to use the following piece to help students appreciate that specialized definitions are common in our everyday lives.
Concept Illustration Specialized Definitions
“Then you should say what you mean,” the March Hare went on.
“I do,” Alice hastily replied; “at least at least I mean what I say that’s the same thing you know.”
“Not the same thing a bit!” said the Hatter. “Why, you might just as well say that ‘I see what I eat’ is the same thing as ‘I eat what I see!’”
Lewis Carroll, Alice in Wonderland, 1865
In an indirect way, the specialized terms used in games such as soccer, baseball, and bowling provide insights on the study of economics. Consider the game of pool, for example. The following terms are used in pool but have slightly or totally different meanings in everyday language: “pool,” “cue,” “ kiss,” “bank,” “bridge,” “combination,” “break,” “lag,” “run,” “rack,” “scratch,” “chalk,” and “rail.” Economics, too, uses terms that have different meanings than in everyday usage. In economics “labor” usually means all productive effort, not simply blue-collar workers; “capital” means human-made productive resources, not money used to buy resources. Also, “investment” means purchase of capital goods, not purchases of stocks and bonds; “public good” means goods that have special characteristics, not the good of society; and so forth.
Learning to communicate in the game of pool (or any other game) requires learning the meaning of specialized terms. It’s the same with economics! It is not enough to “mean what you say,” in economics. To communicate effectively (and to do well on exams!) you must “say what you mean,” using the precise terms of the discipline.
3. Principles of economics students are often frustrated by the apparent lack of precision and definitive answers in the discipline. Such students are not alone in their frustration. President Harry S. Truman is quoted as saying “Give me a one-handed economist!” Truman was frustrated with his economic advisers providing multiple perspectives rather than definitive answers. Economists establish a framework of purposeful (or rational) decision making based on maximizing utility, only to have that utility be immeasurable, or decision outcomes to be less than optimal because of imperfect information or seemingly irrational behavior. It is important to help students understand that, among other things, they are gaining more of an analytical tool kit than a set of hard-and-fast rules or immutable natural laws. To help students appreciate this, it is useful to appeal back to the road map illustration. Using a road map, one can find the shortest (and presumably fastest) route from one point to another. Even if someone has driven a route many times, there are factors such as traffic, weather, and road construction that may cause the otherwise quickest route to be less than ideal for that day’s travel. Maps, like economic models, are often effective at telling people what they need to know. They are, however, limited in their effectiveness by factors beyond view.
4. Students sometimes question how “labor” and “entrepreneurship” differ. Some students may also be familiar with the term “human capital” although this term is not explicitly discussed in the text. Provide numerous examples to help students understand the differences. Bill Gates, Coco Chanel, Sam Walton, Oprah Winfrey, Michael Dell, and Walt Disney are great examples of entrepreneurs. While labor represents the effort of individuals to produce goods and services, human capital is the accumulated knowledge, skill, and experience of the labor force.
5. In the discussion of marginal analysis, students often bring up examples that include “sunk” costs. For example, if you ask students why they came to class, many will answer that they paid tuition and imply that they would somehow lose that money if they didn’t attend. If probed further, however, students will acknowledge that the college is unlikely to refund their money for any
1-6 Chapter 01 - Limits, Alternatives, and Choices
missed classes. That doesn’t mean there wouldn’t be future expenditures (paying tuition later to retake a failed class). It also doesn’t mean that there aren’t some psychological benefits to “getting what you paid for,” but many students will erroneously identify that tuition payment as a marginal cost of attending a given day of class. Although your intention may be to discuss sunk costs in a later chapter, student questions and discussion may require you to be prepared to introduce the concept earlier. Many students, even those in more advanced courses, frequently make the mistake of assuming that marginal benefits and/or marginal costs are always constant. One could use the low-hanging fruit principle in an example to illustrate the general principle of increasing marginal cost.
6. The “Applying the Analysis” on the economics of pandemics, particularly the COVID-19 outbreak that began in 2020, may elicit emotional and/or politically charged responses from students. While one must be sensitive, it presents an opportunity to demonstrate how economists attempt to detach their emotional and political biases to achieve a more objective economic analysis. It is also an opportunity to point out that the usual role of the economist is to tell us what choices are available, and the opportunity cost of those choices, not what choices should be made.
7. The production possibilities curve simplifies many concepts for students who don’t have “graph anxiety.” For those who are uncomfortable with graphs, however, this model may confuse rather than simplify. Computerized tutorials will be especially helpful for these students.
8. The appendix on graphical analysis is a useful supplement for those students who have weak backgrounds in reading or constructing simple graphs. There is often a wide disparity among student abilities here. You may wish to have a remedial session and special assignments for students deficient in graphing skills. Comparing graphs to maps seems to help students who have “graph anxiety.”
LECTURE NOTES
I. Definition of Economics
A. The social science that studies how individuals, institutions, and society make optimal choices under conditions of scarcity.
B. Human wants far exceed the ability (limited resources) to satisfy them.
II. The Economic Perspective
A. Scarcity and Choice
1. Resources can be used for only one purpose at a time.
2. Scarcity requires that choices be made.
3. The cost of any good, service, or activity is the value of what must be given up to obtain it. This is known as the opportunity cost.
B. Applying the Analysis: Is Facebook Free?
1. Facebook gives away its product free to more than 2 billion users.
2. Facebook covers its costs by charging advertisers.
3. If you are consuming a good or service and not paying for it, the cost is being borne by someone else.
4. Facebook grants users free access to its platform to make sure that it has as many “eyeballs” as possible to sell to advertisers.
C Illustrating the Idea: Did Zuckerberg, Seacrest, and Grande Make Bad Choices?
1. On average, college graduates earn almost twice as much as those with just high school diplomas.
2. Mark Zuckerberg, Ryan Seacrest, and Ariana Grande all gave up college to pursue their careers, each believing he or she could earn more by forgoing or delaying college.
3. Differences in opportunity costs help explain why people make different choices.
D. Purposeful Behavior
1. Rational self-interest entails making decisions to achieve maximum utility.
2. Individuals weigh costs and benefits in an effort to reach decisions that will maximize their satisfaction.
3. Purposeful (or rational) behavior does not preclude bad decisions from faulty logic, emotion, or the decisions of others
4. Rational self-interest is not the same as selfishness.
E. Marginal Analysis: Comparing Benefits and Costs
1. Most decisions concern a change in current conditions; therefore, the economic perspective is largely focused on marginal analysis.
2. Each option considered weighs the marginal benefit against the marginal cost, in which “marginal” means “extra,” “additional,” or “a change in.”
3. Whether the decision is personal or one made by business or government, the principle is the same.
4. The marginal cost of an action should not exceed its marginal benefits.
5. Marginal costs are also always opportunity costs.
F Applying the Analysis: Fast-Food Lines
1. People choose the shortest line to reduce time cost.
2. Lines tend to have equal lengths as people shift from longer to shorter lines in an effort to save time.
3. Lines are chosen based on length without much other information cost of obtaining more information is not worth the benefit.
a. Imperfect information may lead to an unexpected wait.
b. Imperfect information may cause some people to leave when they see a long line.
4. When a customer reaches the counter, other economic decisions are made about what to order. These choices are all purposeful, made after the consumer compares the costs and benefits of possible choices.
III. Theories, Principles, and Models
A. Economists use the scientific method to establish theories, laws, and principles.
1. The scientific method consists of:
a. The observation of facts (real data).
b. The formulations of explanations of cause-and-effect relationships (hypotheses) based on the facts.
c. The testing of the hypotheses.
d. The acceptance, rejection, or modification of the hypotheses.
e. Continued testing of a hypothesis, leading to determination of a theory, law, principle, or model.
2. Principles are purposeful simplifications used to explain and/or predict the behavior of individuals and institutions.
3. Terminology Principles, laws, theories, and models are all terms that refer to generalizations about economic behavior. They are used synonymously in the text, with custom or convenience governing the choice in each particular case.
4. Generalization Economic principles are expressed as the tendencies of the typical or average consumer, worker, or business firm.
5. “Other things equal” or ceteris paribus assumption To judge the effect one variable has on another, it is necessary to hold other contributing factors constant. Natural scientists
1-8 Chapter 01 - Limits, Alternatives, and Choices
can test with much greater precision than can economists. They have the advantage of controlled laboratory experiments. Economists must test their theories using the real world as their laboratory.
6. Graphical expression many economic relationships are quantitative, and are demonstrated efficiently with graphs.
IV. Microeconomics and Macroeconomics
A. Microeconomics looks at specific economic units.
1. It is concerned with decision making by individual consumers, households, and business firms. The detail of their behavior is observed and analyzed.
2. It is an examination of the sand, rocks, and shells, not the beach.
B. Macroeconomics examines the economy as a whole.
1. It includes measures of total output, total employment, total income, aggregate expenditures, and the general price level aggregates.
2. It is a general overview examining the beach, not the sand, rocks, and shells.
V. Individuals’ Economic Problem
A. All individuals and societies face the economic problem of economic wants exceeding economic means
1. The means to satisfy wants (time, money, resources) are limited (scarce).
2. An individual’s income is finite and comes in the form of wages, rent, interest, and profit.
3. Economic wants are unlimited and include both necessities (food, shelter, clothing) and luxuries (diamonds, caviar, yachts).
B. Budget Line (Figure 1.1)
1. An individual’s income limits can be represented graphically with a budget line (or budget constraint).
2. It shows the various combinations of two goods a consumer can purchase with a specific money income, given the products’ prices.
3. Combinations on or inside the budget line are attainable.
4. Combinations beyond the budget line are unattainable.
5. The negative slope of the budget line represents the opportunity cost (trade-off) of one good in terms of the other.
6. The constant slope indicates constant opportunity cost the trade-off is unchanged whether buying the first or last possible unit of a good.
7. The budget constraint forces people to choose, weighing marginal benefits and marginal costs to maximize satisfaction.
8. Increases in income shift the budget line to the right, allowing the consumer to buy more.
VI. Society’s Economic Problem
A. Scarce resources
Economic resources are limited relative to wants.
B. Resource categories
1. Economic resources refer to all natural, human, and manufactured resources used in the production of goods and services.
2. Economic resources are sometimes called factors of production and include four categories:
a. Land or natural resources.
b. Labor or human resources, which include physical and mental activities that people contribute to the production of goods and services.
c. Capital or capital goods that are all manufactured aids to production such as factory, storage, transportation, and distribution facilities, as well as tools and machinery.
d. Entrepreneurial ability A special kind of human resource that provides four important functions:
i. Takes initiative to combine resources needed for production.
ii. Makes strategic business policy decisions.
iii. Innovates to commercialize new products, production techniques, and organizational forms.
iv. Bears the risk of time, effort, and funds.
VII. Production Possibilities Model
A. Assumptions:
1. Economy is employing all available resources (full employment).
2. Available supply of resources is fixed in quantity and quality at this time.
3. Technology is constant during analysis.
4. Economy produces only two types of products:
a. Consumer goods satisfy wants directly, and
b. Capital goods indirectly satisfy wants by aiding production of consumer goods.
B. Production Possibilities Table (Figure 1.2)
1. Lists the combinations of consumer and capital goods that can be produced given a set of resources and technology, and assuming full employment.
2. Choices now affect future production possibilities by forgoing more now, society can have much more later.
C. Production Possibilities Curve (Figure 1.2)
1. The production possibilities curve is a graphical representation of the constraints, analogous to the individual’s budget line.
2. Points on the curve represent maximum possible combinations of manufacturing equipment and food products given resources and technology.
3. Points inside the curve represent underemployment or unemployment.
4. Points outside the curve are unattainable at present.
D. Law of increasing opportunity costs:
1. The amount of other products that must be sacrificed to obtain more of any given product is called the opportunity cost.
2. Opportunity costs are measured in terms of real goods rather than money (market prices are not part of the production possibilities model).
3. The more of a product produced, the greater is its (marginal) opportunity cost.
4. The slope of the production possibilities curve becomes steeper, demonstrating increasing opportunity cost. This makes the curve appear bowed out, concave from the origin.
5. Economic Rationale:
a. Economic resources are not completely adaptable to alternative uses.
b. To get increasing amounts of food products, resources not particularly well suited for that purpose must be used. Workers that are accustomed to producing manufacturing equipment on an assembly line may not do as well processing food.
E. Optimal allocation:
1. It will be some point on the curve.
2. Society will receive maximum satisfaction at the combination where marginal benefit equals marginal cost (MB = MC) If MB > MC, the activity should increase to the point where MB = MC. If MB < MC, the activity should decrease to the point where MB = MC.
3. Graphically, the optimal allocation occurs where the marginal benefit curve and marginal cost curve intersect (at 200,000 units of food in Figure 1.3, alternative C on Figure 1.2).
VIII. Unemployment, Growth, and the Future
A. Unemployment results in an economy producing inside its production possibilities curve (point U in Figure 1.4). This requires dropping the assumption of full employment.
B. An outward shift of the production possibilities curve allows an economy to grow (Figure 1.5).
1. Increasing resource supplies (labor force, stock of capital) shifts the curve out, increasing the potential output of all goods.
2. Improved quality of resources (better-educated labor force) increases production possibilities.
3. Advances in technology allow an economy to produce more with a given supply of resources, and are represented by an outward shift of the curve.
C. Applying the Analysis: The Economics of Pandemics
1. Production possibilities analysis can be used to assess the costs and benefits of battling a pandemic
2. By categorizing goods as “pandemic goods” and “other goods,” goods may be measured on the axes of a production possibilities diagram.
3. The marginal benefits and marginal costs framework applied to additional pandemic goods is a useful way of approaching costs.
4. Pandemics reduce the ability of an economy to produce and adversely affect production possibilities.
D Applying the Analysis: Information Technology and Biotechnology
1. Advances in computer technology have reduced their cost and increased their speed.
2. Software improvements have expanded the capabilities (production possibilities) of computers.
3. Cellular phones and the Internet have improved communication, reducing costs and expanding production capabilities.
4. Biotechnology advances have improved production in agriculture and medicine.
E. Present Choices and Future Possibilities
1. Present choices about consumer and capital goods affect future production possibilities.
2. Presentville’s decision to produce more goods for the present (consumer goods) and fewer goods for the future (capital) will result in a smaller outward shift than Futureville’s decision to produce more capital (Figure 1.6).
IX. Appendix: Graphs and Their Meaning
A. Graphs help to visualize and understand economic relationships.
B. Construction of a graph
1. The independent variable or determining factor is represented on the horizontal axis while the dependent variable is represented on the vertical axis.
2. The axes are marked using convenient increments and fit the data given (Figure 1).
3. Each point within the graph represents two pieces of information, the quantity of the variable on the horizontal, or x-axis and the corresponding quantity of the variable on the vertical, or y-axis (Figure 1).
C. Direct and inverse relationships
1. If two variables change in the same direction (an increase in one is associated with an increase in the other), it is a direct or positive relationship (Figure 1).
2. If the two sets of data move in opposite directions, they are inversely or negatively related (Figure 2).
D. Dependent and independent variables
1. Economists are often interested in determining which variable is the “cause” and which the “effect.”
2. Mathematicians place the independent variable (cause) on the horizontal axis and the dependent variable (effect) on the vertical axis.
3. Economists’ graphing of independent and dependent variables is more arbitrary; historically they put price or cost data on the vertical axis.
E. Other things equal
1. Economists employ the ceteris paribus rule when constructing graphs because of the limitations of only easily being able to graph in two dimensions.
2. All other factors that may influence the relationship between the two variables considered are presumed constant. If any of these other factors changes, a new plot of the relationship must be made because the functional relationship between the dependent variable and graphed independent variable has changed.
F. Slope of a line
1. The slope of a straight line is the ratio of the vertical change to horizontal change between any two points on the line.
2. Positive slope: both variables change in the same direction (a positive or direct relationship).
3. Negative slope: both variables change in the opposite direction (an inverse or negative relationship).
4. Economic analysis is often concerned with marginal changes, the relative change in one variable with respect to another; the slope measures the rate of change.
5. Lines that are parallel with either the horizontal or vertical axis indicate that the two variables are unrelated, that is, a change in one variable has no effect on the value of the other.
a. A vertical line has an infinite slope (Figure 3a).
b. A horizontal line has a zero slope (Figure 3b).
6. The slope of a nonlinear curve changes from one point to another (Figure 4).
a. A straight line that is tangent to a curve at a specific point can be used to measure the slope at that point.
b. The curve has a different slope (a different tangent line) at each specific point.
c. The flatter the part of the curve, the less negative is the slope.
QUIZ
1. Economics is a social science concerned with:
A. How individuals, institutions, and society make choices under conditions of scarcity.
B. Increasing the level of productive resources so there is a minimum level of income
C. Increasing the level of productive resources so there is maximum output in society
D. The best use of scarce resources paid for at the minimum level of cost to consumers and businesses
Answer: A
2. A person should consume more of something when its marginal:
A. Benefit exceeds its marginal cost.
B. Cost exceeds its marginal benefit.
C. Cost equals its marginal benefit.
D. Benefit is still positive.
Answer: A
3. The process of developing hypotheses, testing them against facts, and using the results to construct theories is called:
A. Opportunity cost calculation.
B. Microeconomics
C. Marginal analysis.
D. The scientific method.
Answer: D
4. Which is an illustration of a microeconomic question?
A. What is the current national rate of unemployment?
B. Is the economy experiencing a decline in the rate of inflation?
C. Will a new type of television set increase the number of buyers?
D. Is the production of goods and services in the economy greater this year than last year?
Answer: C
5. A schedule or curve that shows the various combinations of two products a consumer can purchase with a specific amount of money income is:
A. A trade-off
B. A budget line.
C. A tangent point
D. A production possibilities line.
Answer: B
6. Which of the following is real capital?
A. A pair of stockings
B. A construction crane
C. A savings account
D. A share of IBM stock
Answer: B
7. A point inside a production possibilities curve best illustrates:
A. Unemployment.
B. The efficient use of resources.
C. The use of best-available technology.
D. Unlimited wants.
Answer: A
8. A normative statement is one that:
A. Is based on the law of averages.
B. Applies only to microeconomics.
C. Applies only to macroeconomics.
D. Is based on value judgments.
Answer: D
9. The problems of aggregate inflation and unemployment are:
A. Major topics of macroeconomics.
B. Not relevant to the U.S. economy.
C. Major topics of microeconomics.
D. Peculiar to command economies.
Answer: A
10. On a production possibilities curve, the single optimal or best combination of output for any society:
A. Is at a point near the top of the curve.
B. Is at the precise midpoint of the curve.
C. Is at a point near the bottom of the curve.
D. Depends on the preferences of society.
Answer: D