Test Bank for Data
ISBN: 9781266637759
Corret Answers are located at the end of each chapter.
CHECK ALL THE APPLY. Choose all options that best completes the statement or answers the question.
1) How does Anscombe’s Quartet illustrate the importance of visualizations?
Note: Select all that apply.
A) It shows that different datasets can have the same statistical properties but look very different when graphed.
B) It demonstrates that visualizations can reveal patterns that are not evident in raw data.
C) It provides an example of how statistical analyses can be misleading without visual context.
D) It suggests that visualizations are always more accurate than statistical descriptions.
2) Analyze the reasons why data visualizations are preferred over tables and text in conveying information.
Note: Select all that apply.
A) Visualizations can quickly convey complex information.
B) They are more engaging for viewers.
C) Visualizations always provide more accurate data.
D) They eliminate the need for any written explanation.
3) Select all the correct statements about data visualizations.
Note: Select all that apply.
A) Data visualizations are part of the information value chain.
B) Data visualizations are a tool for preparing the data.
C) Data visualizations are a tool for recording data transactions.
D) Data visualizations are graphical representations that present information to decision makers.
4) Identify the correct uses of visualizations in data analytics.
Note: Select all that apply.
A) Explanatory visualizations are used to communicate results to decision-makers.
B) Diagnostic visualizations are used to master the data.
C) Exploratory visualizations are used to perform analysis.
D) Prescriptive visualizations are used to communicate results to decision-makers.
5) Which of the following charts is generally considered the best way to show proportions or composition of values?
Note: Select all that apply.
A) Bar charts
B) Scatter plots
C) Pie charts
D) Treemaps
MULTIPLE CHOICE - Choose the one alternative that best completes the statement or answers the question.
6) A company uses exploratory data visualizations to understand its customer demographics. They notice that the majority of their customers fall into two distinct age groups. How should these findings influence their marketing strategy?
A) Develop a single marketing campaign targeting all age groups.
B) Create targeted marketing campaigns for each age group.
C) Disregard the findings as they do not provide actionable insights.
D) Focus on the age group with the higher purchasing power.
7) Why might decision-makers prefer data visualizations over written content when evaluating business analytics results?
A) Visualizations require less effort to understand than written reports.
B) The brain processes images 60,000 times faster than it processes text.
C) Decision-makers find visualizations less engaging than written content.
D) Written reports contain more detailed information than visualizations.
8) How does Anscombe's Quartet demonstrate the significance of using data visualizations alongside statistical analysis?
A) It shows that visualizations can sometimes communicate results better than statistics.
B) It demonstrates that statistics alone are sufficient for understanding data relationships.
C) It proves that statistical analysis is irrelevant without visualizations.
D) It indicates that data visualizations are only useful for complex datasets.
9) Why are data visualizations preferred over tables and text in business analytics?
A) They require less computational power.
B) They allow for quicker processing and understanding of information.
C) They are easier to create than written reports.
D) They eliminate the need for data analysis.
10) A data scientist is analyzing a dataset with similar summary statistics but suspects there might be underlying differences in the data patterns. Which approach should the data scientist take to uncover these differences?
A) Rely solely on the summary statistics
B) Use data visualizations like scatterplots
C) Perform a deeper statistical analysis
D) Compare the datasets using text descriptions
11) In what ways can different types of data visualizations (e.g., bar charts, line graphs, scatter plots) reveal different insights from the same dataset?
A) Different types of data visualizations reveal different insights by presenting data in various formats.
B) Bar charts and line graphs reveal the same insights from a dataset.
C) Only scatter plots can show all insights from any dataset.
D) The type of data visualization does not affect the insights derived from the dataset.
12) A business analyst is evaluating two reports on customer satisfaction data. The first report uses a detailed table of survey responses, while the second uses various charts and graphs to present the same information. What is the most likely reason the second report is more effective for decision-makers?
A) It provides more detailed data.
B) It simplifies the data through visual representation.
C) It avoids the potential for statistical errors.
D) It ensures all variables are considered.
13) How can the design choices in a data visualization (e.g., color scheme, scale, data representation) impact the interpretation of the data?
A) Design choices such as color scheme and scale can significantly impact data interpretation.
B) The choice of data representation has no effect on how data is interpreted.
C) Changing the scale of a chart does not alter the interpretation of the data.
D) Only the color scheme affects the interpretation of data in a visualization.
14) How do the components of a data visualization contribute to its effectiveness in conveying information?
A) The components of a data visualization include axes, labels, colors, and legends.
B) Each component of a data visualization contributes differently to its overall effectiveness.
C) Components such as colors and labels are essential in making a data visualization effective.
D) Understanding the role of each component helps in evaluating the effectiveness of a data visualization.
15) In what way do data visualizations complement statistical analysis in business analytics?
A) Visualizations alone are sufficient to understand data relationships.
B) Statistics alone can provide all necessary insights without visualizations.
C) Visualizations and statistics together can provide a more comprehensive understanding.
D) Statistics are only useful for validating the results of visualizations.
16) A business analyst needs to explain the relationship between two variables in a dataset to a non-technical audience. Which type of data visualization should the analyst use to effectively communicate this relationship?
A) Pie chart
B) Bar graph
C) Scatterplot
D) Histogram
17) A product manager at a tech company needs to predict the future demand for a new gadget to determine the production schedule. Which step of the AMPS Analytics Model should they focus on to create accurate sales forecasts?
A) Ask the question
B) Master the data
C) Perform the analysis
D) Share the story
18) A data analyst is tasked with presenting the past year's sales performance to the executive team. They need to convey the data in an easily understandable format for decision-making. Which step of the AMPS Analytics Model is most relevant for this task?
A) Ask the question
B) Master the data
C) Perform the analysis
D) Share the story
19) A manufacturing company is using the AMPS Model to reduce production costs. They have identified the key cost drivers and collected data on production times, material usage, and labor costs. However, they discover that one of the major cost drivers, material usage, shows a decreasing trend over the past year despite stable production levels. What should their next step be?
A) Assume the decreasing trend indicates improved efficiency and proceed with the analysis.
B) Investigate the reasons behind the decreasing material usage to ensure data accuracy.
C) Ignore the trend and use average material usage data over the past years.
D) Exclude material usage from the analysis to focus on other cost drivers.
20) A business analyst is preparing a presentation for stakeholders to explain the findings from a recent sales data analysis. The stakeholders are primarily interested in understanding key trends and insights to make future business decisions. Which type of data visualization should the analyst use?
A) Exploratory data visualizations
B) Explanatory data visualizations
C) Static reports
D) Summary statistics
21) A company wants to track its daily sales performance compared to its sales targets in realtime. What type of report should the company use to ensure the data is continuously updated and accessible?
A) Static report
B) Dynamic report
C) Exploratory visualization
D) Explanatory visualization
22) A business analyst is reviewing visualizations created during an analysis of historical sales data to identify patterns in customer purchases. They have a scatterplot showing the relationship between advertising expenses and sales across various regions. What is the primary purpose of this visualization in the context of the AMPS model?
A) To communicate the findings of the analysis to stakeholders.
B) To uncover patterns in the data and understand the relationship between variables.
C) To highlight specific sales targets for the next quarter.
D) To create a static report for decision-makers.
23) During a presentation to stakeholders, a business analyst uses a dashboard that tracks performance metrics by product and state. How does this dashboard serve its purpose according to the AMPS model?
A) To explore data quality by inspecting missing values and outliers.
B) To perform initial data analysis and spot anomalies.
C) To communicate the analysis results and support decision-making.
D) To determine the relationship between production costs and sales.
24) A retail company wants to understand why the performance of two of its stores differs significantly. What visualization tool should the company use to identify specific areas where the performance departs most?
A) Histogram
B) Scatterplot
C) Conditional formatting
D) Pie chart
25) An analyst creates a histogram to show the distribution of loan amounts requested in different intervals. What step of the AMPS model is this visualization most likely supporting?
A) To communicate the analysis findings to stakeholders.
B) To summarize data and identify distribution patterns.
C) To create a dynamic report for real-time updates.
D) To perform predictive analysis on future loan requests.
26) A financial analyst is examining the distribution of return on equity (ROE) for firms trading on a U.S. public exchange over several years. The analyst wants to identify any anomalies in the distribution. Which type of visualization should the analyst use?
A) Scatterplot
B) Line chart
C) Histogram
D) Pie chart
27) A business analyst at a retail company needs to prepare and analyze sales data from multiple sources to identify trends and patterns. Which software tool should the analyst use primarily for data preparation, ensuring the data is ready for analysis?
A) Excel
B) Alteryx
C) Tableau Desktop
D) Power BI
28) A business analyst is deciding on a software tool for data visualization to present quarterly sales data to the executive team. The team needs clear, interactive visuals to make strategic decisions quickly. Which tool should the analyst recommend?
A) Excel
B) SQL
C) Power BI
D) R
29) A financial analyst is tasked with creating an advanced data visualization to present the quarterly performance of the company to the executive team. Which tool should the analyst use to create detailed and interactive visualizations?
A) Excel
B) Alteryx
C) Tableau Desktop
D) SQL
30) During a presentation, a data scientist uses AI-generated visualizations to demonstrate trends in sales data. However, the audience questions the reliability of these visualizations. Which of the following factors should the data scientist highlight to defend the reliability of AIgenerated visualizations?
A) AI-generated visualizations are based on the same data used in traditional visualizations.
B) AI-generated visualizations are always more accurate.
C) The AI technology used is the latest in the market.
D) AI-generated visualizations eliminate human error.
31) A business analyst is tasked with identifying inconsistencies in quarterly sales reports using AI tools. They notice that the AI-generated visualizations show different trends compared to manually created ones. What is the most plausible reason for this discrepancy?
A) The manual reports contain errors.
B) The AI tool has identified hidden patterns not seen in manual analysis.
C) The data used in AI tools is different from the manual reports.
D) The AI tool is malfunctioning.
32) A data analyst is using Microsoft Copilot to generate visualizations for a report. While reviewing the output, they notice that the visualizations seem oversimplified and do not effectively communicate the complex data relationships. Which of the following is the most likely cause of this issue?
A) The AI is not trained on the specific dataset.
B) The AI lacks the ability to interpret complex data relationships.
C) The data is too complex for any visualization.
D) The analyst did not use the correct data format.
33) A marketing analyst needs to present the proportion of market share held by four major competitors in a highly competitive industry. Which data visualization method should the analyst use to effectively communicate this information?
A) Bar chart
B) Pie chart
C) Histogram
D) Line graph
34) A company wants to analyze the relationship between its advertising expenses and sales revenue. Which type of data visualization should they use, and why?
A) A bar chart, because it compares the advertising expenses and sales revenue.
B) A pie chart, because it shows the composition of advertising expenses and sales revenue.
C) A scatterplot, because it shows the relationship between advertising expenses and sales revenue.
D) A histogram, because it shows the distribution of advertising expenses.
35) A financial analyst is tasked with presenting data to show how the company's revenue has changed over the past decade. Which visualization type should the analyst choose to most effectively communicate this trend?
A) Line graph
B) Bar chart
C) Pie chart
D) Scatterplot
36) An operations manager is preparing a report to show how monthly production levels have changed over the past two years. Which type of data visualization should be used to highlight these trends?
A) Bar chart
B) Pie chart
C) Histogram
D) Line graph
37) A business analyst is comparing two data visualizations to determine which one better represents the trend of a company's sales over the past five years. One visualization is a bar chart showing annual sales figures, and the other is a line graph showing sales figures over time. Which visualization is more appropriate and why?
A) The bar chart, because it clearly shows the sales figures for each year.
B) The line graph, because it effectively illustrates the trend of sales over time.
C) The bar chart, because it compares the sales figures with other companies.
D) The line graph, because it shows the proportion of sales each year.
38) A supply chain manager wants to analyze the relationship between the amount spent on logistics and the delivery times across various regions. Which data visualization tool should be used to uncover any potential correlation?
A) Bar chart
B) Pie chart
C) Histogram
D) Scatterplot
39) An analyst is tasked with visualizing the distribution of delivery times for a set of 20,000 orders. They are considering using either a pie chart or a histogram. Which visualization should they choose and why?
A) A pie chart, because it shows the proportion of each delivery time category.
B) A pie chart, because it can represent the overall composition of delivery times.
C) A histogram, because it shows the distribution of delivery times.
D) A histogram, because it compares delivery times with other metrics.
40) A data analyst needs to visualize the proportion of sales coming from different product divisions within a company. They have created both a bar chart and a pie chart. Which visualization is more suitable for this purpose and why?
A) The bar chart, because it compares the sales figures of different product divisions.
B) The pie chart, because it shows the proportion of sales from each product division.
C) The bar chart, because it shows trends over time.
D) The pie chart, because it shows the distribution of sales across different time periods.
41) A product manager needs to understand the relationship between advertising spend and product sales to adjust the marketing budget effectively. Which data visualization should they use?
A) Scatterplot
B) Bar chart
C) Pie chart
D) Line graph
42) A company's sales team wants to analyze last year's performance across different regions to identify the most promising areas for future growth. They have access to sales data broken down by region. Which type of data visualization is most effective for this purpose?
A) Bar chart
B) Pie chart
C) Histogram
D) Line graph
43) A financial analyst needs to present the average processing time for loan applications at a bank. The dataset includes thousands of observations. Which data visualization method would be most appropriate to show the distribution of these processing times?
A) Bar chart
B) Pie chart
C) Histogram
D) Line graph
44) A business analyst is evaluating a dataset to understand the return on equity (ROE) for different departments within a company. The analyst notices that the ROE figures vary significantly across departments. Which data visualization method would be most effective in identifying any potential trends or outliers in ROE among the departments?
A) A pie chart to show the percentage of ROE for each department.
B) A line graph to track ROE trends over time.
C) A bar (or column) chart to compare ROE across departments.
D) A scatterplot to show the relationship between ROE and time.
45) A company is analyzing its sales data using various data visualization techniques. They have created a pie chart to show the percentage of total sales across different regions and a line graph to track sales trends over time. They are now considering using a scatterplot. What is the main advantage of using a scatterplot in this context?
A) It shows the percentage of total sales across different regions.
B) It tracks sales trends over time.
C) It shows the relationship between two variables.
D) It highlights the most frequent causes of sales fluctuations.
46) A project manager needs to create a dynamic report that updates automatically with new data from the company's sales database. The report should include summary statistics and visualizations to help identify performance trends. Which tool or framework should the project manager use to achieve this?
A) static report
B) conditional formatting
C) dashboard
D) pie chart
47) A business analyst is tasked with presenting quarterly sales data trends to the executive team. The data includes various product lines, regional sales figures, and customer demographics. Which data visualization tool would be most effective for displaying sales trends over time?
A) bar chart
B) line graph
C) pie chart
D) scatterplot
48) A business analyst needs to create an effective dashboard for the marketing team to track campaign performance. The options include using a bar chart, pie chart, scatterplot, or line graph. Which visualization should be prioritized to compare the performance of different campaigns?
A) Bar chart
B) Pie chart
C) Scatterplot
D) Line graph
49) A retail company is analyzing its sales data using various types of visualizations to determine trends and improve forecasting accuracy. They have the option to use a line graph, histogram, scatterplot, or pie chart. Which visualization should they prioritize for identifying sales trends over time?
A) Line graph
B) Histogram
C) Scatterplot
D) Pie chart
50) A project team is using the AMPS Analytics Model to analyze customer feedback data. They have completed the 'Master the Data' step and are now in the 'Perform the Analysis' step. Which of the following activities should they focus on at this stage?
A) Extracting, transforming, and loading relevant data.
B) Applying appropriate business analytic techniques.
C) Interpreting and sharing the results with stakeholders.
D) Asking the right questions.
51) An operations manager needs to monitor daily sales performance against targets and quickly identify any deviations. Which tool should the manager use to achieve this?
A) Static report updated monthly
B) Dynamic report or dashboard
C) Quarterly sales performance review
D) One-time analysis of sales data
52) A data analyst needs to determine whether the data obtained for a project can address the business question being asked. Which of the following steps should the analyst take first to ensure the data's relevance?
A) Perform the analysis using the available data.
B) Evaluate the data to understand its context and relevance.
C) Create visualizations to identify patterns.
D) Share the initial findings with stakeholders.
53) An analyst is preparing to present the findings of a data analysis project to a diverse group of stakeholders. They are considering using either exploratory or explanatory data visualizations. Which type of visualization should they choose to effectively communicate their findings and promote recommended actions?
A) Exploratory visualizations, to uncover patterns and insights.
B) Explanatory visualizations, to support findings and recommend actions.
C) A combination of both, to cover all bases.
D) Neither, as narrative storytelling is sufficient.
54) A business analyst needs to communicate the results of a recent data analysis to stakeholders in a way that supports the main hypothesis and encourages action. Which type of data visualization should the analyst use?
A) Exploratory data visualizations
B) Explanatory data visualizations
C) Raw data tables
D) Detailed statistical reports
55) A business analyst is preparing a report to share the results of a recent sales analysis with key stakeholders. The analysis involves complex data that include daily sales figures, customer demographics, and product performance metrics. The analyst is considering using a dynamic report or dashboard for continuous updates. Which of the following best explains the role of the dynamic report in this context?
A) To provide a one-time summary of the analysis results.
B) To allow stakeholders to interact with and explore the data continuously.
C) To replace the need for any narrative explanation of the results.
D) To highlight only the successful sales days.
56) An operations manager is evaluating two visualizations to present employee performance data: a scatterplot and a line graph. Which of the following best explains the difference in how these visualizations convey information?
A) Scatterplots emphasize trends over time, while line graphs show relationships between variables.
B) Scatterplots are used for relationships between values, while line graphs are best for trends over time.
C) Line graphs are more effective for categorical data, while scatterplots are used for numerical data.
D) Both scatterplots and line graphs are equally effective for showing trends over time.
57) Which of the following charts is used to show trends over time?
A) symbol maps
B) scatter plots
C) line charts
D) pie charts
58) Which of the following software tools is best for general data analytics, as compared to visualizations?
A) Power BI
B) Excel
C) Tableau
D) PowerPoint
59) What is the first step in the AMPS Analytics Model?
A) analyze the data
B) access the data
C) ask the question
D) share the story
60) A company is using dynamic reports to track performance metrics in real-time. They notice frequent updates in the report showing significant fluctuations in sales numbers. What should the analyst interpret from these fluctuations?
A) The data collection method is flawed.
B) The market is experiencing high volatility.
C) The sales team is underperforming.
D) There are errors in the dynamic report.
61) Your team needs to visualize the distribution of employee ages to aid in hiring and retention plans. Which visualization type is the most appropriate to use?
A) Bar chart
B) Pie chart
C) Scatterplot
D) Histogram
62) A company uses a scatterplot to understand the relationship between employee training costs and sales revenue. The scatterplot reveals an unexpected pattern where higher training costs do not correlate with higher sales revenue. What is the most likely cause of this inconsistency?
A) The training programs are ineffective.
B) Sales revenue is influenced by multiple factors.
C) The data was incorrectly plotted.
D) There was an error in data collection.
63) A company is evaluating different data visualization tools to present its quarterly sales performance to stakeholders. They need a tool that allows for dynamic updates and clear communication of complex data. Which tool should they choose?
A) Alteryx
B) SPSS
C) SQL
D) Tableau Desktop
64) During an initial investigation of data, a company analyst uses summary statistics and graphical representations. They find discrepancies between the mean and median of sales data. What should the analyst do next to understand these discrepancies?
A) Use a pie chart to compare sales categories.
B) Create a histogram to visualize data distribution.
C) Recalculate the mean and median.
D) Perform a regression analysis.
65) A marketing analyst at a retail company needs to compare the sales performance of their products across different regions. Which type of data visualization would be most appropriate for showing the sales distribution across these regions?
A) Bar chart
B) Pie chart
C) Histogram
D) Line graph
66) As part of the Anscombe’s Quartet analysis in Lab 1.1 Tableau, you explain during a presentation that four datasets have identical regression lines and r-squared values but different visual distributions. How should you justify the need for both statistical and visual analysis?
A) Statistics are sufficient for understanding data.
B) Visualizations alone are enough to analyze data.
C) Both methods provide a fuller understanding of the data.
D) Identical statistics mean the datasets are identical.
67) As part of the Anscombe’s Quartet analysis in Lab 1.1 Tableau, your manager has provided you with four different datasets, each containing 11 data points, and has asked you to compare them. The summary statistics (mean, variance, correlation) for all four datasets are nearly identical. Which approach would best help you understand the underlying differences between these datasets?
A) Calculate additional summary statistics
B) Perform a hypothesis test
C) Create visualizations for each dataset
D) Apply a machine learning algorithm
68) As part of the Anscombe’s Quartet analysis in Lab 1.1 Power BI, an analyst observes that the scatter plots for the datasets have different shapes, even though they share the same summary statistics. What analytical insight can be drawn from this observation?
A) Summary statistics are sufficient for understanding data.
B) Visualizations alone can provide all necessary insights.
C) It highlights the importance of using both visualizations and summary statistics for a comprehensive data analysis.
D) Different shapes in scatter plots indicate errors in data entry.
69) As part of the Anscombe’s Quartet analysis in Lab 1.1 Power BI, your client has provided you four datasets and requested a detailed comparison using both statistical summaries and visualizations. How would you best demonstrate the differences among these datasets in Power BI?
A) Calculate mean and standard deviation for each dataset and present these statistics in a table.
B) Create scatterplots for each dataset and add trend lines to each plot.
C) Generate pie charts for each dataset to show the distribution of data points.
D) Plot histograms of the x-values for each dataset to compare their distributions.
70) After visualizing Anscombe's Quartet datasets in Lab 1.1 Excel, you notice that each dataset appears very different despite having identical summary statistics. How should you prioritize your next steps in analysis?
A) Focus solely on visualizations to interpret the datasets.
B) Recalculate the statistics to find discrepancies.
C) Conduct further analysis using both visualizations and statistics to understand the full context.
D) Replace the datasets with new ones.
71) As part of the Anscombe’s Quartet analysis in Lab 1.1 Excel, a data analyst is tasked with comparing four datasets that have nearly identical descriptive statistics but are suspected to have different distributions. Which method should the analyst use to effectively illustrate the differences between these datasets?
A) Create scatterplots for each dataset
B) Generate histograms for each dataset
C) Produce box plots for each dataset
D) Rely solely on descriptive statistics
72) As part of Lab 1.2 Tableau, you are tasked with presenting Amazon's financial performance data from 2012 to 2023 to senior management. Which type of visualization would most effectively highlight the trend in Amazon's net sales over this period?
A) Line chart
B) Column chart
C) Pie chart
D) Scatter plot
73) As part of Lab 1.2 Tableau, after creating various visualizations for Amazon’s net sales and net income, you must choose the most effective one to present to investors focusing on yearly performance comparison. Which visualization would be the most effective and why?
A) Pie chart
B) Line chart
C) Column chart
D) Scatter plot
74) As part of Lab 1.2 Tableau, you need to illustrate the distribution of Amazon's net income for a single year. Which type of chart should you use to effectively communicate this information?
A) Pie chart
B) Column chart
C) Line chart
D) Histogram
75) After completing Lab 1.3 Excel, you work as an analyst at Gauged Industries tasked with identifying the cost behavior of Input Cost A. You have constructed a scatterplot with Units Produced on the x-axis and Input Cost A on the y-axis. The equation shown above the scatterplot is y=2.5x. What is the cost behavior of Input Cost A?
A) Fixed cost
B) Variable cost
C) Mixed cost
D) Step cost
76) As part of Lab 1.3 Excel, and performing your analysis at Gauged Industries, you need to determine the cost behavior of Input Cost C. You create a scatterplot with Units Produced on the x-axis and Input Cost C on the y-axis, resulting in the equation y=800. What type of cost is Input Cost C?
A) Fixed cost
B) Variable cost
C) Mixed cost
D) Step cost
77) As part of Lab 1.3 Excel, and as a data analyst at Gauged Industries tasked with identifying the cost behavior of Input Cost A using scatterplot visualizations in Power BI. After loading the data and creating a scatterplot with Input Cost A on the Y-axis and Units Produced on the X-axis, you observe a linear trend with a positive slope. What type of cost behavior does Input Cost A exhibit?
A) Fixed cost
B) Variable cost
C) Mixed cost
D) Step cost
78) As part of Lab 1.3 Power BI, and after completing the scatterplot analysis, the data suggests that Input Cost C is a fixed cost. How would you justify this classification based on the visualization?
A) The scatterplot shows a horizontal line indicating no change with production levels.
B) The scatterplot shows a steep slope indicating a strong correlation with production levels.
C) The scatterplot reveals a moderate slope indicating partial variability.
D) The scatterplot data points are widely scattered with no clear trend.
79) As part of Lab 1.3 Tableau, and as a data analyst at Gauged Industries and need to determine the cost behavior of Input Cost A using Tableau. You have plotted the scatterplot with units produced on the x-axis and Input Cost A on the y-axis and observed a trend line equation of y = 2.5x + 0. What type of cost is Input Cost A?
A) Fixed Cost
B) Variable Cost
C) Mixed Cost
D) Semi-variable Cost
80) As part of Lab 1.3 Tableau, and as part of your analysis, you need to determine the overall cost structure for Gauged Industries. After creating scatterplots for all input costs, you combined them into a calculated field with the equation Total Cost = 7.75x + 1000. What does this equation indicate about the overall cost structure?
A) Fixed Cost
B) Variable Cost
C) Mixed Cost
D) Semi-variable Cost
81) After completing Lab 1.1 Excel Anscombe’s Quartet, what would you conclude about the statistics for each of the datasets?
Summary Statistics
A) The statistics are identical in each of the datasets.
B) The statistics are different among all the datasets.
C) The datapoints all have similar trends.
82) To create these Anscombe’s Quartet visualizations in Lab 1.1 Tableau, what kind of a visualization needs to be chosen?%media:13252745991163528_1.ext%
A) Circle Chart with Trend Lines
B) Line Chart
C) Scatterplot with Trend Lines
D) BoxPlots with Trend Lines
83) After completing Lab 1.1 Power BI, what would you conclude about the trend line for each of the datasets?
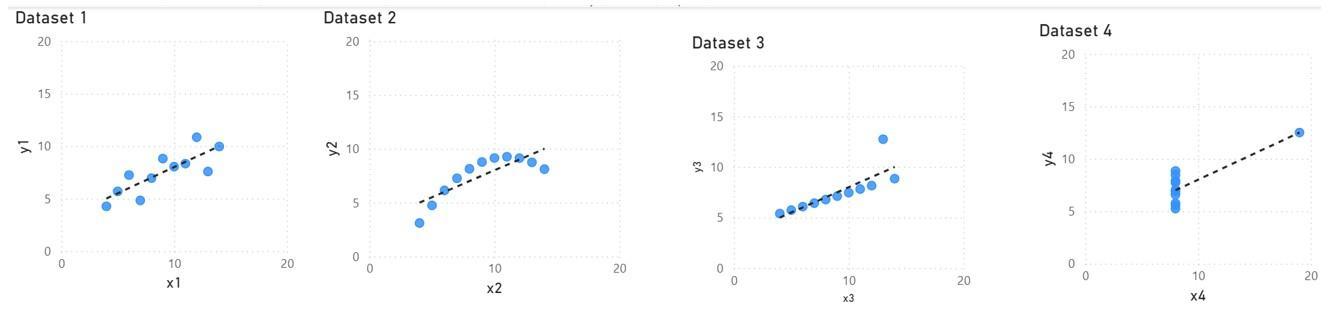
A) While the visualizations differ, the trend lines are similar in each of the datasets.
B) Both the visualizations and the trend lines are different among each of the datasets.
C) Both the visualizations and the trend lines are similar among each of the datasets.
84) After completing Lab 1.2 Excel, Lab 1.2 Tableau or Lab 1.2 Power BI, what would you conclude about the trend of earnings for Amazon?
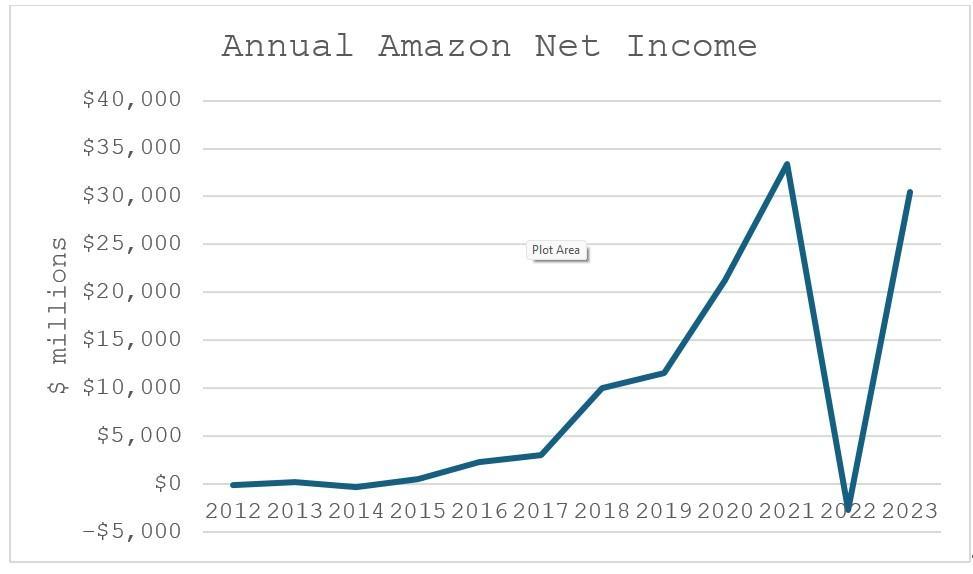
A) There is a reasonable chance of negative earnings in the future.
B) There is not a reasonable chance of negative earnings in the future.
C) A bar chart would be helpful to further evaluate the trend of earnings into the future.
85) After completing Lab 1.3 Excel, we would conclude which of the following regarding Input Cost D?
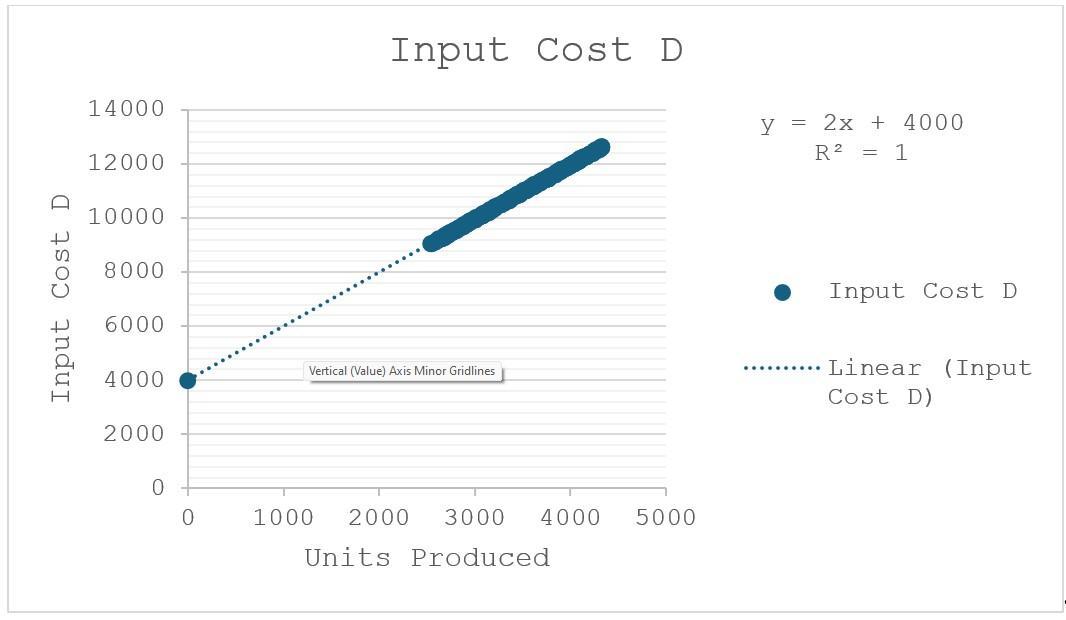
A) Input Cost D is a mixed cost (with fixed and variable components).
B) Input Cost D is a variable cost only.
C) Input Cost D is a fixed cost only.
86) After completing Lab 1.3 Power BI, to create these visualizations to evaluate the way input Cost C is related to units produced, whatwhat kind of a visualization needs to be chosen?
A) Column Chart
B) Line Chart
C) Scatterplot
D) Box Plots with Whiskers
87) After completing Lab 1.3 Power BI, we would conclude which of the following regarding Input Cost C?
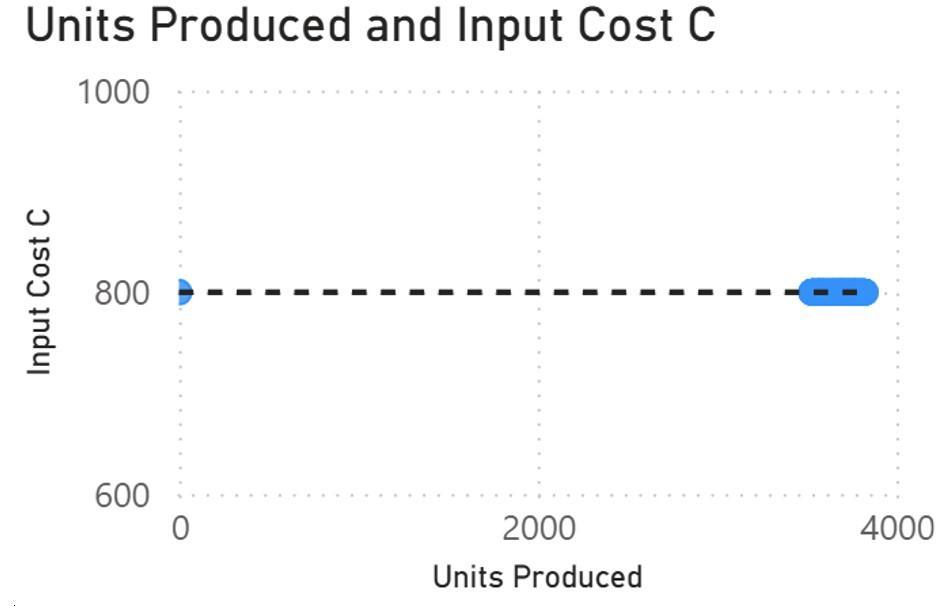
A) Input Cost C is a mixed cost (with fixed and variable components).
B) Input Cost C is a variable cost only.
C) Input Cost C is a fixed cost only.
88) After completing Lab 1.3 Tableau, we would conclude which of the following regarding Total Input Costs?
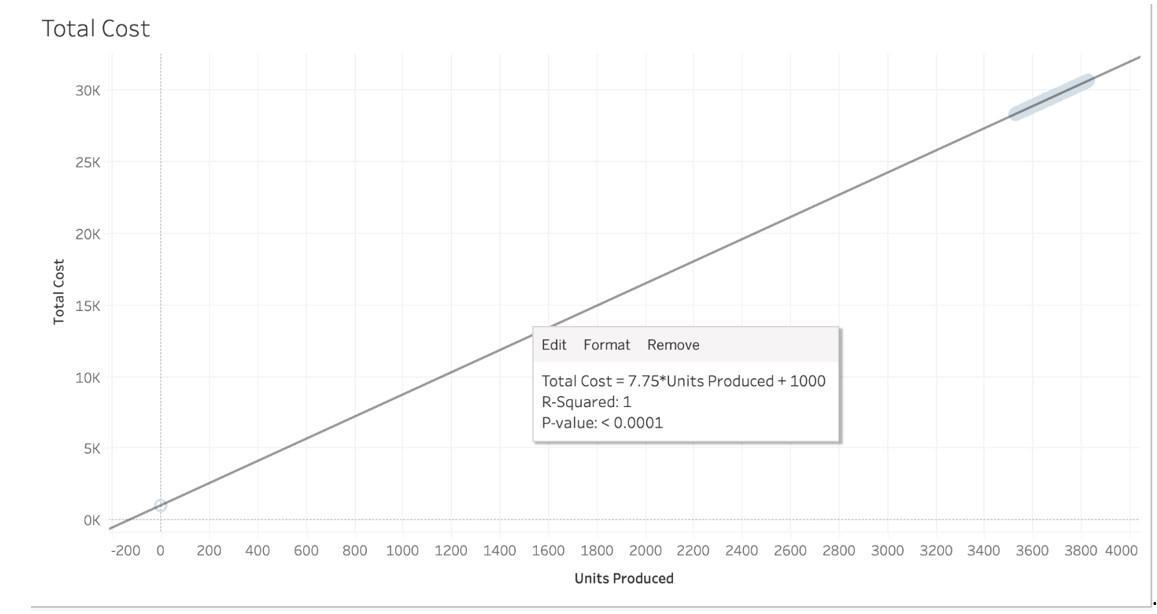
A) Total Input Costs are a mixed cost (with fixed and variable components).
B) Total Input Costs are a variable cost only.
C) Total Input Costs are a fixed cost only.
Answer Key
Test name: Chapter 01
1) [A, B, C]
2) [A, B]
3) [A, D]
4) [A, C]
5) [C, D]
6) B
7) B
8) A
9) B 10) B
11) A
12) B
13) A
14) D 15) C
16) C 17) C
18) D
19) B
20) B
21) B 22) B
23) C
24) C
25) B 26) C
27) B
28) C
29) C
30) A
31) B
32) B 33) B 34) C 35) A 36) D 37) B
Visualization:
38) D
39) C
40) B
41) A
42) A
43) C
44) C
45) C
46) C
47) B
48) A
49) A
50) B 51) B 52) B
53) B 54) B 55) B 56) B 57) C 58) B 59) C
60) B 61) D 62) B 63) D 64) B 65) A 66) C
67) C
68) C
69) B
70) C
71) A
72) A
73) C
74) A
75) B
76) A
77) B
78) A
79) B
80) C
81) A
82) C
83) A
84) A
85) A
86) C
87) C
88) A