Solutions
Manual for Calculus Volume
2 1st Edition by Strang, Edwin, quot, Jed, quot, Herman
ISBN: 9781947172142
Chapter 1 Integration 1.1. Approximating Areas
Section Exercises
1. State whether the given sums are equal or unequal.
Answer: a. They are equal; both represent the sum of the first 10 whole numbers. b. They are equal; both represent the sum of the first 10 whole numbers. c. They are equal by substituting 1 ji=− . d. They are equal; the first sum factors the terms of the second.
In the following exercises, use the rules for sums of powers of integers to compute the sums.
Answer:
7.
Answer:
In
8.
Let n L denote the left-endpoint sum using n subintervals and let n R denote the corresponding right-endpoint sum. In the following exercises, compute the indicated left and right sums for the given functions on the indicated interval.
12. L4 for ( ) 1 1 fx x = on 2, 3
Answer: 4 319 420 L =
13. R4 for g x( ) = cos px ( ) on 0, 1
Answer: 4 0.25 R =
14. L6 for ( ) ( ) 1 1 fx xx = on 2, 5
Answer: 6 0.5972 L =
15. R6 for ( ) ( ) 1 1 fx xx = on 2, 5
Answer: 6 0.372 R =
16. R4 for 2 1 1 x + on 2, 2
Answer: 4 2.20 R =
17. L4 for 2 1 1 x + on 2, 2
Answer: 4 2.20 L =
18. R4 for 2 21xx−+ on 0, 2
Answer: 4 0.6875 R =
19. L8 for 2 21xx−+ on 0, 2
Answer: 8 0.6875 L =
20. Compute the left and right Riemann sums L4 and R4, respectively for ( ) ( ) 2 fxx =− on 2, 2 . Compute their average value and compare it with the area under the graph of f.
Answer: 44 4.0 LR == . The graph of f is a triangle of area 4.
21. Compute the left and right Riemann sums L6 and R6, respectively for ( ) ( ) 33 fxx =−− on 0, 6 . Compute their average value and compare it with the area under the graph of f.
Answer: 66 9.000 LR == . The graph of f is a triangle with area 9.
22. Compute the left and right Riemann sums L4 and R4, respectively for ( ) 2 4 fxx =− on 2, 2 and compare their values.
Answer: 44 5.4641 LR == . The graph of f is a semicircle of area 26.28
23. Compute the left and right Riemann sums L6 and R6, respectively for ( ) ( )2 93fxx=−− on 0,6 and compare their values.
Answer: 66 13.12899 LR == . They are equal.
Express the following endpoint sums in sigma notation but do not evaluate them.
24.
Answer:
In the following exercises, graph the function then use a calculator or a computer program to evaluate the following left and right endpoint sums. Is the area under the curve on the given interval better approximated by the left Riemann sum or right Riemann sum? If the two agree, say “neither.”
28. [T] L100 and R100 for 2 31yxx=−+ on the interval 1, 1
Answer:
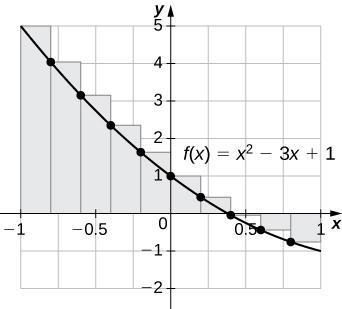
100 2.7628 L = , 100 2.6068 R = . The plot shows that the left endpoint sum is an overestimate because the function is decreasing. Similarly, the right Riemann sum is an underestimate. Thus, the area lies between the left and right Riemann sums. Ten rectangles are shown for visual clarity. This behavior persists for more rectangles.
29. [T] L100 and R100 for 2 yx = on the interval 0,1
Answer:
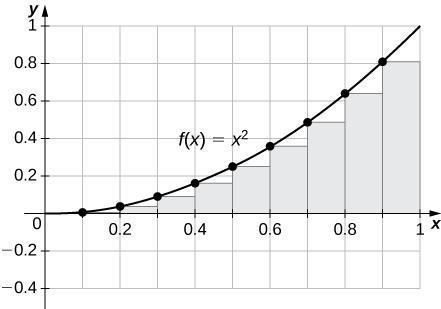
100 0.33835 R = , 100 0.32835 L = . The plot shows that the left Riemann sum is an underestimate because the function is increasing. Similarly, the right Riemann sum is an overestimate. The area lies between the left and right Riemann sums. Ten rectangles are shown for visual clarity. This behavior persists for more rectangles.
30. [T] L50 and R50 for 2 1 1 x y x + = on the interval 2, 4
Answer:
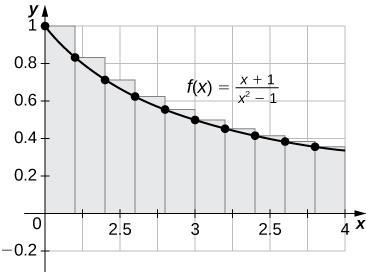
50 1.1121 L = , 50 1.0854 R = . The plot shows that the left Riemann sum overestimates the area because the function is decreasing. Similarly, the right endpoint sums are underestimates. The area lies between the left and right endpoint approximations. Ten rectangles are shown for visual clarity. This behavior persists for more rectangles.
31. [T] L100 and R100 for 3 2 yx=+ on the interval 1, 1
Answer:
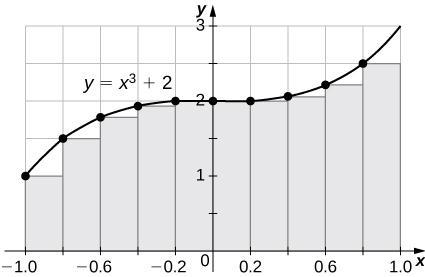
100 0.02 L =− , 100 0.02 R = . The left endpoint sum is an underestimate because the function is increasing. Similarly, a right endpoint approximation is an overestimate. The area lies between the left and right endpoint estimates.
32. [T] L50 and R50 for ( ) tan yx = on the interval 0, 4
Answer:
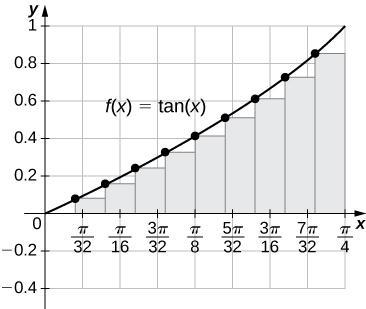
50 0.3387 L = , 50 0.3544 R = . The plot shows that the left Riemann sum is an underestimate because the function is increasing. Ten rectangles are shown for visual clarity. This behavior persists for more rectangles.
33. [T] L100 and R100 for 2x ye = on the interval 1, 1
Answer:
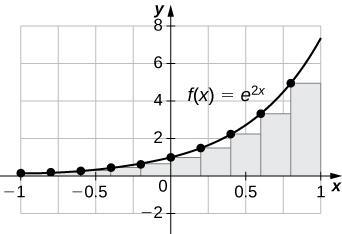
100 3.555 L = , 100 3.670 R = . The plot shows that the left Riemann sum is an underestimate because the function is increasing. Ten rectangles are shown for visual clarity. This behavior persists for more rectangles.
34. Let tj denote the time that it took Tejay van Garteren to ride the jth stage of the Tour de France in 2014. If there were a total of 21 stages, interpret 21 1 j j t = .
Answer: The sum represents the total time it took van Garteren to complete the 2014 Tour de France.
35. Let jr denote the total rainfall in Portland on the jth day of the year in 2009. Interpret 31 1 j j r =
Answer: The sum represents the cumulative rainfall in January 2009.
36. Let j d denote the hours of daylight and j denote the increase in the hours of daylight from day 1 j to day j in Fargo, North Dakota, on the jth day of the year. Interpret
Answer: The sum represents the total number of hours of daylight on the 365th day of the year in Fargo.
37. To help get in shape, Joe gets a new pair of running shoes. If Joe runs 1 mi each day in week 1 and adds 1 10 mi to his daily routine each week, what is the total mileage on Joe’s shoes after 25 weeks?
Answer: The total mileage is
38. The following table gives approximate values of the average annual atmospheric rate of increase in carbon dioxide (CO2) each decade since 1960, in parts per million (ppm). Estimate the total increase in atmospheric CO2 between 1964 and 2013.
Average Annual Atmospheric CO2 Increase, 1964–2013 Decade Ppm/y
Answer: Add the rates and multiply by 10 to get 77.5 ppm.
39. The following table gives the approximate increase in sea level in inches over 20 years starting in the given year. Estimate the net change in mean sea level from 1870 to 2010. Approximate 20-Year Sea Level Increases, 1870–1990
Answer: Add the numbers to get 8.1-in. net increase.
40. The following table gives the approximate increase in dollars in the average price of a gallon of gas per decade since 1950. If the average price of a gallon of gas in 2010 was $2.60, what was the average price of a gallon of gas in 1950?
Approximate 10-Year Gas Price Increases, 1950–2000
Starting Year 10-Year Change
Answer: Subtract the increase of $2.32 from $2.60 to get 28¢ in 1950.
41. The following table gives the percent growth of the U.S. population beginning in July of the year indicated. If the U.S. population was 281,421,906 in July 2000, estimate the U.S. population in July 2010.
Annual Percentage Growth of U.S. Population, 2000–2009 Year
(Hint: To obtain the population in July 2001, multiply the population in July 2000 by 1.0112 to get 284,573,831.)
Answer: 309,389,957
In the following exercises, estimate the areas under the curves by computing the left Riemann sums, L8.
42.
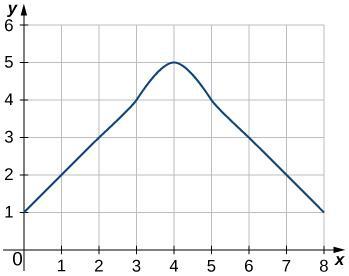
Answer: 8 1234543224 L =+++++++=
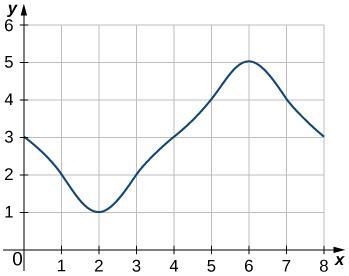
Answer: 8 3212345424 L =+++++++=
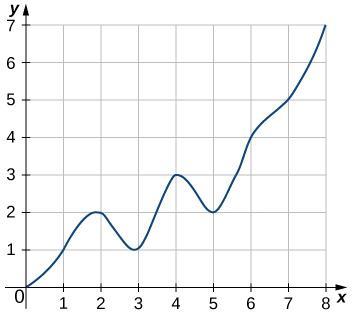
Answer: 8 0121324518 L =+++++++= 45.
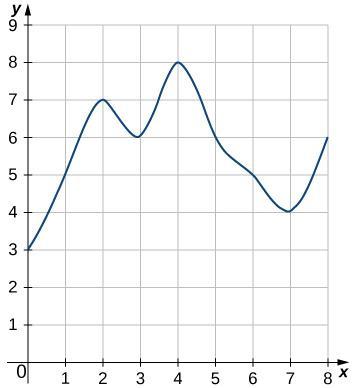
Answer: 8 3576865444 L =+++++++=
46. [T] Use a computer algebra system to compute the Riemann sum, , NL for 10,30,50 N = for ( ) 2 1 fxx =− on 1,1 .
Answer: 10 1.5185 L , 30 1.5606 L , 50 1.5660 L
47. [T] Use a computer algebra system to compute the Riemann sum, LN, for 10,30,50 N = for ( ) 2 1 1 fx x = + on 1,1 .
Answer: 10 1.7604 L , 30 1.7625 L , 50 1.76265 L
48. [T] Use a computer algebra system to compute the Riemann sum, LN, for 10,30,50 N = for ( ) 2sin fxx = on 0, 2 . Compare these estimates with π.
Answer: 10 3.141592654 L , 30 3.141592654 L , 50 3.141592654 L . L10 is a lucky guess; L50 is an accurate estimate.
In the following exercises, use a calculator or a computer program to evaluate the endpoint sums RN and LN for 1,10,100 N = . How do these estimates compare with the exact answers, which you can find via geometry?
49. [T] y = cos px ( ) on the interval 0, 1
Answer: 1 1 R =− , 1 1 L = , 10 0.1 R =− , 10 0.1 L = ,
0.01 L = , and 100 0.1 R =− . By symmetry of the graph, the exact area is zero.
50. [T] 32yx=+ on the interval 3,5
L = . The graph is a trapezoid with area 28.
In the following exercises, use a calculator or a computer program to evaluate the endpoint sums RN and LN for 1,10,100 N = .
51. [T] 4254yxx=−+ on the interval 2, 2 , which has an exact area of 32 15
52. [T] ln yx = on the interval 1, 2 , which has an exact area of ( ) 2ln21
Answer: 1 0.6931 R = , 1 0 L = , 10 0.4205 R = ,