Solution and Answer Guide
JEFFREY D. CAMM, JAMES J. COCHRAN, MICHAEL J. FRY, JEFFREY W. OHLMANN, BUSINESS
ANALYTICS, 2027, 6TH EDITION, 9798214057361; CHAPTER 1: INTRODUCTION TO BUSINESS
ANALYTICS
TABLE OF CONTENTS
CONCEPTUAL PROBLEMS
1. Quality versus Low Cost. Car manufacturer Lexus competes in the luxury car category and is known for its quality. The decision to compete on quality rather than low cost is an example of what type of decision: strategic, tactical, or operational? Explain. LO 1
Solution:
Because it concerns the overall direction of the company, the decision to be a luxury brand is a strategic decision. Tactical and operational decisions should support this strategic decision. For example, using only the highest quality materials would be a tactical decision that supports a luxury brand. An example of an operational decision would be to always offer a free loaner car when the car is serviced.
2. Package Delivery. Every day, logistics companies such as United Parcel Service (UPS) must decide how to route their trucks, that is, the order in which to deliver the packages that have been loaded on a truck. UPS developed a system called ORION (On-Road Integrated Optimization and Navigation) which dynamically routes its trucks based on packages on the truck and traffic conditions. It is estimated that ORION saves UPS about 10 million gallons of fuel per year. Is the decision of how to route a truck a strategic, tactical, or operational decision? Explain. LO 1
Solution:
Because how to route a truck depends on the packages that need to be delivered that day, the decision of how to route a truck is an operational decision.
3. Airline Decisions. JetBlue is a major U.S. airline that ranked seventh in the United States in 2021 based on number of passengers carried. JetBlue has 270 aircraft and services 104 destinations. Consider three decisions below that an airline such as JetBlue must make. For each decision, tell if it is strategic, tactical, or operational and explain. LO 1
a. Which crew should be assigned to a given flight?
b. Should we compete on low cost or quality?
c. What type of aircraft should we purchase?
Solutions:
a. Which crew should be assigned to a given flight is a decision that needs to be made daily, so it is an operational decision.
b To compete on low cost versus quality sets the direction of the airline, so it is a strategic decision.
c The type of aircraft to purchase is not a daily decision, but one that does concern how the airline will achieve its strategy. So, the type of aircraft to purchase is a tactical decision. For example, a low-cost strategy might be best supported tactically by purchasing planes that have no first-class seats.
4. Choosing a College. Millions of high school graduates decide annually to enroll in a college or university. Many factors can influence a student’s choice of where to enroll. List the four steps of the decision-making process and discuss each step of the process, where the decision to be made is choosing which college to attend. LO 2
Solutions:
1. Problem Framing and Metrics. Choosing where to enroll, given the set of schools to which the student gained admission, is the decision to be made. Criteria to be considered might include cost, amount of financial aid received, location, and academic reputation of the school.
2. Generate Potential Solutions. The set of alternative solutions from which to choose is the set of colleges and universities that granted the student admission.
3. Evaluate Potential Solutions. Using the importance the student places on each of the factors listed in step 2, evaluate each offer of admission.
4. Choose an Alternative. Based on the evaluation in step 3, the student can rank order the schools offering admission, trade off the pros and cons for each school for each factor, and choose to enroll in the school ranked number one.
5. Cell Phone Quality Control. You are the Director of Quality for a cell phone manufacturing plant. Lately, your plant has experienced an increase in phones returned from the retail stores because they have cracked screens. Which of the following is a good metric to use to determine if we have found a good solution to this problem? LO 2
i. Number of phone call complaints received
ii. Number of negative social media posts mentioning cracked screens
iii. Number of phones returned because of cracked screens
iv. None of the above
Solution:
iii. Number of phones returned because of cracked screens
6. Change Management. Which of the following steps in the decision making process is most likely to involve change management? LO 2
i. Problem Framing and Metrics
ii. Data Understanding and Preparation
iii. Modeling and Analysis
iv. Implementation and Evaluation
Solution:
iv. Implementation and Evaluation
7. Analytics in Decision Making. True or False: Analytics is most helpful in the Problem Framing and Metrics step of problem solving. LO 2
Solution:
False. Analytics is most useful in step 2, Data Understanding and Preparation and step 3, Modeling and Analysis.
8. Problems versus Symptoms. Managers sometimes focus on symptoms of problems rather than the problem itself. For example, a manager might complain about excessive inventory, which is a symptom perhaps of a pricing problem (we priced our good too high and it is not selling well as a result). Which of the four stages of the decision making process helps distinguish symptoms from problems? LO 2
Solution:
The first step, problem framing and metrics, helps us better understand the real problem to be solved. Symptoms offer clues to some metrics to be used.
9. Distinguishing Problems from Symptoms. The IT Manager of a large firm is dealing with a rapid spike in employee complaints about the organization’s IT system. Indicate whether each of the following is a problem or a symptom in this situation. LO 2
a) Outdated hardware
b) Slow processing and response times
c) Frequent crashes and freezes
d) High maintenance costs
e) Software needs to be updated
Solution:
a) Outdated hardware - problem
b) Slow processing and response times - symptom
c) Frequent crashes and freezes - symptom
d) High maintenance costs - symptom
e) Software needs to be updated - problem
10. Package Delivery (Revisited). Consider again the ORION system discussed in problem 2. Is ORION an example of descriptive, predictive, or prescriptive analytics? Explain. LO 3
Solution:
ORION provides a course of action (the route to the next delivery spot), so it is an example of prescriptive analytics.
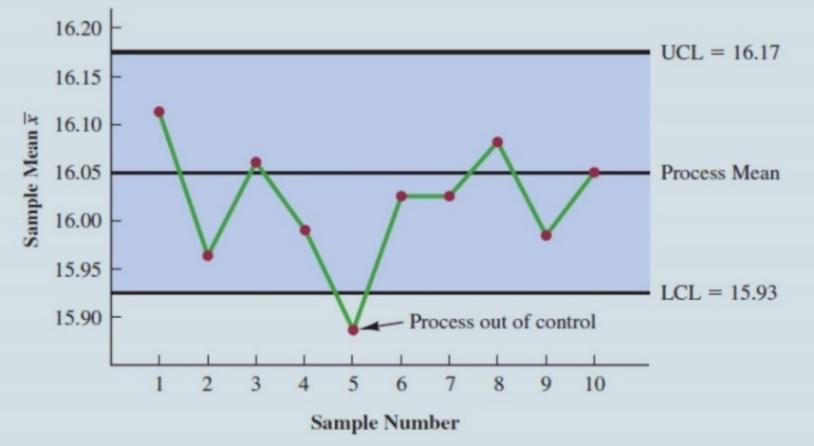
11. Quality Control for Boxes of Cereal. A control chart is a graphical tool to help determine if a process may be exhibiting non-random variation that needs to be investigated. If non-random variation is present, the process is said to be “out of control” otherwise it is said to be “in control.” The following figure shows a control chart for a production line that fills boxes of cereal. Based on past data, we can calculate the mean weight of a box of cereal when the process is in control. The mean weight is 16.05 ounces. We can also calculate control limits, an upper control limit (UCL) and a lower control limit (LCL). New samples are collected over time and the data indicates that the process is in control so long as the new sample weights are between UCL and LCL. As shown in the chart, only sample 5 is outside of the control limits. LO 3
a Is the control chart an example of descriptive, predictive, or prescriptive analytics?
b Suppose the control cart is part of a data dashboard and the chart is combined with a rule that does the following. If four consecutive sample mean weights are outside of the control limits, the production line is automatically stopped, and a message appears on the dashboard. The message says “The production line is stopped. The process may be out of control. Please inspect the fill machine.” Is this new enhanced control chart combined with a rule an example of descriptive, predictive, or prescriptive analytics?
Solutions:
a) The control chart simply describes the production data, so it is descriptive analytics.
b) The new enhanced control chart combines a descriptive tool (the chart) with a rule that causes a course of action to take place. Hence, the new rule-based system is an example of prescriptive analytics.
12. Amazon Books. An example of a response from Amazon when this textbook you are reading was chosen online follows It indicates that some people who purchased this text also tended to purchase The World Is Flat, Fundamentals of Corporate Finance, and Strategic Marketing Management. In this application of analytics, is Amazon using descriptive, predictive, or prescriptive analytics? Explain. LO 3
Solution:
Amazon is describing other books that tend to be purchased with the text Business Analytics, based on past consumer purchases. Therefore, this is an example of descriptive analytics.
13. Employee Retention. Human Resource (HR) Analytics or People analytics are terms used for the use of analytics to manage a company’s workforce. Google, Microsoft, and Walmart, for example, use people analytics to help retain their best people, ensure a diverse workforce, and better understand the strengths and areas needing improvement. LO 3, 4
a. One application of people analytics is to build a model that estimates the probability of an employee departing the company within the next six months. Inputs to the model could be market demand for the skills the person possesses,
how long the person has been with the company, and a major life event recently occurring for the person (e.g., divorce). Is this type of model descriptive, predictive, or prescriptive? Explain.
b How could you use the model described in part (a) to help improve the workforce?
Solutions:
a) Since the model estimates a probability, that is, how likely it is that a person will depart the company in the next six months, it is an example of predictive analytics. It predicts how likely a person is to depart in the next six months.
b) The predictive model could be used to improve the workforce by applying a rule to the model to make it prescriptive. For example, a rule might be “for a highperforming employee, if the estimated probability of departure is greater than 0.4, proactively give a 10% increase in salary to that person, with the hope that the person will likely stay.”
14. Supermarket Checkout Lanes. A supermarket has been experiencing long lines during peak periods of the day. The problem is noticeably worse on certain days of the week, and the peak periods are sometimes different according to the day of the week. The difficulty for store managers is knowing when to call some of the workers stocking shelves up to the front of the store to work the checkout lanes. LO 4
a How could analytics be used to help the supermarket?
b What data would be needed?
Solutions:
a) Analytics could prove helpful by providing a predictive model that estimates the expected number of shoppers and how long they are expected to shop before checking out, by day of week and time of day. For example, the model might predict that for a given supermarket location, from 5:00 p.m. to 5:15 p.m. on a Wednesday, 37 shoppers are expected, with 80% of them shopping for less than 6 minutes. This predictive model could be used to know when more checkout workers need to be called to the front of the store to ensure lines do not grow too long.
b) The following data would need to be collected over time with special considerations for holidays: the number of people who enter the store and how long they shop before checking out by day of week and time of day. These data could be collected by observation, but would more likely be collected electronically through sensors that would also maintain the anonymity of the shoppers.
15. Pricing Subcompact Rental Cars. Setting the right price for a product is an important business decision. If the product is priced too high, the demand could be very low. Set the price too low, demand may be high, but we are potentially leaving money on the table because the revenue per unit is low. Pricing analytics involves finding the right tradeoff between price charged and demand so as to maximize revenue. Suppose we need to set the price for renting a subcompact automobile for one day. Let us outline the decision-making process:
Step 1. Problem framing and metrics. We need to set a price per day for a midsize rental car. Our goal in setting the price is to maximize revenue per day
Step 2. Data Understanding and Preparation. We will gather historical data, competitor data, and perhaps do some test marking to generate a data set that shows the amount of demand for different values of price.
Step 3. Modeling and Analysis. We can use the data from Step 2 to create a predictive model that predicts demand as a function of price. We will then use the predictive model to build a model that yields revenue (price demand) to find a price that maximizes revenue per day.
Step 4. Implementation and Evaluation. We will set the price to the optimal value found in Step 3 and track data on revenue for the same time periods over the last year to evaluate the impact of the new price decision.
We can use data and analytics to complete step 3 of the decision process. LO 3, 4
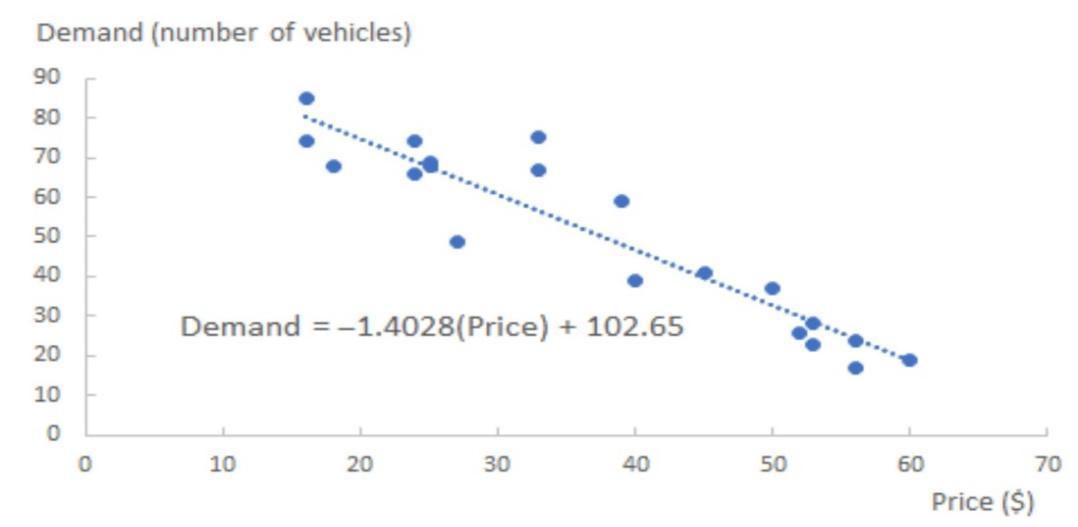
a. Based on historical or test market data, we can estimate a model that gives expected revenue as a function of price, as shown below. The dots on the chart represent the data (price and demand combinations) and the estimated model is the line in the chart: Demand = 1.4028(Price) + 102.65. For example, for price of $35, Demand = 1.4028(35) + 102.65 = 53.552 vehicles. So, we estimate that at a price of $35 per day, the demand will be about 54 vehicles. Is this estimated equation a descriptive, predictive, or prescriptive model? Explain.
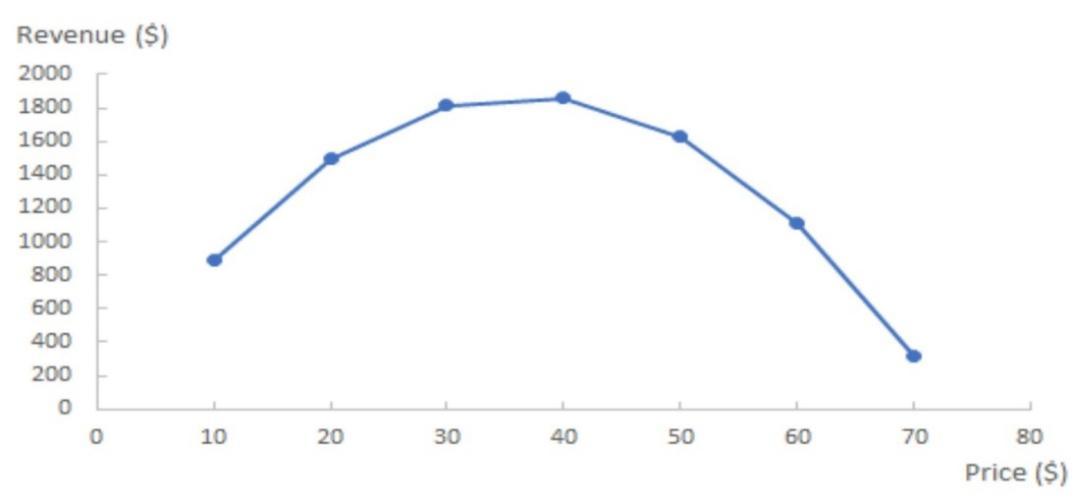
Our goal is to find the price that maximizes expected revenue. Revenue = demand × price which is ( 1.4028(Price) + 102.65) × (Price) = 1.40228(Price)2 + 102.65(Price). The revenue as a function of price is shown below for $10 increments of price.
b What is the price that maximizes revenue?
c Is visually inspecting the revenue function to find a revenue-maximizing price, descriptive, predictive, or prescriptive analytics? Explain.
Solutions:
a) The estimated equation is a predictive model because it predicts the quantity demanded based on the price per day of the rental car.
b) Based on the chart of revenue, since the peak of the curve is at a price of $40, it appears that the optimal price is $40. The estimated maximum revenue is ( 1.4028(Price) + 102.65) × (Price) = ( 1.4028(40) + 102.65) (40) = $1,861.52.
c) By visually finding the price that maximizes revenue and using that price to maximize revenue, we are performing prescriptive analytics, as we are recommending a course of action (settings the price at $40).
Jeffrey
PURPOSE AND PERSPECTIVE OF THE CHAPTER
This book is concerned with data-driven decision making and using analytical approaches in the decision-making process. Three developments spurred explosive growth in analytical methods for business applications: the availability of massive amounts of data, improvements in analytic methodologies, and substantial increases in computing power.
This chapter focuses on the dramatic upsurge in using analytical methods in business and a reliance on the business analysis discipline. This text aims to provide students with a sound conceptual understanding of the role that business analytics plays in the decision-making process and a better understanding of the variety of applications in which analytical methods have been used successfully.
CENGAGE SUPPLEMENTS
Additional instructor and student resources for this product are available online at www.cengage.com
LIST OF INSTRUCTOR DOWNLOADS
The following product-level supplements provide additional information that may help you prepare for your course. They are available in the Instructor Resource Center.
• Solutions and answers guide
• Educator’s guide
• PowerPoint slides
• Test bank powered by Cognero
• Excel solution files available for certain book exercises requiring computergenerated solutions (new)
LIST OF STUDENT DOWNLOADS
Students should download the following items from the Student Companion Center to complete the activities and assignments:
• Excel datasets
• Excel workbooks
[return to top]
CHAPTER OBJECTIVES
This chapter addresses the following objectives:
LO 1-1 Identify strategic, tactical, and operational decisions.
LO 1-2 Describe the steps in the decision-making process.
LO 1-3 Identify examples of descriptive, predictive, and prescriptive analytics.
LO 1-4 Describe applications of analytics for decision making and problem solving.
[return to top]
COMPLETE LIST OF CHAPTER ACTIVITIES AND ASSESSMENTS
For additional guidance, refer to the Teaching Online Guide.
LO 1-1 33 Decision Making in Your Organization 30 minutes
LO 1-3 34 Future Innovations on the Four Vs of Big Data 30 minutes
[return to top]
KEY TERMS
Artificial intelligence (AI): A broad field focused on using computers, data, and algorithms to augment or enhance human decision making or to automate tasks that usually require human intelligence.
Advanced analytics: Predictive and prescriptive analytics.
Big data: Any set of data that is too large or too complex to be handled by standard data-processing techniques and typical desktop software.
Business analytics: The scientific process of transforming data into insight for making better decisions.
Cloud computing: The use of data and software on servers housed externally to an organization via the internet. Also known simply as “the cloud.”
Data dashboard: A data-visualization tool that updates in real time and gives multiple outputs.
Data query: A request for information with certain characteristics from a database.
Data scientists: Analysts trained in both computer science and statistics who know how to effectively process and analyze massive amounts of data.
Data security: Protecting stored data from destructive forces or unauthorized users.
Decision analysis: A technique used to develop an optimal strategy when a decision maker is faced with several decision alternatives and an uncertain set of future events.
Descriptive analytics: Analytical tools that describe what has happened.
Generative AI (GenAI): AI that generates text, images, sound, and videos.
Hadoop: An open-source programming environment that supports big data processing through distributed storage and distributed processing on clusters of computers.
Large language model (LLM): A deep learning model trained on massive data sets to understand how characters, words, and sentences function together so it can recognize, comprehend, interpret, and use human language.
Machine learning: The use of analytical techniques to discover patterns and relationships in data and/or make predictions based on data.
MapReduce: Programming model used within Hadoop that performs the two major steps for which it is named: the map step and the reduce step.
Metric: A criterion that measures the effectiveness of a course of action.
Neural network: A supervised learning model whose structure is motivated by the biological functioning of the brain.
Operational decision: A decision concerned with how the organization is run from day to day.
Optimization model: A mathematical model that gives the best decision, subject to the situation’s constraints.
Predictive analytics: Techniques that use models constructed from past data to predict the future or ascertain the impact of one variable on another.
Prescriptive analytics: Techniques that analyze input data and yield the best course of action.
Rule-based model: A prescriptive model based on a rule or set of rules.
Simulation: The use of probability and statistics to construct a computer model to study the impact of uncertainty on the decision at hand.
Simulation optimization: The use of probability and statistics to model uncertainty, combined with optimization techniques, to find good decisions in highly complex and highly uncertain settings.
Strategic decision: A decision that involves higher-level issues and that is concerned with the overall direction of the organization, defining the overall goals and aspirations for the organization’s future.
Supervised learning: A category of machine learning techniques in which an algorithm learns how to predict an outcome variable of interest.
Tactical decision: A decision concerned with how the organization should achieve the goals and objectives set by its strategy.
Unsupervised learning: A category of machine learning techniques in which an algorithm discovers patterns and relationships between variables without an outcome variable to guide the process.
Utility theory: The study of the total worth or relative desirability of a particular outcome that reflects the decision maker’s attitude toward a collection of factors such as profit, loss, and risk.
[return to top]
CHAPTER OUTLINE
I. Introduction (PPT slide 4)
1. The purpose of this book is to provide
(1) a sound conceptual understanding of the role that business analytics plays in the decision-making process, and
(2) a better understanding of successful applications of analytical methods.
2. Three developments spurred recent explosive growth in the use of analytical methods in business applications.
(1) The tracking and storing of large amounts of data
(2) Methodological developments to extract knowledge from data
(3) An explosion in computing power
II. 1.1 Using Analytics for Improved Decision Making and Problem Solving (PPT slides 5–7)
a. 1.1 Managers’ Responsibilities in Decision Making
1. Strategic decisions involve higher-level issues concerned with the organization’s overall direction.
(1) Define the organization’s overall goals and aspirations for the future
2. Tactical decisions concern how the organization should achieve the goals and objectives set by its strategy.
(1) Usually the responsibility of midlevel management
3. Operational decisions affect how the firm is run daily.
(1) The domain of operations managers, who are the closest to the customer
b. 1.1 Business Analytics Defined
1. Business analytics is the scientific process of transforming data into insight for making better decisions.
(1) The use of data-driven or fact-based decision making is often seen as more objective than other decision-making alternatives.
2. Tools of business analytics can aid in decision making by (1) creating insights from data, (2) improving our ability to forecast for planning more accurately, (3) helping us quantify risk, and (4) yielding better alternatives through analysis and optimization.
c. 1.1 A Decision-Making Structured Process
1. The following four steps define the decision-making process using business analytics:
(1) Problem Framing and Metrics
(2) Data Understanding and Preparation
(3) Modeling and Analysis
(4) Implementation and Evaluation
III. 1.2 Using Analytics for Improved Decision Making and Problem Solving (PPT slides 8–13)
a. 1.2 Descriptive Analytics
1. Descriptive analytics encompasses the set of techniques that describe what has happened in the past.
2. Descriptive analytics techniques include (1) data queries, (2) reports,
(3) descriptive statistics, (4) data visualization (including data dashboards), (5) unsupervised learning techniques from data mining, and (6) basic spreadsheet models.
b. 1.2 Examples of Descriptive Analytics Techniques
1. A data query requests information with certain characteristics from a database.
(1) A report resulting from a query may include descriptive statistics and data visualizations to find patterns or relationships in a large database.
2. Data dashboards are collections of tables, charts, maps, and summary statistics updated as new data becomes available.
3. Data mining unsupervised learning techniques.
(1) An unsupervised learning technique is a descriptive method that seeks to identify patterns in different types of data that are based on notions of (a) similarity (cluster analysis), and (b) correlation (association rules).
c. 1.2 Predictive Analytics
1. Predictive analytics consists of techniques that use models constructed from past data to predict the future or ascertain the impact of one variable on another.
2. Predictive analytics includes
(1) linear regression and time series analysis, (2) data mining supervised learning techniques,
(a) Supervised learning techniques use past data to find patterns or relationships among data elements in a large database.
(3) simulation, which involves using probability and statistics to construct a computer model to study the impact of uncertainty on a decision.
d. 1.2 Prescriptive Analytics
1. Prescriptive analytics indicates a course of action to take.
(1) A predictive model provides a forecast or prediction, not a decision.
(2) A prescriptive model is a predictive model combined with a rule.
(3) Prescriptive models that rely on a rule or set of rules are often called rule-based models.
2. Other examples of prescriptive analytics are (1) portfolio models in finance, (2) supply network design models in operations, and (3) price-markdown models in retailing.
e. 1.2 Examples of Prescriptive Analytics Techniques
1. Models that give the best decision subject to the constraints of the situation are known as optimization models
2. Simulation optimization combines probability and statistics to model uncertainty with optimization techniques and find good decisions in highly complex and uncertain settings.
3. Decision analysis is used to develop an optimal strategy when a decision maker is faced with several decision alternatives and an uncertain set of future events.
(1) Utility theory is a branch of decision analysis that assigns values to outcomes based on the decision maker’s attitude toward risk.
f. 1.2 Coverage of Business Analytics in This Text
IV. Big Data (PPT slides 14–16)
a. 1.3 Big Data
1. Big data is any set of data that is too large or complex to be handled by standard data-processing techniques and typical desktop software.
2. IBM describes the phenomenon of big data through the four Vs: (1) volume, velocity, variety, and veracity (see the next slide)
3. The challenges of big data, in terms of data storage and processing, security, and available analytical talent, led to the development of new technologies:
(1) Hadoop is an open-source programming environment that supports big data processing through distributed storage and cloud computing.
(2) MapReduce is a programming model used within Hadoop that performs two major steps: the map step and the reduce step.
b. 1.3 The Four Vs of Big Data
c. 1.3 Cloud Computing and Data Security
1. The massive amounts of available data have led to numerous innovations that help make the data useful for decision making.
(1) Cloud computing (“the cloud”) refers to the use of data and software on servers housed externally to an organization via the internet.
(2) The cloud has made storing and processing massive amounts of data feasible and cost-effective.
2. The security of highly confidential data stored on the cloud is critical to companies and must be protected from computer hackers.
(1) Data security protects stored data from destructive forces or unauthorized users.
V. Artificial Intelligence (PPT slide 17)
a. 1.4 Artificial Intelligence
1. Big data has also accelerated the development of artificial intelligence applications.
(1) Artificial intelligence (AI) uses big data and computers to make decisions that would have required human intelligence in the past.
(2) AI applications include facial recognition for security checkpoints and self-driving vehicles.
(3) Generative AI (GenAI) generates text, images, sound, and videos.
(a) ChatGPT is a generative AI application powered by a large language model (LLM), a deep learning model trained on massive data sets to understand how characters, words, and sentences function together to recognize, comprehend, interpret, and use human language.
VI. Business Analytics in Practice (PPT slides 18–26)
a. 1.5 The Spectrum of Business Analytics
b. 1.5 Financial Analytics
1. The financial services sector relies heavily on descriptive, predictive, and prescriptive analytics.
(1) Descriptive analytics, through data visualization, is used to monitor financial performance, including stock returns, trading volumes, and measures of market return and volatility.
(2) Predictive models are used to forecast financial performance, assess the risk of investment portfolios and projects, and construct financial instruments such as derivatives.
(3) Prescriptive models are used to construct optimal portfolios of investments, allocate assets, and create optimal capital budgeting plans.
c. 1.5 Human Resources (HR) Analytics
1. The HR function is charged with ensuring that the organization (1) has the mix of skill sets necessary to meet its needs, (2) hires the highest-quality talent and provides an environment to retain it, and (3) achieves its organizational diversity goals.
2. Google uses “people analytics” to analyze data on its employees to
(1) determine the characteristics of great leaders, assess factors contributing to productivity, and evaluate potential new hires.
(2) Google also uses predictive analytics to update its forecast of future employee turnover and retention continually.
d. 1.5 Marketing Analytics
1. Marketing is one of the fastest-growing areas for analytics applications.
(1) The use of scanner data and data generated from social media has led to a better understanding of consumer behavior and increased interest in marketing analytics.
(2) As a result, descriptive, predictive, and prescriptive analytics are all heavily used in marketing.
2. Predictive models and optimization are used to better align advertising to specific target audiences, making marketing efforts more effective and efficient.
3. Sentiment analysis allows companies to monitor better “the voice of the customer” and use the data to adjust their services and products.
e. 1.5 Health Care Analytics
1. The use of analytics in health care is increasing because of pressure to control costs and provide more effective treatment simultaneously.
2. Descriptive, predictive, and prescriptive analytics are used to improve
(1) patient, staff, and facility scheduling, (2) patient flow, (3) purchasing, and (4) inventory control.
3. The use of prescriptive analytics for diagnosis and treatment may prove to be the most important application of analytics in health care.
f. 1.5 Supply Chain Analytics
1. Analytics has long been used to achieve the efficient delivery of goods: the core service of logistics companies.
(1) To UPS and FedEx, the optimal sorting of goods, vehicle and staff scheduling, and vehicle routing are all key to profitability.
2. Supply chain problems caused by the COVID-19 pandemic and world conflicts focused on using analytics to increase the resiliency of the supply chain.
(1) Descriptive analytics is used to monitor supply chain performance.
(2) Predictive analytics is used to quantify risk.
(3) Prescriptive analytics with scenario analysis is used to prepare supply chain solutions that can handle a high degree of disruption.
g. 1.5 Analytics for Government and Nonprofit Agencies
1. Government agencies use analytics to increase the effectiveness and accountability of programs.
(1) The U.S. Internal Revenue Service uses data mining to identify patterns that distinguish questionable annual personal income tax filings.
2. Likewise, nonprofit agencies use analytics to ensure their effectiveness and accountability to their donors and clients.
(1) Descriptive and predictive analytics monitor agency performance, track donor behavior, and forecast donations.
(2) Data mining helps identify potential donors and minimize donor attrition.
(3) Optimization allocates scarce resources in capital budgeting.
h. 1.5 Sports Analytics
1. Professional sports teams use analytics to (1) assess players for the amateur drafts, (2) decide how much to offer players in contract negotiations, and (3) assist with on-field decisions.
2. Sports franchises also use analytics for off-the-field business decisions.
(1) Based on fan survey data, a predictive technique known as conjoint analysis is used to design stadium premium seating.
(2) Prescriptive analytics dynamically adjust ticket prices throughout the season.
i. 1.5 Web Analytics
1. The analysis of online activity includes, but is not limited to, visits to websites and social media sites such as Facebook and LinkedIn.
2. Leading companies apply descriptive and advanced analytics to data collected in online experiments to determine the best way to (1) configure websites, (2) position ads, and (3) utilize social networks to promote products and services.
3. Because of the massive pool of Internet users, experiments can be conducted without risking the disruption of the company’s overall business.
VII. 1.6 Ethical and Legal Issues in the Use of Data and Analytics (PPT slides 27–31)
a. 1.6 Ethical Issues in the Use of Data and Analytics
1. Increased attention has been paid to ethical concerns around data privacy and the ethical use of models based on data.
(1) Clients and customers must understand the trade-offs between allowing their data to be collected and the benefits they accrue from allowing a company to collect and use that data.
(2) An agreement must be signed between the customer and the company.
2. Companies must uphold that agreement and make every effort to ensure that the data is protected from data breaches.
(1) Data breaches, defined as unauthorized uses of data, are a major concern for all companies.
b. 1.6 Legal Issues in the Use of Data and Analytics
1. The General Data Protection Regulation (GDPR), one of the strictest privacy laws that went into effect in the European Union in May 2018, stipulates that
(1) the request for consent to use an individual’s data must be easily understood and accessible,
(2) the intended use of data must be specified, and easy to withdraw consent, and
(3) the individual has a right to a copy of their data and the right to demand their data be erased.
2. It is the responsibility of analytics professionals to understand the laws associated with collecting, storing, and using individuals’ data.
c. 1.6 INFORMS Ethics Guidelines Relative to Society
1. Analytics professionals should aspire to be
(1) accountable for their professional actions and the impact of their work,
(2) forthcoming about their assumptions, interests, sponsors, motivations, limitations, and potential conflicts of interest,
(3) honest in reporting their results, even when they fail to yield the desired outcome,
(4) objective in their assessments of facts, irrespective of their opinions or beliefs,
(5) respectful of the viewpoints and the values of others, and (6) responsible for undertaking research and projects that provide positive benefits by
(a) advancing our scientific understanding, (b) contributing to organizational improvements, and (c) supporting social good.
d. 1.6 INFORMS Ethics Guidelines Relative to Organizations
1. Analytics professionals should aspire to be
(1) accurate in our assertions, reports, and presentations,
(2) alert to possible unintended or negative consequences that our results and recommendations may have on others,
(3) informed of advances and developments in the fields relevant to our work,
(4) questioning whether there are more effective and efficient ways to reach a goal,
(5) realistic in our claims of achievable results and in acknowledging when the best course of action may be to terminate a project, and
(6) rigorous by adhering to proper professional practices in developing and reporting our work.
e. 1.6 INFORMS Ethics Guidelines Relative to the Profession
1. Analytics professionals should aspire to be
(1) cooperative by sharing best practices, information, and ideas with colleagues, young professionals, and students, (2) impartial in our praise or criticism of others and their accomplishments, setting aside personal interests,
(3) inclusive of all colleagues, and rejecting discrimination and harassment in any form,
(4) tolerant of well-conducted research and well-reasoned results, which may differ from our findings or opinions,
(5) truthful in providing attribution when our work draws from the ideas of others, and
(6) vigilant by speaking out against actions that are damaging to the profession.
VIII. Summary (PPT slide 32)
(1) This introductory chapter began with a discussion of decision making.
(a) Decisions may be strategic, tactical, or operational.
(2) Business analytics can help us make better-informed decisions.
(3) There are three categories of analytics:
(a) descriptive, predictive, and prescriptive
(4) Big data is data that is too large for typical desktop software to handle.
(5) Cloud computing has made storing and processing vast amounts of data more efficient and cost-effective.
(6) We briefly discussed AI and how it relates to analytics and provided a few examples of how companies use it.
(7) We also discussed various application areas of analytics.
(8) We concluded the chapter with a discussion of legal and ethical issues in data and analytics.
IX. Discussion Activities (PPT slides 33–34)
a. Discussion Activity 1.1
1. Decision Making in Your Organization (LO 1-1)
(1) Review the definitions of the three decision levels for which today’s managers are responsible, as described in Section 1.1 of this textbook (slide #5).
(2) Consider a business entity with which you are familiar. It can be a public or private company you worked for in the past or a corporation or organization at which you would consider seeking employment in the future.
(3) Can you give an example each for strategic, tactical, and operational decisions you believe might improve such a business entity? Try to be specific.
b. Discussion Activity 1.2
1. Future Innovations on the Four Vs of Big Data (LO 1-4)
(1) Consider the Four Vs of Big Data as described in Section 1.3 of this textbook (slide #15).
(2) Which areas of scientific and technological innovations will have the largest impact on dealing with today’s main challenges of Big Data?
(3) Identify a single innovation for each of the four Vs.
X. Problems
a. #3 (LO 1-1, PPT slides 5–6) Airline Decisions
b. #4 (LO 1-2, PPT slide 7) Choosing a College
c. #6 (LO 1-3, PPT slides 8–13) Quality Control for Boxes of Cereal
d. #9 (LO 1-4, PPT slides 18-26) Supermarket Checkout Lanes
[return to top]