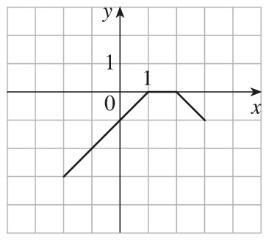
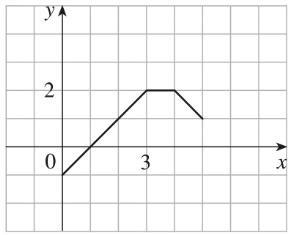
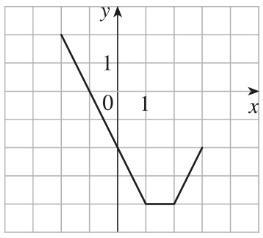
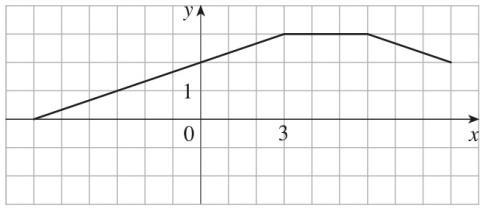
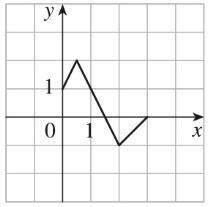
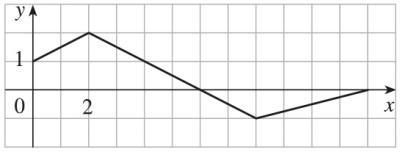
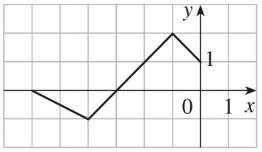
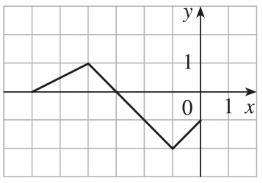
Solution and Answer Guide
JAMES STEWART / TROY DAY, BIOCALCULUS: CALCULUS, PROBABILITY, AND STATISTICS FOR THE LIFE SCIENCES, 2E, 2027, 9798214002576; CHAPTER 1: FUNCTIONS AND SEQUENCES
TABLE OF CONTENTS
1.1 Four Ways to Represent a
1.2 Mathematical Models: A Catalog of Essential
1.3 New Functions from
1.4 Exponential
1.5 Logarithms; Semi-log and Log-log Plots
Project The Coding Function of
1.6 Sequences and Difference Equations .........................................................................95
1 FUNCTIONS AND SEQUENCES
1.1 FOUR WAYS TO REPRESENT A FUNCTION 1.
Solution: The functions ( ) 2 fxxx =+− and ( ) 2 guuu =+− give exactly the same output values for every input value, so f and g are equal.
2.
Solution and Answer Guide: James Stewart / Troy Day, Biocalculus: Calculus, Probability, and Statistics for the Life Sciences, 2e, 2027, 9798214002576; Chapter 1: Functions and Sequences
Solution:
( ) ( ) 2 1 11 xx xx fxx xx === for 10 x − , so f and g [where ( ) gxx = ] are not equal because (1)f is undefined and ( ) 11 g = .
3
4
Solution:
(a) The point ( )1,3 is on the graph of f , so ( ) 13 f = .
(b) When 1 x =− , y is about 0.2 , so ( ) 10.2 f −−
(c) ( ) 1 fx = is equivalent to 1 y = . When 1 y = , we have 0 x = and 3 x = .
(d) A reasonable estimate for x when 0 y = is 0.8 x =− .
(e) The domain of f consists of all x -values on the graph of f . For this function, the domain is 24 x − , or 2,4 . The range of f consists of all y -values on the graph of f . For this function, the range is 13 y − , or 1,3
(f) As x increases from 2 to 1, y increases from 1 to 3 . Thus, f is increasing on the interval 2,1 .
Solution:
(a) The point ( )4,2 is on the graph of f , so ( ) 42 f −=− . The point (3,4) is on the graph of g , so (3)4g =
(b) We are looking for the values of x for which the y -values are equal. The y -values for f and g are equal at the points ( )2,1 and ( )2,2 , so the desired values of x are 2 and 2
(c) ( ) 1 fx =− is equivalent to 1 y =− . When 1 y =− , we have 3 x =− and 4 x = .
(d) As x increases from 0 to 4 , y decreases from 3 to 1 . Thus, f is decreasing on the interval 0,4.
(e) The domain of f consists of all x -values on the graph of f . For this function, the domain is 44 x − , or 4,4 . The range of f consists of all y -values on the graph of f . For this function, the range is 23 y − , or 2,3.
(f) The domain of g is 4,3 and the range is 0.5,4
5.
6
Solution and Answer Guide: James Stewart / Troy Day, Biocalculus: Calculus, Probability, and Statistics for the Life Sciences, 2e, 2027, 9798214002576; Chapter 1: Functions and Sequences
Solution:
No, the curve is not the graph of a function because a vertical line intersects the curve more than once. Hence, the curve fails the Vertical Line Test.
Solution:
Yes, the curve is the graph of a function because it passes the Vertical Line Test. The domain is 2,2 and the range is 1,2
7.
8.
9.
Solution:
Yes, the curve is the graph of a function because it passes the Vertical Line Test. The domain is 3,2 and the range is ) 3,21,3
Solution:
No, the curve is not the graph of a function since for 0 x = , 1 , and 2 , there are infinitely many points on the curve.
Solution:
(a) The graph shows that the global average temperature in 1950 was ( ) 195013.8C. T
(b) By drawing the horizontal line 14.2 T = to the curve and then drawing the vertical line down to the horizontal axis, we see that 1992 t .
(c) The temperature was smallest in 1910 and largest in 2006
(d) The range is
|13.514.513.5,14.5
10.
Solution:
(a) The range is
( Width|0Width1.60,1.6
(b) The graph displays an overall decline in global temperatures from 1500 to 1700 , followed by an overall rise in temperatures. The fluctuations in temperature in the mid and late 19th century are reflective of the cooling effects caused by several large volcanic eruptions.
11.
12.
Solution and Answer Guide: James Stewart / Troy Day, Biocalculus: Calculus, Probability, and Statistics for the Life Sciences, 2e, 2027, 9798214002576; Chapter 1: Functions and Sequences
Solution:
If we draw the horizontal line pH4.0 = , we can see that the pH curve is less than 4.0 between 12:23AM and 12:52AM . Therefore, a clinical acid reflux episode occurred approximately between 12:23AM and 12:52AM at which time the esophageal pH was less than 4.0
Solution:
The graphs indicate that tadpoles raised in densely populated regions take longer to put on weight. This is sensible since more crowding leads to fewer resources available for each tadpole.
13
Solution:
(a) At 30S and 20N , we expect approximately 100 and 134 ant species respectively.
(b) By drawing the horizontal line at a species richness of 100 , we see there are two points of intersection with the curve, each having latitude values of roughly 30N and 30S .
(c) The function is even since its graph is symmetric with respect to the y -axis.
14.
Solution:
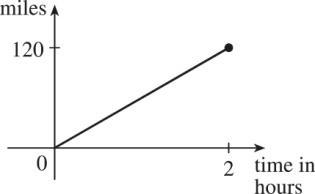
Example 1: A car is driven at 60mi/h for 2 hours. The distance d traveled by the car is a function of the time t . The domain of the function is |02tt , where t is measured in hours. The range of the function is |0120dd , where d is measured in miles.
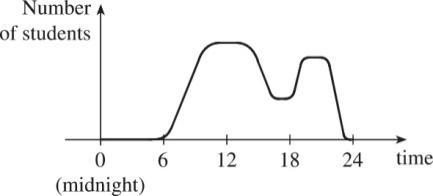
Example 2: At a certain university, the number of students N on campus at any time on a particular day is a function of the time t after midnight. The domain of the function is |024tt , where t is measured in hours. The range of the function is |0 NNk , where N is an integer and k is the largest number of students on campus at once.
15
Solution and Answer Guide: James Stewart / Troy Day, Biocalculus: Calculus, Probability, and Statistics for the Life Sciences, 2e, 2027, 9798214002576; Chapter 1: Functions and Sequences
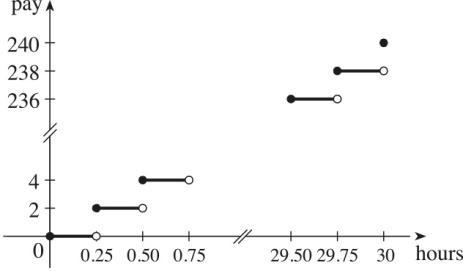
Example 3: A certain employee is paid $8.00 per hour and works a maximum of 30 hours per week. The number of hours worked is rounded down to the nearest quarter of an hour. This employee’s gross weekly pay P is a function of the number of hours worked h . The domain of the function is 0,30
and the range of the function is
16
0,2.00,4.00,,238.00,240.00
Solution:
The person’s weight increased to about 160 pounds at age 20 and stayed fairly steady for 10 years. The person’s weight dropped to about 120 pounds for the next 5 years, then increased rapidly to about 170 pounds. The next 30 years saw a gradual increase to 190 pounds. Possible reasons for the drop in weight at 30 years of age: diet, exercise, health problems.
Solution:
Initially, the person’s forward moving heel contacts the ground resulting in a ground reaction force in the opposite or negative direction. In moving from heel-strike to toe-off, the foot transitions from a forward push to a backward push. Hence, the ground reaction force switches from a negative value to a positive value, becoming zero at some point in between.
17.
Solution:
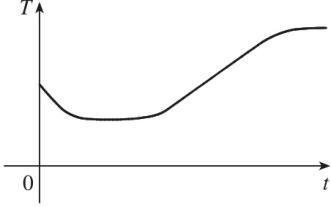
The water will cool down almost to freezing as the ice melts. Then, when the ice has melted, the water will slowly warm up to room temperature.
Solution and Answer Guide: James Stewart / Troy Day, Biocalculus: Calculus, Probability, and Statistics for the Life Sciences, 2e, 2027, 9798214002576; Chapter 1: Functions and Sequences
18
Solution:
Runner A won the race, reaching the finish line at 100 meters in about 15 seconds, followed by runner B with a time of about 19 seconds, and then by runner C who finished in around 23 seconds. B initially led the race, followed by C, and then A. C then passed B to lead for a while. Then A passed first B, and then passed C to take the lead and finish first. Finally, B passed C to finish in second place. All three runners completed the race.
19.
Solution:
Initially, the bacteria population size remains constant during which nutrients are consumed in preparation for reproduction. In the second phase, the population size increases rapidly as the bacteria replicate. The population size plateaus in phase three at which point the “carrying capacity” has been reached and the available resources and space cannot support a larger population. Finally, the bacteria die due to starvation and waste toxicity and the population declines.
20
Solution:
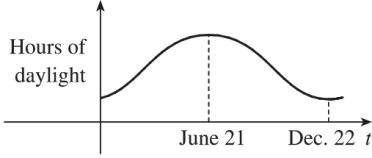
The summer solstice (the longest day of the year) is around June 21, and the winter solstice (the shortest day) is around December 22. (Exchange the dates for the southern hemisphere.)
21.
Solution:
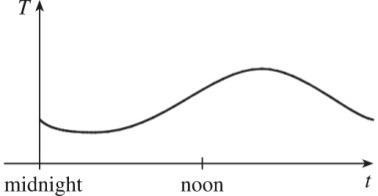
Of course, this graph depends strongly on the geographical location!
22.
Solution and Answer Guide: James Stewart / Troy Day, Biocalculus: Calculus, Probability, and Statistics for the Life Sciences, 2e, 2027, 9798214002576; Chapter 1: Functions and Sequences
Solution:
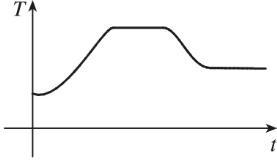
The temperature of the pie would increase rapidly, level off to oven temperature, decrease rapidly, and then level off to room temperature.
23
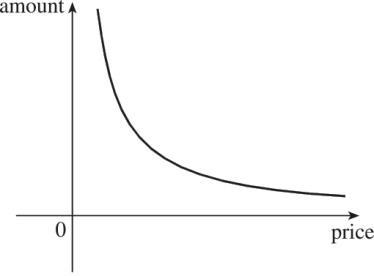
Solution: As the price increases, the amount sold decreases.
24
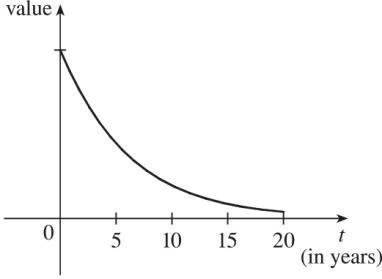
Solution:
The value of the car decreases fairly rapidly initially, then somewhat less rapidly.
25.
Solution and Answer Guide: James Stewart / Troy Day, Biocalculus: Calculus, Probability, and Statistics for the Life Sciences, 2e, 2027, 9798214002576; Chapter 1: Functions and Sequences
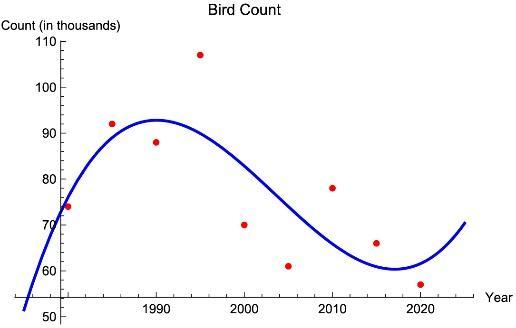
Solution: (a)
(b) In 1997, the count was approximately 87,000.
26
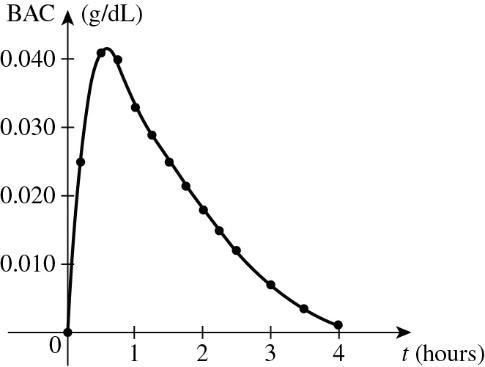
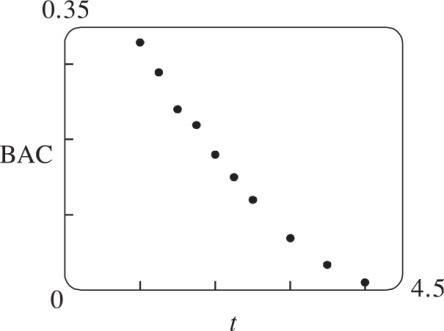
Solution: (a)
(b) The blood alcohol concentration rises rapidly, then slowly decreases to near zero.
27.
Solution:
( ) 2 32.fxxx=−+
( ) ( )2 23222122212. f =−+=−+=
( ) ( ) ( ) 2 23222122216. f −=−−−+=++=
( ) 2 32.faaa=−+
( ) ( ) ( ) 2 2 3232.faaaaa −=−−−+=++
( ) ( ) ( ) ( ) 2 222 13112321123631354. faaaaaaaaaaa +=+−++=++−−+=++−+=++
( ) ( ) ( ) 22 22232624. fafaaaaa ==−+=−+
2027 Cengage. All Rights Reserved. May not be scanned, copied or duplicated, or posted to a
28
Solution and Answer Guide: James Stewart / Troy Day, Biocalculus: Calculus, Probability, and Statistics for the Life Sciences, 2e, 2027, 9798214002576; Chapter 1: Functions and Sequences
( ) ( ) ( ) ( ) 2 22 2322234221222. faaaaaaa =−+=−+=−+
( ) ( ) ( ) ( ) 2 2224242 323232.faaaaaaa =−+=−+=−+
( ) ( )( ) 2 2 222 432322432 323232 93632624961344. faaaaaaa aaaaaaaaaaaa =−+=−+−+
=−+−+−+−+=−+−+ ( ) ( ) ( ) ( ) 2 2222 323223632. fahahahaahhahaahhah +=+−++=++−−+=++−−+
Solution: A spherical balloon with radius 1 r + has volume ( ) ( )3 4 11 3 Vrr +=+ ( ) 32 4 331 3 rrr =+++ . We wish to find the amount of air needed to inflate the balloon from a radius of r to 1 r + . Hence, we need to find the difference ( ) ( ) ( ) ( ) 3232444 1331331 333 VrVrrrrrrr +−=+++−=++ .
29
Solution: ( ) 2 43 fxxx =+− , so ( ) ( ) ( ) ( ) 2 2 3433349396 fhhhhhh +=++−+=++−++ 2 43hh=−− , and ( ) ( ) (
333
30
Solution: ( ) 3fxx = , so ( ) ( )3 3223 33 fahahaahahh +=+=+++ , and ( ) ( ) ( ) ( ) 3223322 22 3333 33 aahahhahaahh fahfa aahh hhh +++−++ +− ===++ .
31. Solution: ( ) ( ) ( ) ( ) ( ) 11 11 ax fxfaxa ax xaxa xaxaxaax xaxaxaxa =====−
© 2027 Cengage. All Rights Reserved. May not be scanned, copied or duplicated, or posted to a publicly accessible website, in whole or in part.
32.
Solution and Answer Guide: James Stewart / Troy Day, Biocalculus: Calculus, Probability, and Statistics for the Life Sciences, 2e, 2027, 9798214002576; Chapter 1: Functions and Sequences
Solution: ( ) ( )
) ( )( ) ( )( ) ( )( )
33
Solution: ( ) ( ) ( ) 2 4/9fxxx=+− is defined for all x except when ( )( ) 2 090333 xxxx =−=+−=− or 3 , so the domain is
( ) ( ) ( ) |3,3,33,33,xx−=−−−
34
Solution: ( ) ( ) ( ) 32 25/6fxxxx =−+− is defined for all x except when ( )( ) 2 060323 xxxxx =+−=+−=− or 2 , so the domain is ( ) ( ) ( ) |3,2,33,22,xx−=−−− .
35
Solution:
( ) 3 21ftt=− is defined for all real numbers. In fact ( ) 3 pt , where ( )pt is a polynomial, is defined for all real numbers. Thus, the domain is , or ( ) , − .
36
Solution:
( ) 32 gttt =−−+ is defined when 303 tt − and 202 tt +− . Thus, the domain is 23 t − , or 2,3
37.
Solution:
( ) 4 2 1/5 hxxx =− is defined when ( ) 2 5050xxxx−− . Note that 2 50xx− since that would result in division by zero. The expression ( )5 xx is positive if 0 x or 5 x . (See Appendix A for methods for solving inequalities.) Thus, the domain is ( ) ( ) ,05, − .
or
38.
Solution and Answer Guide: James Stewart / Troy Day, Biocalculus: Calculus, Probability, and Statistics for the Life Sciences, 2e, 2027, 9798214002576; Chapter 1: Functions and Sequences
Solution:
( ) 1 1 1 1 u fu u + = + + is defined when 101uu+− and 1 10 1 u + + . Since 11
101112 11 uu uu +==−=−−=− ++ , the domain is ( ) ( ) ( ) |2,1,22,11,uuu−−=−−−−− .
39
Solution:
()2 Fpp =− is defined when 0 p and 20 p − . Since 202pp− 2 p 04, p the domain is 0,4 .
40.
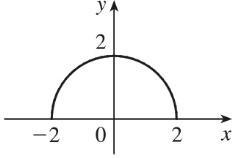
Solution: ( ) 2 4 hxx =− . Now 22222 444yxyxxy =−=−+= , so the graph is the top half of a circle of radius 2 with center at the origin. The domain is 22 |40|4|2||2,2 xxxxxx−===− . From the graph, the range is 02, y or 0,2 .
41
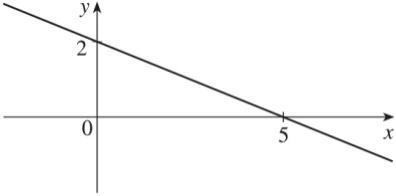
Solution: ( ) 20.4 fxx =− is defined for all real numbers, so the domain is , or ( ) , − . The graph of f is a line with slope 0.4 and y -intercept 2 .
© 2027 Cengage. All Rights Reserved. May not be scanned, copied or duplicated, or posted to a publicly accessible website, in whole or in part.
42.
Solution and Answer Guide: James Stewart / Troy Day, Biocalculus: Calculus, Probability, and Statistics for the Life Sciences, 2e, 2027, 9798214002576; Chapter 1: Functions and Sequences
Solution:
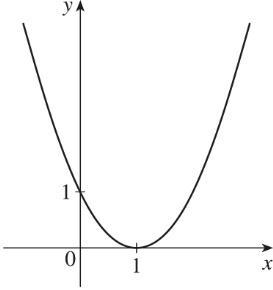
( ) ( )2 2 211Fxxxx =−+=− is defined for all real numbers, so the domain is , or ( ) , − . The graph of F is a parabola with vertex ( )1,0 .
43.
Solution:
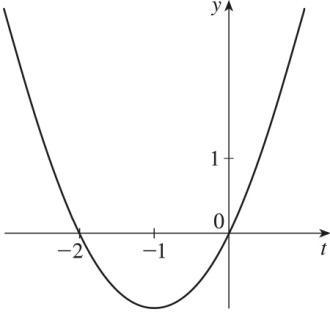
( ) 2 2 fttt =+ is defined for all real numbers, so the domain is , or ( ) , − . The graph of f is a parabola opening upward since the coefficient of 2 t is positive. To find the t -intercepts, let 0 y = and solve for t . ( ) 2 0220 ttttt =+=+= or 2 t =− . The t -coordinate of the vertex is halfway between the t-intercepts, that is, at 1 t =− . Since ( ) ( ) ( )2 1211211 f −=−+−=−+=− , the vertex is ( )1,1
44.
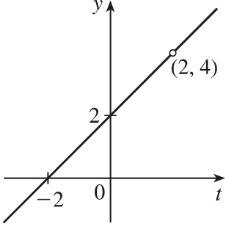
Solution: ( ) ( )( ) 2 422 22 tt t Ht tt +− == , so for 2 t , ()2 Htt =+ . The domain is {|2} tt . So the graph of H is the same as the graph of the function ( ) 2 ftt=+ (a line) except for the hole at ( )2,4
or
Solution and Answer Guide: James Stewart / Troy Day, Biocalculus: Calculus, Probability, and Statistics for the Life Sciences, 2e, 2027, 9798214002576; Chapter 1: Functions and Sequences
45.
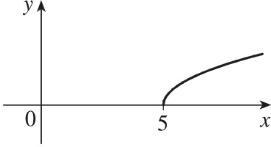
Solution: ( ) 5 gxx=− is defined when 50 x − or 5 x , so the domain is ) 5, . Since
555yxyxxy =−=−=+ , we see that g is the top half of a parabola.
46.
The domain is , or ( ) , − .
47.
Solution and Answer Guide: James Stewart / Troy Day, Biocalculus: Calculus, Probability, and Statistics for the Life Sciences, 2e, 2027, 9798214002576; Chapter 1: Functions and Sequences
Solution: ( ) 3|| xx Gx x + = . Since if0 ||if0 xx x xx
, we have ( ) 34if0if04if0 322if0 if0if0 xxx xx x xx Gx xxxx xx xx
Note that G is not defined for 0 x = . The domain is ( ) ( ) ,00, −
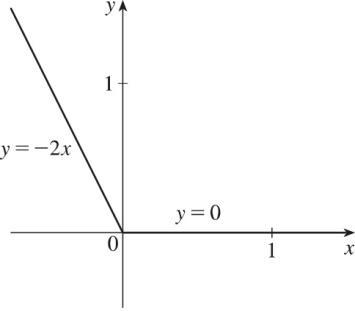
48 Solution: ( ) if00if0 ||if02if0 xxxx gxxx xxxxx
domain
49.
The domain is .
Solution and Answer Guide: James Stewart / Troy Day, Biocalculus: Calculus, Probability, and Statistics for the Life Sciences, 2e, 2027, 9798214002576; Chapter 1: Functions and Sequences
50.
domain
51 Solution: ( ) 2 2if1 if1 xx fx xx
Note that for 1 x =− , both 2 x + and 2 x are equal to 1. The domain is
52 Solution:
Note that for 3 x =− , both 9 x + and 2x are equal to 6 ; and for 3 x = , both 2x and 6 are equal to 6 . The domain is .
Solution and Answer Guide: James Stewart / Troy Day, Biocalculus: Calculus, Probability, and Statistics for the Life Sciences, 2e, 2027, 9798214002576; Chapter 1: Functions and Sequences
53
Solution:
Let the length and width of the rectangle be L and W . Then the perimeter is 2220 LW+= and the area is ALW = . Solving the first equation for W in terms of L gives 202 10 2 L WL ==− . Thus, ( ) 2 ()1010 ALLLLL =−=− . Since lengths are positive, the domain of A is 010 L . If we further restrict L to be larger than W , then 510 L would be the domain.
54
Solution:
Let the length and width of the rectangle be L and W . Then the area is 16 LW = , so that 16/ WL = . The perimeter is 22 PLW =+ , so ( ) ( ) 2216/232/ PLLLLL =+=+ , and the domain of P is 0 L , since lengths must be positive quantities. If we further restrict L to be larger than W , then 4 L would be the domain.
55.
Solution:
Let the length of a side of the equilateral triangle be x . Then by the Pythagorean Theorem, the height y of the triangle satisfies 2 22 1 2 yxx += , so that 2222 13 44 yxxx =−= and 3 2 yx = . Using the formula for the area A of a triangle, 1 (base)(height) 2 A = , we obtain 2 133()() 224 Axxxx
==
, with domain 0 x .
56.
Solution:
Let the volume of the cube be V and the length of an edge be L . Then 3VL = so
3 LV = , and the surface area is ( )2 3 22/3()666 SVLVV === , with domain 0 V
57.
Solution and Answer Guide: James Stewart / Troy Day, Biocalculus: Calculus, Probability, and Statistics for the Life Sciences, 2e, 2027, 9798214002576; Chapter 1: Functions and Sequences
Solution:
Let each side of the base of the box have length x , and let the height of the box be h Since the volume is 2 , we know that 2 2 hx = , so that 2 2/ hx = , and the surface area is 2 4 Sxxh =+ . Thus, ( ) ( ) ( ) 22242/8/ Sxxxxxx =+=+ , with domain 0 x .
58
Solution:
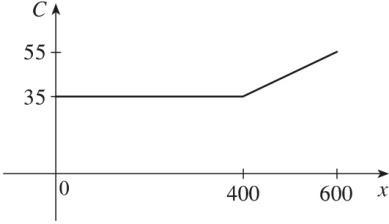
We can summarize the monthly cost with a piecewise defined function. ( ) 35if0400
59.
Solution:
We can summarize the total cost with a piecewise defined function. ( ) ( ) 75if02 150502if2 x x Tx x x =
60.
Solution:
One example is the amount paid for cable or telephone system repair in the home, usually measured to the nearest quarter hour. Another example is the amount paid by a student in tuition fees, if the fees vary according to the number of credits for which the student has registered.
61
Solution:
The period can be estimated by measuring the peak-to-peak distance on the graph. This is approximately 77 hours. Note that the graph shown is for a single person’s temperature. The period for this species of malaria is, on average, 72 hours.
62.
Solution and Answer Guide: James Stewart / Troy Day, Biocalculus: Calculus, Probability, and Statistics for the Life Sciences, 2e, 2027, 9798214002576; Chapter 1: Functions and Sequences
Solution:
The cycle of increased body temperature followed by a drop in temperature is indicative of a recurrent fever. This is typical of a P. falciparum infection. The period is approximately 48 hours, but the fever is also subsiding. This might be because the person is being treated for infection.
63.
Solution:
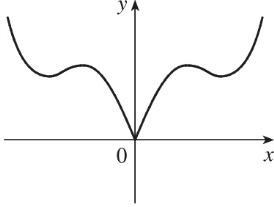
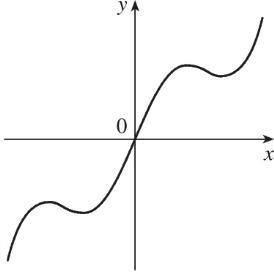
f is an odd function because its graph is symmetric about the origin. g is an even function because its graph is symmetric with respect to the y -axis.
64
Solution:
f is not an even function since it is not symmetric with respect to the y -axis. f is not an odd function since it is not symmetric about the origin. Hence, f is neither even nor odd. g is an even function because its graph is symmetric with respect to the y -axis.
65.
Solution:
(a) Because an even function is symmetric with respect to the y -axis, and the point ( )5,3 is on the graph of this even function, the point ( )5,3 must also be on its graph.
(b) Because an odd function is symmetric with respect to the origin, and the point ( )5,3 is on the graph of this odd function, the point ( )5,3 must also be on its graph.
66
Solution:
(a) If f is even, we get the rest of the graph by reflecting about the y -axis.
(b) If f is odd, we get the rest of the graph by rotating 180 about the origin.
Solution and Answer Guide: James Stewart / Troy Day, Biocalculus: Calculus, Probability, and Statistics for the Life Sciences, 2e, 2027, 9798214002576; Chapter 1: Functions and Sequences
67
So f is an odd function.
68 Solution: ( ) 2 4 . 1 x fx x = + ( ) ( ) ( ) ( ) 2 2 44 . 1 1 x x fxfx x x −=== + −+ So f is an even function.
69 Solution: ( ) 1 x fx x = + , so ( ) 11 xx fx xx −== −+− .
Since this is neither ( )fx nor ( )fx , the function f is neither even nor odd.
70
Solution: ( ) ||.fxxx = ( ) ( ) ( ) ( ) ( ) |||||| fxxxxxxx fx
So f is an odd function.
71
Solution and Answer Guide: James Stewart / Troy Day, Biocalculus: Calculus, Probability, and Statistics for the Life Sciences, 2e, 2027, 9798214002576; Chapter 1: Functions and Sequences 20 © 2027 Cengage. All Rights Reserved. May not be scanned, copied or duplicated, or posted to a publicly accessible website, in whole or in part.
Solution: ( ) 24 13 fxxx =+− ( ) ( ) ( ) ( ) −=+−−−=+−= 24 24 1313 fxxxxxfx . So f is an even function.
72.
Solution: ( ) 35 13 fxxx =+− , so ( ) ( ) ( ) ( ) ( ) 35 35 35 1313 13 fxxxxx xx −=+−−−=+−−− =−+
Solution and Answer Guide: James Stewart / Troy Day, Biocalculus: Calculus, Probability, and Statistics for the Life Sciences, 2e, 2027, 9798214002576; Chapter 1: Functions and Sequences
Since this is neither ( )fx nor ( )fx , the function f is neither even nor odd.
73
Solution:
(i) If f and g are both even functions, then ( ) ( )fxfx −= and ( ) ( )gxgx −= . Now
( ) ( ) ( ) ( ) ( ) ( )( ) () fgxfxgxfxgxfgx +−=−+−=+=+ , so fg + is an even function.
(ii) If f and g are both odd functions, then ( ) ( )fxfx −=− and ( ) ( )gxgx −=− . Now
( )( ) ( ) ( ) ( ) ( ) ( ) ( ) ( )( )fgxfxgxfxgxfxgxfgx +−=−+−=−+−=−+=−+
, so fg + is an odd function.
(iii) If f is an even function and g is an odd function, then ( )( ) ( ) ( )fgxfxgx +−=−+− ( ) ( )fxgx =+−= ( ) ( )fxgx , which is not ( )( )fgx + nor ( )( )fgx−+ , so fg + is neither even nor odd. (Exception: if f is the zero function, then fg + will be odd. If g is the zero function, then fg + will be even.)
74.
Solution:
(i) If f and g are both even functions, then ( ) ( )fxfx −= and ( ) ( )gxgx −= . Now ( )( ) ( ) ( ) ( ) ( ) ( )( )fgxfxgxfxgxfgx −=−−== , so fg is an even function.
(ii) If f and g are both odd functions, then ( ) ( )fxfx −=− and ( ) ( )gxgx −=− . Now ( )( ) ( ) ( ) ( ) ( ) ( ) ( ) ( )( )fgxfxgxfxgxfxgxfgx
, so fg is an even function.
(iii) If f is an even function and g is an odd function, then ( )( ) ( ) ( ) ( ) ( ) ( ) ( ) ( )( )fgxfxgxfxgxfxgxfgx
, so fg is an odd function.
1.2 MATHEMATICAL MODELS: A CATALOG OF ESSENTIAL FUNCTIONS
1.
Solution:
(a) ( ) 2log fxx = is a logarithmic function.
2.
Solution and Answer Guide: James Stewart / Troy Day, Biocalculus: Calculus, Probability, and Statistics for the Life Sciences, 2e, 2027, 9798214002576; Chapter 1: Functions and Sequences
(b) ( ) 4 gxx = is a root function with 4 n = .
(c) ( ) 3 2 2 1 x hx x = is a rational function because it is a ratio of polynomials.
(d) ( ) 2 11.12.54 uttt =−+ is a polynomial of degree 2 (also called a quadratic function).
(e) ( ) 5t vt = is an exponential function.
(f) ( ) 2sincos w = is a trigonometric function.
Solution:
(a) x y = is an exponential function (notice that x is the exponent).
(b) yx = is a power function (notice that x is the base).
(c) ( ) 2325 22 yxxxx =−=− is a polynomial of degree 5 .
(d) tancos ytt =− is a trigonometric function.
(e) ( ) /1 yss =+ is a rational function because it is a ratio of polynomials.
(f) ( ) 3 3 1/1 yxx =−+ is an algebraic function because it involves polynomials and roots of polynomials.
3.
4.
Solution:
We notice from the figure that g and h are even functions (symmetric with respect to the y -axis) and that f is an odd function (symmetric with respect to the origin). So
(b) 5yx = must be f . Since g is flatter than h near the origin, we must have (c) 8yx = matched with g and (a) 2yx = matched with h .
Solution:
(a) The graph of 3 yx = is a line (choice G ).
(b) 3x y = is an exponential function (choice f ).
(c) 3yx = is an odd polynomial function or power function (choice F ).
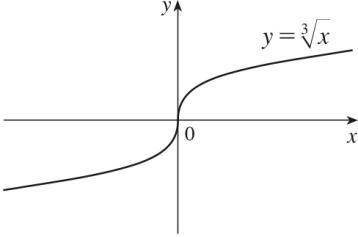
(d) 3 1/3 yxx == is a root function (choice g ).
5.
Solution:
6
Solution and Answer Guide: James Stewart / Troy Day, Biocalculus: Calculus, Probability, and Statistics for the Life Sciences, 2e, 2027, 9798214002576; Chapter 1: Functions and Sequences
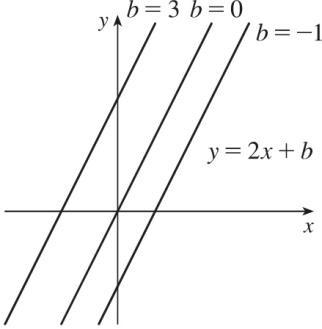
(a) An equation for the family of linear functions with slope 2 is ( ) 2 yfxxb ==+ , where b is the y-intercept.
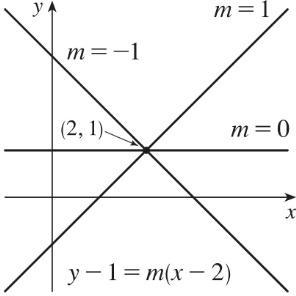
(b) ( ) 21 f = means that the point ( )2,1 is on the graph of f . We can use the pointslope form of a line to obtain an equation for the family of linear functions through the point ( )2,1 . ( )12ymx−=− , which is equivalent to ( ) 12 ymxm =+− in slopeintercept form.
(c) To belong to both families, an equation must have slope 2 m = , so the equation in part (b), ( ) 12 ymxm =+− , becomes 23yx=− . It is the only function that belongs to both families.
Solution:
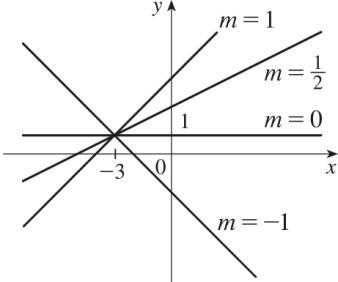
All members of the family of linear functions ( ) ( )13fxmx=++ have graphs that are lines passing through the point ( )3,1
7.
Solution:
Solution and Answer Guide: James Stewart / Troy Day, Biocalculus: Calculus, Probability, and Statistics for the Life Sciences, 2e, 2027, 9798214002576; Chapter 1: Functions and Sequences
All members of the family of linear functions ( ) fxcx =− have graphs that are lines with slope 1 . The y -intercept is c .
8.
9
Solution and Answer Guide: James Stewart / Troy Day, Biocalculus: Calculus, Probability, and Statistics for the Life Sciences, 2e, 2027, 9798214002576; Chapter 1: Functions and Sequences
Solution:
The vertex of the parabola on the left is ( )3,0 , so an equation is ( )2 30 yax=−+ .
Since the point ( )4,2 is on the parabola, we’ll substitute 4 for x and 2 for y to find a ( )2 2432 aa =−= , so an equation is ( ) ( )2 23fxx=−
The y -intercept of the parabola on the right is ( )0,1 , so an equation is 2 1. yaxbx=++ Since the points ( )2,2 and ( )1,2.5 are on the parabola, we’ll substitute 2 for x and 2 for y as well as 1 for x and 2.5 for y to obtain two equations with the unknowns a and b . ( ) 2,2:2421421 abab −=−+−= (1)
( ) 1,2.5:2.513.5 abab −−=+++=− (2)
2. (2) + (1) gives us 661 aa=−=− . From (2), 13.52.5 bb −+=−=− , so an equation is ( ) 2 2.51gxxx=−−+ .
Solution:
Since ( ) ( ) ( ) 1020 −===fff , f has zeros of 1 , 0 , and 2 , so an equation for f is ( ) ( ) ( )( )102 =−−−−
fxaxxx , or ( )( )12fxaxxx=+− . Because (1)6f = , we’ll substitute 1 for x and 6 for ( )fx . ( )( )( ) 6121263 =−−==− aaa , so an equation for f is ( ) ( )( )312=−+−fxxxx .
10
Solution:
(a) For 0.028.50Tt=+ , the slope is 0.02 , which means that the average surface temperature of the world is increasing at a rate of 0.02C per year. The T -intercept is 8.50 , which represents the average surface temperature in C in the year 1900.
(b) ( ) 210019002000.022008.5012.50C =−==+= tT
11.
Solution:
(a) 200 D = , so ( ) ( )( ) 0.041710.041720018.348.34 =+=+=+ cDaaa . The slope is 8.34 , which represents the change in mg of the dosage for a child for each change of 1 year in age.
(b) For a newborn, 0 a = , so 8.34mg c = .
12.
Solution and Answer Guide: James Stewart / Troy Day, Biocalculus: Calculus, Probability, and Statistics for the Life Sciences, 2e, 2027, 9798214002576; Chapter 1: Functions and Sequences
Solution:
(a) We are given changeinpressure4.340.434 10feetchangeindepth10 == . Using P for pressure and d for depth with the point ( ) ( ),0,15 = dP , we have the slope-intercept form of the line, 0.43415Pd=+
(b) When 100 P = , then 85 1000.434150.43485195.85feet 0.434 ddd =+== . Thus, the pressure is 2100lb/in at a depth of approximately 196feet .
13.
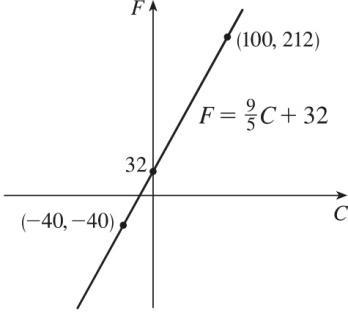
Solution: (a)
(b) The slope of 9 5 means that F increases 9 5 degrees for each increase of 1C .
(Equivalently, F increases by 9 when C increases by 5 and F decreases by 9 when C decreases by 5 .) The F -intercept of 32 is the Fahrenheit temperature corresponding to a Celsius temperature of 0 .
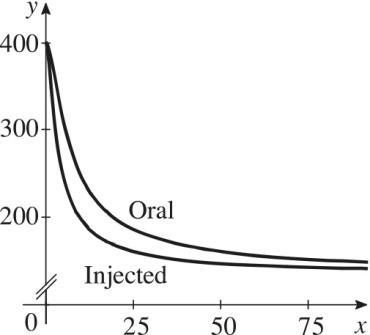
14
Solution:
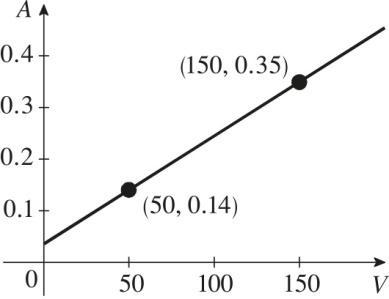
(a) Assuming A is a linear function of V , we can sketch the graph of ()AV by plotting the points ( )150,0.35 and ( )50,0.14 and drawing the straight line that passes through both these points.
15
Solution and Answer Guide: James Stewart / Troy Day, Biocalculus: Calculus, Probability, and Statistics for the Life Sciences, 2e, 2027, 9798214002576; Chapter 1: Functions and Sequences
(b) The slope is ( ) ( ) 1 150500.350.140.0021min 150150100 === AA m . This represents the rate of change of absorption rate with respect to volume. The slope of 0.0021 means that A increases by 0.0021mL/min for each 1mL increase in V .
(c) The A-intercept of 0.035mL/min is the absorption rate corresponding to a cerebrospinal fluid volume of 0mL
Solution:
16.
(a) Using N in place of x and T in place of y , we find the slope to be 21 21 8070101 173113606 TT NN === . So a linear equation is ( ) 111731307307 801738051.16 666666
TNTNTN .
−=−−=−=+=
(b) The slope of 1 6 means that the temperature in Fahrenheit degrees increases onesixth as rapidly as the number of cricket chirps per minute. Said differently, each increase of 6 cricket chirps per minute corresponds to an increase of 1F
(c) When 150 N = , the temperature is given approximately by ( ) 1307 150 66 T =+ = 76.16F76F
Solution:
(a) Using d in place of x and C in place of y , we find the slope to be 21 21 460380801 8004803204 CC dd === . So a linear equation is ( ) 111 460800460200260 444 −=−−=−=+ CdCdCd
(b) Letting 1500 d = we get ( ) 1 1500260635 4 =+= C . The cost of driving 1500 miles is $635
(c)
or
17
Solution and Answer Guide: James Stewart / Troy Day, Biocalculus: Calculus, Probability, and Statistics for the Life Sciences, 2e, 2027, 9798214002576; Chapter 1: Functions and Sequences
The slope of the line represents the cost per mile, $0.25 .
(d) The y -intercept represents the fixed cost, $260 .
(e) A linear function gives a suitable model in this situation because you have fixed monthly costs such as insurance and car payments, as well as costs that increase as you drive, such as gasoline, oil, and tires, and the cost of these for each additional mile driven is a constant.
Solution:
(a) The data appear to be periodic and a sine or cosine function would make the best model. A model of the form ( ) ( ) cos =+ fxabxc seems appropriate.
(b) The data appear to be decreasing in a linear fashion. A model of the form ( ) =+ fxmxb seems appropriate.
18
Solution:
(a) The data appear to be increasing exponentially. A model of the form ( ) = xfxab or ( ) =+ x fxabc seems appropriate.
(b) The data appear to be decreasing similarly to the values of the reciprocal function. A model of the form ( ) / = fxax seems appropriate.
19
Solution: (a)
A linear model does seem appropriate.
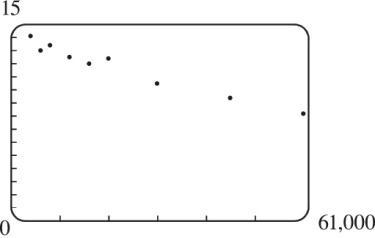
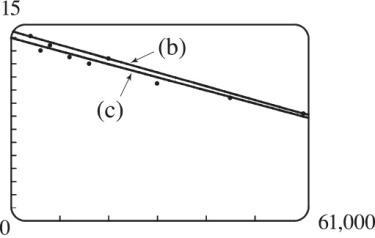
(b) Using the points ( )4000,14.1 and ( )60,000,8.2 , we obtain
8.214.1 14.14000 60,0004000 −=− yx or, equivalently, 0.00010535714.521429yx −+ .
Solution and Answer Guide: James Stewart / Troy Day, Biocalculus: Calculus, Probability, and Statistics for the Life Sciences, 2e, 2027, 9798214002576; Chapter 1: Functions and Sequences
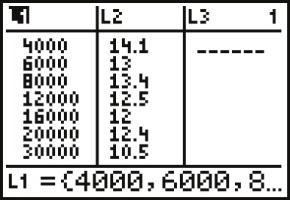
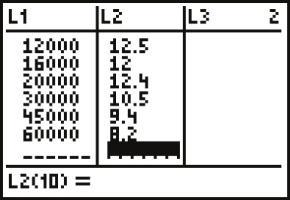
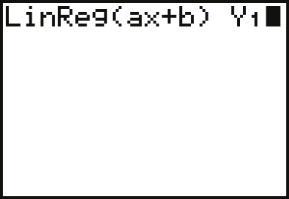
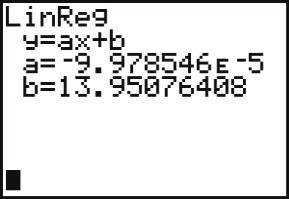
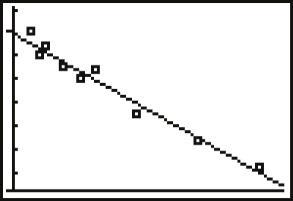
(c) Using a computing device, we obtain the least squares regression line 0.000099785513.950764yx =−+ . The following commands and screens illustrate how to find the least squares regression line on a TI-84 Plus. Enter the data into list one ( )L1 and list two ( )L2 . Press STAT1 to enter the editor.
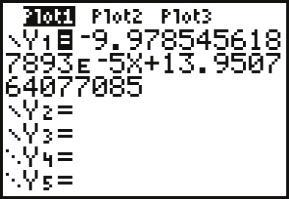
Find the regession line and store it in 1Y . Press 2ndQUITSTAT
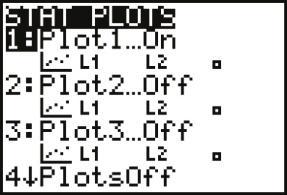
Note from the last figure that the regression line has been stored in 1Y and that Plot1 has been turned on (Plot1 is highlighted). You can turn on Plot1 from the Ymenu = by placing the cursor on Plot1 and pressing ENTER or by pressing 2ndSTATPLOT1ENTER
Now press ZOOM9 to produce a graph of the data and the regression line. Note that choice 9 of the ZOOM menu automatically selects a window that displays all of the data.
(d) When 25,000 x = , 11.456 y ; or about 11.5 per 100 population.
(e) When 80,000 x = , 5.968 y ; or about a 6% chance.
(f) When 200,000 x = , y is negative, so the model does not apply.
20.
Solution and Answer Guide: James Stewart / Troy Day, Biocalculus: Calculus, Probability, and Statistics for the Life Sciences, 2e, 2027, 9798214002576; Chapter 1: Functions and Sequences
Solution:
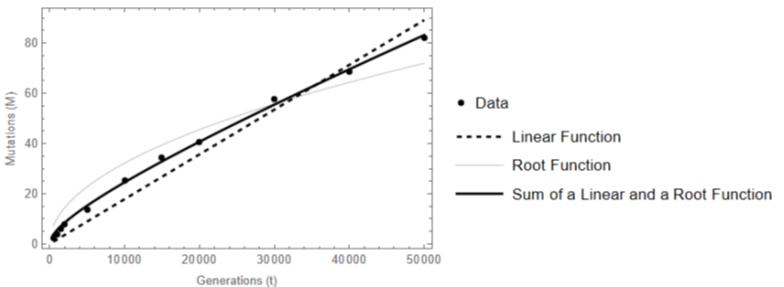
Using technology, the linear function that models the data is ( ) 0.001783, ftt = the root function is ( ) 0.321862, ftt = and the algebraic function consisting of the sum of a linear and a root function is ( ) 0.0010260.142625. fttt =+ A scatterplot of the data together with a plot of each function suggests that the function that is the sum of a linear and a root function best describes the data.
21.
Solution:
(a) Using technology, the function of the requested form that best fits the data is ( ) 0.723502 . 5000 t ft t = +
(b) The relative growth rate in generation 60,000 is predicted to be ( ) 60,0008 0.66. f
22.
Solution: (a)
(b)
Solution and Answer Guide: James Stewart / Troy Day, Biocalculus: Calculus, Probability, and Statistics for the Life Sciences, 2e, 2027, 9798214002576; Chapter 1: Functions and Sequences
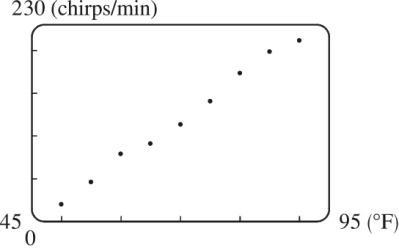
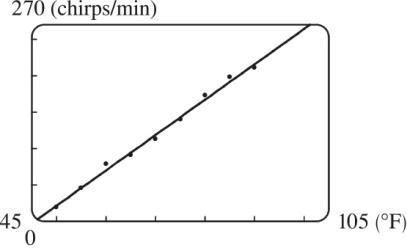
Using a computing device, we obtain the least squares regression line =−4.856220.96yx .
(c) When = 100F x , =264.7265chirps/min. y
23
Solution: (a)
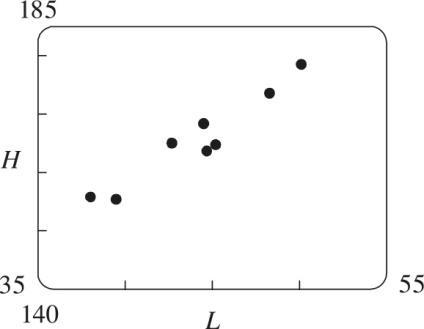
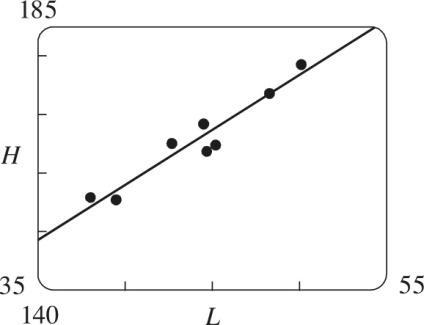
(b) Using a calculator to perform a linear regression gives =+1.880782.6497HL where H is the height in centimeters and L is the femur length in centimeters. This line, having slope 1.88 and H -intercept 82.65, is plotted below.
(c) The height of a person with L = 53 is cm. =+ (53)1(1.8807)(53)82.6497182.3H
24.
Solution:
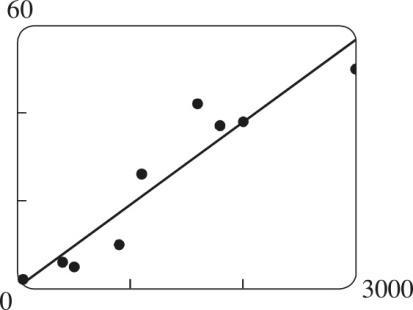
(a) Using a calculator to perform a linear regression gives 0.01880.3048yx=+ .
(b) The plot shows that the data is approximately linear. A higher degree polynomial fit, such as a cubic, may better model the data.
(c) The y -intercept represents the percentage of mice that developed tumors without any asbestos exposure.
25.
Solution and Answer Guide: James Stewart / Troy Day, Biocalculus: Calculus, Probability, and Statistics for the Life Sciences, 2e, 2027, 9798214002576; Chapter 1: Functions and Sequences
Solution:
If x is the original distance from the source, then the illumination is ( ) 22/.fxkxkx == Moving halfway to the lamp gives us an illumination of
( ) 2 4/kx = , so the light is 4 times as bright.
26.
Solution:
(a) Set 90 L = in and solve for
27
(b) Set 300lb W = and calculate: ( )0.3952 30.6300291.5in = L
(c) According to the model, a 300lb ostrich needs a wingspan of 292 in to fly. Therefore, an ostrich with a 72 in wingspan cannot generate enough lift for flight.
Solution:
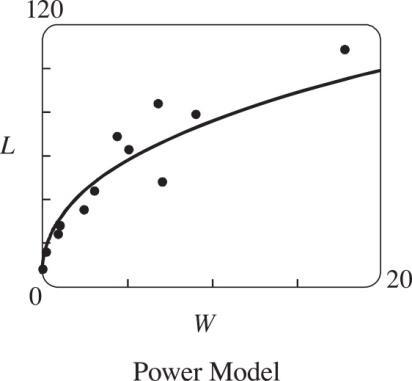
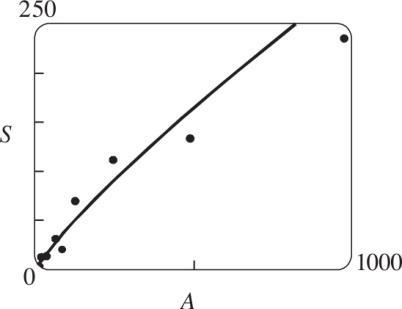
(a) Using a computing device, we obtain a power function bNcA = , where 3.1046 c and 0.308 b
(b) If 291 A = , then 17.8 bNcA= , so you would expect to find 18 species of reptiles and amphibians on Dominica.
28.
Solution:
(a) 1.499528750 1.000431227 Td =
(b) The power model in part (a) is approximately 1.5 Td = . Squaring both sides gives us 23Td = , so the model matches Kepler’s Third Law, 23Tkd = .
29
Solution:
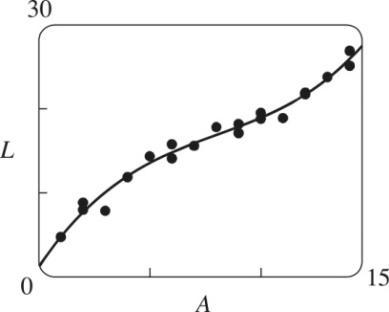
(a) Using a calculator to perform a 3 rd-degree polynomial regression gives 32 0.01550.37253.94611.2108LAAA =−++ where A is age and L is length. This polynomial is plotted along with a scatterplot of the data.
Solution and Answer Guide: James Stewart / Troy Day, Biocalculus: Calculus, Probability, and Statistics for the Life Sciences, 2e, 2027, 9798214002576; Chapter 1: Functions and Sequences
(b) A 5 -year old rock bass has a length of ( ) ( )( ) ( )( ) ( )( ) 32 50.015550.372553.946151.210813.6in =−++ L
(c) Using computer algebra software to solve for A in the equation 32 200.01550.37253.94611.2108 AAA =−++ gives 10.88 A years. Alternatively, the graph from part (a) can be used to estimate the age when 20 L = by drawing a horizontal line at 20 L = to the curve and observing the age at this point.
1.3 NEW FUNCTIONS FROM OLD FUNCTIONS
1.
Solution:
(a) If the graph of f is shifted 3 units upward, its equation becomes ( ) 3 =+yfx .
(b) If the graph of f is shifted 3 units downward, its equation becomes ( ) 3 =−yfx
(c) If the graph of f is shifted 3 units to the right, its equation becomes ( )3 =−yfx .
(d) If the graph of f is shifted 3 units to the left, its equation becomes ( )3 =+yfx .
(e) If the graph of f is reflected about the x-axis, its equation becomes ( ) =− yfx
(f) If the graph of f is reflected about the y -axis, its equation becomes ( ) =− yfx .
(g) If the graph of f is stretched vertically by a factor of 3 , its equation becomes ( ) 3 = yfx .
(h) If the graph of f is shrunk vertically by a factor of 3 , its equation becomes ( ) 1 3 = yfx
2.
Solution and Answer Guide: James Stewart / Troy Day, Biocalculus: Calculus, Probability, and Statistics for the Life Sciences, 2e, 2027, 9798214002576; Chapter 1: Functions and Sequences
Solution:
(a) To obtain the graph of ( ) 8 =+yfx from the graph of ( ) = yfx , shift the graph 8 units upward.
(b) To obtain the graph of ( )8 =+yfx from the graph of ( ) = yfx , shift the graph 8 units to the left.
(c) To obtain the graph of ( ) 8 = yfx from the graph of ( ) = yfx , stretch the graph vertically by a factor of 8.
(d) To obtain the graph of ( ) 8 = yfx from the graph of ( ) = yfx , shrink the graph horizontally by a factor of 8.
(e) To obtain the graph of ( ) 1 =−−yfx from the graph of ( ) = yfx first reflect the graph about the x -axis, and then shift it 1 unit downward.
(f) To obtain the graph of 1 8 8 yfx
from the graph of ( ) = yfx , stretch the graph horizontally and vertically by a factor of 8 .
3.
4
Solution:
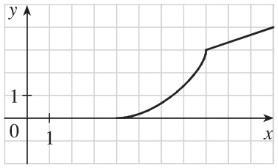
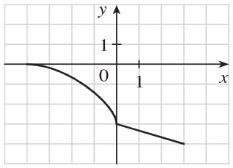
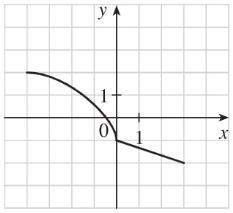
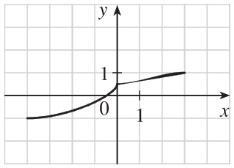
(a) (graph 3 ) The graph of f is shifted 4 units to the right and has equation ( )4 =−yfx
(b) (graph 1) The graph of f is shifted 3 units upward and has equation ( ) 3 =+yfx .
(c) (graph 4 ) The graph of f is shrunk vertically by a factor of 3 and has equation ( ) 1 3 = yfx
(d) (graph 5 ) The graph of f is shifted 4 units to the left and reflected about the xaxis. Its equation is ( )4 =−+yfx .
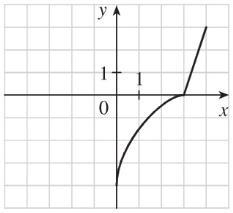
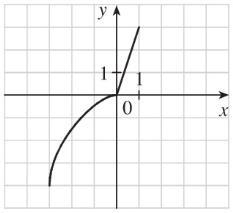
(e) (graph 2 ) The graph of f is shifted 6 units to the left and stretched vertically by a factor of 2 . Its equation is ( )26=+yfx .
Solution:
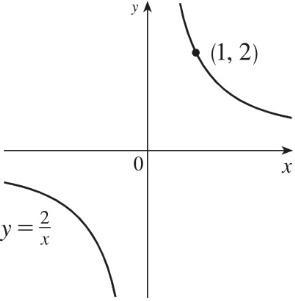
(a) To graph ( ) 2 =−yfx , we shift the graph of f , 2 units downward. The point (1,2) on the graph of f corresponds to the point ( ) ( )1,221,0 −=
Solution and Answer Guide: James Stewart / Troy Day, Biocalculus: Calculus, Probability, and Statistics for the Life Sciences, 2e, 2027, 9798214002576; Chapter 1: Functions and Sequences
(b) To graph ( )2 =−yfx , we shift the graph of f , 2 units to the right. The point ( )1,2 on the graph of f corresponds to the point ( ) ( )12,23,2 += .
(c) To graph ( ) 2=− yfx , we reflect the graph about the x -axis and stretch the graph vertically by a factor of 2 . The point ( )1,2 on the graph of f corresponds to the point ( ) ( )1,221,4 −=− .
(d) To graph 1 1 3 yfx
, we stretch the graph horizontally by a factor of 3 and shift it 1 unit upward. The point ( )1,2 on the graph of f corresponds to the point ( ) ( )13,213,3 += .
5.
Solution and Answer Guide: James Stewart / Troy Day, Biocalculus: Calculus, Probability, and Statistics for the Life Sciences, 2e, 2027, 9798214002576; Chapter 1: Functions and Sequences
Solution:
(a) To graph ( ) 2 = yfx we shrink the graph of f horizontally by a factor of 2 .
The point ( )4,1 on the graph of f corresponds to the point ( ) 1 4,12,1 2
(b) To graph 1 2 yfx
=
we stretch the graph of f horizontally by a factor of 2 .
The point ( )4,1 on the graph of f corresponds to the point ( ) ( )24,18,1 −=−
(c) To graph ( ) =− yfx we reflect the graph of f about the y -axis.
The point ( )4,1 on the graph of f corresponds to the point ( ) ( )14,14,1 −−=−−
(d) To graph ( ) =−− yfx we reflect the graph of f about the y -axis, then about the x -axis.
The point ( )4,1 on the graph of f corresponds to the point ( ) ( )14,114,1 −−−=−
6.
Solution and Answer Guide: James Stewart / Troy Day, Biocalculus: Calculus, Probability, and Statistics for the Life Sciences, 2e, 2027, 9798214002576; Chapter 1: Functions and Sequences
Solution:
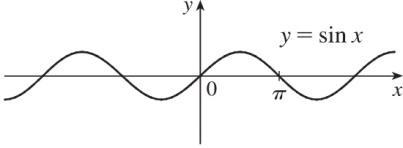
(a) The graph of 2sin yx = can be obtained from the graph of sin yx = by stretching it vertically by a factor of 2 .
(b) The graph of 1 yx =+ can be obtained from the graph of yx = by shifting it upward 1 unit.
7.
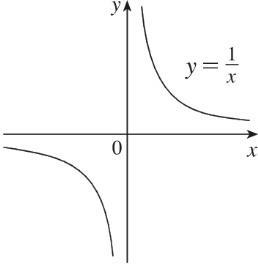
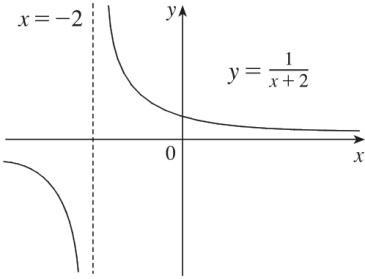
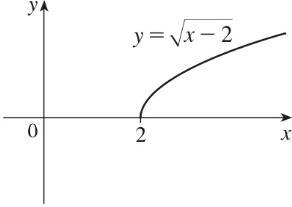
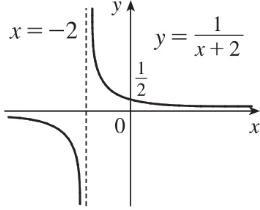
Solution: 1 2 y x = + : Start with the graph of the reciprocal function 1/ yx = and shift 2 units to the left.
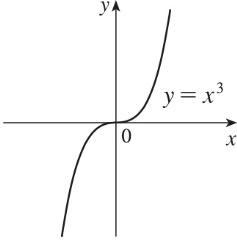
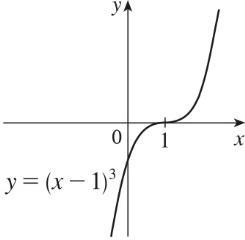
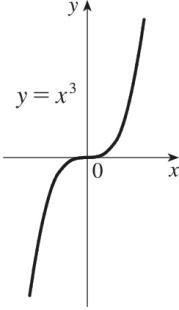
8. Solution: ( )3 1 =−yx : Start with the graph of 3yx = and shift 1 unit to the right.
9.
Solution and Answer Guide: James Stewart / Troy Day, Biocalculus: Calculus, Probability, and Statistics for the Life Sciences, 2e, 2027, 9798214002576; Chapter 1: Functions and Sequences
Solution:
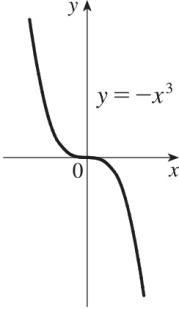
3 yx =− : Start with the graph of 3 yx = and reflect about the x -axis.
10
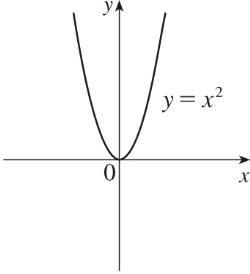
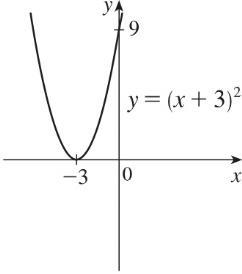
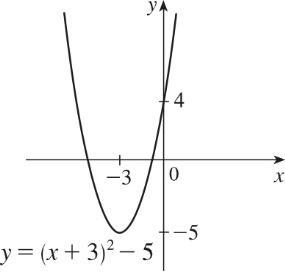
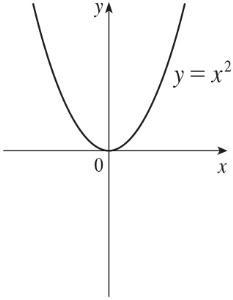
Solution: ( ) ( )2 226469535 =++=++−=+− yxxxxx : Start with the graph of 2yx = , shift 3 units to the left, and then shift 5 units downward.
11.
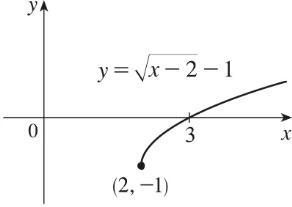
Solution: 21 yx=−− : Start with the graph of yx = , shift 2 units to the right, and then shift 1 unit downward.
12. Solution:
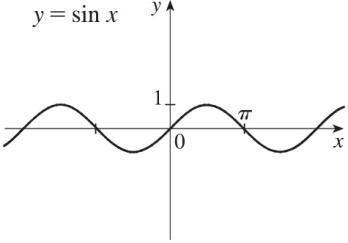
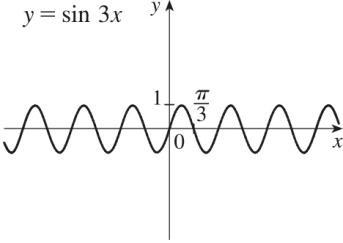
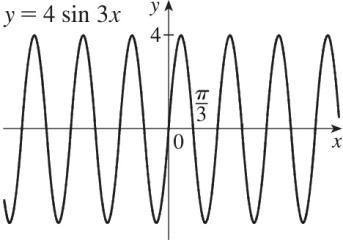
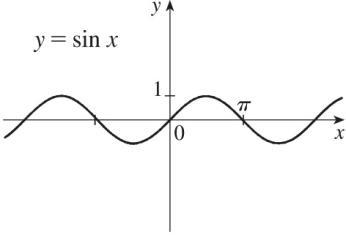
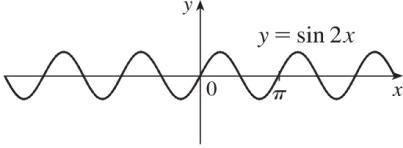
4sin3 yx = : Start with the graph of sin yx = , compress horizontally by a factor of 3 , and then stretch vertically by a factor of 4 .
13.
Solution and Answer Guide: James Stewart / Troy Day, Biocalculus: Calculus, Probability, and Statistics for the Life Sciences, 2e, 2027, 9798214002576; Chapter 1: Functions and Sequences
Solution:
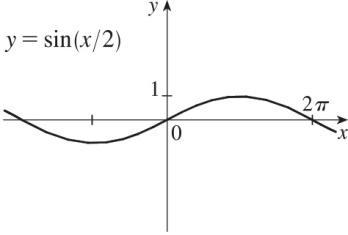
( )sin/2 = yx : Start with the graph of sin yx = and stretch horizontally by a factor of 2
14.
Solution:
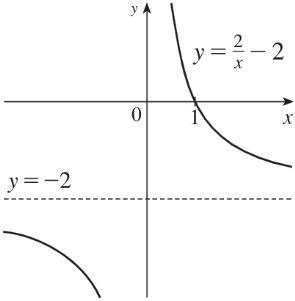
2
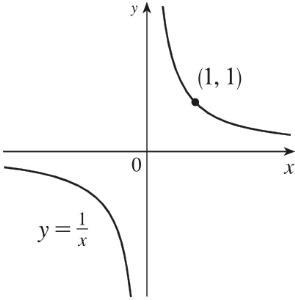
2 y x =− : Start with the graph of 1 y x = , stretch vertically by a factor of 2 , and then shift 2 units downward.
15
Solution:
3yx =− : Start with the graph of 3yx = and reflect about the x -axis. Note: Reflecting about the y -axis gives the same result since substituting x for x gives us ( )3 3 =−=− yxx .
16.
Solution and Answer Guide: James Stewart / Troy Day, Biocalculus: Calculus, Probability, and Statistics for the Life Sciences, 2e, 2027, 9798214002576; Chapter 1: Functions and Sequences
Solution:
123yx=−+ : Start with the graph of yx = , shift 3 units to the left, stretch vertically by a factor of 2 , reflect about the x -axis, and then shift 1 unit upward.
17
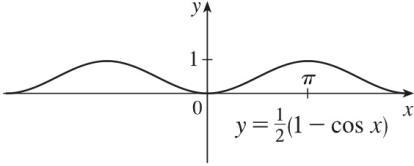
Solution: ( ) 1 1cos 2 yx =− : Start with the graph of cos yx = , reflect about the x -axis, shift 1 unit upward, and then shrink vertically by a factor of 2
18
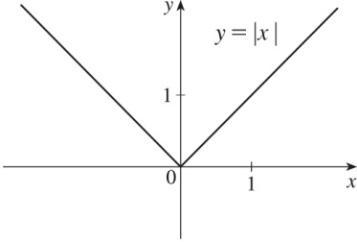
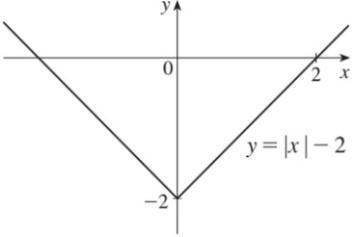
Solution: ||2yx=− : Start with the graph of ||yx = and shift 2 units downward.
19.
20
Solution and Answer Guide: James Stewart / Troy Day, Biocalculus: Calculus, Probability, and Statistics for the Life Sciences, 2e, 2027, 9798214002576; Chapter 1: Functions and Sequences
21.
Solution: ( ) ( ) ( )2 222
122121212 =−−=−++=−+++=−++ yxxxxxxx : Start with the graph of
2yx = , reflect about the x -axis, shift 1 unit to the left, and then shift 2 units upward.
Solution:
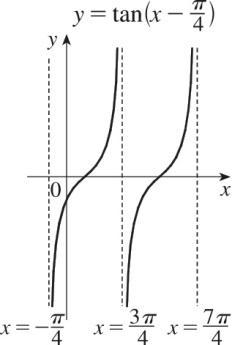
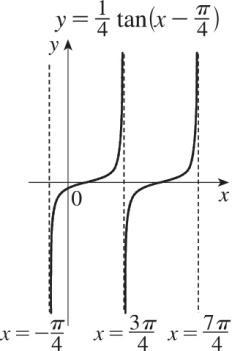
1 tan 44yx =− : Start with the graph of tan yx = , shift 4 units to the right, and then compress vertically by a factor of 4 .
Solution:
We know that ,VabM =+ where a and b are positive constants with 01. b So ( ) ( )TfVfabM ==+ The graph of ( ) TfV = is obtained from the graph of T as a function of M by Stretching, since 1 b the latter graph by a factor of 1/b (since 01 b ) and then the result shifting to the term a + bM shifts the graph to the left by a/b units, since b0. The graph of ( ) TfV = will have the same general shape as the graph of T as a function of M.
22.
Solution and Answer Guide: James Stewart / Troy Day, Biocalculus: Calculus, Probability, and Statistics for the Life Sciences, 2e, 2027, 9798214002576; Chapter 1: Functions and Sequences
Solution:
The appropriate drug dosage D decreases as kidney dysfunction x increases, and kidney dysfunction x increases as serum creatinine concentration C increases. Thus, a graph of dosage D as a function of serum creatinine concentration C would show that as C increases, D decreases.
23.
Solution:
This is just like the solution to Example 4 except the amplitude of the curve (the 30N curve in Figure 9 on June 21) is −= 14122 . So the function is
2 ()122sin(80) 365 Ltt . March 31 is the 90th day of the year, so the model gives (90)12.34hL . The daylight time ( 5:51AM to 6:18PM) is 12hours and 27minutes , or 12.45h . The model value differs from the actual value by 12.4512.34 0.009 12.45 , less than 1%.
24.
Solution:
Using a sine function to model the brightness of Delta Cephei as a function of time, we take its period to be 5.4days , its amplitude to be 0.35 (on the scale of magnitude), and its average magnitude to be 4.0. If we take = 0 t at a time of average brightness, then the magnitude (brightness) as a function of time t in days can be modeled by the formula
25
Solution:
Let ( )Dt be the water depth in meters at t hours after midnight. Apply the following transformations to the cosine function:
• Vertical stretch by factor 5 since the amplitude needs to be 122 5m 2 =
• Horizontal stretch by factor 126 2 = since the period needs to be 12h
• Vertical shift 7 units upward since the function ranges between 2 and 12 which has a midpoint of 122 7m 2 + =
26.
Solution and Answer Guide: James Stewart / Troy Day, Biocalculus: Calculus, Probability, and Statistics for the Life Sciences, 2e, 2027, 9798214002576; Chapter 1: Functions and Sequences
• Horizontal shift 6.75 units to right to position the maximum at 6.75h t = ( 6:45AM ) Combining these transformations gives the water depth function ( ) 5cos(6.75)7.
Solution:
Let ( )Vt be the total volume of air in mL after t seconds. Because the respiratory cycle is periodic, a sine function can be used as a model by applying the following transformations:
• Vertical stretch by factor 250 since the amplitude needs to be 500 250mL 2 =
• Horizontal stretch by factor 42 2 = since the period needs to be 4s
• Vertical shift 2250 units upward since the function ranges between 2000 and 2500 which has a midpoint of 20002500 2250mL 2 + = Combining these transformations gives the volume function ()250sin2250 2 Vtt
=+
27.
Solution:
Let ( )ft be the gene frequency after t years. The gene frequency dynamics can be modeled using a sine function with the following transformations:
• Vertical stretch by factor 30 since the amplitude needs to be 8020 30% 3 =
• Horizontal stretch by factor 3 2 since the period needs to be 3years
• Vertical shift 50 units upward since the function ranges between 80 and 20 which has a midpoint of 8020 50 2 + = Combining these transformations gives the gene frequency
28
Solution:
Let ( )Dt be the density of neutrophils in cells/L after t days. The density is periodic and can be modeled using a cosine function with the following transformations:
Solution and Answer Guide: James Stewart / Troy Day, Biocalculus: Calculus, Probability, and Statistics for the Life Sciences, 2e, 2027, 9798214002576; Chapter 1: Functions and Sequences
• Vertical stretch by factor 1000 since the amplitude needs to be 20000 1000 2 =
• Horizontal stretch by factor 21 2 since the period needs to be 21 days (or 3 weeks)
• Vertical shift 1000 units upward since the function ranges between 0 and 2000 which has a midpoint of 20000 1000 2 + = Combining these transformations gives the density function ( ) 2 1000cos1000
+ =
(c) ( )( ) ( )( ) 3225432 231362 =+−=+−− fgxxxxxxxx , D = (d) ( ) 32 2 2 31
Dxx since 2 310 x −
30.
Solution:
( ) 3 =− fxx , ( ,3 =− D ; ( ) 2 1 =−gxx , ( ) ,11, =−− D .
(a) ( )( ) 2 31 +=−+− fgxxx , ( ,11,3 =−− D , which is the intersection of the domains of f and g .
(b) ( )( ) 2 31 −=−+− fgxxx , ( ,11,3 =−−
D .
(c) ( )( ) 2 31=−−fgxxx , (,1][1,3] D =−− .
(d) ( ) 2 3 1 =
fx x g x , ( ) ,11,3 =−−
D . We must exclude 1 x = since these values would make f g undefined.
31.
Solution: ( ) 2 1 =−fxx , D = ; ( ) 21=+gxx , D =
32.
Solution and Answer Guide: James Stewart / Troy Day, Biocalculus: Calculus, Probability, and Statistics for the Life Sciences, 2e, 2027, 9798214002576; Chapter 1: Functions and Sequences
(a) ( )( ) ( ) ( ) ( ) ( ) ( ) 2 22 21211441144 ==+=+−=++−=+ fgxfgxfxxxxxx , D =
(b) ( )( ) ( ) ( ) ( ) ( ) ( ) 2222 121122121 ==−=−+=−+=− gfxgfxgxxxx , D = .
(c) ( )( ) ( ) ( ) ( ) ( ) ( ) 2 224242 1112112 ==−=−−=−+−=− ffxffxfxxxxxx , D = .
(d) ( )( ) ( ) ( ) ( ) ( ) ( ) 21221142143 ==+=++=++=+ ggxggxgxxxx , D =
Solution:
()2fxx=− ; ( ) 2 34=++gxxx D = for both f and g , and hence for their composites.
(a) ( )( ) ( ) ( ) ( ) ( ) ( ) 222 3434232 ==++=++−=++ fgxfgxfxxxxxx
(b) ( )( ) ( ) ( ) ( ) ( ) ( ) 2 22 22324443642. ==−=−+−+=−++−+=−+ gfxgfxgxxxxxxxx
(c) ( )( ) ( ) ( ) ( ) ( ) 2224 ==−=−−=− ffxffxfxxx .
(d) ( )( ) ( ) ( ) ( ) ( ) ( ) )+3+9 32 2 222 42322 432 34343344 (9166824124 62033 ggxggxgxxxxxx xx ==++=++++++ =+++++++ =+++ xxxxx xxxx+ .
33.
Solution: ( ) 13=− fxx ; ( ) cos = gxx . D = for both f and g , and hence for their composites.
(a) ( )( ) ( ) ( ) ( ) cos13cos===− fgxfgxfxx .
(b) ( )( ) ( ) ( ) ( ) ( ) 13cos13 ==−=− gfxgfxgxx
(c) ( )( ) ( ) ( ) ( ) ( ) 13131313992 ==−=−−=−+=− ffxffxfxxxx .
(d) ( )( ) ( ) ( ) ( ) ( ) coscoscos=== ggxggxgxx [Note that this is not coscosxx .]
34.
Solution: ( ) = fxx , ) 0, = D ; ( ) 3 1 =− gxx , D = .
(a) ( )( ) ( ) ( ) ( ) 336 111 ==−=−=− fgxfgxfxxx
2027 Cengage. All
Reserved. May not be scanned, copied or duplicated, or posted to a publicly accessible
35
Solution and Answer Guide: James Stewart / Troy Day, Biocalculus: Calculus, Probability, and Statistics for the Life Sciences, 2e, 2027, 9798214002576; Chapter 1: Functions and Sequences
The domain of fg is
3 |10|10|1,1
(b) ( )( ) ( ) ( ) ( ) 3 1 ===− gfxgfxgxx .
The domain of gf is | xx is in the domain of f and ( )fx is in the domain of g
This is the domain of f , that is, ) 0,
(c) ( )( ) ( ) ( ) ( ) 4 ffxffxfxxx ==== . The domain of ff is |0 xx and ) 00, = x .
(d) ( )( ) ( ) ( ) ( ) 3 33 111 ==−=−− ggxggxgxx , and the domain is ( ) , −
Solution: ( ) 1 =+fxx x ,
(a) ( )( ) ( ) ( ) ( )( ) ( )( ) ( )( ) ( ) ( ) ( )( ) ( )( )
Since ( )gx is not defined for 2 x =− and ( ) ( ) fgx is not defined for 2 x =− and 1 x =− , the domain of ( )( ) fgx is
Solution and Answer Guide: James Stewart / Troy Day, Biocalculus: Calculus, Probability, and Statistics for the Life Sciences, 2e, 2027, 9798214002576; Chapter 1: Functions and Sequences
( )( ) ( ) ( ) ( ) sin2 sin2 1sin2 === + x fgxfgxfx x
Domain: 1sin20sin212233 24
xx gfxgfxg xx
Domain: |1 − xx
(c) ( )( ) ( ) ( ) ( ) ( ) 1 11 1121 111 11
+ + + ====== ++++ + ++ + + x x x x xxx x ffxffxf xxxxx x x x x
Since ( )fx is not defined for 1 x =− , and ( ) ( ) ffx is not defined for 1 2 x =− , the domain of ( )( ) ffx is |1,1 2 =−− Dxx .
(d) ( )( ) ( ) ( ) ( ) ( ) sin2sin2sin2=== gggggxgxx
Domain: 37.
Solution: ( )( ) ( ) ( ) ( ) ( ) ( ) ( ) ( ) ( ) 222sin3sin2 ====− fghxfghxfgxfxx
38.
39.
Solution and Answer Guide: James Stewart / Troy Day, Biocalculus: Calculus, Probability, and Statistics for the Life Sciences, 2e, 2027, 9798214002576; Chapter 1: Functions and Sequences
41.
42
45.
Solution and Answer Guide: James Stewart / Troy Day, Biocalculus: Calculus, Probability, and Statistics for the Life Sciences, 2e, 2027, 9798214002576; Chapter 1: Functions and Sequences
Solution:
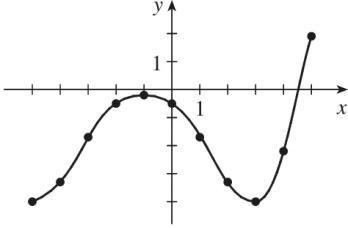
Let ( ) 2 = gtt and ( ) sectan = fttt . Then ( )( ) ( ) ( ) ( ) 2fgtfgtft ==
( ) ( ) ( ) 22sectanttvt==
46
Solution:
Let ( ) tan = gtt and ( ) 1 = + t ft t . Then ( )( ) ( ) ( ) ( ) ( ) tan (tan 1tan ==== + t fgtfgtftut t .
47
Solution:
Let ( ) = hxx , ( ) 1 =−gxx , and ( ) = fxx . Then
( )( ) ( ) ( ) ( ) ( ) ( ) ( ) ( ) 11 ===−=−= fghxfghxfgxfxxRx .
48
Solution:
Let ( ) ||= hxx , ( ) 2 =+ gxx , and ( ) 8 = fxx . Then
( )( ) ( ) ( ) ( ) ( ) ( ) ( ) ( ) 8 ||2||2|| ===+=+= fghxfghxfgxfxxHx .
49.
Solution:
Let ( ) = hxx , ( ) sec = gxx , and ( ) 4 = fxx . Then
( )( ) ( ) ( ) ( ) ( ) ( ) ( ) ( ) ( ) ( ) 4 4secsecsec ====== fghxfghxfgxfxxxHx
50.
Solution:
(a) ( ) ( ) ( ) 165fgf==
(b) ( ) ( ) ( ) 132 ==gfg
(c) ( ) ( ) ( ) 134fff==
(d) ( ) ( ) ( ) 163 ==ggg
(e) ( )( ) ( ) ( ) ( ) 3341 === gfgfg
(f) ( )( ) ( ) ( ) ( ) 6634fgfgf===
May not be scanned, copied or duplicated, or posted to a publicly accessible
51.
Solution and Answer Guide: James Stewart / Troy Day, Biocalculus: Calculus, Probability, and Statistics for the Life Sciences, 2e, 2027, 9798214002576; Chapter 1: Functions and Sequences
Solution:
(a) ( ) 25 = g , because the point ( )2,5 is on the graph of g . Thus, ( ) ( ) ( ) 254fgf== , because the point ( )5,4 is on the graph of f .
(b) ( ) ( ) ( ) 003 ==gfg
(c) ( )( ) ( ) ( ) ( ) 0030 === fgfgf
(d) ( )( ) ( ) ( ) ( )666 == gfgfg . This value is not defined, because there is no point on the graph of g that has x -coordinate 6
(e) ( )( ) ( ) ( ) ( ) 2214 −=−== ggggg
(f) ( )( ) ( ) ( ) ( ) 4422fffff===−
52.
Solution:
To find a particular value of ( ) ( ) fgx , say for 0 x = , we note from the graph that (0)2.8g and ( ) 2.80.5 − f . Thus, ( ) ( ) ( ) 02.80.5 −fgf . The other values listed in the table were obtained in a similar fashion.
53
Solution:
(a) Using the relationship distance=ratetime with the radius r as the distance, we have ( ) 60 = rtt .
(b) ( )( ) ( ) ( ) ( )2 22 603600 ==== ArArtArttt . This formula gives us the extent of the rippled area 2 (incm) at any time t .
54.
Solution and Answer Guide: James Stewart / Troy Day, Biocalculus: Calculus, Probability, and Statistics for the Life Sciences, 2e, 2027, 9798214002576; Chapter 1: Functions and Sequences
Solution:
(a) The radius r of the balloon is increasing at a rate of 2cm/s , so ( ) ( )( ) ( )2cm/ss2incm== rttt
(b) Using 3 4 3 Vr = ,we get ( )( ) ( ) ( ) ( ) ( )3 3 432 22. 33 ==== VrtVrtVttt The result, 3 32 3 Vt = , gives the volume of the balloon 3 (incm) as a function of time (ins) .
55.
Solution:
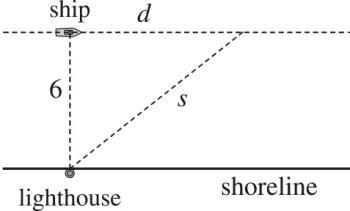
(a) From the figure, we have a right triangle with legs 6 and d , and hypotenuse s . By the Pythagorean Theorem, 22226()36dssfdd+===+ .
(b) Using drt = , we get ( )( ) ( )30km/hhours30inkm== dtt . Thus, ( ) 30 == dgtt .
(c) ( )( ) ( ) ( ) ( ) ( )2 2 30303690036 ===+=+ fgtfgtfttt . This function represents the distance between the lighthouse and the ship as a function of the time elapsed since noon.
56.
Solution:
(a) The passage of the drug through the body can be represented as inputs into the defined functions as follows: oralbloodsite of dosestreaminfection #surviving bacteria xhgf ⎯⎯⎯⎯→⎯⎯⎯⎯→⎯⎯⎯⎯⎯→⎯⎯⎯→
or
Solution and Answer Guide: James Stewart / Troy Day, Biocalculus: Calculus, Probability, and Statistics for the Life Sciences, 2e, 2027, 9798214002576; Chapter 1: Functions and Sequences
Therefore, the amount of the drug that reaches the site of infection is
, and the number of surviving bacteria is
(b) With direct injections, the bioavailability function is no longer required since the entire antibiotic dosage is administered directly into the bloodstream. In this case, the number of surviving bacteria is given by
57.
Solution:
(a) The diameter d of the tumor is increasing at a rate of mm/yearg , so ( ) ( )( ) ( )mm/yearyearinmm== dtgtgt .
(b) Using 22 4 Srd == for the surface area of a sphere, we get ( ) ( ) ( ) ( ) ( )2 22 () ==== SdtSdtSgtgtgt . Now, since P is proportional to the surface area, we have ( ) = PSkS where k is a proportionality constant. Thus, ( )( ) ( ) ( ) ( ) ( ) 2222 === PSdtPSdtPgtkgt
The result, 22Pkgt = , gives the rate of enzyme production as a function of time. Alternative Solution: If we assume the initial tumor size is nonzero so that ( ) 0 0 = dd , then 0 () dtdgt =+ . This gives ( )( ) ( )2 0 =+ PSdtkdgt
58
Solution:
Solution and Answer Guide: James Stewart / Troy Day, Biocalculus: Calculus, Probability, and Statistics for the Life Sciences, 2e, 2027, 9798214002576; Chapter 1: Functions and Sequences
If ( ) 1.04 = Axx , then
59.
These compositions represent the amount of the investment after 2 , 3 , and 4 years. Based on this pattern, when we compose n copies of A, we get the formula
60
Solution:
If ( ) 11=+ fxmxb and ( ) 22=+ gxmxb , then
( )( ) ( ) ( ) ( ) ( ) 22122112121 ==+=++=++ fgxfgxfmxbmmxbbmmxmbb . So fg is a linear function with slope 12mm .
Solution:
We need to examine ()hx
( ) ( )( ) ( ) ( ) ( ) ( ) ( ) becauseis even −=−=−== hxfgxfgxfgxghx
Because ( ) ( ) −= hxhx , h is an even function.
61
Solution:
( ) ( ) ( ) ( ) ( ) −=−=− hxfgxfgx . At this point, we can’t simplify the expression, so we might try to find a counterexample to show that h is not an odd function. Let ( ) = gxx , an odd function, and ( ) 2 =+ fxxx . Then ( ) 2 =+ hxxx , which is neither even nor odd.
Now suppose f is an odd function. Then ( ) ( ) ( ) ( ) ( ) −=−=− fgxfgxhx . Hence,
( ) ( ) −=− hxhx , and so h is odd if both f and g are odd.
Now suppose f is an even function. Then ( ) ( ) ( ) ( ) ( ) −== fgxfgxhx . Hence, ( ) ( ) −= hxhx , and so h is even if g is odd and f is even.
Solution and Answer Guide: James Stewart / Troy Day, Biocalculus: Calculus, Probability, and Statistics for the Life Sciences, 2e, 2027, 9798214002576; Chapter 1: Functions and Sequences
PROJECT THE BIOMECHANICS OF HUMAN MOVEMENT
1.
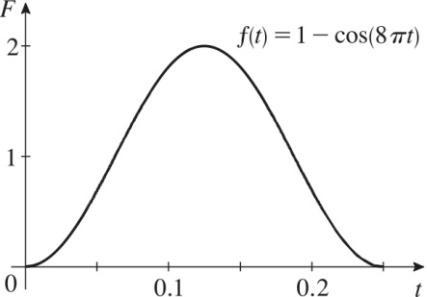
Solution:
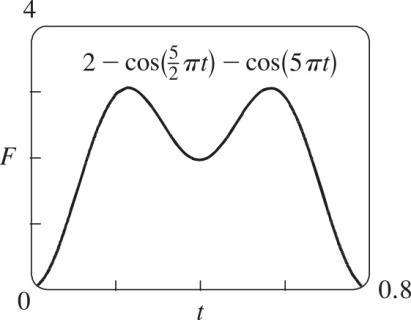
(a) The function ( ) ( ) 1cos8 =− ftt has a value of zero at 0s t = (foot-strike), smoothly increases to a peak value of 2 at 0.125s t = , and smoothly decreases to zero at 0.25s t = (toe-off). This effectively models the foot-strike cycle described.
(b)
2
Solution:
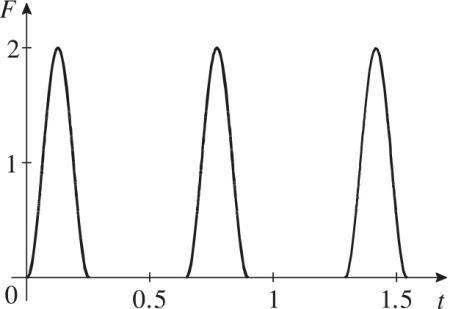
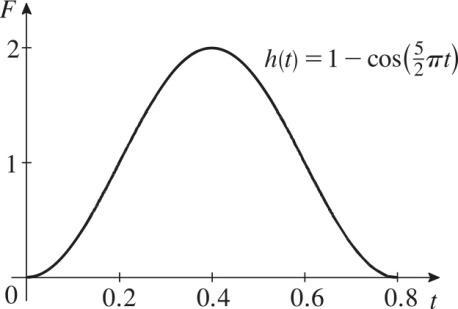
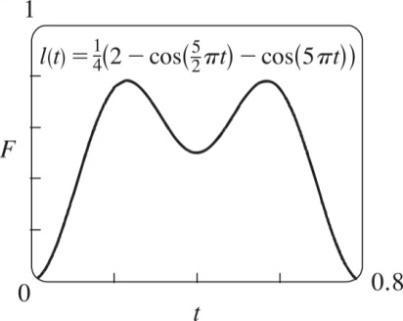
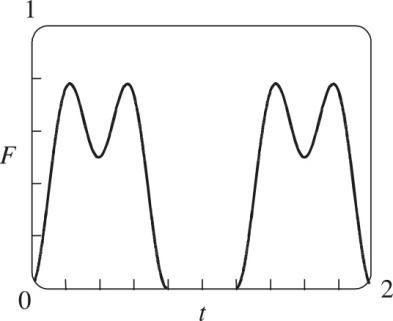
(a) Applying a horizontal stretch by a factor of 0.8s16 0.25s5 = to ( )ft gives the new
htftt which has a value of zero at 0s t = and 0.8s t = .
(b) Applying a horizontal compression by a factor of 2 to ( )ht gives a new function that oscillates twice as fast: ( ) ( ) 21cos5 =− htrt Adding this to ( )ht from part
3
Solution and Answer Guide: James Stewart / Troy Day, Biocalculus: Calculus, Probability, and Statistics for the Life Sciences, 2e, 2027, 9798214002576; Chapter 1: Functions and Sequences
(a) gives ( ) 5 2coscos5 2
tt . This function has the correct shape but the peak force is too high ( )3.125kN . Scaling this new function by a factor of 4 gives a function that closely approximates the stride-cycle in Figure 1 (b): ( ) ( ) 5 2coscos5/4 2
Solution: (a)
The constant q acts as a transition weight between the functions ( ) 1 5 1cos 2 =−
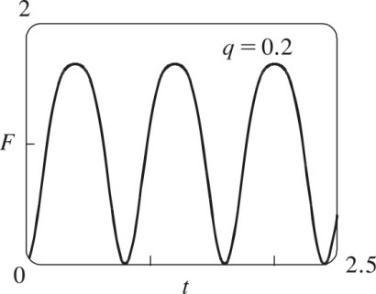
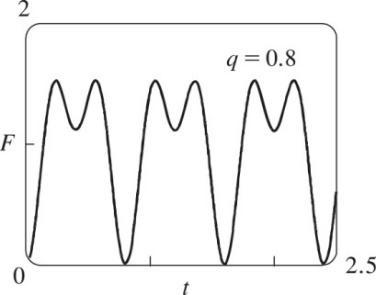
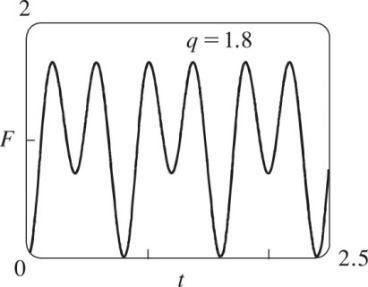
ftt and ( ) 2 ()1cos5. =− ftt When ( ) ( ) 1 0 == qgtft . As q increases, ()gt smoothly transitions from ( ) 1 ft to ( ) 2 ft (b) The graphs of ( )gt are similar in shape to the graph of ()lt from Problem 2(b) for constant values 0.8 q = and 1.8 q = . Note, however, that the peak values of ( )gt are higher than those of ( )lt
Solution and Answer Guide: James Stewart / Troy Day, Biocalculus: Calculus, Probability, and Statistics for the Life Sciences, 2e, 2027, 9798214002576; Chapter 1: Functions and Sequences
1.4 EXPONENTIAL FUNCTIONS
1.
2 Solution:
3
4. Solution: (a) 23123151
(b) ( ) ( ) 1/21/4 1/21/31/41/3 1/61/12 1/31/3 333 ==== ababab abab ab abab
5. Solution: (a) ( ) = xfxb , 0 b (b) (c) ( ) 0, (d) See Figures 5(c), 5(b), and 5(a), respectively.
6 Solution:
Solution and Answer Guide: James Stewart / Troy Day, Biocalculus: Calculus, Probability, and Statistics for the Life Sciences, 2e, 2027, 9798214002576; Chapter 1: Functions and Sequences
(a) The number e is the value of b such that the slope of the tangent line at 0 x = on the graph of xyb = is exactly 1.
(b) 2.71828 e
(c) ( ) = xfxe
7.
Solution and Answer Guide: James Stewart / Troy Day, Biocalculus: Calculus, Probability, and Statistics for the Life Sciences, 2e, 2027, 9798214002576; Chapter 1: Functions and Sequences
Solution:
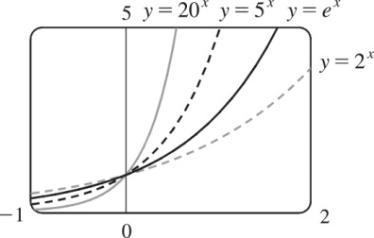
All of these graphs approach 0 as x →− , all of them pass through the point ( )0,1 , and all of them are increasing and approach as x → . The larger the base, the faster the function increases for 0 x , and the faster it approaches 0 as x →−
8.
Solution:
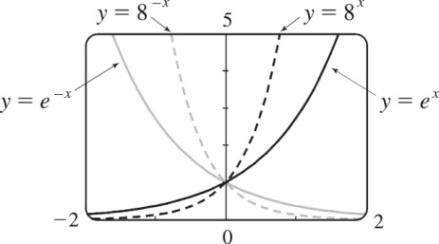
The graph of x e is the reflection of the graph of x e about the y-axis, and the graph of 8 x is the reflection of that of 8x about the y-axis. The graph of 8x increases more quickly than that of x e for 0 x , and approaches 0 faster as x →−
9.
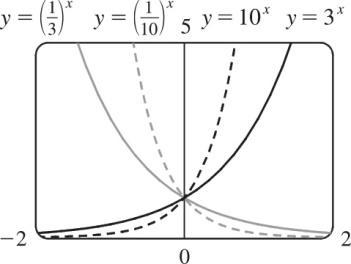
Solution:
The functions with bases greater than ( ) x an 13d10 x are increasing, while those with bases less than 11 1 310 and
are decreasing. The graph of 1 3 x
is the reflection of that of 3x about the y -axis, and the graph of 1 10 x
is the reflection of that of 10x about the y-axis.The graph of 10x increases more quickly than that of 3x for 0 x , and approaches 0 faster as x →− .
10.
Solution and Answer Guide: James Stewart / Troy Day, Biocalculus: Calculus, Probability, and Statistics for the Life Sciences, 2e, 2027, 9798214002576; Chapter 1: Functions and Sequences
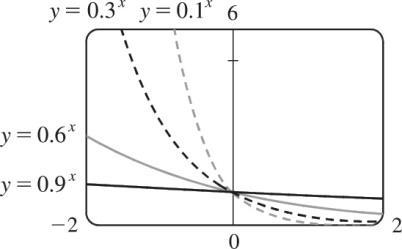
Solution:
Each of the graphs approaches as x →− , and each approaches 0 as x → . The smaller the base, the faster the function grows as x →− , and the faster it approaches 0 as x → .
11
Solution:
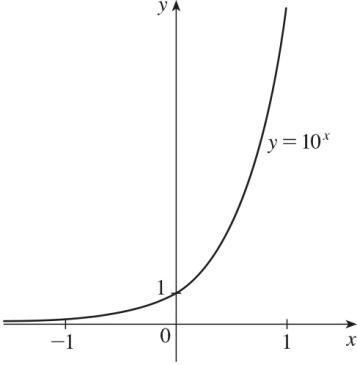
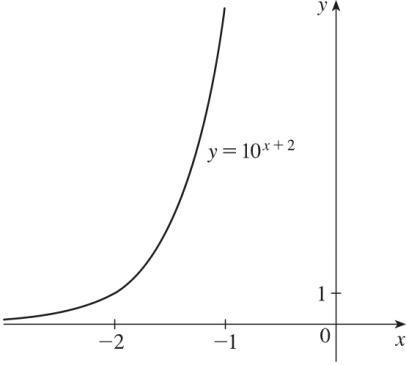
We start with the graph of 10x y = (Figure 4) and shift it 2 units to the left to obtain the graph of 2 10x y + =
12.
Solution:
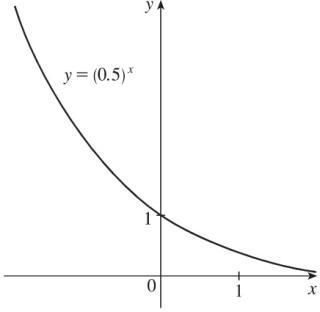
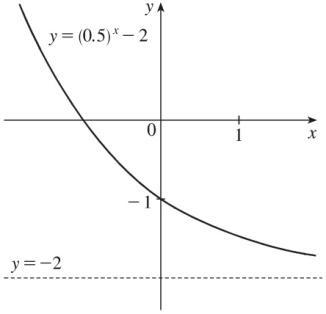
We start with the graph of ( )0.5 = x y (Figure 4) and shift it 2 units downward to obtain the graph of ( ) 0.52=− x y . The horizontal asymptote of the final graph is 2 y =− .
13.
Solution and Answer Guide: James Stewart / Troy Day, Biocalculus: Calculus, Probability, and Statistics for the Life Sciences, 2e, 2027, 9798214002576; Chapter 1: Functions and Sequences
Solution:
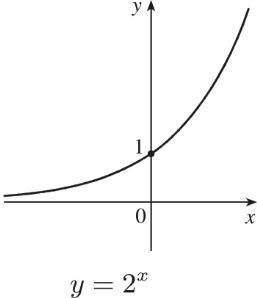
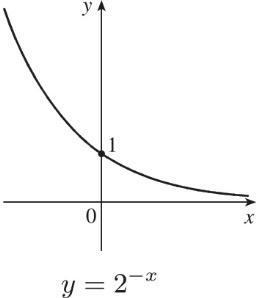
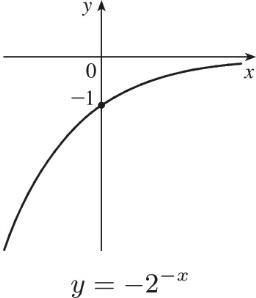
We start with the graph of 2x y = (Figure 4), reflect it about the y -axis, and then about the x -axis (or just rotate 180 to handle both reflections) to obtain the graph of 2 x y =− . In each graph, 0 y = is the horizontal asymptote.
14.
Solution:
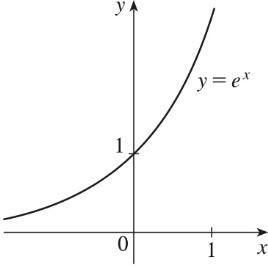
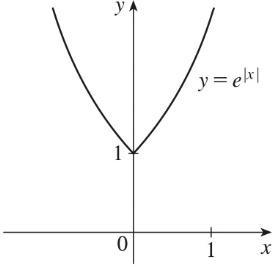
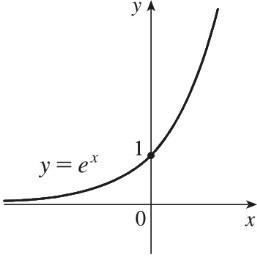
We start with the graph of xye = (Figure 17) and reflect the portion of the graph in the first quadrant about the y -axis to obtain the graph of || x ye = .
15
Solution:
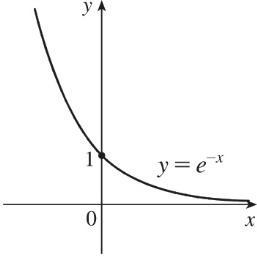
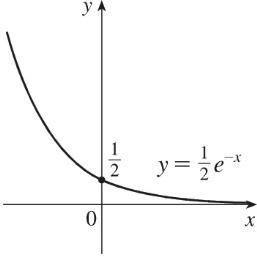
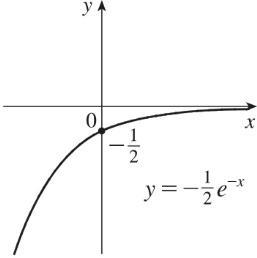
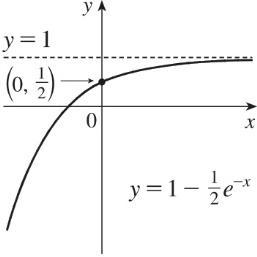
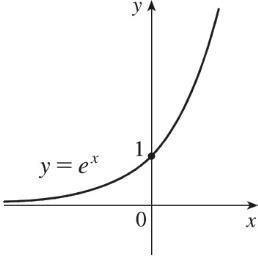
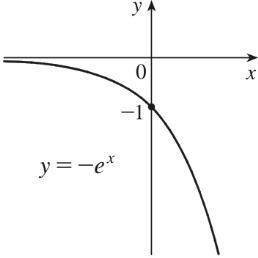
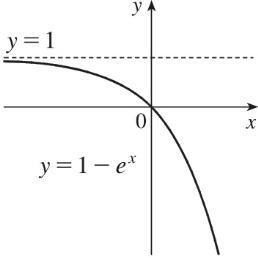
We start with the graph of xye = (Figure 17) and reflect about the y -axis to get the graph of x ye = . Then we compress the graph vertically by a factor of 2 to obtain the graph of 1 2 x ye = and then reflect about the x -axis to get the graph of 1 2 x ye =− .
Finally, we shift the graph upward one unit to get the graph of 1 1 2 x ye =− .
Solution and Answer Guide: James Stewart / Troy Day, Biocalculus: Calculus, Probability, and Statistics for the Life Sciences, 2e, 2027, 9798214002576; Chapter 1: Functions and Sequences
16
Solution:
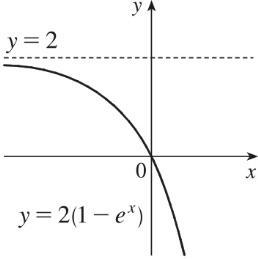
We start with the graph of xye = (Figure 17) and reflect about the x -axis to get the graph of xye =− . Then shift the graph upward one unit to get the graph of 1 xye =− Finally, we stretch the graph vertically by a factor of 2 to obtain the graph of ( ) 21 =− xye .
17
Solution:
(a) To find the equation of the graph that results from shifting the graph of xye = 2 units downward, we subtract 2 from the original function to get 2 xye=− .
(b) To find the equation of the graph that results from shifting the graph of xye = 2 units to the right, we replace x with 2 x in the original function to get (2) x ye = .
(c) To find the equation of the graph that results from reflecting the graph of xye = about the x -axis, we multiply the original function by 1 to get xye =− .
(d) To find the equation of the graph that results from reflecting the graph of xye = about the y -axis, we replace x with x in the original function to get x ye = .
(e) To find the equation of the graph that results from reflecting the graph of xye = about the x -axis and then about the y -axis, we first multiply the original function by 1 (to get ) xye =− and then replace x with x in this equation to get x ye =−
18
Solution:
(a) This reflection consists of first reflecting the graph about the x -axis (giving the graph with equation ) xye =− and then shifting this graph 248 = units upward. So the equation is 8 xye=−+ .
Solution and Answer Guide: James Stewart / Troy Day, Biocalculus: Calculus, Probability, and Statistics for the Life Sciences, 2e, 2027, 9798214002576; Chapter 1: Functions and Sequences
(b) This reflection consists of first reflecting the graph about the y -axis (giving the graph with equation ) x ye = and then shifting this graph 224 = units to the right.
So the equation is (4) x ye =
19
Solution:
(a) The denominator is zero when 22 112 101101 xx eexx −==−== . Thus, the function ( ) 2 2 1 1 1 = x x e fx e has domain
( ) ( ) ( ) |1,11,11, =−−− xx .
(b) The denominator is never equal to zero, so the function ( ) cos 1 + = x x fx e has domain , or ( ) , − .
20
Solution:
(a) The sine and exponential functions have domain , so ( ) ()sin = t gte also has domain .
(b) The function ( ) 12=− t gt has domain
tt tttt 21.
Solution:
Use xyCb = with the points ( )1,6 and (3,24) . 1 6 6 == CbC b and 332 6 242442 ====
Cbbbb b [since 0 b ] and 6 3 2 C == . The function is ()32x fx = . 22
Solution:
Use xyCb = with the points ( )1,3 and 4 1, 3
. From the point ( )1,3 , we have 1 3 Cb = , hence 3 Cb = . Using this and the point 4 1, 3
, we get ( ) 1 444 3 339 Cbbb == 2 2 3 bb == [since 0 b ] and 2 32 3
C . The function is ( ) 2 2 3 x fx
23.
Solution and Answer Guide: James Stewart / Troy Day, Biocalculus: Calculus, Probability, and Statistics for the Life Sciences, 2e, 2027, 9798214002576; Chapter 1: Functions and Sequences
Solution:
If ( ) 5 = x fx , then ( ) ( ) 555555(51)51 5 + +−
24
Solution:
Suppose the month is February. Your payment on the 28th day would be 28127 22134,217,728 == cents, or $1,342,177.28 . Clearly, the second method of payment results in a larger amount for any month.
25
Solution: 2ft24in = , ( ) 2 2424in576in48ft === f . ( ) ( ) 2424 242in2/125280mi265mi == g
26.
Solution:
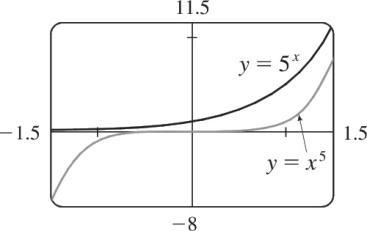
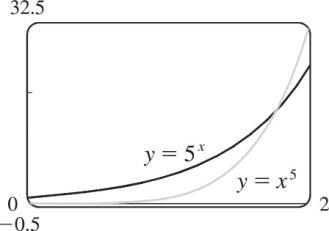
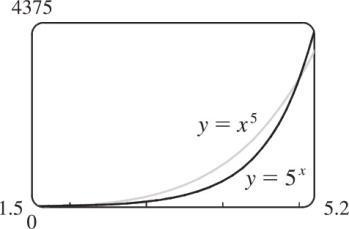
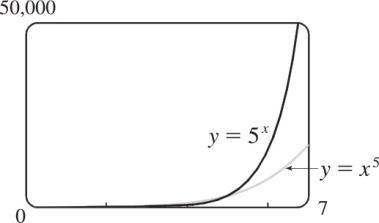
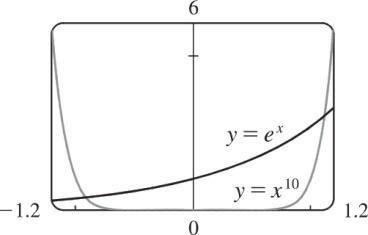
We see from the graphs that for x less than about 1.8 , ( ) ( ) 5 5 == x gxfxx and then near the point ( 1.8 , 17.1 ) the curves intersect. Then ( ) ( ) fxgx from 1.8 x until 5 x = At ( )5,3125 there is another point of intersection, and for 5 x we see that ()() gxfx . In fact, g increases much more rapidly than f beyond that point.
27.
Solution:
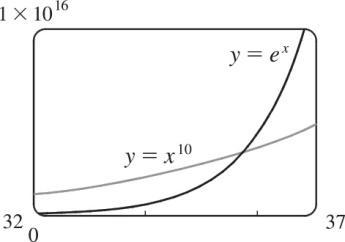
The graph of g finally surpasses that of f at 35.8 x .
Solution and Answer Guide: James Stewart / Troy Day, Biocalculus: Calculus, Probability, and Statistics for the Life Sciences, 2e, 2027, 9798214002576; Chapter 1: Functions and Sequences
28
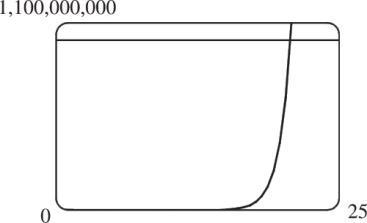
Solution: We graph xye = and 1,000,000,000 y = and determine where 9110 xe = . This seems to be true at 20.723 x , so 9110 xe for 20.723 x .
29.
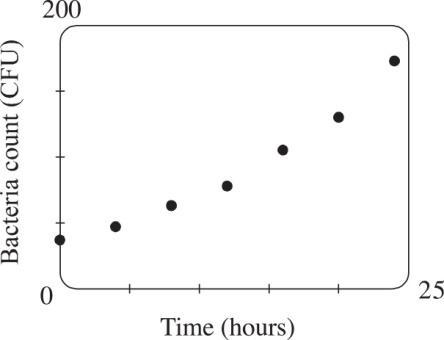
Solution: (a)
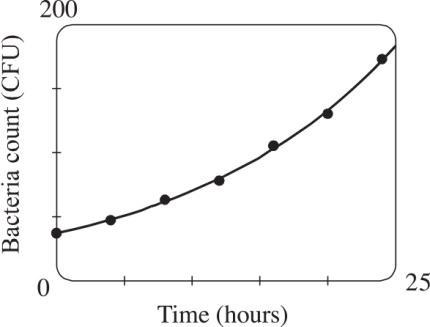
(b) Using a calculator to fit an exponential curve to the data gives ( ) ( ) ( ) =36.781.07. t ft (c)
Using the TRACE feature of a calculator, we find that the bacteria count increases from 50CFU to 100CFU in about 10.8 hours Therefore it takes approximately 10.8 hours for the bacteria count to double.
30
Solution:
Solution and Answer Guide: James Stewart / Troy Day, Biocalculus: Calculus, Probability, and Statistics for the Life Sciences, 2e, 2027, 9798214002576; Chapter 1: Functions and Sequences
(a) Three hours represents 6 doubling periods (one doubling period is 30 minutes). 6 500232,000 =
(b) In t hours, there will be 2t doubling periods. The initial population is 500 , so the population y at time t is 25002 t y = .
(c) 2(2/3) 402 50021260 603 ty===
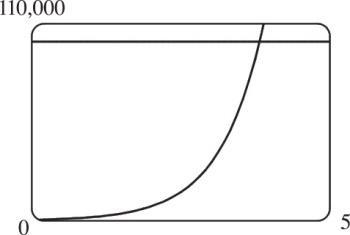
(d) We graph 2 1 5002 t y = and 2 100,000 y = The two curves intersect at 3.82 t , so the population reaches 100,000 in about 3.82 hours.
31.
Solution:
(a) Fifteen days represents 3 half-life periods (one half-life period is 5 days). 3 1 20025mg 2
(b) In t hours, there will be /5 t half-life periods. The initial amount is 200mg , so the amount remaining after t days is /5 1 200 2 t y
, or equivalently, /5 2002. t y =
(c) 21/5 3weeks21daysy200210.9mg t ===
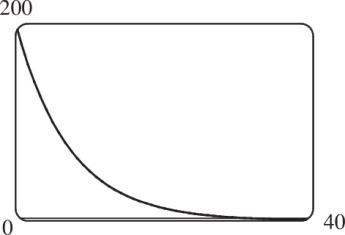
(d) We graph /5 1 2002 t y = and 2 1 y = . The two curves intersect at 38.2 t , so the mass will be reduced to 1 mg in about 38.2 days.
32
Solution:
(a) Sixty hours represents 4 half-life periods. 4 11 2g
Solution and Answer Guide: James Stewart / Troy Day, Biocalculus: Calculus, Probability, and Statistics for the Life Sciences, 2e, 2027, 9798214002576; Chapter 1: Functions and Sequences
(b) In t hours, there will be /15 t half-life periods. The initial mass is 2 g, so the
(c) 4days42496hours == .
(d) 0.01114.7hoursyt=
33. Solution:
The half-life is approximately 3.5 days since the RNA load drops from 40 to 20 in that time.
34. Solution:
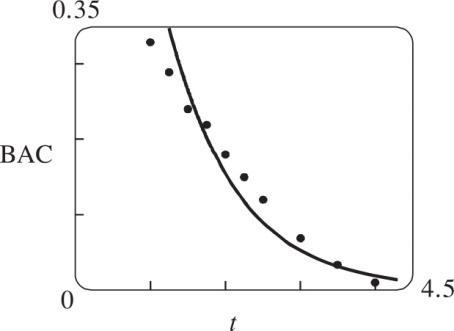
(a) The exponential decay model has the form ( )
Cta
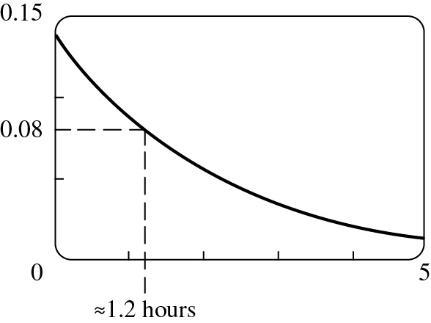
, where t is the number of hours after midnight and ( )Ct is the BAC. We are given that ( ) 00.14,0.14,Csoa== and the model is ( )
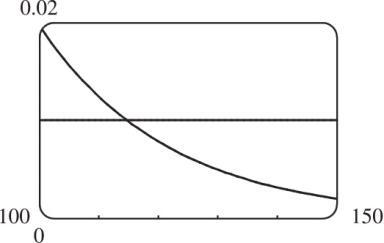
(b) From the graph, we estimate that the BAC is 0.08gdL when t1.2 hours.
35. Solution:
36
Solution and Answer Guide: James Stewart / Troy Day, Biocalculus: Calculus, Probability, and Statistics for the Life Sciences, 2e, 2027, 9798214002576; Chapter 1: Functions and Sequences
A calculator with exponential regression capability gives ( ) ( ) 1.180971.01628, t Pt = where t measures years since 1900. Using the model, the population in 1993 is estimated to be ( ) 9335.0 P billion, and the population in 2030 is estimated to be ( ) 203069.4 P billion.
Solution:
A calculator with exponential regression capability gives ( ) ( ) 81.89661.01234, t Pt = where t measures years since 1900. Using the model, the population in 1925 is estimated to be ( ) 25111 P million, and the population in 2030 is estimated to be ( ) 20303 40 P million.
37.
Solution:
The difference as equals a at 0 t = and decays exponentially with a half-life of 12 hours. Therefore, /12 1 2 t asa
and, thus,
38
Solution:
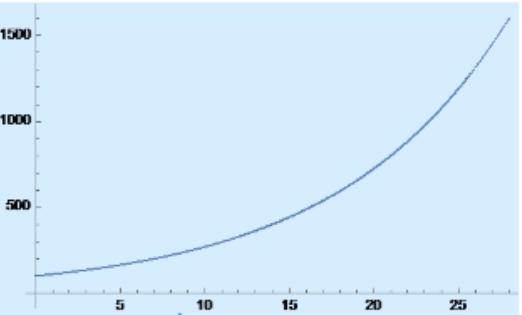
(a) After two weeks, there will be ( )14/7 1002400 = COVID-19 cases.
(b) After t days, there will be ( ) /7 1002 t COVID-19 cases.
(c)
Using the graph, we estimate that the number of COVID-19 cases will reach 1000 between 23 and 24 days.
39
Solution:
Solution and Answer Guide: James Stewart / Troy Day, Biocalculus: Calculus, Probability, and Statistics for the Life Sciences, 2e, 2027, 9798214002576; Chapter 1: Functions and Sequences
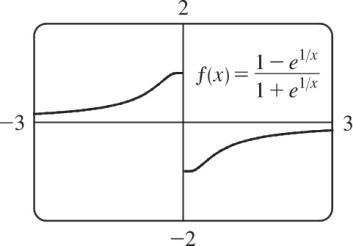
From the graph, it appears that f is an odd function ( f is undefined for = 0 x ). To prove this, we must show that −=− ()() fxfx
e so f is an odd function.
40.
Solution:
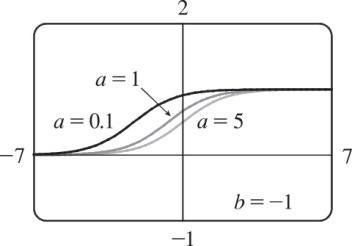
We’ll start with =−1 b and graph = + 1 () 1 bx fx ae for = 0.1 a , 1, and 5
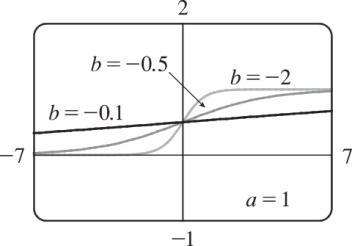
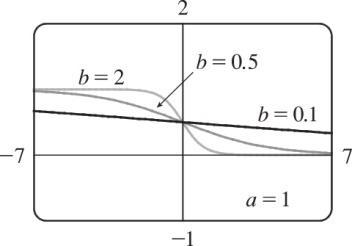
From the graph, we see that there is a horizontal asymptote = 0 y as →− x and a horizontal asymptote = 1 y as → x . If = 1 a , the y -intercept is
1 0, 2 . As a gets smaller (close to 0 ), the graph of f moves left. As a gets larger, the graph of f moves right.
As b changes from 1 to 0 , the graph of f is stretched horizontally. As b changes through large negative values, the graph of f is compressed horizontally. (This takes care of negatives values of b .)
If b is positive, the graph of f is reflected through the y -axis. Last, if = 0 b , the graph of f is the horizontal line =+1/(1) ya .
Solution and Answer Guide: James Stewart / Troy Day, Biocalculus: Calculus, Probability, and Statistics for the Life Sciences, 2e, 2027, 9798214002576; Chapter 1: Functions and Sequences
Solution and Answer Guide: James Stewart / Troy Day, Biocalculus: Calculus, Probability, and Statistics for the Life Sciences, 2e, 2027, 9798214002576; Chapter 1: Functions and Sequences
1.5 LOGARITHMS; SEMI-LOG AND LOG-LOG PLOTS
1.
2
Solution:
(a) See Definition 1.
(b) It must pass the Horizontal Line Test.
Solution:
(a) ( ) ( ) 1 == fyxfxy for any y in B . The domain of 1 f is B and the range of 1 f is A
(b) See the steps in (5).
(c) Reflect the graph of f about the line yx =
3
4
5.
Solution: f is not one-to-one because 26 , but ( ) ( )22.06 == ff .
Solution: f is one-to-one because it never takes on the same value twice.
Solution:
We could draw a horizontal line that intersects the graph in more than one point. Thus, by the Horizontal Line Test, the function is not one-to-one.
6
7.
8
Solution:
No horizontal line intersects the graph more than once. Thus, by the Horizontal Line Test, the function is one-to-one.
Solution:
No horizontal line intersects the graph more than once. Thus, by the Horizontal Line Test, the function is one-to-one.
Solution:
We could draw a horizontal line that intersects the graph in more than one point. Thus, by the Horizontal Line Test, the function is not one-to-one.
9.
10
Solution and Answer Guide: James Stewart / Troy Day, Biocalculus: Calculus, Probability, and Statistics for the Life Sciences, 2e, 2027, 9798214002576; Chapter 1: Functions and Sequences
Solution:
The graph of ( ) 2 2 =− fxxx is a parabola with axis of symmetry ( ) 2 1 221 =−=−= b x a . Pick any x -values equidistant from 1 to find two equal function values. For example, (0)0f = and ( ) 20 = f , so f is not one-to-one.
Solution:
The graph of ( ) 103=− fxx is a line with slope 3 . It passes the Horizontal Line Test, so f is one-to-one. Algebraic solution: If 12xx , then 1212 33103103 xxxx −−−−
( ) ( ) 12 fxfx , so f is one-to-one.
11.
Solution: ()1/ gxx = ( ) ( ) 121212 1/1/ xxxxgxgx so g is one-to-one.
Geometric solution: The graph of g is the hyperbola shown in Figure 14 in Section 1.2. It passes the Horizontal Line Test, so g is one-to-one.
12
Solution: ( ) cos = gxx ( ) ( ) 012 == gg , so g is not one-to-one.
13.
Solution:
A football will attain every height h up to its maximum height twice: once on the way up, and again on the way down. Thus, even if 1t does not equal 2t , ( ) 1ft may equal ( ) 2ft , so f is not 11
14.
Solution: f is not 11 because eventually we all stop growing and therefore, there are two times at which we have the same height.
15.
Solution:
(a) Since f is 11 , ( ) ( ) 1 617176 ==ff
(b) Since f is 11 , ( ) ( ) 1 3223 ==ff
16.
17
Solution and Answer Guide: James Stewart / Troy Day, Biocalculus: Calculus, Probability, and Statistics for the Life Sciences, 2e, 2027, 9798214002576; Chapter 1: Functions and Sequences
Solution:
First, we must determine x such that ( ) 3 = fx . By inspection, we see that if 1 x = , then ( ) 13 = f . Since f is 11 ( f is an increasing function), it has an inverse, and ( ) 1 31 = f . If f is a 11 function, then ( ) ( ) 1 = ffaa , so ( ) ( ) 1 22 = ff
Solution:
First, we must determine x such that ( ) 4 = gx . By inspection, we see that if 0 x = , then ( ) 4 = gx . Since g is 11 ( g is an increasing function), it has an inverse, and ( ) 1 40 = g .
18
Solution:
(a) f is 11 because it passes the Horizontal Line Test. (b) Domain of 1 3,3Rangeof =−= ff . 1 Rangeof1,3Domainof =−= ff . (c) Since ( ) 02 = f , ( ) 1 20 = f . (d) Since ( ) 1.70− f , ( ) 1 01.7 − f
19.
Solution: We solve ( ) 5 32 9 =−CF for 99 :3232 55 FCFFC =−=+ . This gives us a formula for the inverse function, that is, the Fahrenheit temperature F as a function of the Celsius temperature C . 99 459.6732459.67491.67273.15 55 FCCC −+−−− , the domain of the inverse function.
20 Solution:
. This formula gives us the speed v of the particle in terms of its mass m , that is, 1()vfm = .
21.
Solution: ( ) ( ) ( ) ( ) ==++−=+−=+−−= 22 1231123123123 yfxxyyxyxyx
Solution and Answer Guide: James Stewart / Troy Day, Biocalculus: Calculus, Probability, and Statistics for the Life Sciences, 2e, 2027, 9798214002576; Chapter 1: Functions and Sequences
27.
Solution and Answer Guide: James Stewart / Troy Day, Biocalculus: Calculus, Probability, and Statistics for the Life Sciences, 2e, 2027, 9798214002576; Chapter 1: Functions and Sequences
Solution: ( ) 44 4 111notsince0 ==+−=− yfxxyxxyx . Interchange x and y : 4 1 yx=− . So 4 1()1fxx=− . The graph of 4 1 yx=− is just the graph of 4 yx = shifted right one unit. From the graph, we see that f and 1 f are reflections about the line yx =
28.
Solution: ( ) ( ) 22ln2 ==−=−=− xx yfxeeyxy . Interchange x and y : ( ) ln2 =− yx . So ( ) ( ) 1 ln2 =− fxx . From the graph, we see that f and 1 f are reflections about the line yx = .
29.
Solution: Reflect the graph of f about the line yx = . The points ( ) ( ) ( )1,2,1,1,2,2 , and ( )3,3 on f are reflected to ( ) ( ) ( )2,1,1,1,2,2 , and ( )3,3 on 1 f .
or
Solution and Answer Guide: James Stewart / Troy Day, Biocalculus: Calculus, Probability, and Statistics for the Life Sciences, 2e, 2027, 9798214002576; Chapter 1: Functions and Sequences
30.
Solution:
Reflect the graph of f about the line yx =
31.
Solution:
(a) ( ) ( ) 222222101and note that0111. yfxxxyyxxyxy ==−=−=−=−
So ( ) 12 1 =− fxx , 01 x . We see that 1 f and f are the same function.
(b) The graph of f is the portion of the circle 22 1 xy+= with 01 x and 01 y (quarter-circle in the first quadrant). The graph of f is symmetric with respect to the line yx = , so its reflection about yx = is itself, that is, 1 ff =
32
Solution:
Solution and Answer Guide: James Stewart / Troy Day, Biocalculus: Calculus, Probability, and Statistics for the Life Sciences, 2e, 2027, 9798214002576; Chapter 1: Functions and Sequences
(a) From
Taking reciprocals of both sides gives 0 1 , 1 R P = the inverse function.
(b) The inverse function gives the basic reproduction number required for the probability that an outbreak will occur to be P.
(c) ( ) =− 0 0 1 1, PR R ( ) 0 1 1 RP P = 33.
Solution:
Find the inverse function by solving for v in the equation
Observe that the inverse function is identical to the original function if P and v are
Solution and Answer Guide: James Stewart / Troy Day, Biocalculus: Calculus, Probability, and Statistics for the Life Sciences, 2e, 2027, 9798214002576; Chapter 1: Functions and Sequences
interchanged. This implies the original function is symmetric about the line = Pv
34
Solution:
(a) From ( )( )1.436531.01396 t P = we divide each side by 1.43653 to obtain 1.01396. 1.43653 t P = Taking the natural logarithm of each side gives
lnln1.01396. 1.43653 P t
=
Dividing each side by ln1.01396 gives ln 1.43653 . ln1.01396
(b) Substituting 1.86 P = into the inverse function found in (a) gives 18.64 t years.
35.
Solution:
(a) It is defined as the inverse of the exponential function with base b , that is, log y b xybx == .
(b) ( ) 0,
(c) R
(d) See Figure 11.
36.
Solution:
(a) The natural logarithm is the logarithm with base ,e denoted ln .x
(b) The common logarithm is the logarithm with base 10, denoted log .x
(c) See Figure 13.
37.
Solution:
(a) 3 5 log1253since5125 == .
(b) 3 3 3 log3since3111 2727 3 =−==
38.
Solution:
(a) ( ) ln1/ln1ln011 =−=−=−ee
(b) ( ) 1/2 1010 1 log10log10by2. 2 ==
39.
or
Solution and Answer Guide: James Stewart / Troy Day, Biocalculus: Calculus, Probability, and Statistics for the Life Sciences, 2e, 2027, 9798214002576; Chapter 1: Functions and Sequences
Solution and Answer Guide: James Stewart / Troy Day, Biocalculus: Calculus, Probability, and Statistics for the Life Sciences, 2e, 2027, 9798214002576; Chapter 1: Functions and Sequences
Note that since ln x is defined for
and hence their logarithms are defined.
44.
Solution and Answer Guide: James Stewart / Troy Day, Biocalculus: Calculus, Probability, and Statistics for the Life Sciences, 2e, 2027, 9798214002576; Chapter 1: Functions and Sequences
Solution:
(a) 12 ln10 log100.926628 ln12 =
(b) 2 ln8.4 log8.43.070389 ln2 =
45
Solution: 3ft=36in , so we need x such that 36 2 log36268,719,476,736 xx=== . In miles, this is 1ft1mi 68,719,476,736in1,084,587.7mi 12in5280ft .
46.
Solution:
From the graphs, we see that ( ) ( ) 0.1 ln == fxxgxx for approximately 03.06 x and then ( ) ( ) gxfx for 153.063.4310 x (approximately). At that point, the graph of f finally surpasses the graph of g for good.
47
Solution: (a) Shift the graph of 10log yx = five units to the left to obtain the graph of ( ) 10 log5=+yx . Note the vertical asymptote of 5 x =−
Solution and Answer Guide: James Stewart / Troy Day, Biocalculus: Calculus, Probability, and Statistics for the Life Sciences, 2e, 2027, 9798214002576; Chapter 1: Functions and Sequences
(b) Reflect the graph of ln yx = about the x -axis to obtain the graph of ln yx =− .
48.
Solution:
(a) Reflect the graph of ln yx = about the y -axis to obtain the graph of ( ) ln =− yx
(b) Reflect the portion of the graph of ln yx = to the right of the y -axis about the y -axis. The graph of ln||yx = is that reflection in addition to the original portion.
49.
Solution: (a) ( ) 74 1 674ln67ln647ln6 4 =−=−=− x exxx (b) ( ) ( ) 222 1 ln310231031010 3 −=−==+=+ xxexexe
50.
Solution: (a) ( ) 223233 ln13111 −=−==+=+ xxexexe
(b) 2 320(1)(2)01 xxxxx eeeee −+=−−== or 2ln1 x ex== or ln2 x = , so 0 x = or ln2
51.
Solution and Answer Guide: James Stewart / Troy Day, Biocalculus: Calculus, Probability, and Statistics for the Life Sciences, 2e, 2027, 9798214002576; Chapter 1: Functions and Sequences
Solution:
(a) 5 22 23log355log3 x xx ==−=+ .
Or: ( ) 55 23ln2ln3(5)ln2ln355ln3ln3 ln2ln2 ==−=−==+xx xxx
(b) ( ) ( ) ( ) ( ) 12 lnln1ln1110 +−=−=−=−−= xxxxxxexxe . The quadratic formula
(with 1 a = , 1 b =− , and ce =− ) gives 1 (114) 2 xe =+ , but we reject the negative root since the natural logarithm is not defined for 0 x . So ( ) 1 114 2 =++ xe
52
Solution:
(a) ( ) ln(ln)11lnlnln1ln====== xxee xeexeeeexe
(b) ( ) lnlnlnlnlnln ===+=+−= axbxaxbxbx eCeeCeaxCeaxCbxaxbxC ( ) ln ln −== C abxCx ab
53.
Solution:
(a) 0 ln01 xxex . Since the domain of ( ) ln = Fxx is 0 x , the solution of the original inequality is 01 x
(b) 5lnln5ln5xx eex
54.
Solution:
(a) ( ) 31 11 12ln131ln2031ln2131ln21ln2 33 −−++ x exxxx
(b) 1 12ln32ln2ln1xxxxe −−−
55
Solution:
(a) === 22 2 10ln10lnln102 ln10 xxeexx
(b) == 2 2 log224 yyy
or
56.
Solution and Answer Guide: James Stewart / Troy Day, Biocalculus: Calculus, Probability, and Statistics for the Life Sciences, 2e, 2027, 9798214002576; Chapter 1: Functions and Sequences
Solution:
(a) 2 1log00,rry or y lies in the interval ( ) 0,.
(b) 2 01log00, rry or y lies in the interval ( )0 ,.
(c) 2 2 22log24,yrrr ==== which lies in the interval ( ) 1,. Thus the focal gene’s activity level is four times as high as the reference gene’s activity level.
57.
Solution:
(a) Solve for t in the equation:
58.
(b) Solve for T in the equation:
59.
Solution:
(a) Since Kt represents the volume of blood processed in t hours, the quantity / KtV is the amount of blood processed relative to total blood volume. Kt has units mLminutemL minute
and V has units mL
so / KtV is unitless.
(b) The fractional reduction in urea is ( ) ( ) 0 / 00 Initial ConcentrationFinal Concentration 11 Initial Concentration ===−=− KtV cctct Ue cc As / KtV increases, the term / KtV e decreases so that U increases. Similarly, as / KtV decreases, U decreases.
Solution:
(a) We must have − 303ln3xx eex . Thus, the domain of =− ()ln(3) xfxe is (ln3,)
(b) =−=−=+=+ ln(3)33ln(3) xyxxyy yeeeeexe , so =+ 1()ln(3) xfxe . Now +− 303xx ee , which is true for any real x , so the domain of 1 f is R
60.
61
Solution and Answer Guide: James Stewart / Troy Day, Biocalculus: Calculus, Probability, and Statistics for the Life Sciences, 2e, 2027, 9798214002576; Chapter 1: Functions and Sequences
Solution:
(a) By (6) , = ln300 300 e and = 300 ln()300 e .
(b) A calculator gives = ln300 300 e and an error message for 300 ln() e since 300e is larger than most calculators can evaluate.
Solution:
(a) Find the inverse by solving for t : ( ) ( ) ( ) log/500 5004lnln4lnln(4).
The inverse function gives the number of hours that have passed when the population size reaches n.
(b) Substituting 10,000 n = into the inverse function gives ( ) ( ) ( ) ( ) ln10,000/500ln20 2.16hours ln4ln4 == t
62.
Solution: (a) ( ) ( ) /// 00 000 111ln1ln1/. tatataQQtQ QQeeetaQQ QQaQ
This gives us the time t necessary to obtain a given charge Q
(b) 0 0.9 QQ = and ( ) 00 22ln10.9/2ln0.14.6seconds ==−−=− atQQ .
63.
Solution: (a)
Solution and Answer Guide: James Stewart / Troy Day, Biocalculus: Calculus, Probability, and Statistics for the Life Sciences, 2e, 2027, 9798214002576; Chapter 1: Functions and Sequences
(b)
(c) Since the semi log plot is approximately linear, an exponential model is appropriate.
(d) Using a calculator to fit an exponential curve to the data gives ( )( )0.0567691.204651 = x y .
64. Solution: (a)
(b)
Solution and Answer Guide: James Stewart / Troy Day, Biocalculus: Calculus, Probability, and Statistics for the Life Sciences, 2e, 2027, 9798214002576; Chapter 1: Functions and Sequences
(c) Since the scatter plot is approximately linear, a linear model is appropriate.
(d) Using a calculator to fit a line to the data gives ( ) 1.2089251.961293=+yx .
65.
Solution: (a)
(b)
(c) Since the scatter plot is approximately linear, a linear model is appropriate.
(d) Using a calculator to fit a line to the data gives ( ) 0.6188574.368000=−+yx
Solution and Answer Guide: James Stewart / Troy Day, Biocalculus: Calculus, Probability, and Statistics for the Life Sciences, 2e, 2027, 9798214002576; Chapter 1: Functions and Sequences
66. Solution: (a) (b)
(c) Since the log-log plot is approximately linear, a power model is appropriate.
(d) Using a calculator to fit power curve to the data gives ( ) 1.509230 0.894488.= yx
67. Solution: (a)
(b)
Solution and Answer Guide: James Stewart / Troy Day, Biocalculus: Calculus, Probability, and Statistics for the Life Sciences, 2e, 2027, 9798214002576; Chapter 1: Functions and Sequences
(c) Since the log-log plot is approximately linear, a power model is appropriate.
(d) Using a calculator to fit a power curve to the data gives ( ) 2.002959 1.260294 = yx
68 Solution: (a)
(b)
(c) Since the semi log plot is approximately linear, an exponential model is appropriate.
(d) Using a calculator to fit an exponential curve to the data gives (0.002717)(1.339539)x y = .
Solution and Answer Guide: James Stewart / Troy Day, Biocalculus: Calculus, Probability, and Statistics for the Life Sciences, 2e, 2027, 9798214002576; Chapter 1: Functions and Sequences
69
Solution: (a)
The data points on the semilog plot lie close to a straight line over the interval representing the first 15 days, so the growth rate of the pandemic was approximately exponential over that time.
(b) After the first 15 days, the data points begin to curve downward on the semilog plot, indicating that the growth rate slowed (the pandemic did not grow exponentially) over the entire 31-day period.
70.
Solution:
A power function would be a reasonable model. The data are plotted on a log-log scale and are linear, suggesting that the relationship is a power function.
71.
72.
Solution and Answer Guide: James Stewart / Troy Day, Biocalculus: Calculus, Probability, and Statistics for the Life Sciences, 2e, 2027, 9798214002576; Chapter 1: Functions and Sequences
Solution: (a)
Since the semi log plot is approximately linear, an exponential model is appropriate.
(b) Using a calculator to fit an exponential curve to the data gives ( ) ( ) 15 2.276131101.020529= Y P where P is the population in millions and Y is the year. Alternatively, we could have defined Y to be the number of years since 1950.
(c) In 2010, the model predicts a population of ( ) ( ) = 2010 15 2.276131101.0205291247million P . The model overestimates the true population by 1247117374million −= . Therefore, this exponential model does not generalize well to the future population growth in India.
Solution: (a)
Since the log-log plot is approximately linear, a power model is appropriate.
(b) Using a calculator to fit an exponential curve to the data gives ( ) ( )22.8747631.126290= W L . Fitting a power curve to the data gives ( ) 0.395199 30.562377 = LW
73.
Solution and Answer Guide: James Stewart / Troy Day, Biocalculus: Calculus, Probability, and Statistics for the Life Sciences, 2e, 2027, 9798214002576; Chapter 1: Functions and Sequences
The power model is a more suitable fit to the data. (d) As predicted by the power model in (b), the wingspan of a 45lb bird is ( ) ( ) ( )0.395199 4530.56237745137.57inches =
L . This suggests the dodo bird would require a wingspan close to 138 inches in order to fly. The actual wingspan of the dodo was much shorter and therefore the bird could not create enough lift for flight.
Solution: (a)
Since the log-log plot is approximately linear, a power model is appropriate. (b) Using a calculator to fit a power curve to the data gives ( ) 0.841701 0.881518 = SA
Solution and Answer Guide: James Stewart / Troy Day, Biocalculus: Calculus, Probability, and Statistics for the Life Sciences, 2e, 2027, 9798214002576; Chapter 1: Functions and Sequences
74. Solution: (a)
(b) Using a calculator to fit an exponential curve to the data gives ( ) ( )54.9805085.543613= t N . The exponential function fits the curve well.
75. Solution: (a)
(b) Using a calculator to fit an exponential curve to the data gives = ()(1.343328)(0.338676)t Ct where ()Ct is the blood alcohol concentration after t hours. The exponential function overestimates BAC for small values of t
76.
Solution and Answer Guide: James Stewart / Troy Day, Biocalculus: Calculus, Probability, and Statistics for the Life Sciences, 2e, 2027, 9798214002576; Chapter 1: Functions and Sequences
(c) Solve for t in the equation:
()0.08(1.343328)(0.338676)0.08ln(0.338670.08 6)ln 1.343328
inequality switched ln(0.08/1.343328)direction2.61hr because ln(0.338676)ln(0.338676)0 t . Therefore, the driver’s blood alcohol concentration will be under the legal limit after approximately 2.6 hours.
Solution:
A plot of the dinosaur data shows data points that generally lie between the endothermic and ectothermic lines of the figure in the exercise, with perhaps more points lying closer to the endothermic line than ectothermic line. We may say that dinosaurs have an intermediate-to-endothermic metabolism.
77.
Solution:
(a) Let ()Cn be the number of DNA molecules after n cycles. The number of molecules doubles every cycle so that = (1)2 Cx , == 2(2)2(1)2 CCx , == 3(3)2(2)2 CCx and in general = ()2n Cnx .
(b) The threshold is reached when
(c) Observe that we can rewrite
()ln ln(2)ln(2)ln2 TxxT nxx T .
Therefore, the graph of ()nx can be obtained from the graph of = ln yx by horizontally stretching by factor T , reflecting about the x -axis, and vertically
Solution and Answer Guide: James Stewart / Troy Day, Biocalculus: Calculus, Probability, and Statistics for the Life Sciences, 2e, 2027, 9798214002576; Chapter 1: Functions and Sequences
compressing by factor ln 2 .These transformations lead to the sketch shown. We see that having a larger initial number of DNA molecules leads to shorter times to reach the detection threshold.
PROJECT THE CODING FUNCTION OF DNA
1.
2.
3.
Solution:
The domain is ,,, ATCG Since the coding function maps an input (codon) to exactly one output (amino acid), the biggest possible range is 4 amino acids.
Solution:
With two-base codons, there are 2 416 = possibilities which can be found by combining the bases in all possible arrangements. Thus, the domain is
,,,,,,,,,,,,,,, AAATACAGTATTTCTGCACTCCCGGAGTGCGG .The biggest possible range is 16 output amino acids, which would be achieved if every codon mapped to a distinct amino acid.
Solution:
With three-base codons, there are 3 464 = possibilities. The domain of 64 codons can be found by iterating through all possible three-base codons using the 4 bases. Formally, the domain is ( )
,,|andand,,, ijkijkATCG . The biggest possible range is 64 amino acids.
4.
5.
Solution:
As observed in Problems 1 and 2, codons with 1 or 2 bases have too small a range to generate the 20 different amino acids required to build proteins. Three-base codons have 64 possible "words" which is more than enough to code for 20 amino acids.Codons with 4 or more bases would have excess redundancy in the genetic code, thus making three-bases the optimal number for coding amino acids.
Solution:
Three-base codons can code up to 64 amino acids, however, there are only 20 distinct amino acids that are coded for by the DNA of living organisms. Therefore, there are multiple codons that produce the same amino acid. E.g. the codons AAG and
Solution and Answer Guide: James Stewart / Troy Day, Biocalculus: Calculus, Probability, and Statistics for the Life Sciences, 2e, 2027, 9798214002576; Chapter 1: Functions and Sequences
AAA both code for the amino acid Lysine. This implies the coding function is not one-to-one.
1.6 SEQUENCES AND DIFFERENCE EQUATIONS
1.
4. Solution:
is 2468104385 ,,,,,1,,,,, 114191161251551713
5.
6. Solution:
Solution and Answer Guide: James Stewart / Troy Day, Biocalculus: Calculus, Probability, and Statistics for the Life Sciences, 2e, 2027, 9798214002576; Chapter 1: Functions and Sequences
10.
Solution and Answer Guide: James Stewart / Troy Day, Biocalculus: Calculus, Probability, and Statistics for the Life Sciences, 2e, 2027, 9798214002576; Chapter 1: Functions and Sequences
Solution: 1111 1,,,,, 3579
The denominator of the thn term is the thn positive odd integer, so 1 21
Solution: 1111 1,,,,, 392781
. Each term is 1 3 times the preceding term, so
11.
Solution: 4816 3,2,,,, 3927
The first term is 3 and each term is 2 3 times the preceding one, so 1 2 3. 3 n
12.
Solution: 5,8,11,14,17, Each term is larger than the preceding term by 3 , so ( ) ( ) 1 153132. =+−=+−=+ n aadnnn
13.
Solution: 1491625 ,,,,, 23456
. The numerator of the thn term is 2n and its denominator is 1 n + . Including the alternating signs, we get ( ) 2 1 1 1 + =− + n n n a n .
14
Solution: 1,0,1,0,1,0,1,0, . Two possibilities are sin 2 n
= and
15.
Solution:
Solution and Answer Guide: James Stewart / Troy Day, Biocalculus: Calculus, Probability, and Statistics for the Life Sciences, 2e, 2027, 9798214002576; Chapter 1: Functions and Sequences
16.
20.
21.
Solution and Answer Guide: James Stewart / Troy Day, Biocalculus: Calculus, Probability, and Statistics for the Life Sciences, 2e, 2027, 9798214002576; Chapter 1: Functions and Sequences
23.
Solution:
Let n a be the number of rabbit pairs in the thn month. Clearly 12 1 aa == . In the thn month, each pair that is 2 or more months old (that is, 2 n a pairs) will produce a new pair to add to the 1 n a pairs already present. Thus, 12nnn aaa =+ , so that
nn af = , the Fibonacci sequence.
24
Solution: (a) We are given that the initial population is 5000 , so 0 5000 P = The number of catfish increases by 8% per month and is decreased by 300 per month, so
25
Solution and Answer Guide: James Stewart / Troy Day, Biocalculus: Calculus, Probability, and Statistics for the Life Sciences, 2e, 2027, 9798214002576; Chapter 1: Functions and Sequences
1000218%3001.08300,1.08300PPPPPP =+−=−=− , and so on. Thus, 1 1.08300 nn PP=−
(b) Using the recursive formula with 0 5000 P = , we get 1235100,5208,5325PPP=== (rounding any portion of a catfish), 455451,5587PP== and 6 5734 P = , which is the number of catfish in the pond after six months.
Solution:
The solution to the recursion equation 1 tt NRN + = as given in equation (2) is 0 t t NNR =
When 0 1 N = , the solution is t t NR = .
(a) The solution t t NR = says that the tht term is found by multiplying R by itself t times. If 1, t RN will decrease as t increases. For example, consider the case when 1 2 R = , so that 123 111 ,, 248 NNN=== , and if t is very large, say 100 , then 31 100 100 1 8100 2 N = . Therefore, we infer that when 1 R , the value of t N approaches zero as t becomes large.
(b) When 1 R = the general solution is ( ) 11== t t N . That is all terms in the sequence have a value of one.
(c) When 1 R , the solution t t NR = . will increase as t increases. For example, consider the case when 2 R = , so that 1232,4,8NNN=== , and if t is very large, say 100 , then 10030 100 210 N = . Therefore, we infer that when 1 R , the sequence grows indefinitely as t increases.
26
Solution:
(a) If ( ) 1+ = tt NfN , then ( )( ) ( ) ( ) ( ) 12++ === tttt ffNffNfNN . Therefore, ff represents the population size two time steps ahead of the current time.
(b) ( ) ( ) ( ) 11 1+ == ttt fNffNN since f is a one-to-one function. Therefore, 1 f takes as input the population size at a given time and outputs the population one time step earlier.
27-31 A calculator was used to compute the first 10 terms of each sequence and these ( ) , ttx data points were then graphed.
27.
Solution and Answer Guide: James Stewart / Troy Day, Biocalculus: Calculus, Probability, and Statistics for the Life Sciences, 2e, 2027, 9798214002576; Chapter 1: Functions and Sequences
Solution: t t x
The sequence decreases and approaches 1/3
28.
Solution: t t x
0 0.5000 1 0.6250 2 0.5859 3 0.6065 4 0.5966 5 0.6017 6 0.5992
7 0.6004
8 0.5998 9 0.6001 10 0.5999
The sequence oscillates above and below 0.6 , approaching 0.6 as t increases.
Solution and Answer Guide: James Stewart / Troy Day, Biocalculus: Calculus, Probability, and Statistics for the Life Sciences, 2e, 2027, 9798214002576; Chapter 1: Functions and Sequences
29. Solution: t t x
0
As t increases, the sequence cycles near two values ( 0.44 and 0.84 ).
0.8472
0.4427
0.8438
0 0.8750 1 0.3773 2 0.8106
3 0.5297 4 0.8595 5 0.4167 6 0.8386 7 0.4670 8 0.8587 9 0.4185 10 0.8396
As t increases, the sequence cycles near two values (0.42 and 0.84).
31.
Solution and Answer Guide: James Stewart / Troy Day, Biocalculus: Calculus, Probability, and Statistics for the Life Sciences, 2e, 2027, 9798214002576; Chapter 1: Functions and Sequences
As t increases, the sequence cycles irregularly among a range of values between 0.25 and 0.93 0 0.5000
(b) The Ricker model increases toward a value of 0.9163 while the logistic model converges in an oscillatory fashion toward 0.6
Solution and Answer Guide: James Stewart / Troy Day, Biocalculus: Calculus, Probability, and Statistics for the Life Sciences, 2e, 2027, 9798214002576; Chapter 1: Functions and Sequences
5 1.2297
6 1.2296
7 1.2296
8 1.2296
9 1.2296
10 1.2296
The Ricker model approaches 1.2296 in an oscillatory fashion. This is very different compared to the cycling behaviour observed from the logistic model in Exercise 29.
34.
Solution:
(a) At each time step, there is an increase in concentration of A and a decrease of tkC . The recursion is 1 inflowoutflow tttt cccAkc + =+−=+−
(b) A calculator was used to calculate and graph the first 10 terms of the sequence using 0 120 c = for several different values of A and k In every case, the concentration converges toward a constant value as t increases. Larger values of A result in higher long-run concentrations while larger values of k give lower longterm concentrations. Note that each sequence converges toward the value / Ak
35.
Solution:
(a) Since area is proportional to number of bacteria, the relationship between colony radius, r , and the population size can be found as follows: 2 circle k AkNrkNrN === where k is a proportionality constant.
Since I is proportional to the colony circumference, C , the input of new individuals is ( ) 22 ==== k IRCRrRNRKN where 2 k K = is a constant. This gives the recursion equation 1 ttt NNRKN + =+ .
(b) A calculator was used to calculate and graph the first 10 terms of the sequence using 0 40 N = for several different values of RK
Solution and Answer Guide: James Stewart / Troy Day, Biocalculus: Calculus, Probability, and Statistics for the Life Sciences, 2e, 2027, 9798214002576; Chapter 1: Functions and Sequences
36.
Solution and Answer Guide: James Stewart / Troy Day, Biocalculus: Calculus, Probability, and Statistics for the Life Sciences, 2e, 2027, 9798214002576; Chapter 1: Functions and Sequences
Solution:
Let t N be the number of individuals in the colony at time t Since volume is proportional to t N , the relationship between colony radius, r , and the population size
can be found as follows:
where k is a
proportionality constant. Because growth occurs only at the surface-resource interface, the input of new individuals, I , is proportional to the surface area, A, of the spherical colony. With proportionality constant R , this gives
is a constant.
=
Therefore, the difference equation is ( )2/3 1 tttt NNINCN + =+=+ .
37
Solution:
(a) Let t n represent the number of fish at time t . First, the fish face predation reducing the population to * tt nndn =− . The * n fish then produce offspring and die resulting in a population of ****** nnbnnbn =+−= . Finally, m additional fish are added to the population and all swim to sea giving the recursion *** 1 t nnmbnm + =+=+ ( ) 1 t bdnm=−+
(b) In this case, the fish first reproduce and die resulting in a population of * . tnbn = Then, m fish are added increasing the population to *** nnm =+ . Lastly, all the fish face predation while swimming downstream giving a final population of ( )( ) ( )( ) ***** 1 11 tt nndndnmdbnm + =−=−+=−+ .
(c) The difference in recursions from parts (a) and (b) is ( ) ( )( ) ( ) ( ) 11110 tt bdnmdbnmmdmd −+−−+=−−= since 0 m and 0 d . Hence, the recursion from part (a) gives the largest increase in population from one year to the next. This seems sensible since all the offspring and additional fish face predation in part (b), whereas all the additional fish survive in part (a).
38
Solution:
Let t f represent the fraction of methylated DNA at time t The fraction of unmethylated DNA is then given by 1 t f . First, m unmethylated locations become methylated giving a new fraction of * (1)tt ffmf =+− . Then u methylated locations become unmethylated giving a final fraction of ( ) ( ) ** 1 11 ttt ffufufmf + =−=−+− ( )( ) ( ) 111 t mufmu =−−+−
Solution and Answer Guide: James Stewart / Troy Day, Biocalculus: Calculus, Probability, and Statistics for the Life Sciences, 2e, 2027, 9798214002576; Chapter 1: Functions and Sequences
39. Solution:
40.
41
When 1 11 a = , the first 40 terms are 11, 34, 17, 52, 26, 13, 40, 20, 10, 5, 16, 8, 4, 2, 1, 4, 2, 1, 4, 2, 1, 4, 2, 1, 4, 2, 1, 4, 2, 1, 4, 2, 1, 4, 2, 1, 4, 2, 1, 4. When 1 25 a = the first 40 terms are 25,76, 38, 19, 58, 29, 88, 44, 22, 11, 34, 17, 52, 26, 13, 40, 20, 10, 5, 16, 8, 4, 2, 1, 4, 2, 1, 4, 2, 1, 4, 2, 1, 4, 2, 1, 4, 2, 1, 4. The famous Collatz conjecture is that this sequence always reaches 1 , regardless of the starting point 1a .
Solution:
(a) = 1 2 nn MM
(b) = 0 2 n n MM
(c)
100,000 2100,00032,7683.05... 32,768 MM MM Since the number of molecules must be a whole number, there must be four molecules initially present on a swab for it to test positive.
42.
Solution: If a denotes the fraction of purines that mutate to pyrimidines, then ( ) 1 a is the fraction of purines that remain purines in the next generation. The fraction of pyrimidines is ( ) 1, t f and b is the fraction of these that become purines in the next generation. Thus, ( ) ( ) 1 11.ttt fafbf + =−+−
Solution and Answer Guide: James Stewart / Troy Day, Biocalculus: Calculus, Probability, and Statistics for the Life Sciences, 2e, 2027, 9798214002576; Chapter 1: Functions and Sequences
PROJECT DRUG RESISTANCE IN MALARIA
1.
2
Solution:
Let ijg represent the frequency of ij individuals. For random and independent unions, the frequency of RR individuals will be given by the probability that any two R individuals unite, that is, 2 RR ttt gppp == . Similarly, the probability that any two S individuals unite is ( ) ( ) ( )2 SS 111 ttt gppp =−−=− . The probability that an RS diploid individual forms is ( ) RS 21. tt gpp =− We include a factor of 2 since there are two ways of selecting RS: first an R individual, then an S individual, and vice versa. Observe that the sum of the frequencies RRRSSS 1 ggg++= as is required.
Solution:
Scaling each frequency by the respective probabilities of survival gives ( )2 2 RRSS,1 tt WpWp and ( ) RS 21 tt Wpp . These new quantities no longer sum to one, but instead sum to ( ) ( ) 2 2 ssRS RR 121. t tpt p WWWpWpt =+−+− To ensure the new diploid frequencies (after survival) * g sum to one, we normalize or divide by W giving ( )2 *2* SS RR RRSS,1 tt W W gpgp WW ==− , and ( ) * RS RS 21 tt W gpp W =− .
3
4.
Solution:
If there are a total of N individuals in the population, then after reproduction, the number of R-type haploids is ( ) **2
and the total number of haploid individuals is ( ) ( ) *** RRRSSS 1. bNgggbNbN ++== Therefore, the frequency of R-type haploids is ( ) ( ) ( ) ( ) ( ) RR2RS
Solution:
Substituting RR 1 4 W = and RSSS 1 2 WW== into 1 tp + gives
Solution and Answer Guide: James Stewart / Troy Day, Biocalculus: Calculus, Probability, and Statistics for the Life Sciences, 2e, 2027, 9798214002576; Chapter 1: Functions and Sequences
This is the same rational function discussed in Section 1.2.
1 REVIEW
TRUE-FALSE QUIZ
1.
Solution:
Let ( ) 2 ,1==−fxxs , and 1 t = . Then
2
Solution: False. Let ( ) 2 = fxx . Then ( ) ( )242−== ff , but 22−
3. Solution: False. Let ( ) 2 = fxx . Then ( ) ( )2 2 339 == fxxx and ( )
4
5.
Solution: True. If 12xx and f is a decreasing function, then the y -values get smaller as we move from left to right. Thus, ( ) ( ) 12 fxfx
Solution: True. See the Vertical Line Test.
6.
7.
Solution and Answer Guide: James Stewart / Troy Day, Biocalculus: Calculus, Probability, and Statistics for the Life Sciences, 2e, 2027, 9798214002576; Chapter 1: Functions and Sequences
Solution:
False. Let ( ) 2 = fxx and ( ) 2 = gxx Then ( )( ) ( ) ( ) ( ) ( )2 2 224==== fgxfgxfxxx and ( )( ) ( ) ( ) ( ) 22 2 === gfxgfxgxx . So fggf
Solution:
False. Let ( ) 3 = fxx Then f is one-to-one and ( ) 3 1 = fxx . But ( ) 3 1/1/ = fxx , which is not equal to ( ) 1 fx .
8.
9
10
Solution:
True. We can divide by xe since 0 xe for every x .
Solution:
True. The function ln x is an increasing function on ( ) 0, .
Solution:
False. Let xe = Then ( ) ( ) 66 6 lnln11 ===xe but ( )6 6ln6ln6161ln ==== xex What is true, however, is that ( ) 6 ln6ln = xx for 0 x .
11.
Solution:
False. Let 2xe = and ae = . Then 2 lnln2ln 2 lnlnln xee aee === and 2 lnlnln1 xe e ae === , so in general the statement is false. What is true, however, is that lnlnln x xa a =− .
12.
Solution:
False. For example, if 3 x =− , then ( )2 393−== , not 3 .
EXERCISES 1.
Solution: (a) When 2,2.7xy= . Thus, ( ) 22.7 f .
or
or
2.
Solution and Answer Guide: James Stewart / Troy Day, Biocalculus: Calculus, Probability, and Statistics for the Life Sciences, 2e, 2027, 9798214002576; Chapter 1: Functions and Sequences
(b) ( ) 32.3,5.6=fxx
(c) The domain of f is 66 x − , or 6,6 .
(d) The range of f is 44 y − or 4,4 .
(e) f is increasing on 4,4 , that is, on 44 x − .
(f) f is not one-to-one since it fails the Horizontal Line Test.
(g) f is odd since its graph is symmetric about the origin.
Solution:
(a) When 2,3xy== . Thus, ( ) 23 = g .
(b) g is one-to-one because it passes the Horizontal Line Test.
(c) When 2,0.2yx= . So ( ) 1 20.2 g .
(d) The range of g is 1,3.5 , which is the same as the domain of 1 g .
(e) We reflect the graph of g through the line yx = to obtain the graph of 1 g .
3.
4.
Solution:
(a) (1000)36mS −
(b) The sea level was lowest about 18,000 years ago and highest about 121,000 ago present.
(c) |1148114,8SS−=−
(d) The drops in sea level around 150,000 and 18,000 years ago correspond to periods of glaciation during which large amounts of Earth’s water was frozen in ice sheets.
Solution:
(a) The total supply from aquaculture first exceeded 50 kg/capita in approximately
5.
Solution and Answer Guide: James Stewart / Troy Day, Biocalculus: Calculus, Probability, and Statistics for the Life Sciences, 2e, 2027, 9798214002576; Chapter 1: Functions and Sequences
2010.
(b) Prior to 1985, the total supply came almost entirely from fisheries catch as the aquaculture amount is very low. The total supply was increasing during this time, so that supply through catch was also increasing during this time. Since 1985, aquaculture has grown, but the total has grown in approximately the same amount, meaning that the supply through catch has remained relatively stable.
Solution: ( ) 2 23=−+fxxx , so ( ) ( ) ( ) 2 22 232223 +=+−++=++−−+ fahahahaahhah , and ( ) ( ) ( ) ( ) 222222323 ()22 22 ++−−+−−+ +−+−
6.
Solution:
There will be some yield with no fertilizer, increasing yields with increasing fertilizer use, a leveling-off of yields at some point, and disaster with too much fertilizer use.
7.
Range: all reals except 0 ( 0 y = is the horizontal asymptote for f ) ( ) ( ) ,00, =− R
8 Solution: ( ) 4 16 =− gxx . Domain: 4 44 16016162 xxxx
9. Solution: ( ) ( )ln6=+hxx Domain: 606xx+− ( ) 6, =− D
Range: 60 x + , so ln(6) x + takes on all real numbers and, hence, the range is
Solution and Answer Guide: James Stewart / Troy Day, Biocalculus: Calculus, Probability, and Statistics for the Life Sciences, 2e, 2027, 9798214002576; Chapter 1: Functions and Sequences
10.
11.
Solution and Answer Guide: James Stewart / Troy Day, Biocalculus: Calculus, Probability, and Statistics for the Life Sciences, 2e, 2027, 9798214002576; Chapter 1: Functions and Sequences
Solution: ( ) 3cos2==+ yFtt Domain: ( ) , =− D Range:
Solution:
(a) To obtain the graph of ( ) 8 =+yfx , we shift the graph of ( ) = yfx up 8 units.
(b) To obtain the graph of ( )8 =+yfx we shift the graph of ( ) = yfx left 8 units.
(c) To obtain the graph of ( ) 12=+ yfx , we stretch the graph of ( ) = yfx vertically by a factor of 2, and then shift the resulting graph 1 unit upward.
(d) To obtain the graph of ( ) 22=−−yfx , we shift the graph of ( ) = yfx right 2 units (for the “ 2 ” inside the parentheses), and then shift the resulting graph 2 units downward.
(e) To obtain the graph of ( ) =− yfx , we reflect the graph of ( ) = yfx about the x -axis.
(f) To obtain the graph of ( ) 1 = yfx , we reflect the graph of ( ) = yfx about the line yx = (assuming f is one–to-one).
12
Solution:
(a) To obtain the graph of ( )8 =−yfx , we shift the graph of ( ) = yfx right 8 units.
(b) To obtain the graph of ( ) =− yfx , we reflect the graph of ( ) = yfx about the x -axis.
Solution and Answer Guide: James Stewart / Troy Day, Biocalculus: Calculus, Probability, and Statistics for the Life Sciences, 2e, 2027, 9798214002576; Chapter 1: Functions and Sequences
(c) To obtain the graph of ( ) 2 =− yfx , we reflect the graph of ( ) = yfx about the xaxis, and then shift the resulting graph 2 units upward.
(d) To obtain the graph of ( ) 1 1 2 =−yfx , we shrink the graph of ( ) = yfx by a factor of 2 , and then shift the resulting graph 1 unit downward.
(e) To obtain the graph of ( ) 1 = yfx , we reflect the graph of ( ) = yfx about the line yx = .
(f) To obtain the graph of ( ) 1 3 =+yfx , we reflect the graph of ( ) = yfx about the line yx = [see part (e)], and then shift the resulting graph left 3 units.
Solution:
sin2 yx =− : Start with the graph of sin yx = , compress horizontally by a factor of 2 , and reflect about the x -axis.
Solution and Answer Guide: James Stewart / Troy Day, Biocalculus: Calculus, Probability, and Statistics for the Life Sciences, 2e, 2027, 9798214002576; Chapter 1: Functions and Sequences
14.
Solution:
( )3ln2=−yx : Start with the graph of ln yx = , shift 2 units to the right, and stretch vertically by a factor of 3
15. Solution:
( ) 1 1 2 xye =+ : Start with the graph of xye = , shift 1 unit upward, and compress vertically by a factor of 2 .
16
Solution:
2 yx =− : Start with the graph of yx = , reflect about the x -axis, and shift 2 units upward.
17. Solution: ( ) 1 2 = + fx x : Start with the graph of ( ) 1/ = fxx and shift 2 units to the left.
Solution and Answer Guide: James Stewart / Troy Day, Biocalculus: Calculus, Probability, and Statistics for the Life Sciences, 2e, 2027, 9798214002576; Chapter 1: Functions and Sequences
18.
Solution and Answer Guide: James Stewart / Troy Day, Biocalculus: Calculus, Probability, and Statistics for the Life Sciences, 2e, 2027, 9798214002576; Chapter 1: Functions and Sequences
Solution: ( ) ( ) ( ) 2 2 2 2 211 11 =− =−+− =−− fxxx xx x
Start with the graph of 2yx = , shift 1 unit down, and shift 1 unit right.
19
20
x xx fx ex
Solution: ( ) if0 1if0 − = −
On ( ),0− , graph yx =− (the line with slope 1 and y -intercept 0 ) with open endpoint ( )0,0
On ) 0, , graph 1 xye=− (the graph of xye = shifted 1 unit downward) with closed endpoint ( )0,0
Solution:
(a) The terms of f are a mixture of odd and even powers of x , so f is neither even nor odd.
(b) The terms of f are all odd powers of x , so f is odd.
(c) ( ) ( ) 22() −=== xx fxeefx , so f is even.
(d) ( ) ( ) 1sin1sin−=+−=− fxxx . Now ( ) ( ) − fxfx and ( ) ( ) −− fxfx , so f is neither even nor odd.
21.
Solution and Answer Guide: James Stewart / Troy Day, Biocalculus: Calculus, Probability, and Statistics for the Life Sciences, 2e, 2027, 9798214002576; Chapter 1: Functions and Sequences
Solution:
()ln fxx = , ( ) 0, = D ; 2 ()9gxx=− , D =
(a) ( ) ( ) ( ) ( ) ( ) 22 ()9ln9fgxfgxfxx ==−=− Domain: ( ) ( ) 229093,33,xxxx −−−
(b) ( ) ( ) ( ) ( ) ( )2 ()lnln9gfxgfxgxx===− . Domain: 0 x , or ( ) 0,
(c) ( )( ) ( ) ( ) ( ) ()lnlnln ffxffxfxx === Domain: 0 ln01 xxe= , or ( ) 1,
(d) ( ) ( ) ( ) ( ) ( )2 22 ()999ggxggxgxx==−=−− Domain: x , or ( ) , −
22
Solution:
Let ( ) ( ) , =+= hxxxgxx , and ( ) 1/ = fxx . Then ( )( ) ( ) 1 == + fghxFx xx .
23.
Solution: (a)
After around 1998, the number of deaths declines at a gradual rate each year. It is likely that the development of better medications caused this.
(b) If d is the number of deaths in year y, where y is a year between 1998 and 2019 inclusive, then = 6 1.1177110550.881. y d
© 2027 Cengage. All Rights Reserved. May not be scanned, copied or duplicated, or posted to a publicly accessible website, in whole or in part.
24.
Solution and Answer Guide: James Stewart / Troy Day, Biocalculus: Calculus, Probability, and Statistics for the Life Sciences, 2e, 2027, 9798214002576; Chapter 1: Functions and Sequences
Solution:
During the daytime, starch accumulates from zero at a mg/hour, so the amount of starch at time t ( ) 0 t is at mg, and the amount of starch when nightfall arrives is a mg. During the night ( ) , 24 t starch is fully depleted linearly, meaning that a mg is depleted linearly over ( ) 24 hours. The rate of depletion is thus 24 a mg/hour, and the amount of starch at time t during the night is ( )
. 24 a
a If ( )St is the amount of starch in milligrams at time t hours, then:
25.
Solution:
We need to know the value of x such that ( ) 2ln2=+=fxxx . Since 1 x = gives us
Solution:
(a) ( )2 2ln3ln3239 ee===
(b) 2 1010101010 log25log4log(254)log100log102 +====
(d) Let 1 4 cos 5 = , so 4 cos 5 = . Then 12 4 sincossin1cos 5
28.
Solution and Answer Guide: James Stewart / Troy Day, Biocalculus: Calculus, Probability, and Statistics for the Life Sciences, 2e, 2027, 9798214002576; Chapter 1: Functions and Sequences
Solution:
(a) 5ln5 x ex==
(b) 2 ln2xxe ==
(c) ( )2ln2lnln2 x ex eex ==
29.
Solution:
(a) After 4 days, 1 2 gram remains; after 8 days, 1 4 g; after 12 days, 1 8 g; after 16 days, 1 16 g.
(b) ( ) ( ) ( ) ( ) 234 1111 4,8,12,16 2 222 ====mmmm . From the pattern, we see that ( ) /4 1 2 = t mt , or /4 2 t
(c) /4 22 2log/44log t mmttm ==−=− ; this is the time elapsed when there are m grams of 100Pd.
(d) 2 ln0.01 0.014log0.01426.6 ln2 mt
==−=−
days
30. Solution: (a) The population would reach 900 in about 4.4 years. (b) 100,000 100900100,000900100,000100 100900 tt t PPPePeP e =+==− + 100,00010010001000 lnln 90099 t PPP ett PPP
, or ln9 1000 P P
; this is the time required for the population to reach a given number .P
(c) 9900 900lnln814.4 1000900 Pt ===
years, as in part (a).
or
31.
Solution and Answer Guide: James Stewart / Troy Day, Biocalculus: Calculus, Probability, and Statistics for the Life Sciences, 2e, 2027, 9798214002576; Chapter 1: Functions and Sequences
Solution: ( ) 2 ()ln fxxc =− . If 0 c , the domain of f is . If 0 c = , the domain of f is ( ) ( ) ,00, − . If 0 c , the domain of f is ( ) ( ) ,, cc −− . As c increases, the dip at 0 x = becomes deeper. For 0 c , the graph has asymptotes at xc =
32.
Solution:
For large values of , xxya = has the largest y -values and loga yx = has the smallest y -values. This makes sense because they are inverses of each other.
33.
Solution: (a)
Solution and Answer Guide: James Stewart / Troy Day, Biocalculus: Calculus, Probability, and Statistics for the Life Sciences, 2e, 2027, 9798214002576; Chapter 1: Functions and Sequences
(b)
(c) Since the log-log plot is approximately linear, a power model is appropriate.
(d) Using computer software to fit a power curve to the data gives ( ) 0.712277 2.608377.yx =
34. Solution: (a)
(b)
(c) Since the semi-log plot is approximately linear, an exponential model is appropriate.
(d) Using computer software to fit an exponential curve to the data gives ( ) ( ) 8.9821930.801749. x y =
Solution and Answer Guide: James Stewart / Troy Day, Biocalculus: Calculus, Probability, and Statistics for the Life Sciences, 2e, 2027, 9798214002576; Chapter 1: Functions and Sequences
35. Solution: (a)
Solution and Answer Guide: James Stewart / Troy Day, Biocalculus: Calculus, Probability, and Statistics for the Life Sciences, 2e, 2027, 9798214002576; Chapter 1: Functions and Sequences
The first graph suggests that an exponential model would be appropriate. The semilog plot is close to linear, suggesting that an exponential model is indeed appropriate.
(b) The population P of Nigeria t years after 1985 is modeled by ( ) = 85.0741.02596. t Pt
(c) ( ) 153.34 2008:23million P ( ) 208.55 2020:35million P
38.
Solution and Answer Guide: James Stewart / Troy Day, Biocalculus: Calculus, Probability, and Statistics for the Life Sciences, 2e, 2027, 9798214002576; Chapter 1: Functions and Sequences
Solution:
Writing the first term in the sequence as a fraction gives 357911 ,,,, 1491625 . Observe the numerator of the fractions start at 3 and increases by 2 in succeeding terms. Hence, the nth term will have numerator 21 n + . The denominator of the thn term is 2n . The signs of each term alternate from positive to negative so we multiply by ( )1 n
40
Solution: t
The sequence approaches 0.63 in an oscillatory fashion. 0 0.9000 1
Solution:
(a) A calculator was used to calculate and plot the first 10 terms of the BevertonHolt recursion model with 1.7. c =
(b) A calculator was used to calculate and plot the first 10 terms of the discrete logistic equation with 1.7 r = and 50 K = . Observe that both the discrete logistic model and the Beverton-Holt model from part (a) converge toward the carrying capacity. The BH model has populations either increase or decrease toward K while the logistic model has populations converge in an oscillatory fashion toward K .
Solution and Answer Guide: James Stewart / Troy Day, Biocalculus: Calculus, Probability, and Statistics for the Life Sciences, 2e, 2027, 9798214002576; Chapter 1: Functions and Sequences
CASE STUDY 1A KILL CURVES AND ANTIBIOTIC EFFECTIVENESS
1.
Solution:
When 0c has values 0.019,0.038,0.075,0.15,0.3,0.6,1.2 , the respective values of a are approximately 2.17,6.13,10.01,13.98,17.94,21.9,25.86 . These are the times at which the bacteria population changes from exponential decay to exponential growth. We plot ()Pt using the piecewise function (2a) when ( ) 00 0 ccMIC = and we use equation (2b) for all other values of ( ) 00 ccMIC . This gives the graph at right. The kill curves from the data and the model show an initial decrease in bacteria population and then an increase to a maximum value of 12 CFU/mL (when 0 0.013 c ) The larger the initial concentration 0c the longer it takes the population to reach its maximum value. When 0 0 c = the bacteria population increases immediately in both the model and data. The kill curves obtained from the data are more jagged and follow an irregular path up to the maximum value of 12 as compared to the model curves. The data kill curves also appear to reach a minimum value earlier than the model kill curves.
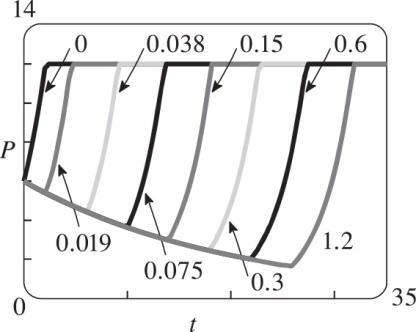
2. Solution:
The antibiotic concentration 0 () kt ctce = is an exponential decay function that has an initial value at ( ) 0 0 = cc and decreases as time passes. Thus, the peak antibiotic concentration is 0c . This gives max0 cc MICMIC == . The other measure must satisfy
3.
Solution and Answer Guide: James Stewart / Troy Day, Biocalculus: Calculus, Probability, and Statistics for the Life Sciences, 2e, 2027, 9798214002576; Chapter 1: Functions and Sequences
Solution:
4
Solution:
As seen in Problem 1 and Equation (2b), the bacteria population starts to rebound when ta = . So the drop in population size is
5
Observe from the population functions ( )Pt in equation (2a) and (2b) that ( ) 06 = P
When 0 0.013 c , there is no drop in the bacteria count since /3 6 te is an increasing function. Focusing on the other case 0 0.013 c , the piecewise function decreases in the interval ta . Thus, the measure T must satisfy ( ) ( ) ( ) /20/20 0.9060.960.920ln0.9 ====−
Solution:
in question 0.1751/0.013g/mL3
6.
8
Solution and Answer Guide: James Stewart / Troy Day, Biocalculus: Calculus, Probability, and Statistics for the Life Sciences, 2e, 2027, 9798214002576; Chapter 1: Functions and Sequences
Solution:
If the inverse function of ( ) 0 = hc exists, we can find it by solving the equation for 0c to give ( ) 1 0 = ch . Substituting this into ( ) 0 = gc gives the composite function ( ) ( ) ( )( ) 11 ghgh == . Thus, we write as a function of by first finding ( ) 1 h and then determining ( )( ) 1 gh = as follows:
9
Solution:
In Problem 5, we found that T is a constant function, that is, it is independent of 0c and hence, also independent of . So ( ) 20ln0.92.11 ==−Tf seconds.
Solution:
Solution:
In the bacteria population model ( )Pt in equation (2b), the population decreases at the same rate for all initial drug concentrations governed by /20 ()6 t Pte = when ta . Thus, the time taken to reach 90% of the initial population size ( ) T is the same for all initial drug concentrations ( ) 0c as seen in Figure 9. However, the duration of the population decline phase increases as the initial drug concentration increases because the concentration remains above the minimum inhibitory concentration ( )MIC for a longer period of time. So larger initial concentrations lead to longer time periods in the population decline phase that, in turn, lead to larger drops in population size before rebound ( ) as seen in Figure 8.