
2 minute read
Analyzing Public Health through College Reopening Decisions


1. Introduction
The transmission of COVID-19 in the United States has altered the college dynamic in 2020. Here, higher-ed institutions have had nuanced decisions on whether to transition to online mediums, such as Zoom Video Communications, or remain in-person during the fall.
Advertisement
In order to better comprehend different colleges’ decisions, states’ COVID-19 cases, annual GDP, and political party affiliation were analyzed to determine the significance of these factors’ contributions to college fall plans. Each factor is analyzed independently to see how it affects public decisions, such as reopening colleges. These correlations can help public health officials understand how regions respond to COVID-19 and utilize the information to adopt necessary health precautions.
2. Results & Discussion
The visual data for this study is located in Figures 1-3, where the three external factors are compared to approximately one-third of the United States. The data provides the slopes and r-squared data, which were calculated to determine the prominence and accuracy of this information. In Figure 1, “COVID-19 Cases Compared to States’ Decisions,” data is based from the CDC COVID Data Tracker on July 30, 2020 at 5:45 PM. Here, the top eight states and bottom eight states are numbered on a scale 0-15. This exemplifies a gradient to display states with higher rates of COVID-19 closer to 0, while states with lower rates are closer to 15. Additionally, each state is given a numerical status score that ranges from 1-5. The score is based on the College Crisis Initiative, where each college decision is given a number. To illustrate, “Fully Online” would constitute a 1, whereas “Fully in Person” would receive a 5. Numbers in between this range would be representative of other possible decisions—Primarily Online (2), Hybrid (3), and Primarily in Person (4). Schools that were listed as “TBD” or “Other” were not given a score. The top ten schools for determining each state’s score were chosen based on the 2020 Best National University Rankings in the U.S. News & World Report to make this assessment. This data was inputted on a scatter plot and lines of best fit were created to determine a slope and r-squared factor.
Figures 2-3 adhered to similar procedures. Figure 2 is based on the U.S. Bureau of Economic Analysis (BEA), displaying states with a higher GDP closer to 0 on the x-axis. Figure 3 is based on the Gallup 2017 U.S. Party Affiliation by State, which demonstrates the percentage of Republican or Democratic lean. States with a greater percentage of a Republican lean are closer to 0 on the x-axis, whereas Democratic leaning states are closer to 15. By utilizing updated sources, the information on the figures best displays an accurate portrayal of how the factors individually affect college fall decisions to reopen.
The study reveals that r-squared factors are low, and only Figure 3 is statistically significant. This indicates that no single social factor in isolation has a major impact in determining public health.
Nevertheless, primary constraints that this study had include the sample size of the data and the lack of qualitative elements, such as a region’s culture in determining public health decisions. A broader dataset and further analysis, including modeling the interactions between the three factors, would be helpful in determining the significance and strength of external components on public health.
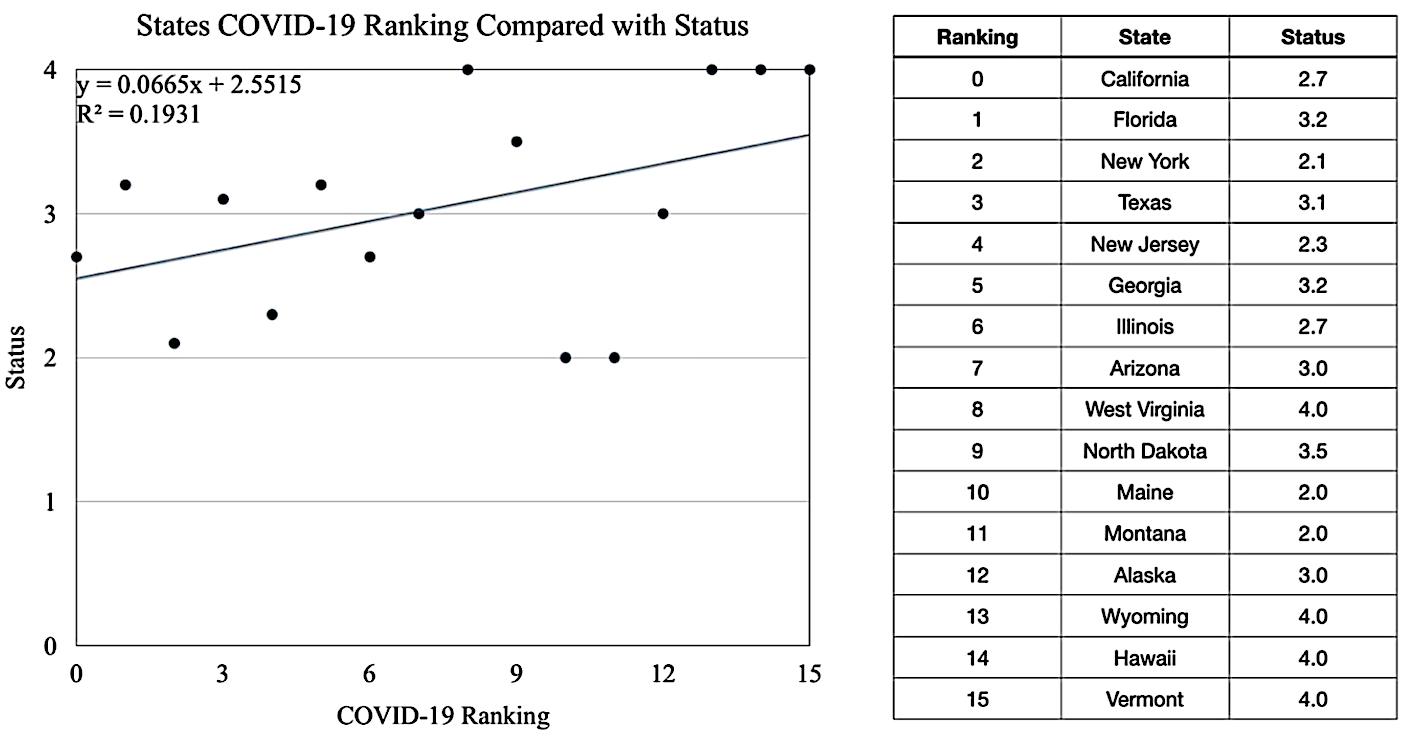
Figure 1. COVID-19 Ranking Compared with Status
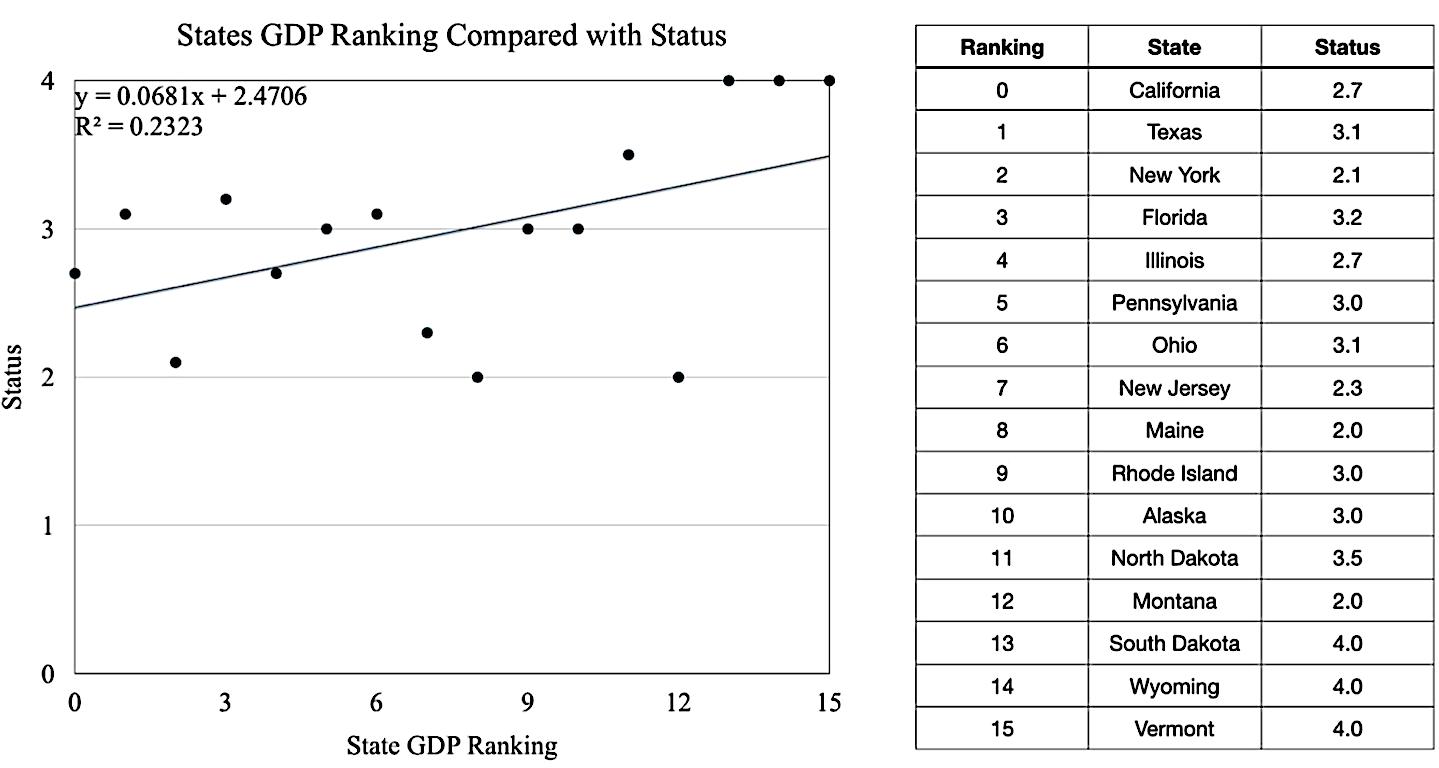
Figure 2. States' GDP Ranking Compared with Status
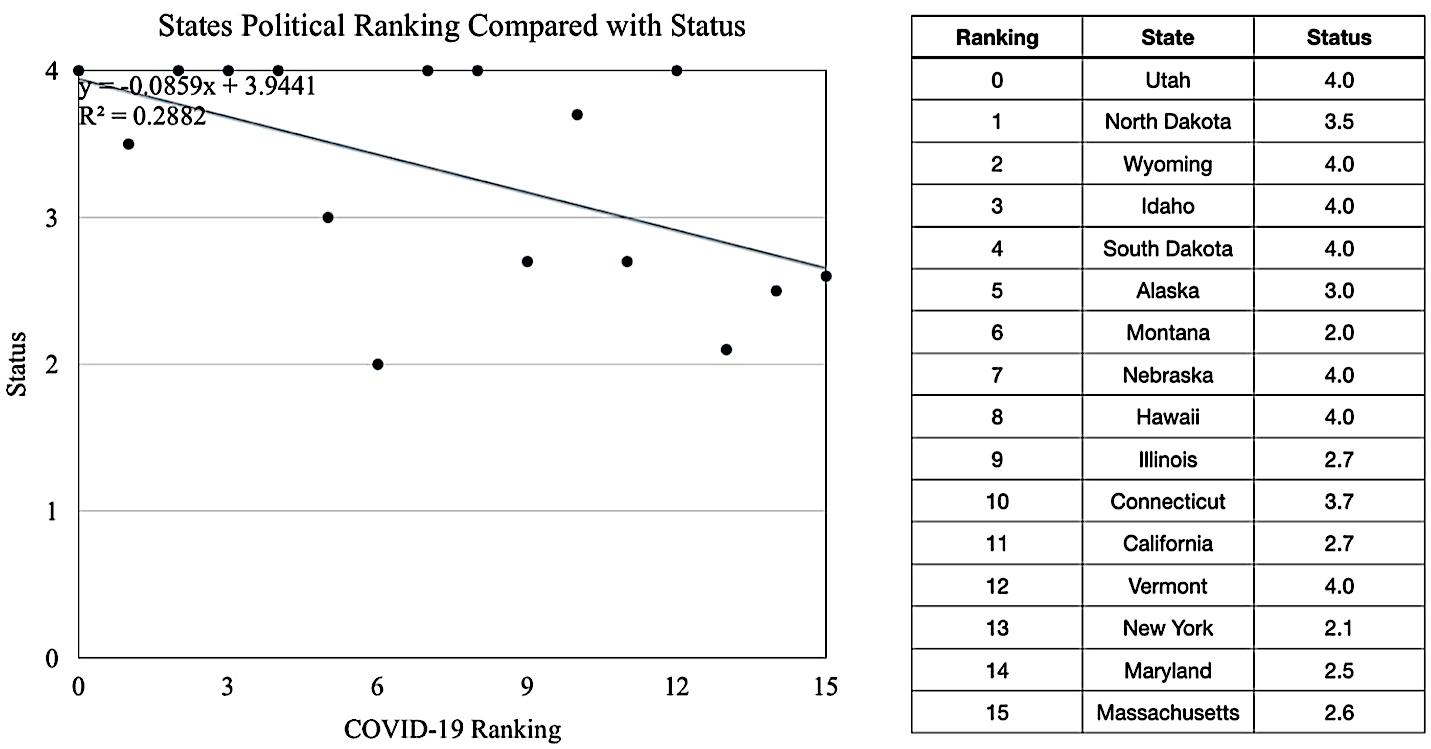
Figure 3. States' Political Ranking Compared with Status


