
15 minute read
Does New Apartment Construction Negatively Impact Single-family Home Values?


Scanrail©/ Adobe Stock
By Dejan Eskic Senior Research Fellow, Kem C. Gardner Policy Institute
Over the last decade, Utah has led the nation in the rate of population growth, resulting in a record demand for housing. While the housing oversupply of the 2000s was absorbed as the economy recovered from the recession in the early 2010s, supply in the new decade has struggled to keep up, leading to a housing shortage of 53,000 units in 2020. According to the National Association of Realtors®, the year-over median sales price of a home in the Salt Lake metropolitan area increased by 12.3% in the first quarter of 2020. The Salt Lake metropolitan area ranked 16th of 182 metropolitan areas surveyed for a year over price increase. Housing price increases were lower in 90% of the metropolitan areas surveyed.1 Additionally, land improvement costs, such as excavation and utility work, increased by approximately 40% between 2007 and 2017, and building costs grew 23% in the same period.2 Land prices have also soared with a limited supply across the Wasatch Front. The Wasatch Mountains to the east and the Oquirrh Mountains to the west limit the availability of developable land in Salt Lake County. The combination of soaring demand and supply
shortages continues to push the market to provide a more affordable housing product. This is typically done through density because the price of land is distributed across more units. Over the last decade, the market has shifted to denser development, with nearly 48% of all units being built as something other than single-family. As denser projects continue to appear on city council agendas, opposition to them has grown, manifested in a rising Nimby (not in my back yard) sentiment.3 Amongst the grievances aired by those opposing denser development is an expected negative impact on property values. The question, “Does new apartment construction negatively impact single-family home values?” is challenging to answer because the housing market, over the last decade, has experienced historic price accelerations—it is rare to find a home whose value has decreased. Rather, this study attempts to quantify how new apartment construction has impacted single-family home price acceleration. This study found apartments built between 2010 and 2018 have not reduced single-family home values. Compared by distance, single-family homes located within one-half mile of a newly constructed apartment building experienced higher overall price appreciation than those homes farther away. Measuring the median value of homes from the year the apartment was built to 2019 shows that homes located within onehalf mile of an apartment experienced a 10.0% average annual increase, while the value of those farther away increased by 8.6%. This implies an additional 1.4 percentage points in annual price appreciation for homes closer to new apartment buildings (see Table 1). Similar results are seen in most of the county, with the likely driver being that new apartment construction brings new demand and new dollars to a community and redevelops an older piece of property, thus bringing more vibrancy and “buzz” to the area.4
Literature Review
The academic literature leans towards showing multifamily, denser development having either no impact or a positive impact on single-family residential values. A study in King County, Washington, shows an increase in single-family home values for those located near denser development. The study also showed an increase
Source: Salt Lake County Assessor, Kem C. Gardner Policy Institute
in access to other land uses and parks, adding additional benefits.5
A study completed by the National Association of Homebuilders found that between 1997 and 1999, single-family values increased 2.9% for those homes within 300 feet of an apartment building, compared with an increase of 2.7% for those that weren’t located next to an apartment.6 Based on data from 1970 to 2000, a study published in 2003 by Harvard’s Joint Center for Housing Studies concluded that apartments posed no threat to surrounding single-family house values.7 A study from researchers at Virginia Tech University concluded that apartments with attractive design and landscaping increased the overall value of nearby detached housing, citing three possible reasons.8 These include, first, new construction serves as a potential indicator of positive economic growth; second, new apartments increase the pool of future homebuyers for current homeowners; and third, apartments with mixed-use development often increase the attractiveness of nearby communities as they provide more housing and amenity choices.9 An additional benefit is a decrease in traffic, not an increase as often thought. A study by the National Personal Transportation Survey found that doubling density decreases vehicle miles traveled by 38% since denser households typically own fewer vehicles.10
Methodology & Overview
The Salt Lake County Assessor’s market value data is used to measure new apartment construction effects on single-family homes. Two measures are used. First, the average annual rate of value change from the year the apartment was constructed to 2019 is used to measure the overall impact. Second, the year-over percent change of median market value is used to estimate annual fluctuations. Because of data availability, only apartments built between 2010 and 2018 are used to measure these impacts. Single-family homes are divided into two categories, homes that are less than or equal to one-half mile (≤1/2 mi.) from new

NMLS #654272

FEDERALLY INSURED BY NCUA. LOANS SUBJECT TO CREDIT APPROVAL. SEE CURRENT RATES AND TERMS.
FREE APPRAISAL
Looking for a home loan? Get Pre-Approved with a low rate at ucreditu.com
UFCU o ers up to $500 towards appraisal costs on new purchases or re nance loans when the purchase or re nance is completed with University Federal Credit Union. Appraisal costs up to $500 will be deducted from loan closing costs after the loan has funded; any amount exceeding that $500 credit is the responsibility of the lendee. This promotion cannot be combined with other o ers. Limit one appraisal credit per household. Promotion valid 04/21/2021 through 10/31/2021. Loans subject to credit approval. See current rates and terms.
Area 2010 2011 2012 2013 2014 2015 2016 2017 2018 2019*
Salt Lake County 1,008 693 292 647 794 1,250 1,027 1,038 1,005 1,887 Early Suburbs 256 100 40 307 211 210 288 378 293 300 Southeast 0 0 0 288 42 416 181 330 211 239 Southwest 496 315 252 0 258 334 270 330 238 1,048 West 256 278 0 112 283 290 288 0 263 300
*The data to measure impacts of apartments constructed in 2019 was unavailable at the time of this study. Source: Salt Lake County Assessor, Kem C. Gardner Policy Institute
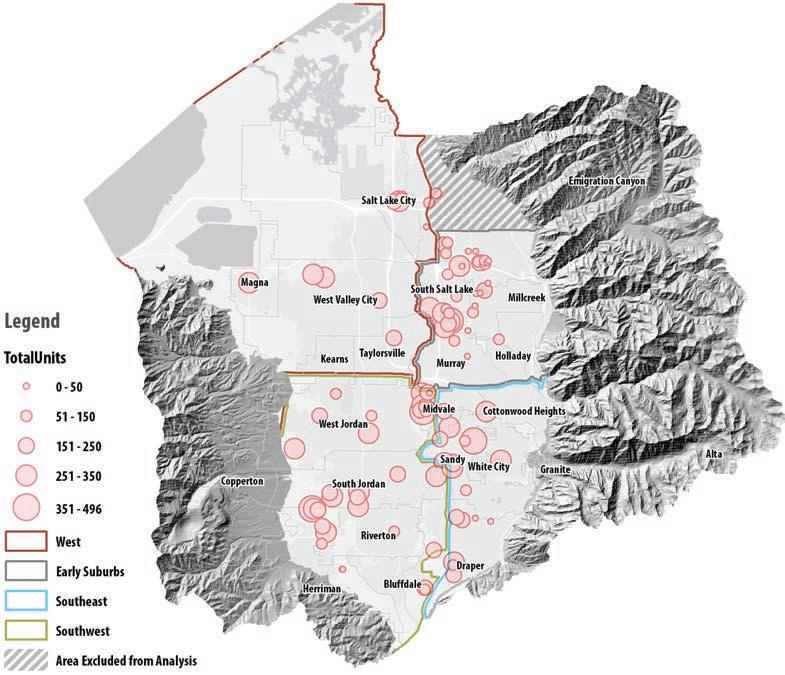
apartment construction, and those that are farther away (+1/2 mi.). Five geographies were covered in this study. Because of a range of development activity and multiple factors not present in the suburban parts of the county, the greater Salt Lake City downtown area is excluded from this study. The five geographies are based on Census tracts and consist of the following cities and townships: • Suburban Salt Lake County: consists of the four geographies mentioned below. • West: includes a part of Salt Lake City, Magna, West Valley City, Kearns, and Taylorsville. • Early Suburbs: includes a part of Salt Lake City, South Salt Lake, Millcreek, Murray, and Holladay. • Southeast: includes part of Midvale, Cottonwood Heights, Sandy, and part of Draper. • Southwest: includes Bluffdale, Harriman, Riverton, South Jordan, West Jordan, and part of Midvale and Draper. Apartment construction boomed in Salt Lake County during the last decade. Between 2010 and 2018, 7,754 units were completed. Another 1,887 units were delivered to the market in 2019 but are not included in this analysis as the data to measure their impacts are not yet available. By 2018, the county’s Southwest area accounted for 32.2% of total apartment units built since 2010, followed by the Early Suburbs area, accounting for 26.9%. The West area held 21.5% of new units built since 2010, and the Southeast area had the lowest share with 17.1% of units. In suburban Salt Lake County, 1,887 new apartment units completed construction and began leasing in 2019, a single-year record surpassing the 1,250 new units constructed in 2015 (see Table 2). In the Early Suburbs area, 2017 was a record year with 378 new units constructed. The Southeast area set its record in 2015, with 416 new units. The Southwest area holds the record for any single year, adding 1,048 new apartment units in 2019. The West area also reached its record in 2019 for single-year construction with the delivery of 300 units. Key physical characteristics distinguish singlefamily units based on their proximity to new apartment construction and impact their value. The size of a home is a major factor driving market value. In suburban Salt Lake County overall, homes located within one-half mile of new apartments are approximately 270 sq. ft., or 11.1%, smaller than those farther away. The size difference is even greater for those homes located in the Early Suburbs area; homes ≤1/2 mile of new apartments are 640 sq. ft., or 26.0%, smaller than those that aren’t. Homes located in the Southeast area are 438 sq. ft. smaller or 15.3%, while those located in the Southwest area are nearly identical, with a size difference of only 88 sq. ft., or 3.0%. The difference in size for homes in the West area is 142 sq. ft., or 7.4%. Home age is another factor influencing value, although remodeling and updates often negate this effect. Homes in suburban Salt Lake County that are located ≤1/2 mile of new apartments are seven years older on average than those located farther away. Homes located ≤1/2 mile in the Early Suburbs area are 14 years older than those that aren’t. Southeast area homes are the same age, while those in the Southwest area that are located ≤1/2 mile of new apartments are four years newer than those located farther. Homes in the West area average 19 years older, the largest age difference between homes that are ≤1/2 mile of new apartments and those that are farther away. Lot size is another key category that influences overall value. In suburban Salt Lake County, lot sizes average 0.02 acre smaller for homes located ≤1/2 mile of new apartments. For homes located in the Early Suburbs area, lots are 0.05 acre smaller for homes ≤1/2 mile from new apartments. Home lots in the Southeast, Southwest, and West areas are 0.02 acre smaller for those located ≤1/2 mile of apartments. (continued on page 18)
INCREASE BUYER POWER
WITH AN ARM
Table 1: Average Annual Change in Median Price, Year of Apartment Built to 2019
Area
+1/2 mi. ≤1/2 mi.
Salt Lake County 8.6% 10.0% Early Suburbs 7.6% 10.7% Southeast 7.3% 6.8% Southwest 7.7% 9.7% West 10.5% 13.7%
Note: See Figure 1 for area designations. Source: Salt Lake County Assessor, Kem C. Gardner Policy Institute
Results
The median market value of single-family homes is greater for those that are located more than one-half mile away from new apartments. Between 2010 and 2019, those that are farther than one-half mile averaged a 4.7% higher median value. Homes located in the Early Suburbs area have the greatest discrepancies in values when compared by distance, with the difference averaging 34.6%. This is because some of the most expensive and largest homes are in the areas of Sugar House and Holladay. The average difference in value for homes located in the Southeast area over the last decade is 12.3%. Homes in the Southwest area show the median value disparity lessening with time. Between 2010 and 2016 the difference by distance was 9.1%; however, the disparity narrowed to 3.5% between 2016 and 2019. This was driven by a 10.4% increase in median building square feet for homes within 1/2 mile of an apartment, leading to an overall increase in home values. The median value for homes in the West area has averaged 13.6% between 2010 and 2019. While the total median market value is greater for those single-family homes farther than 1/2 mile from new apartment construction, the opposite is true when measuring the median value per square foot (PSF). Between 2010 and 2019, homes that are located ≤1/2 mile averaged an 8.8% higher PSF median value compared with those farther away. Although the Early Suburbs area shows the highest discrepancy in total median market value, comparing values on a PSF basis shows there to be little to no difference between the two distances. PSF home values in the Southeast area averaged 5.3% higher for homes located ≤1/2 mile over the last decade. Similar to the trend seen in total median values, the PSF discrepancies in the Southwest favored homes that were farther away between 2013 and 2016, but shows no substantial difference since. The West area shows homes located ≤1/2 mile of

Image licensed by Ingram Image
a new apartment averaged 5.2% less in median value PSF over the decade when compared with homes farther away. The reason for this disparity is likely due to the homes’ age. Homes located ≤1/2 mile of new apartments in the West area average 19 years older than those farther away. In suburban Salt Lake County, from the year of construction to 2019, single-family homes located ≤1/2 mile of a new apartment experienced a 10.0% average annual increase in value, while the value of homes farther away increased 8.6% on average annually. Homes that were located more than 1/2 mile in 2010 and 2011 experienced a 1.9-percentagepoint larger decline in their value than those that were closer to a new apartment building, showing that apartment proximity had a positive impact overall on preserving value during the recession. From the year of construction to 2019, homes in the Early Suburbs area that are located ≤1/2 mile of a new apartment experienced a 10.7% average annual increase in value, while the value for homes farther away increased 7.6% annually on average. Year-over changes have shown some disparities over the last decade. Homes farther than 1/2 mile saw a more positive appreciation from 2012 to 2015, while homes located ≤1/2 mile outperformed those farther away between 2016 and 2019. The Southeast area is the only instance where homes that are more than one-half mile away from new apartment construction experienced higher average price appreciation than those located ≤1/2 mile. Homes farther away experienced an annual appreciation of 7.3% between year the apartment was constructed to 2019, and those located ≤1/2 mile saw their values increase 6.8% annually. The likely explanation for this discrepancy is that there is a
higher concentration of larger retail development near those homes that are located ≤1/2 mile of apartments than in any other study areas. In the other three study areas, homes located ≤1/2 mile of an apartment were near an average of 20% less retail space when compared with homes farther away. In the Southeast area, there is 84% more retail space near homes that are closer to new apartment construction compared with those farther away. Year-over annual trends stayed similar for both distance categories except for 2014 and 2017, when homes farther than 1/2 mile experienced slightly greater annual growth.


Conclusion
The public perception about high-density housing continues to be a point of conflict in growing communities across Utah and the country. While many stereotypes and generalizations about negative impacts are brought up in public settings, high density development does not actually appear to depress home values.11 From the year an apartment was constructed to 2019, in Salt Lake County, singlefamily homes that were located within one-half mile of new apartment construction realized 1.4% more in annual price appreciation than those single-family homes that were located farther away. This is likely because new apartment construction brings new demand and new dollars to a community and redevelops an older piece of property, thus bringing more vibrancy and “buzz” to the area. The challenges of housing affordability are not going away anytime soon. While density is a solution to alleviate costs, zoning is the mechanism that allows or denies it. Zoning regulations, more than any other local policies, govern the annual supply of single-family and multifamily housing. In recent years, the supply of housing has not met the demand, creating a housing shortage.12 This shortage has tremendous impacts on Utah’s future. The shortage has also excluded many from homeownership, added to substantial increases in doubling-up of households, delayed marriages, and discouraged young people from forming new households. Reprinted by permission of the Kem C. Gardner Policy Institute, Copyright © 2021.

Endnotes
1. National Association of Realtors®
2. https://gardner.utah.edu/wp-content/uploads/ May2018HousingReport.pdf 3. Haughey, R. “Higher Density Development Myths and Facts.” Urban Land Institute - ULI. Washington, D.C. 2005 4. Haughey, R. “Higher Density Development Myths and Facts.” Urban Land Institute - ULI. Washington, D.C. 2005 5. University of Washington. “Denser development is good for single-family home values.” ScienceDaily. www. sciencedaily.com/releases/2012/06/120626151109.htm 6. National Association of Home Builders, “Market Outlook: Confronting the Myths about Apartments with Facts” (Washington, D.C.: Author, 2001), p. 4. 7. Alexander Hoffman, The Vitality of America’s Working Communities (Cambridge, Massachusetts: Harvard University Joint Center for Housing Studies, 2003). 8. Arthur C. Nelson and Mitch Moody, “Price Effects of Apartments on Nearby Single-Family Detached Residential Homes,” Working Draft (Blacksburg, Virginia: Virginia Tech University, 2003). 9. Arthur C. Nelson, “Top Ten State and Local Strategies to Increase Affordable Housing Supply,” Housing Facts & Findings, vol. 5, no. 1. 10. Robert Dunphy and Kimberly Fisher, “Transportation, Congestion, and Density: New Insights,” Transportation Research Record, 1996.
11. https://furmancenter.org/files/media/Dont_Put_It_ Here.pdf
12. https://gardner.utah.edu/wp-content/uploads/BestPractices-Dec2020.pdf
Now Open in Salt Lake City!
Kelly Right is looking for exceptional, independent real estate agents to use our proprietary lead generation system.
• 100% COMMISSION from Day One
• Lowest Monthly & Transaction Fees • FREE Cutting Edge Technology Platform • Dynamic Lead Generation System • Exceptional Support Staff • E&O Insurance Included
Increase Your Business & Keep More Money!
222 S. Main St. Suite 500 1-844-535-5974 www.kellyright.com
join@kellyright.com
License # 11161430-CN00
Kelly Right Real Estate - The Right Way Home


