We’ve mastered “The Art” of closing. When you work with Cottonwood Title you can be confident you’ll leave a good impression on your clients. We’ve mastered the details and make signing paperwork feel like signing a work of art! The best real estate agents in Utah trust Cottonwood Title, you should too.
Realtor® Magazine is self-supporting. The advertisers in this magazine pay for all production and distribution costs. Help support this magazine by advertising. For advertising rates, please contact Mills Publishing at 801.467.9419. The paper used in Salt
Magazine comes from trees in managed timberlands. These
The Market Isn’t Coming to Save You
PRESIDENT
J. SCOTT COLEMERE Colemere Realty Assoc.
1ST VICE PRESIDENT
JANICE SMITH
CB Realty (Union Heights)
2ND VICE PRESIDENT
KIM FARBER Eleven11 Real Estate LLC
TREASURER
RUSS ORCHARD Century 21 Everest
PAST PRESIDENT
CLAIRE LARSON Woodside Homes of Utah LLC
MEMBERS
MORELZA BORATZUK RealtyPath (South Valley)
ERIC SANTISTEVAN Engel & Volkers (Holladay)
KRISTEL GOUGH
Summit Sotheby's (Draper)
LORI KHODADAD
CB Realty (Union Heights)
DONNA POZZUOLI BHHS UP (N. Salt Lake)
CARLYE WEBB
Summit Sotheby's INT (Draper)
BRYAN HURD Real Broker, LLC
TRISH NICHOLS
CB Realty (SL-Sugarhouse)
APPOINTED BOD
TONY KETTERLING Equity RE (Advantage)
LINDA MASCHER Realtypath LLC (Advisors)
PAST PAST PRESIDENT
DAWN STEVENS Real Broker, LLC
Advertising information may be obtained by calling (801) 467-9419 or by visiting www.millspub.com
Managing Editor Dave Anderton
Publisher Mills Publishing, Inc. www.millspub.com
President Dan Miller
Office Administrator Cynthia Bell Snow
Art Director Jackie Medina
Graphic Design
Ken Magleby Patrick Witmer Sales Staff Paula Bell Dan Miller
Salt Lake Board: (801) 542-8840 e-mail: dave@saltlakeboard.com Web Site: www.slrealtors.com
®
Permission will be granted in most cases, upon written request, to reprint or reproduce articles and photographs in this issue, provided proper credit is given to The Salt Lake REALTOR as well as to any writers and photographers whose names appear with the articles and photographs. While unsolicited original manuscripts and photographs related to the real estate profession are welcome, no payment is made for their use in the publication.
Views and opinions expressed in the editorial and advertising content of the The Salt Lake REALTOR are not necessarily endorsed by the Salt Lake Board of REALTORS . However, advertisers do make publication of this magazine possible, so consideration of products and services listed is greatly appreciated.
When markets tighten, a familiar narrative starts to creep in. Interest rates rise, buyers hesitate, and conversations slow. Before long, the industry begins asking a dangerous question: “When will the market come back?”
But professionals don’t wait for markets. They work within them.
The reality is simple: regardless of headlines, people still need to move. Life doesn’t pause for interest rates. Families grow, jobs change, and circumstances shift. Buyers still need homes, and sellers still have reasons to sell.
Our job isn’t to wait for easier conditions. It’s to uncover those reasons— and help people navigate them.
I was reminded of this during the 2008 financial crisis. Business wasn’t coming easily, so my partner and I made a decision. We got up at 5:00 a.m., week after week, and walked neighborhoods passing out flyers around one of our listings. It wasn’t glamorous or efficient, but it was work—and it kept us in motion.
Around that same time, we had a listing we’d invested heavily in. When it expired, it would have been easy to move on. Instead, the very next day, another agent requested a showing. That showing turned into a serious buyer, and we ultimately closed the deal.
That experience reinforced something I’ve come to believe deeply: effort compounds, even when results are delayed.
In shifting markets, professionalism matters more—not less. This is where agents separate themselves—not by waiting for conditions to improve, but by increasing conversations, strengthening relationships, and leaning into the work when it becomes uncomfortable.
Because this business has never been about simply facilitating transactions. It’s about solving problems—understanding motivation, navigating obstacles, and creating outcomes when the path isn’t obvious.
That doesn’t disappear in a tighter market. It becomes more valuable.
So instead of asking when things will get easier, a better question is this: How will we show up when they don’t?
The agents who build lasting careers aren’t the ones who wait for the market to change. They’re the ones who step up—and go to work regardless.
J. Scott Colemere President
OF REALTORS
Price Divide Shapes Wasatch Front Housing Market
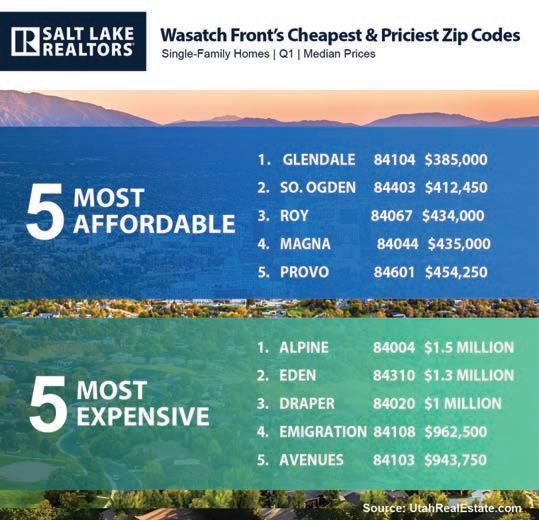
Salt Lake City’s Glendale neighborhood remained the most affordable area on the Wasatch Front in the first quarter, with a median home price of $385,000. At the other end of the spectrum, Alpine ranked as the most expensive, with a median price of $1.5 million. Across the Wasatch Front, the median price of a single-family home rose to $573,000 in the first quarter, up from $568,000 a year earlier, according to UtahRealEstate.com.
Homes also spent more time on the market, with a median of 47 days compared to 41 days during the same period last year. Sales activity increased as well, with 4,847 single-family homes sold in the first quarter—a 14% rise from the 4,251 homes sold a year earlier.
Salt Lake Realtors® Step Up with $240K for First-Time Homebuyers
The Salt Lake Board of Realtors® (SLBR) was featured in several local media outlets after announcing it will award $240,000 in down payment assistance to first-time homebuyers in 2026. The next four grant recipients will be announced May 20. Realtors® can apply on behalf of qualifying clients at slrealtors.com. Funding for the American Dream Grants comes from the Utah Association of Realtors® Housing Opportunity Fund, which is primarily supported by interest earned on trust accounts that hold earnest money deposits.
In the
Massive AI Data Center Planned for Utah
A massive data center development backed by investor Kevin O’Leary could reshape northern Utah into one of the nation’s largest artificial intelligence hubs.
O’Leary, known as “Mr. Wonderful” from “Shark Tank,” is part of a group planning a 40,000-acre data center campus in Box Elder County. The project, in partnership with WestGen and Utah’s Military Installation Development Authority, would be among the largest in the United States, according to The Wall Street Journal.
The site could require up to 9 gigawatts of electricity at full buildout—an amount that underscores surging demand for AI computing power. Developers plan to generate energy on-site using natural gas tied to an interstate pipeline, reducing pressure on the regional grid.
The first phase is expected to deliver roughly 3 gigawatts of capacity and cost tens of billions of dollars. Backers say the project aligns with broader efforts to expand U.S. technology infrastructure and remain competitive in the global race for artificial intelligence.
Utah officials estimate the development could generate about $108 million annually in tax revenue and create approximately 2,000 permanent jobs once operational.
The proposal still faces local approvals and could draw scrutiny over environmental impacts, water use and infrastructure demands.
If completed, the project is expected to boost demand for housing and commercial development in surrounding areas while supporting long-term job growth in technology, energy and construction—positioning Utah as a growing center for AI-driven investment.
Top Remodeling Projects for Homeowner Satisfaction
The remodeling projects with the highest satisfaction ratings included adding a primary bedroom suite, upgrading the kitchen, and installing new roofing.
By The National Association of Realtors®
Top remodeling projects for homeowner satisfaction and cost recovery continue to vary as individuals remodel their homes for diverse reasons, according to the National Association of Realtors® and National Association of the Remodeling Industry’s 2025 Remodeling Impact Report
The report assesses the reasons homeowners undertake remodeling projects, the outcomes of these projects and the increased happiness experienced in the home
once a project is completed. This year’s report features a significantly different structure compared to prior editions, with expanded sections about Realtors® and consumers.
Americans spent an estimated $603 billion on home remodeling projects in 2024.
According to the report, the remodeling projects that received the highest Joy Scores – a ranking from 1 to 10 based on the happiness homeowners reported
upon completion – include the addition of a primary bedroom suite (10), a kitchen upgrade (10) and new roofing (10). In contrast, the remodeling projects with the highest cost recovery – as estimated by members of NARI – include a new steel front door (100%), closet renovation (83%) and new fiberglass front door (80%).
“Homeowners undertake remodeling projects for numerous reasons, but what remains intriguing is the disparity between the joy experienced post-remodel and the actual cost recovery,” said Jessica Lautz, NAR deputy chief economist and vice president of research.
“While homeowners take pride in seeing their personal tastes and design choices come to life, Realtors® may recommend different strategies to enhance the property’s resale value.”
The top remodeling projects that Realtors® recommend sellers complete before listing their homes include
painting the entire home (50%), painting a single interior room (41%) and installing new roofing (37%). Additionally, the projects for which Realtors® have observed the highest increase in demand are a kitchen upgrade (48%), new roofing (43%) and a bathroom renovation (35%).
When consumers remodel their homes, the primary reasons include upgrading worn-out surfaces, finishes and materials (27%); improving energy efficiency (19%); desiring a change (18%) and preparing to sell within the next two years (18%).
“This report demonstrates that demand for remodeling remains robust, with 42% of NARI members experiencing an increase in contracting projects and 57% observing larger project scopes over the past two years,” said NARI President Jason Hensler. “Homeowners are discovering significant value and joy in these
investments – from smaller upgrades, such as front doors and windows, to major renovations like kitchens and primary suites.”
While housing affordability and rising mortgage rates have been considered potential motivators for home remodeling, most consumers (89%) reported that housing affordability was not a deciding factor in their decisions to remodel. However, for a smaller segment of consumers (9%), housing affordability did serve as a motivating factor for undertaking remodeling projects.
To finance their remodeling projects, consumers primarily relied on home equity loans or lines of credit (54%), savings (29%) and credit cards (10%).
“Interestingly, despite the lock-in effect – where lowinterest-rate mortgages discourage homeowners from moving – housing affordability isn’t a significant reason why consumers choose to remodel their homes,” added Lautz. “Instead, the substantial housing equity that homeowners have built up over time enables them to invest in transforming their homes while they remain in place.”
Homeowners report that the most important outcomes from remodeling projects are improved functionality and livability (28%); durable and long-lasting results, materials and appliances (23%); and enhanced beauty and aesthetics (23%). Following their remodeling projects, 64% of homeowners expressed a greater desire to be in their homes, while 46% reported increased enjoyment of their living spaces.
If cost were not a factor, 92% of consumers indicated they would choose to remodel additional areas of their homes.
About the National Association of Realtors®
As America’s largest trade association, the National Association of Realtors® is involved in all aspects of residential and commercial real estate. The term Realtor® is a registered collective membership mark that identifies a real estate professional who is a member of the National Association of Realtors® and subscribes to its strict Code of Ethics. For free consumer guides about navigating the homebuying and selling transaction processes – from written buyer agreements to negotiating compensation –visit facts.realtor.
HOA Fees Surpass $6K a Year for Millions of Homeowners
One in three current homeowners pays monthly homeowners association (HOA) or condo fees. In Salt Lake City, 22% of homeowners pay HOA fees.
By Kiri Blakeley
While homeowners know to budget in mortgage payments, there’s a not-so-hidden monthly cost that millions are paying, and that cost is increasing—often significantly—each year.
One in three current homeowners—or 17.5 million people—across the 100 largest metros pays monthly homeowners association (HOA) or condo fees, according to a new report from consumer finance site LendingTree, which analyzed the U.S. Census Bureau 2024 American Community Survey with one-year estimates data.
And at least 15% of those people—or 2.6 million— paid over $500 a month, adding up to $6,000 or more annually.
“When you’re paying $500 or more a month, that’s a really big deal, especially when you consider how tight many Americans’ budgets are,” said LendingTree’s chief consumer finance analyst, Matt Schulz.
“That’s money that can’t go to other financial priorities, such as building an emergency fund, paying down high-interest debt, or saving for retirement.”
About 1 in 5 (21%) homeowners surveyed by LendingTree lives in a community with an HOA, a number that jumps to 34% with those earning over $100,000 yearly.
HOA fees generally cover community maintenance such as trash and snow removal, care of lawns, and building and common area repairs. In some developments,
especially high-end ones, these common charges can cover amenities such as gyms, pools, or pickleball courts.
These fees are one of the most burdensome costs of being a homeowner. According to the site’s survey, 82% of respondents said their fees went up in the past three years, including almost half who said they went up “significantly.”
Who pays the most?
The metro that pays the most won’t shock anyone: New York City. Here, 53.4% of HOA-paying homeowners shell out $500 a month or more, with nearly 30% paying over $1,000 a month.
Following New York City, the metros with the highest share of homeowners paying $500 or more a month are: Honolulu, Miami, Cape Coral, FL, Bridgeport, CT, San Francisco, Boston, San Jose, CA, Los Angeles, and North Port, FL
It probably comes as no surprise that Florida takes up three of the top 10 spots.
“Many buildings are now reaching the age where deferred maintenance can no longer be postponed,”
Ana Bozovic, a Miami-based real estate agent and founder of real estate research firm Analytics Miami, told Realtor.com®. “The post-Surfside regulatory changes accelerated this reality by mandating structural inspections, reserve studies, and full funding of reserves.”
Bridgeport, CT, at No. 5, isn’t a pricey city, but the metro includes the affluent suburbs of Danbury and Stamford.
Do monthlies matter?
Given that 30-year mortgage rates still hover at 6.38%, home prices are softening but still at historic highs, and other costs such as homeowners insurance continue to climb, experts say HOA fees matter now more than ever.
“The average buyer considers monthly fees a lot, especially at the lower price points where buyers are more sensitive to their monthly outlay,” said Lisa K. Lippman of Brown Harris Stevens in New York.
Even average-cost New York City buildings can include costly features such as unionized door attendants and full-time superintendents, and amenities like fitness centers, gardens, and roof decks—all of which must be paid for.
Paradoxically, many of the newer, higher-end, amenityladen buildings can have lower fees than smaller, boutique buildings with few or no amenities, simply because the larger ones have many more residents to share costs.
Luxury New York City broker Frances Katzen, of Douglas Elliman, told Realtor.com that even high net worth individuals take monthly fees into account.
Katzen has “repeatedly” seen wealthy clients rethink deals once the full scope of the monthly outlay becomes apparent.
“Buyers are extraordinarily sensitive to monthly costs right now, arguably more than at any point in the last decade,” she said.
Are HOA fees worth it?
While HOAs often get a bad rap—with headlines about homes sold at auction over small unpaid fees or penalties for grass that’s a couple of inches too long— most HOA-paying owners aren’t complaining.
According to the survey, 86% of homeowners find the association rules reasonable, while a whopping 70% claim their fees are justified given the benefits they receive. Also, 43% said their HOA protects their property value and 36% call it a “necessary trade-off.”
It also pays to remember that common charges, especially in a city like New York, can include everything from heat and hot water to property taxes and building insurance.
“High HOA fees aren’t automatically a bad thing,” said Schulz. “The key is understanding what you’re getting in return. If the fees cover meaningful services, amenities, and long-term maintenance, they may be well worth it. “If not, then the place just may not be right for you.”
New York, NY
Percentage of homeowners paying more than $500 a month: 53.4%
Median HOA fee: $558
Honolulu, HI
Percentage of homeowners paying more than $500 a month: 52.4%
Median HOA fee: $526
Miami, FL
Percentage of homeowners paying more than $500 a month: 39.5%
Median HOA fee: $410
Cape Coral, FL
Percentage of homeowners paying more than $500 a month: 37%
Median HOA fee: $411
Bridgeport, CT
Percentage of homeowners paying more than $500 a month: 35%
Median HOA fee: $424
San Francisco, CA
Percentage of homeowners paying more than $500 a month: 31.8%
Median HOA fee: $349
Boston, MA
Percentage of homeowners paying more than $500 a month: 29.9%
Median HOA fee: $386
Los Angeles, CA
Percentage of homeowners paying more than $500 a month: 24.3%
Median HOA fee: $343
North Port, FL
Percentage of homeowners paying more than $500 a month: 23.1%
Median HOA fee: $275
Kiri Blakeley writes about trending news at Realtor.com. She has also worked at Forbes Magazine, Forbes.com, CafeMom, and DailyMail.com, covering everything from billionaires to celebrities to crime.
First-time buyers made up just 21% of all home buyers, the lowest share since NAR began collecting the data in 1981.
By
The National Association of Realtors®
Baby Boomers remained the largest generational group of home buyers this year, while the share of first-time buyers fell to the lowest level on record, according to the 2026 Home Buyers and Sellers Generational Trends report from the National Association of Realtors®.
The report examines the similarities and differences among recent home buyers and sellers across generations1. Among all home buyers in the past year, the generational breakdown was as follows:
• Gen Z: 4% (up from 3% last year)
• Millennials: 26% (down from 29% last year)
• Gen X: 25% (up from 24% in 2025)
• Baby Boomers: 42% (unchanged from last year)
• Silent Generation: 4% (unchanged from last year)
First-time buyers made up just 21% of all home buyers, down from 24% in the previous survey and the lowest share since NAR began collecting the data in 1981. Among buyers in each generation, the share who were first-time purchasers was:
• Younger Millennials: 60% (down from 71% last year)
• Older Millennials: 33% (down from 36% last year)
“The housing market remains sharply divided between homeowners with equity and first-time buyers trying to break in—many of whom are younger Millennials,” said NAR Deputy Chief Economist Dr. Jessica Lautz. “For many younger households, affordability challenges and limited inventory are still making homeownership difficult to achieve.”
Millennials continue to lose market share overall.
However, older Millennials are leveraging equity to become move-up buyers. These older Millennials had the highest median household income of any generation at $132,700, bought the largest homes with a median of 2,100 square feet, and were far less likely to be first-time buyers than younger Millennials.
“Older Millennial buyers are now entering middle age, and with that comes a shift,” Lautz said. “This cohort is now the highest-earning generation of home buyers, buys the largest homes and is most likely to have children living with them. Those traits were once more commonly associated with Gen X buyers, who are now increasingly looking toward empty-nesting and retirement.”
Multigenerational homes are declining in overall market share. Across all buyers, 14% purchased a multigenerational home (down from 17% last year), with top reasons including caring for aging parents, cost savings, and adult children moving back home. Among buyers in each generation, the share who purchased a multigenerational home was:
• Younger Millennials: 9% (up from 7% last year)
• Older Millennials: 14% (up from 12% last year)
• Gen X: 19% (down from 21% last year)
• Younger Boomers: 14% (down from 15% last year)
• Older Boomers: 11% (down from 13% last year)
• Silent Generation: 16% (down from 21% last year)
Among Gen Z home buyers, the youngest generation in the market, key findings include:
• 35% of Gen Z buyers were single females—the highest share among all generations
• 17% of Gen Z buyers were unmarried couples—the highest share among all generations
“What stands out about Gen Z is how confidently they’re beginning to define homeownership for themselves,” Lautz said. “They may still be a small share
of the market, but they’re already challenging old assumptions about who buys a home and when. For many of these buyers, marriage and children are no longer the defining milestones before a home purchase. The driving force is simply the desire to own a home of their own.”
On the selling side, Baby Boomers also remained dominant, making up 55% of all home sellers. Across all generations, sellers typically stayed in their homes for 11 years before selling, while Younger Millennials sold after five years and Older Boomers typically sold after 15 years.
“Baby Boomers are at a point in life when they have the flexibility to move, often with housing equity to help purchase their next home,” Lautz said. “In earlier years, Baby Boomers—like Millennials today—may have moved because of a job change or the need for a larger home. Today, many Baby Boomers are embracing choice and moving to be closer to friends and family, to downsize, or to retire and enjoy a work-free lifestyle.” Even as generational patterns differ across the market, buyers and sellers alike continue to rely heavily on real estate agents.
Eighty-eight percent of all buyers purchased their homes through an agent. Buyers continued to show strong confidence in their agents, with 91% saying they
would use their real estate agent again or recommend them to others. This was especially strong among Older Boomers (90%) and the Silent Generation (92%).
On the selling side, 91% of sellers worked with an agent, and homes typically sold for a median 99% of the final list price. Among sellers, Older Millennials were the most likely to use an agent at 92%. Younger Millennial sellers were among the strongest performers on price, with 19% selling for 101% to 110% of list price and 11% selling for more than 110% of list price.
Methodology
NAR mailed a 120-question survey to 173,250 recent home buyers in July 2025 using a random sample weighted to be representative of sales across geographic areas. Home buyers had to have purchased a primary residence between July 2024 and June 2025. The survey received 6,103 responses from primary residence buyers. After accounting for undeliverable questionnaires, the survey had an adjusted response rate of 3.5%. Data gathered in the report is based on primary residence home buyers. According to the Realtors® Confidence Index, 84% of home buyers purchased as primary residences in 2024, accounting for 4,746,000 homes sold that year (new and existing homes combined). Using that calculation, the sample at the 95% confidence level has a confidence interval of ±1.25%.
Photo: Image licensed by Ingram Image
These Mortgage ‘Myths’ May Be Holding Buyers Back Unnecessarily
When buyers think they need perfect credit or a huge downpayment, they can take themselves out of the game before they even get started.
By Kiri Blakeley
With the average rate on 30-year fixed home loans stuck around 6.30%, and median home prices near historic highs, homeownership remains out of reach for many— or does it?
Many would-be homebuyers are giving up on their homeownership dream due to discouraging “mortgage myths,” concludes a new survey by Veterans United Home Loans.
“[The myths] are undoubtedly keeping prospective homebuyers on the sidelines, especially first-time homebuyers,” Chris Birk, vice president of mortgage
insight at Veterans United, told Realtor.com®. “They think it will be a years’ long slog to make this dream a reality, so why should they even start?”
The survey, conducted from March 13 to March 24, crunched numbers from 400 veterans and civilians who intend to buy a home in the next three years.
Among the common myths prospective homebuyers often said they believed were the need for a larger down payment than is necessary in reality, or needing a perfect credit score to get a loan or favorable rates.
“When buyers think they need perfect credit or a huge downpayment, they can take themselves out of the game before they even get started,” he said.
As for why so many would-be buyers would not understand the realities of mortgages, Birk notes the lack of public discussion of these topics doesn’t help.
“I don’t think people are clamoring to hop on their social platforms and talk about the latest Fed decisions or the implications of the secondary market and mortgage-backed securities,” he joked.
The mortgage myths
Nearly half of would-be buyers (46%) think you need to put down more than 5% for a conventional loan, and 15% believe a 20% downpayment is required, according to the survey results.
In actuality, a mere 5% is a common minimum for conventional financing, and some first-time buyers may qualify for a conventional loan with as little as 3% down.
And—believe it or not—there are loans, such as Department of Veterans Affairs (VA) and USDA loans, that don’t require any downpayment at all. However, 31% of respondents were certain that a downpayment is required for a mortgage.
Granted, with a downpayment this low (or nonexistent), you may have a higher interest rate, or be required to pay Private Mortgage Insurance (PMI). But it pays (literally) to understand that lenders can be flexible with rates and credit scores.
While the average FICO credit score in the U.S. is 713, down from 715 in 2023, according to Experian, there is a strong sense that you need a near-perfect score (in the 800s) to get a mortgage—or lower rates.
According to the survey, more than one-third of respondents (34%) believe a credit score of 700 or higher is required to qualify for a mortgage, while 57% think at least a 650 score is necessary.
But Veterans United wants to bust that myth as well.
“Many loan programs allow buyers to qualify with credit scores around 620, and sometimes lower,” said the report.
Furthermore, your score doesn’t have to be sky high to get the best rate.
“Government-backed loans often offer some of the lowest average rates in the market, even for buyers without elite credit,” said the report, which notes that VA loans are commonly given to wthose with scores of around 620. And Federal Housing Administration (FHA) loans will go even lower—down to 580.
Then there are the misconceptions around who sets the rates for loans. A full 61% of respondents believe the government dictates rates and 66% of those surveyed think the Federal Reserve sets them.
And while the Fed sets short term rates that broadly effect loan rates, rates are actually set by individual lenders and can vary widely based on the borrower’s financial profile, the loan type and overall market conditions.
Not only did many not understand who is setting rates, but nearly two-thirds of respondents (63%) said they believed mortgage rates are higher than they’ve ever been.
In reality, while the 6%-7% rates of the past few years are double the historically low 2%-4% rates during the COVID-19 pandemic, the truth is that today’s rates are enviable compared those in the late 1970s through the early 1990s rates, when they reached an astronomical high of 18.6% on October 1981, according to Freddie Mac.
All of these myths are harmful because they could be keeping the cautious buyer sidelined just when prices have started to turn in their favor, said the report.
The national median list price in April 2026 is $425,000, down -1.4 % year over year, and the median list price
per square foot down 2.4%, the sixth-straight month that prices weakened, according to Realtor.com data
How buyers can do better
Doug House, an eXp Realty broker and strategic real estate advisor at Real Estate Bees said that, when it comes to mortgages, buyers have more power than they think.
“A lot of people assume the rate, fees, down payment structure, and terms are simply handed to them as the final answer,” he told Realtor.com.
He said his main advice to clients is to get a quote from more than one lender.
“Two lenders can look at the same borrower and come back with very different numbers, often because they have different products or different ways to structure the loan,” he said. “That difference may show up in the rate, lender fees, points, closing costs, mortgage insurance, or how much cash the buyer needs to bring to closing.”
He suggests rather than a borrower asking, “What is my rate?” instead asking, “What would change this rate?”
Additionally, borrowers may want to consider less cash down.
“Most borrowers don’t realize the rate on a 3 to 10 percent down loan is substantially the same as a 20 percent down loan under standard agency guidelines, and at times better,” Colette Evans-Hanya of mortgage
loan originator at Ritter Mortgage Group told Realtor. com. “The down payment is a cash decision, not a rate decision, especially now that mortgage insurance premiums are lower than they used to be for borrowers with good credit.”
But Bruce Ailion, a ReMax Town & Country broker and attorney, adds it may not always be savvy to negotiate just for the sake of it.
“You can get a loan from a mortgage broker with 30 years of experience that works hard to find you the best loan product at the best rate, and monitors the process to ensure it is smooth and worry-free,” he said.
“Or you may save some money by calling an 800 number, never speaking to the same person, and having little assistance if a problem arises.”
Despite the prevalence of these mortgage myths, and 1 in 4 Americans feeling they will never be able to afford a home, the survey also shows that people are still highly optimistic about homeownership.
An overwhelming majority of survey respondents (87%) said that owning a home is one of the most important goals in life.
Kiri Blakeley writes about trending news at Realtor.com. She has also worked at Forbes Magazine, Forbes.com, CafeMom, and DailyMail.com, covering everything from billionaires to celebrities to crime. Reprinted from Realtor. com, May 4, 2026.
Photo: Image licensed by Ingram Image
Home Prices Increased in 71% of Metro Areas in First Quarter of 2026
The median price of a single-family home increased to $576,500 in Salt Lake City, the 31st most expensive U.S. metropolitan area.
By The National Association of Realtors®
Home prices rose in 71% of metro markets (167 out of 235) during the first quarter of 2026, according to the National Association of Realtors®’ latest quarterly report. This is down from 73% in the fourth quarter. Seven percent of metro areas (16 out of 235) recorded double-digit price gains, up from 5% last quarter. The report provides the real estate ecosystem—including agents and homebuyers and sellers—with quarterly metro-area data on median home prices and housing affordability.
The national median single-family existing-home price rose 0.5% year-over-year to $404,300, down from 1.2% annual growth in the fourth quarter.
Median existing single-family home price by region (year-over-year change)
• Northeast: $506,500 (+4.9%)
• Midwest: $308,100 (+3.6%)
• South: $362,300 (+0.2%)
• West: $607,600 (-2.9%)
“Home prices continued to increase in many markets, boosting housing wealth for most homeowners,” said NAR Chief Economist Dr. Lawrence Yun. “Gains were particularly solid across metro areas in the Northeast, where inventory shortages persist, and in the Midwest, where home prices remain relatively affordable. However, the expensive West region did not see an increase in sales.”
“The condominium market, which weakened sharply last year, is showing signs of stabilization and, in some metro areas, even outperforming the single-family market in terms of price gains,” Yun said. “Improved affordability is drawing buyers back to the condo market.”
“Even though mortgage rates are higher than earlier this year, rates remain comfortably below last year’s levels,” Yun continued. “Lower mortgage rates will allow more potential buyers to qualify for and obtain a mortgage.”
9. Los Angeles-Long Beach-Glendale, Calif. ($858,500; -0.5%)
10. Naples-Immokalee-Marco Island, Fla. ($845,000; -2.3%)
Housing affordability
• 27% of markets experienced declining home prices
• Up from 25% last quarter
• Up from 17% last year
• $1,979: monthly mortgage payment on a typical existing single-family home with a 20% down payment
• $78 decrease from last quarter
• $140 decrease from last year
• 21.5%: average share of income that typical families spent on mortgage payments
• Down from 22.9% last quarter
• Down from 24.3% last year
First-time buyers
• $1,943: the monthly mortgage payment for a typical starter home valued at $343,700 with a 10% down payment
• $76 decrease from last quarter
• $135 decrease from last year
• 32.5%: share of income first-time buyers spent on monthly mortgage payments
Photo: Image licensed by Ingram Image
• Down from 34.6% last quarter
• Down from 36.6% last year
About the National Association of Realtors®
The National Association of Realtors® is involved in all aspects of residential and commercial real estate. The term Realtor® is a registered collective membership mark that identifies a real estate professional who is a member of the National Association of Realtors® and subscribes to its strict Code of Ethics.
NOTE: NAR releases quarterly median single-family price data for approximately 230 Metropolitan Statistical Areas (MSAs). In some cases, the MSA prices may not coincide with data released by state and local Realtor® associations. Any discrepancy may be due to differences in geographic coverage, product mix, and timing. In the event of discrepancies, Realtors® are advised that for business purposes, local data from their association may be more relevant.
1Areas are generally metropolitan statistical areas as defined by the U.S. Office of Management and Budget. NAR adheres to the OMB definitions, although in some areas an exact match is not possible from the available data. A list of counties included in MSA definitions is available at: https://www.census.gov/geographies/ reference-files/time-series/demo/metro-micro/ delineation-files.html
Regional median home prices are from a separate sampling that includes rural areas and portions of some smaller metros that are not included in this report; the regional percentage changes do not necessarily parallel changes in the larger metro areas. The only valid comparisons for median prices are with the same period a year earlier due to seasonality in buying patterns. Quarter-to-quarter comparisons do not compensate for seasonal changes, especially for the timing of family buying patterns.
Median price measurement reflects the types of homes that are selling during the quarter and can be skewed at times by changes in the sales mix. For example, changes in the level of distressed sales, which are heavily discounted, can vary notably in given markets and may affect percentage comparisons. Annual price measures generally smooth out any quarterly swings.
NAR began tracking of metropolitan area median single-family home prices in 1979; the metro area condo price series dates back to 1989. The seasonally adjusted annual rate for a particular quarter represents what the total number of actual sales for a year would be if the relative sales pace for that quarter was maintained for four consecutive quarters. Total home sales include single-family, townhomes, condominiums and co-operative housing.
March 2026 Housing Watch
Salt Lake County Housing Market Gains Momentum as Listings and Sales Rise
After a slower start to the year, Salt Lake County’s housing market picked up momentum in March as more listings and renewed buyer activity pushed sales higher.
Home sales (all housing types) saw an upswing in March, with 1,086 units sold in Salt Lake County, up 10% compared to 986 sales in March 2025, according to UtahRealEstate.com.
In the first three months of 2026, there were 2,600 homes sold in Salt Lake County, up 4% compared to 2,510 homes sold in the first quarter of 2025.
New listings hitting the market increased to 1,668 in March, up 8% compared to 1,550 new listings a year earlier in the same month. Under contract listings also rose, up 8%, while active listings in Salt Lake County increased to 2,629, up 10% from 2,384 listings a year earlier.
The increase in sales is largely being driven by improved inventory levels, giving buyers more options after a constrained market in recent years. More homeowners are listing as they adjust to current mortgage rates, while steady population growth and pent-up buyer demand continue to support activity. Additionally, a modest easing in mortgage rates compared to last year and greater price stability are helping to bring both buyers and sellers back into the market, resulting in more transactions overall.
The overall median price of a home (all housing types) sold in Salt Lake County rose to $544,590, up 5% from March 2025. Single-family home prices reached $610,000, up 1% compared to $603,165 a year ago, while multi-family homes declined 3% to $428,373 from $440,000 last year.
Nationally, the National Association of Realtors® reported a 1% decrease in home sales year over year in March. The median time on market was 41 days, down from 47 days in February but up from 36 days in March 2025. The average 30-year fixed mortgage rate was 6.18% in March, according to Freddie Mac, up from 6.05% in February but down from 6.65% a year ago.
“Because inventory remains limited, the median home price rose to a new record high for the month of March,” said NAR Chief Economist Dr. Lawrence Yun. “That price growth has helped the typical homeowner accumulate $128,100 in housing wealth over the past six years.”
“Price growth has helped the typical homeowner accumulate $128,100 in housing wealth over the past six years.”
Lawrence Yun
Chief Economist National Association of Realtors®
Salt Lake County
Local Market Update for March 2026
Source:
Pamela Abbott
Judy Allen
Suzanne Allred
George Anastasopoulos
Brent Anderson
Clay Anderson
Diane Anderson
Sue Avalos
Margaret Averett
Laurence Bailess
Les Bailey
Blair Bangerter
Brent Barnum
Veda Barrie-Weatherbee
Steven Barton
Edward Belka
Ken Bell
Raymond Bennett
Richard C. Bennion
Gregg Bohling
Russell Booth
Virginia Bostrom
Robert Bowles
Mary Ann Brady
Stephen Bryant
Stephen Bullock
Barbara Burt
Hedy Calabrese
Susan Calderon
Gary Cannon
Tracey Cannon
Julie Carli
Carol Cetraro
Scott Chapman
Garn Christensen
Byron Christiansen
Scott Claffey
David Clark
Deborah Clark
John Collins
Terry Cononelos
Jeffery Cook
Philip Craig
Kaye Cundick
Butch Dailey
Jaren Davis
Robert Davis
Brian De Haan
Babs De Lay
Lynn Despain
Jerard Dinkelman
Sally Domichel
Rebecca Duberow
James Dunn
Carol Edgmon
Douglas Edmunds
Michael Evertsen
Bijan Fakhrieh
Robert Farnsworth
Jack Fisher
Gale Frandsen
David Frederickson
Howard Freiss
Martin Gale
Brent Gardner
Heidi Gardner
Paul Gardner
Arthur Gayler
Linda Geer
Sheila Gelman
J. Carolyn Gezon
Anna Grace Sperry
Richard Grow
Klair Gunn
James Haines
John Hamilton
Mark Handy
Grant Harrison
Michael Hatch
Thomas Haycock
Jeanne Hayes
Bill Heiner
Jeffrey Helotes
Marvin Hendrickson
Terry Hill-Black
Lynda Hobson
Sheryl Holmes
Carol Howell
Gary Huntsman
Blake Ingram
Kent Ingram
Esther Israelson
Kevin Jensen
Ron Jenson
Jeffrey Jonas
Steven Judd
David Kenney
Henry Kesler
Douglas Knight
Peggy Knight
Randall Krantz
Leah Krueger
Gary Larson
Teresa Larson
Vann Larson
Fred Law
Michael Lawrence
Shauna Leake
Kaye LeCheminant
Daniel Lindberg
Michael Lindsay
Mildred Llewelyn
Daniel Lofgren
Don Louie
Ted Makris
Margaret Malherbe
Anthony Manning
Al Mansell
David Mansell
Dennis Marchant
Susan Mark-Lunde
Paul Markosian
Ronnald Marshall
Susie Martindale
Christopher McCandless
Curtis McDougal
Miriam McFadden
John McGee
Russell McKague
Andrew McNeil
Elizabeth Memmott
Uwe Michel
Gordon Milar
Kyle Miller
Preston Miller
David Moench
Gary Monk
H. Craig Moody
Randall Moore
Thomas Morgan
Klew Mori
Charles Mulford
Melanie Mumford
Jacqueline Nicholl
John Nielson
Robyn Nielson
Victor Oishi
Joseph Olschewski
Brent Parsons
Joan Pate
Derk Pehrson
Douglas Pell
Scott Pexton
Robert Plumb
David Read
George Richards
W. Kalmar Robbins
Emilie Rogan
Marie Rosol
Christopher Ross
Shelley Rozema
David Sampson
Mark Schneggenburger
David Seiler
Gary Shiner
Michael Shipler
Jeff Sidwell
Kent Singleton
Debra Sjoblom
Elizabeth Smith
Glen Smith
Kenneth Smith
Rick Smith
Skip Smith
Lorenzo Spencer
Kenneth Sperling
Robert Spicer
Trudi Stark
Lee Stern
Sandra Straley
Gary Strang
John Strasser
Kevin Strong
Thomas Swallow
Sonny Tangaro
Joan Taylor
Rosanne Terry
Martin Vander Veur
Craig Vierig
H. Blaine Walker
Hilea Walker
Dana Walton
Jerry Webber
William Wegener
David Weissman
Jeffrey Wells
Jeff White
Clayton Wilkinson
Thomas Wilkinson
Kimball Willey
Robert Wiskirchen
James Witherspoon
Linda Wolcott
Cynthia Wood
Margene Wrigley
SOME VEHICLES ARRIVE. OTHERS TAKE THE LEAD.
The BMW X5 is crafted for those who move with intention—balancing confident design, dynamic capability, and intelligent innovation. With available xDrive all-wheel drive and a driver-focused interior, it adapts seamlessly to every road and every moment.
Because when presence meets performance, it doesn’t go unnoticed.
Experience the performance worthy X5 at BMW of Murray or BMW of Pleasant Grove.
BMW of Murray
4735 S. State Street
Murray, Utah
801-262-2479
bmwofmurray.com
BMW of Pleasant Grove 2111 West Grove Parkway Pleasant Grove, Utah