
4 minute read
Housing Watch


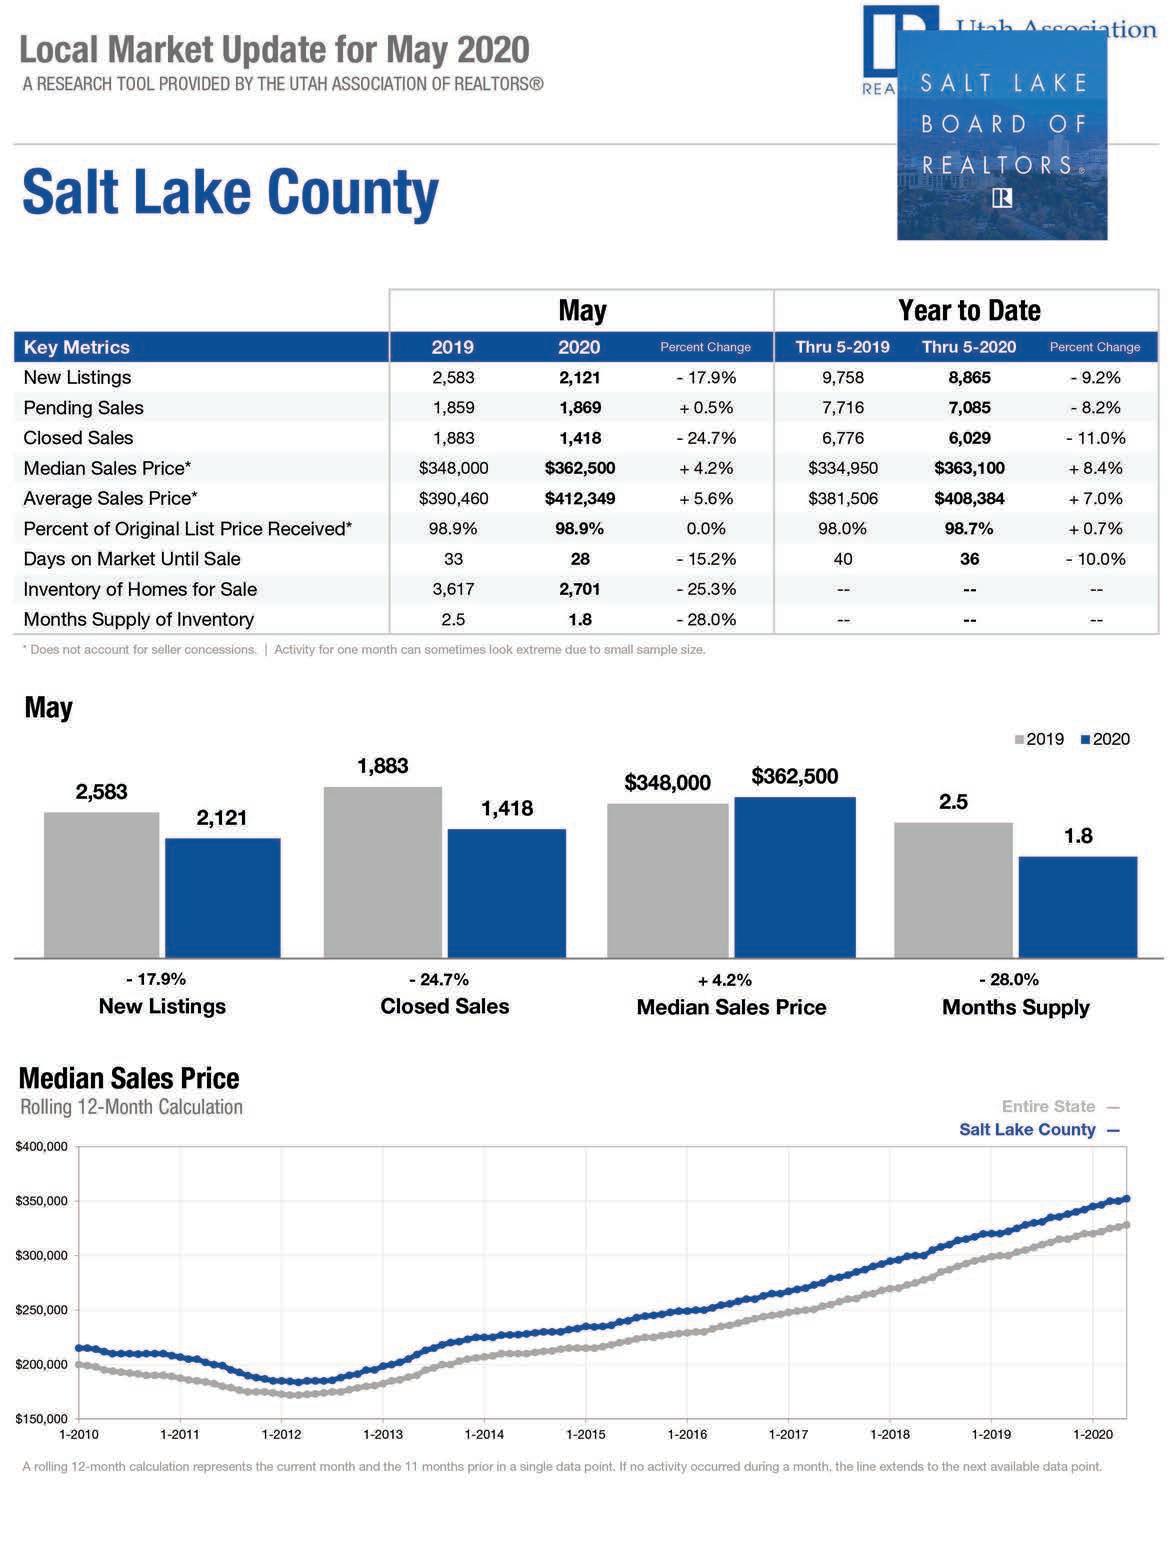
MAY HOUSING WATCH
Home Sales in May Reflect Cyclical Low Point
Home sales were down a third consecutive month in
Home sales will surely rise in the Salt Lake County year over year due to the Covid-19 economic quarantines and business shutdowns. In upcoming months with the economy May, there were 1,418 sales (all housing types) in reopening, and could even surpass oneSalt Lake County, a 25 percent drop compared to sales in May 2019. In April, home sales fell 27 percent year-ago figures in the second half of (revised). In March, sales fell 1 percent. the year.” Lawrence Yun, NAR chief In neighboring Davis County, home sales declined 13 percent in May year over year. economist. Utah’s economy is expected to recover in the second half of 2020, with rising demand for homes, according to James Wood, economist and the Ivory-Boyer Senior Fellow at the University of Utah’s Kem C. Gardner Policy Institute. Nationally, existing-home sales fell in May, marking a three-month decline in sales, according to the National Association of Realtors ® . Overall, U.S. home sales were down 27 percent from a year ago (5.33 million in May 2019). “Sales completed in May reflect contract signings in March and April – during the strictest times of the pandemic lockdown and hence the cyclical low point,” said Lawrence Yun, NAR’s chief economist. “Home sales will surely rise in the upcoming months with the economy reopening, and could even surpass one-year-ago figures in the second half of the year.” The median price of homes sold in May in Salt Lake County increased to $362,500, up 4 percent from May 2019. The U.S. median existing-home price for all housing types in May was $284,600, up 2 percent from May 2019 ($278,200), as prices increased in every region. May’s national price increase marks 99 straight months of year-over-year gains. “New home construction needs to robustly ramp up in order to meet rising housing demand,” Yun said. “Otherwise, home prices will rise too fast and hinder first-time buyers, even at a time of recor d-low mortgage rates.” Properties typically remained on the market for 26 days in May, seasonally down from 27 days in April, but equal to 26 days in May 2019. Fifty-eight percent of homes sold in May 2020 were on the market for less than a month. Across the country, first-time buyers were responsible for 34 percent of sales in May, down from 36 percent in April 2020 and up from 32 percent in May 2019. Individual investors or second-home buyers, who account for many cash sales, purchased 14 percent of homes in May, up from 10 percent in April 2020 and from 13 percent in May 2019. All-cash sales accounted for 17 percent of transactions in May, up from 15 percent in April 2020 and down from 19 percent in May 2019. Distressed sales – foreclosures and short sales – represented 3 percent of sales in May, about even with April but up from 2 percent in May 2019.


Pending Homes Sales (continued from page 34) inventory choices,” Yun said. “Still, more home construction is needed to counter the persistent underproduction of homes over the past decade.” According to data from realtor.com ® , among the largest metro areas, active listings were up by more than 10 percent in May compared to April in several metro areas, including urban Honolulu, Hawaii; San Francisco, Calif.; San Jose, Calif.; Denver, Colo.; and Colorado Springs, Colo. “The outlook has significantly improved, as new home sales are expected to be higher this year than last, and annual existing-home sales are now projected to be down by less than 10 percent – even after missing the spring buying season due to the pandemic lockdown,” Yun said. NAR now expects existing-home sales to reach 4.93 million units in 2020 and new home sales to hit 690,000. “All figures light up in 2021 with positive GDP, employment, housing starts and home sales.” Yun noted that in 2021, sales are forecast to rise to 5.35 million units for existing homes and 800,000 for new homes.
May Pending Home Sales Regional Breakdown
The month of May saw each of the four regional indices rise on a month-over-month
Image licensed by Ingram Image

basis after all were down in April 2020. The Northeast PHSI grew 44.4 percent to 61.5 in May, although it was still down 33.2 percent from a year ago. In the Midwest, the index rose 37.2 percent to 98.8 last month, down 1.4 percent from May 2019. Pending home sales in the South increased 43.3 percent to an index of 125.5 in May, up 1.9 percent from May 2019. The index in the West jumped 56.2 percent in May to 89.2, down 2.5 percent from a year ago.
The National Association of Realtors ® is America’s largest trade association, representing more than 1.4 million members involved in all aspects of the residential and commercial real estate industries. The Pending Home Sales Index is a leading indicator for the housing sector, based on pending sales of existing homes. A sale is listed as pending when the contract has been signed but the transaction has not closed, though the sale usually is finalized within one or two months of signing. The index is based on a large national sample, typically representing about 20 percent of transactions for existing-home sales. In developing the model for the index, it was demonstrated that the level of monthly sales contract activity parallels the level of closed existing-home sales in the following two months.


