6 minute read
Chapter 2 Test A—Multiple Choice

Section 2.1 (Visualizing Variation in Numerical Data)
1. [Objective: Interpret visual displays of numerical data] Each day for twenty days a record store owner counts the number of customers who purchase an album by a certain artist. The data and a dotplot of the data are shown below: a. On the first day of collecting data the record store owner had one person purchase an album by the artist. b. The dotplot shows that this data has a roughly bell-shaped distribution. c. During the twenty days when the record store owner collected data, there were some days when no one purchased an album by the artist. d. None of the above
Advertisement
Which of the following statements can be made using the given information?
A fitness instructor measured the heart rates of the participants in a yoga class at the conclusion of the class. The data is summarized in the histogram below. There were fifteen people who participated in the class between the ages of 25 and 45. Use the histogram to answer questions (2) and (3).
90110100120140130150160
Beats per minute (bpm) a. 2 b. 4 c. 3 d. 5 a. 13% b. 27% c. 33% d. 53% a. 450, 450, 451, 455, 462, 462, 463, 478, 479, 479 b. c. d. b. d. Not enough information available
2. [Objective: Interpret visual displays of numerical data] How many participants had a heart rate between 120 and 130 bpm?
3. [Objective: Interpret visual displays of numerical data] What percentage of the participants had a heart rate greater than 130 bpm?
Copyright © 2013 Pearson Education, Inc.
4. [Objective: Interpret visual displays of numerical data] Find the original data set from the stemplot given below.
5. [Objective: Interpret visual displays of numerical data] A collection of twenty college students was asked how much cash they currently had in their possession. The data is summarized in the stemplot below. Typically, how much money does a student have in his or her possession?
Copyright © 2013 Pearson Education, Inc.
Section 2.2 (Summarizing Important Features of a Numerical Distribution)
Match one of the following histograms with one of the descriptions in questions (6) – (8): a. The distribution is symmetrical. The number of callers who waited on hold for less than three minutes was the same as the number of callers who waited on hold for more than three minutes. b. The distribution is left-skewed and most callers waited on hold at least three minutes. c. The distribution shows that the data was highly variable with some callers waiting on hold as many as 20 minutes. d. The distribution is right-skewed and most callers waited on hold less than three minutes. a. Yes, it would be unusual. b. No, it would not be unusual. c. Not enough information given. a. The distribution has a large amount of variation which can be seen by comparing the heights of the bars in the histogram. b. The distribution is right-skewed and shows that most of the pitches were more than 90 mph. c. The distribution is left-skewed and shows that most of the pitches were less than 95 mph. d. The distribution is symmetric around a pitch speed of about 93 mph.
6. [Objective: Recognize the shape of a distribution] The distribution of heights of adult males tends to be symmetrical which is displayed in histogram ________.
7. [Objective: Recognize the shape of a distribution] The distribution of the numbers of times individuals in the 18-24 age group log onto a social networking website during the course of a day tends to be rightskewed which is displayed in histogram ________.
8. [Objective: Recognize the shape of a distribution] The distribution of test scores for a group of adults on a written driving exam following a refresher course tends to be left-skewed which is displayed in histogram ________.
9. [Objective: Recognize the center of a distribution] The histogram below shows the distribution of pass rates on a swimming test of all children who completed a four week summer swim course at the local YMCA. What is the typical pass rate for the swim test?
Copyright © 2013 Pearson Education, Inc.
10. [Objective: Recognize the important features of a numerical distribution] The histogram below displays the distribution of the length of time on hold, for a collection of customers, calling a repair call center. Use the histogram to select the true statement.
11. [Objective: Recognize the important features of a numerical distribution] Based on the histogram in question (10), would it be unusual to be on hold for 5 minutes or more at this call center?
12. [Objective: Recognize the important features of a numerical distribution] The histogram shows the distribution of pitch speeds for a sample of 75 pitches for a college pitcher during one season. Which of the following statements best describes the distribution of the histogram below?
Copyright © 2013 Pearson Education, Inc.
13. [Objective: Recognize the important features of a numerical distribution] The histogram below is the distribution of heights for a randomly selected Boy Scout troupe. Choose the statement that is true based on information from the histogram a. The gap between the two smallest values indicates an outlier may be present. b. The smallest value is so extreme that it is possible that a mistake was made in recording the data. c. Although the smallest value does not fit the pattern, it should not be altogether disregarded. It is possible that the Boy Scout is 2.4 feet tall. d. All of the above are true statements
Section 2.3 (Visualizing Variation in Categorical Variables)
14. [Objective: Interpret visual displays of categorical data] A group of junior high athletes was asked what team sport was their favorite. The data are summarized in the table below. On the pie chart, which area would correspond to the category “Soccer”?
12
20
20 a. It sometimes doesn’t matter in which order you place the bars representing different categories. b. It is appropriate to have gaps between the bars on the graph. c. On a bar graph, the width of the bars has no meaning. d. All of the above are true for bar graphs.
15. [Objective: Recognize the important features of a categorical bar graph] Which of the following statements about bar graphs is true?
Copyright © 2013 Pearson Education, Inc.
Section 2.4 (Summarizing Categorical Distributions)
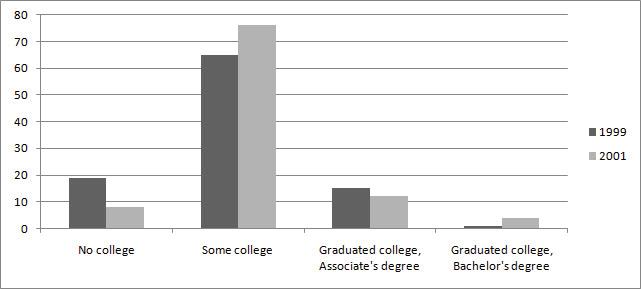
The following side-by-side bar graph shows the level of post-secondary education achieved ten years after high school for graduates from the years 1999 and 2001. Use the bar graph to answer questions (16) and (17).
16. [Objective: Recognize the important features of a categorical bar graph] What was the most common response for 1999?
a. No College b. Some College c. Graduated College, Associate’s Degree d. Graduated College, Bachelor’s Degree a. Bar graph b. Histogram c. Stemplot d. None of the above a. The graph is useless because it is bimodal. b. The best estimate of typical grip strength is 80-90 pounds because it is in the center of the distribution. c. There must have been a mistake made in data collection because the distribution should be bellshaped. d. The graph shows evidence that two different groups may have been combined into one collection.
17. [Objective: Summarize categorical distributions] All of the juniors and seniors at a college are asked their major. Which of the following graph types would be appropriate for displaying the variability in majors for this data set?
Copyright © 2013 Pearson Education, Inc.
18. [Objective: Recognize the important features of a numerical distribution] Data was collected on hand grip strength of adults. The histogram below summarizes the data. Which statement is true about the distribution of the data shown in the graph?
Section 2.5 (Interpreting Graphs)
19. [Objective: Analyze statistical graphs] The graph below displays the number of applications for a concealed weapons permit in Montcalm County, Michigan, for each of three years. A reported interprets this graph to mean that applications in 2010 are more than twice the level in 2008. Is the reported making a correct interpretation?
a. No. Although the 2010 bar is more than twice the height of the 2008, the bars do not begin at 0 applications, so the graph does not correctly represent the data. Fifty-five is not equal to two times the number of applications made in 2008.
b. No. The width of the bars is identical, indicating that the number of applications in 2010 is no different from 2008.
c. Yes. The bar for 2010 is twice the height of the bar for 2008 and the number of applications indicated above the bars shows that applications in 2010 are more than twice the level in 2008.
Copyright © 2013 Pearson Education, Inc.
20. [Objective: Analyze statistical graphs] The following graphic was used to visually summarize the following statement made by Supertuf Bicycle Tire Company in a recent magazine advertisement: “Our patented Supertuf bicyle tire design lasts twice as long as the leading competitor’s tire design.” Does the graphic correctly represent the statement made in the advertisement?
SupertufBicycle Tires Last Twice as Long!
a. Yes, the area of the first tire is twice the area of the second tire.
b. No, although the dimensions have doubled, the area of the first tire is more than twice the area of the second tire so the graphic incorrectly represents what is stated in the advertisement.
c. Not enough information available to make a judgment. More information is need about how long Supertuf tires last and how long the leading competitor’s tires last.
Copyright © 2013 Pearson Education, Inc.
